Receptive field center-surround interactions mediate context-dependent spatial contrast encoding in the retina
- University of Washington, United States
- Northwestern University, United States
Figures
Figure 1
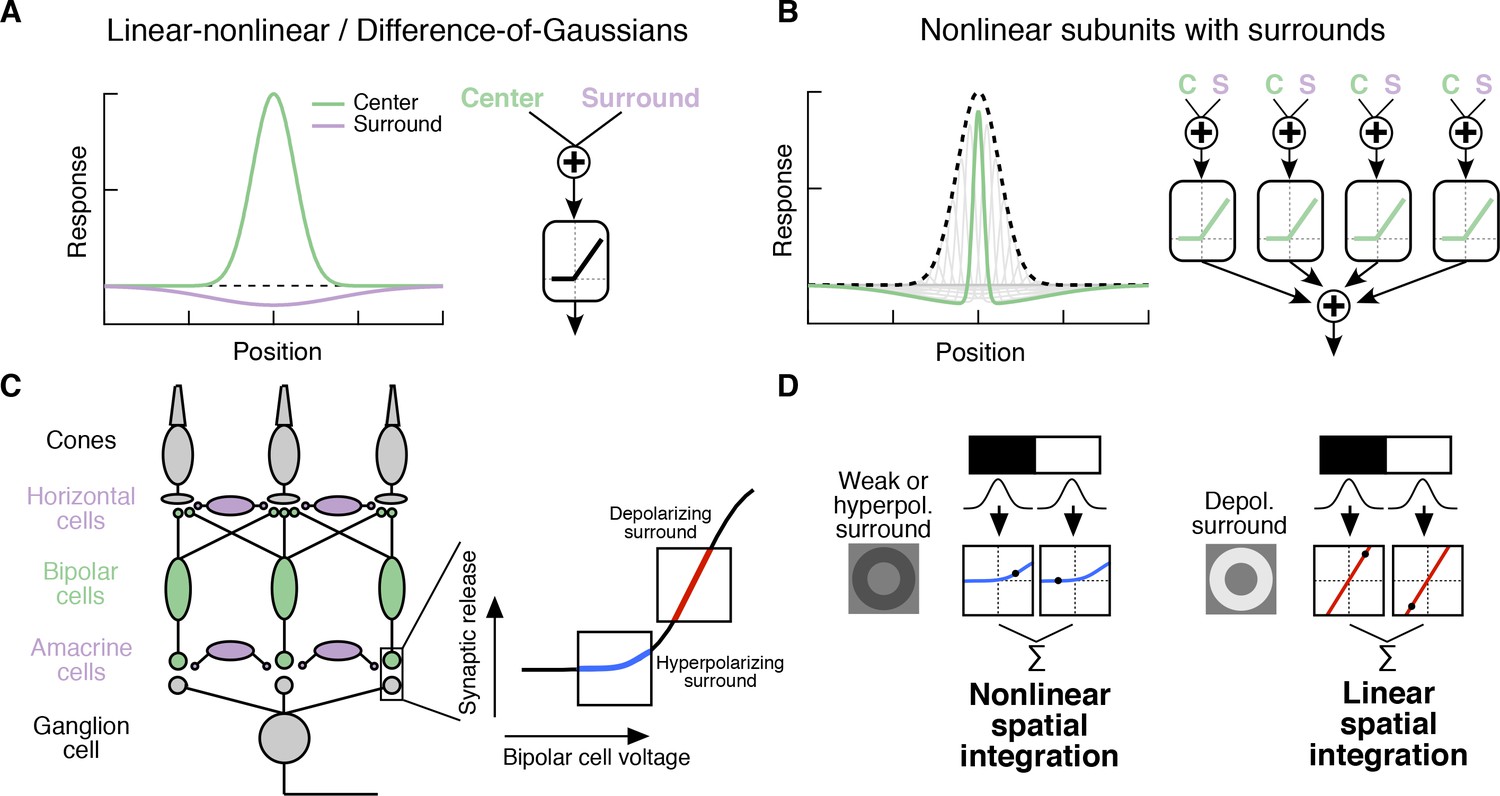
Circuit basis of the surround and implications for receptive field (RF) structure.
(A,B) Two models for how the surround is integrated with the center to form the full RF: The linear-nonlinear model shown in (A) linearly combines the center and surround before treatment with an output nonlinearity that occurs after spatial integration. The model in (B) combines center and surround signals within each nonlinear subunit, and treats the combined center-surround signal with a private nonlinearity. In other words, individual subunits in (B) have their own RF surrounds. (C) Retinal circuit schematic. Bipolar cells make excitatory synapses on to retinal ganglion cells (RGCs). The nonlinear synaptic transfer from bipolar cell to RGC means that bipolar cells act as nonlinear subunits within the RF center of the RGC. The surround is generated by horizontal and/or amacrine cells, both of which can influence bipolar cell responses upstream of the synaptic nonlinearity. Surrounds that hyperpolarize bipolar cells shift the synapse into a more rectified state (blue portion of synaptic nonlinearity). Surrounds that depolarize bipolar cells shift the synapse into a locally linear state (red portion of curve). (D) This circuit organization suggested a working model of how inputs to the surround could change RF structure in the center. Shown is a schematic illustrating this hypothesis for an Off-center RGC. A weak or hyperpolarizing surround will be associated with rectified subunit output nonlinearities, and thus nonlinear spatial integration and sensitivity to spatial contrast (e.g. a split-field grating stimulus). A depolarizing surround will be associated with more linear subunit outputs and the RGC should integrate across visual space approximately linearly.
Figure 2 with 1 supplement
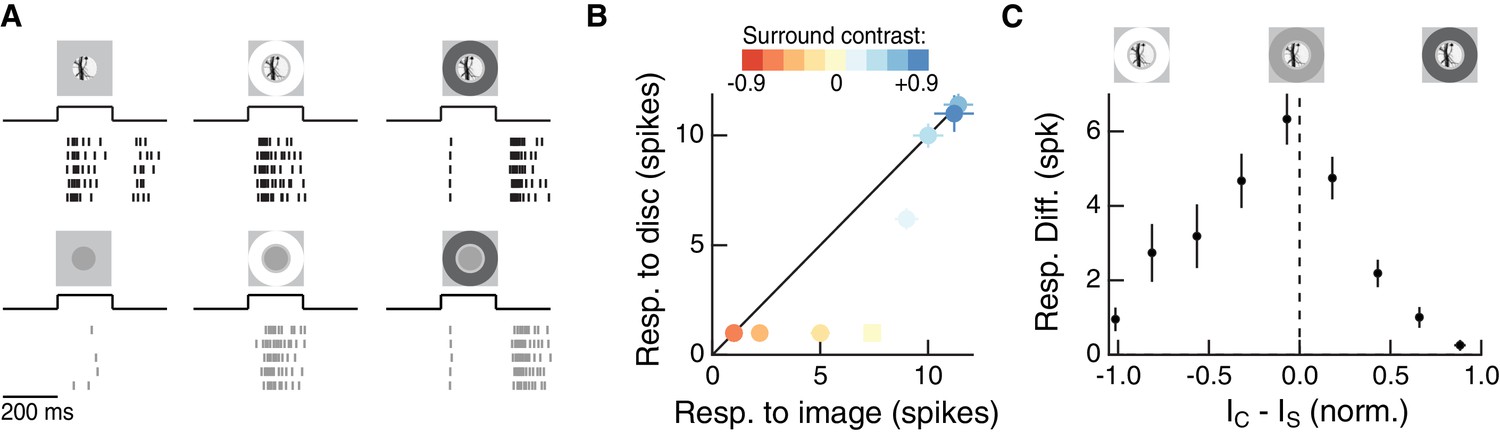
The RF surround regulates nonlinear spatial integration of natural images.
(A) We presented a natural image patch and its linear-equivalent disc stimulus to probe sensitivity to spatial contrast in natural scenes. Rows of each raster correspond to repeated presentations of the same stimulus for the example Off parasol RGC. (B) Spike count responses to an example image patch and its linear equivalent disc across a range of surround contrasts. The addition of a sufficiently bright surround (top three points) eliminates sensitivity to spatial contrast in this image patch. (C) Population summary showing the response difference between image and disc as a function of the difference in mean intensity between the RF center and surround. Negative values of this difference correspond to a surround that is brighter than the center, and positive values to a surround that is darker than the center (n = 21 image patch responses measured in five Off parasol RGCs).
-
Figure 2—source data 1
Included is a .mat file containing a data structure for the data in Figure 2.
Individual trial responses are included as binary vectors of spike times for natural image and associated linear equivalent disc stimuli, across a range of surround contrast conditions. Data are organized by cell and then by natural image. The natural image used in each set of responses is also included. For all responses, data are sampled at 10 Khz, and both center and surround stimuli appear after 200 ms and persist for 200 ms.
- https://doi.org/10.7554/eLife.38841.005
Figure 2—figure supplement 1

Measuring linear center-surround structure in parasol RGCs.
(A) Off parasol RGC spike responses to expanding spots stimuli. (B) Area-summation curve from the cell in (A), points show mean S.E.M., smooth curve is a difference-of-Gaussians fit. (C–D) Same as (A–B) for excitatory current responses.
Figure 3 with 1 supplement

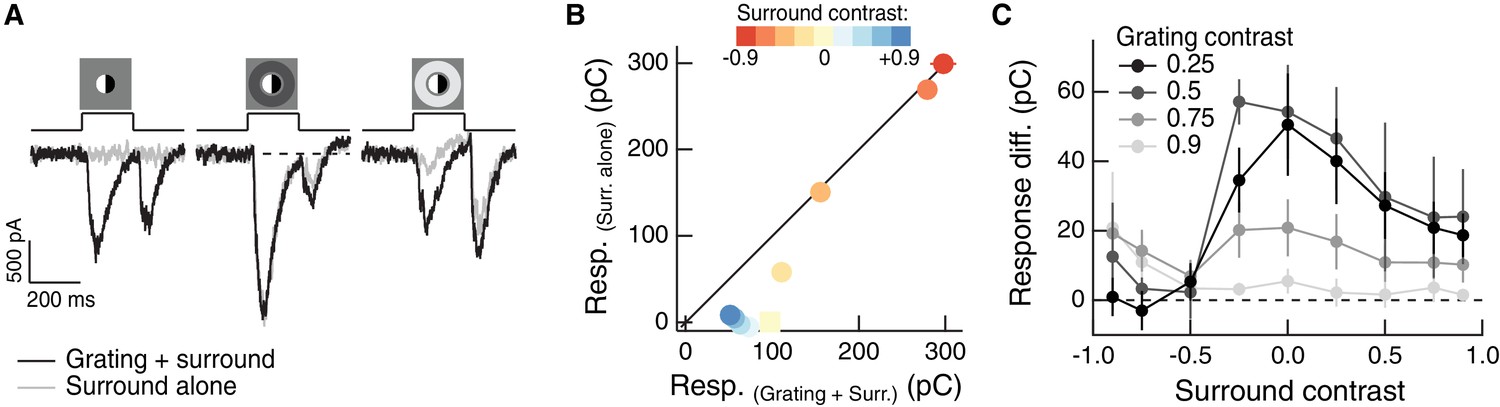
The RF surround regulates nonlinear spatial integration in the RF center.
(A) Left column: Example Off parasol RGC spike response to an isolated split-field grating stimulus in the RF center. Rows of each raster correspond to repeated presentations of the same stimulus for the example cell. There is no linear equivalent stimulus in this case since the grating has a mean of zero. Center column: when the center stimulus is paired with a bright surround, the grating and the surround alone produce very similar spike responses. Right column: a dark surround suppresses the response in both cases, and the grating is unable to elicit a strong response. (B) For the example cell in (A), we tested sensitivity to the center grating stimulus with a range of contrasts presented to the surround. Negative contrast surrounds (hyperpolarizing for Off bipolar cells) decrease the response. Positive contrast surrounds (depolarizing for Off bipolar cells) sum sub-linearly with the grating stimulus such that for the brightest surrounds, the addition of the grating only mildly enhances the cell’s response. Points show mean ( S.E.M.) spike count. (C) We measured the response difference between the grating stimulus and the surround-alone stimulus across a range of surround contrasts (horizontal axis) and for four different central grating contrasts (different lines). For each grating contrast, addition of either a bright or dark surround decreased sensitivity to the added grating. Points are population means ( S.E.M.) (n = 5 Off parasol RGCs). (D–F) same as (A–C) for excitatory synaptic current responses of an Off parasol RGC. Points represent mean ( S.E.M.) excitatory charge transfer for the example cell in (E) and population mean (S.E.M.) (n = 7 Off parasol RGCs) in (F).
-
Figure 3—source data 1
Included is a .mat file containing a data structure for the data in Figure 3A–C.
Off parasol RGC spike responses are included as raw traces and binary vectors of spike times for a range of central grating contrasts and surround contrasts. For all responses, data are sampled at 10 Khz, and both center and surround stimuli appear after 200 ms and persist for 200 ms.
- https://doi.org/10.7554/eLife.38841.008
-
Figure 3—source data 2
Included is a .mat file containing a data structure for the data in Figure 3D–F.
Off parasol RGC excitatory current responses (in units of pA) have been baseline-subtracted. For all responses, data are sampled at 10 Khz, and both center and surround stimuli appear after 200 ms and persist for 200 ms.
- https://doi.org/10.7554/eLife.38841.009
-
Figure 3—source data 3
Included is a .mat file containing a data structure for the data in Figure 3—figure supplement 1.
On parasol RGC excitatory current responses (in units of pA) and have been baseline-subtracted. For all responses, data are sampled at 10 Khz, and both center and surround stimuli appear after 200 msec and persist for 200 ms.
- https://doi.org/10.7554/eLife.38841.010
Figure 3—figure supplement 1
Regulation of spatial integration by the RF surround of On parasol RGCs.
Compare to Figure 3A–C. (A) Left: On parasol RGC excitatory current response to a split-field grating stimulus in the RF center. Right: when the center stimulus is paired with a dark surround (depolarizing for this On-center RGC), the grating and the linear equivalent stimulus produce very similar excitatory current responses. (B) For the example cell in (A), we tested sensitivity to the center grating stimulus with a range of contrasts presented to the surround. Positive contrast surrounds (hyperpolarizing) decrease the response. Negative contrast surrounds (depolarizing) sum sub-linearly with the grating stimulus such that for thedarkest surrounds, the addition of the grating only mildly enhances the cells response. Points show mean S.E.M. excitatory charge transfer. (C) We measured the response difference between the grating stimulus and the surround-alone stimulus across a range of surround contrasts (horizontal axis) and for four different central grating contrasts (different lines). For each grating contrast, addition of either a bright or dark surround decreased sensitivity to the added grating. Points are population means ( S.E.M.) (n = 6 On parasol RGCs).
Figure 4 with 1 supplement
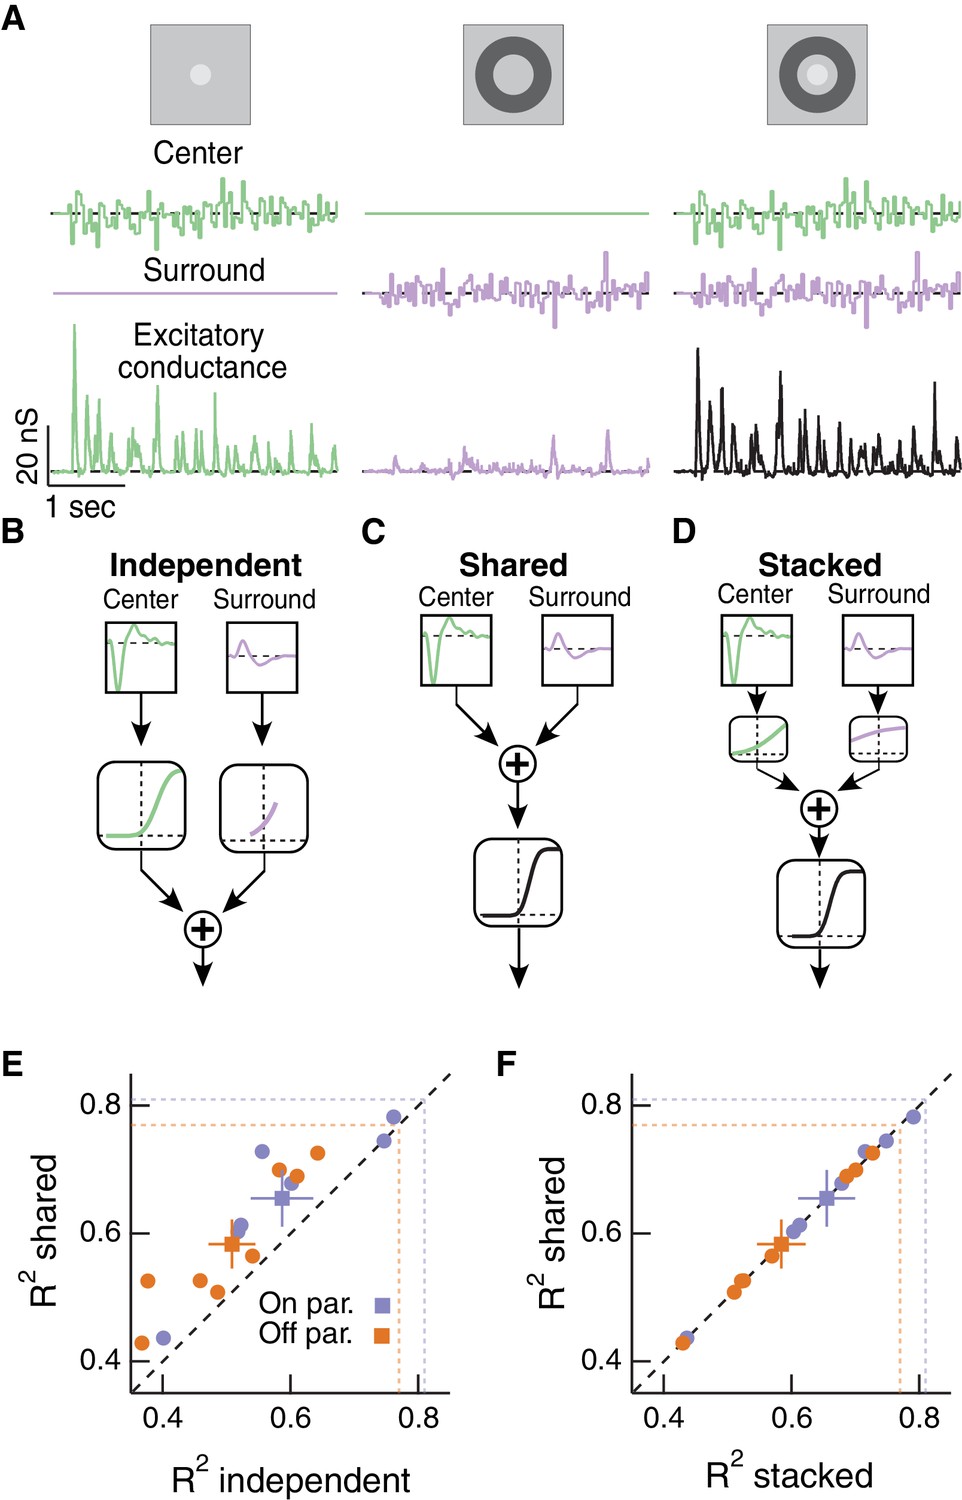
Linear-nonlinear cascade modeling supports an architecture where center and surround combine linearly before passing through a shared nonlinearity.
(A) We presented Gaussian noise to either the center region (left), surround region (middle) or center and surround regions simultaneously (right) while measuring excitatory synaptic current responses. Measured excitatory currents (in pA) have been converted to excitatory conductance (in nS). Example traces are from a representative Off parasol RGC. (B) The independent model treats the filtered center and surround inputs with private nonlinear functions, and the outputs of these two nonlinearities are then summed to produce the excitatory conductance response. (C) The shared model integrates filtered center and surround inputs linearly, and this summed input is then passed through a single, shared nonlinearity. (D) The stacked model combines the independent and shared models by treating center and surround with private nonlinearities before summation and treatment with a third, shared nonlinearity. (E) We tested the ability of each of these models to predict held-out responses to center-surround stimulation. The shared model outperforms the independent model in both On and Off parasol RGCs (n = 7 On cells, ; n = 8 Off cells, ). (F) The fraction of explained variance was the same for the shared compared to the stacked model ( for both On and Off cells). Dashed lines show estimates of the response reliability, which sets an upper bound for model performance (see Materials and methods for details).
-
Figure 4—source data 1
Included is a .mat file containing a data structure for the data in Figure 4 and 5.
Stimuli and corresponding responses of On and Off parasol RGCs to center-surround white noise stimulation have been concatenated into vector arrays. Note that the data were collected in interleaved trials. This data includes excitatory conductance responses (in nS) that were estimated using measured excitatory current responses and an estimate of the excitatory driving force for each cell. Data are sampled at 10 Khz.
- https://doi.org/10.7554/eLife.38841.013
Figure 4—figure supplement 1
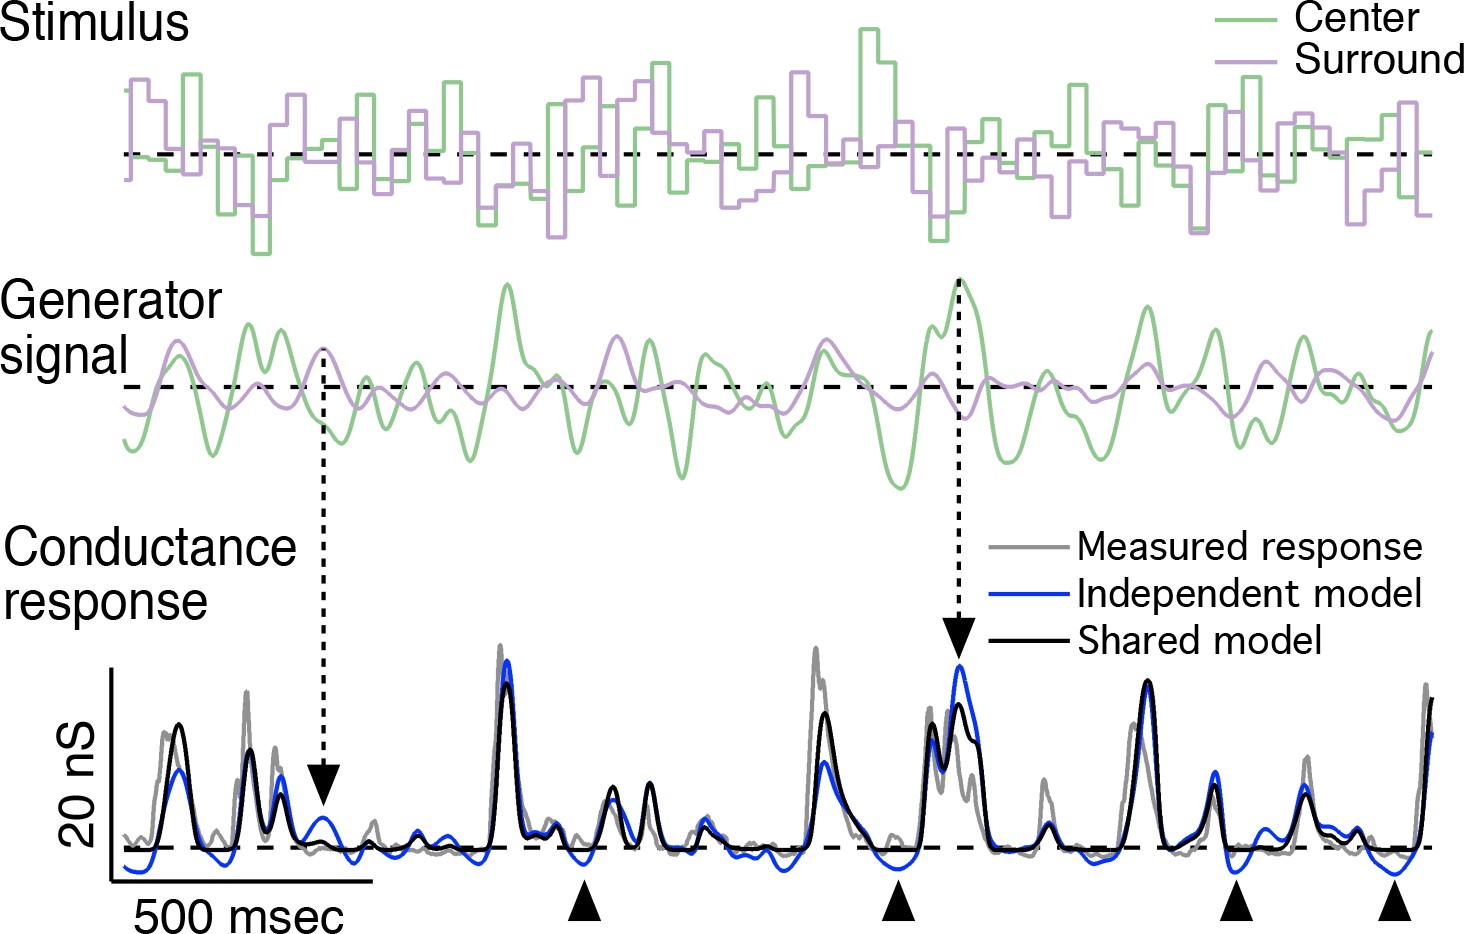
Representative predictions of linear-nonlinear cascade models for center-surround interactions.
Representative traces for the center-surround LN cascade models fit to the example cell in Figure 4. Top: center-surround stimulus trace; middle: associated generator signal for the center and surround; bottom: measured conductance response (gray trace) and predicted responses from the independent nonlinearity model (blue trace) and the shared nonlinearity model(black trace). Dashed arrows indicate times at which center and surround generator signals are opposed to one another (i.e. center excited and surround inhibited or vice-versa). As a result, the independent model prediction overshoots that of the shared model and the measured response. Arrowheads below the trace indicate times at which the independent model prediction undershoots the cell’s response and the shared model prediction. These undershoots are the result of the independent model trying to account for the antagonistic relationship between the center and surround. In the independent model, the surround will suppress the response whether the center is activated or not. This is not true of the shared model or the real cell.
Figure 5
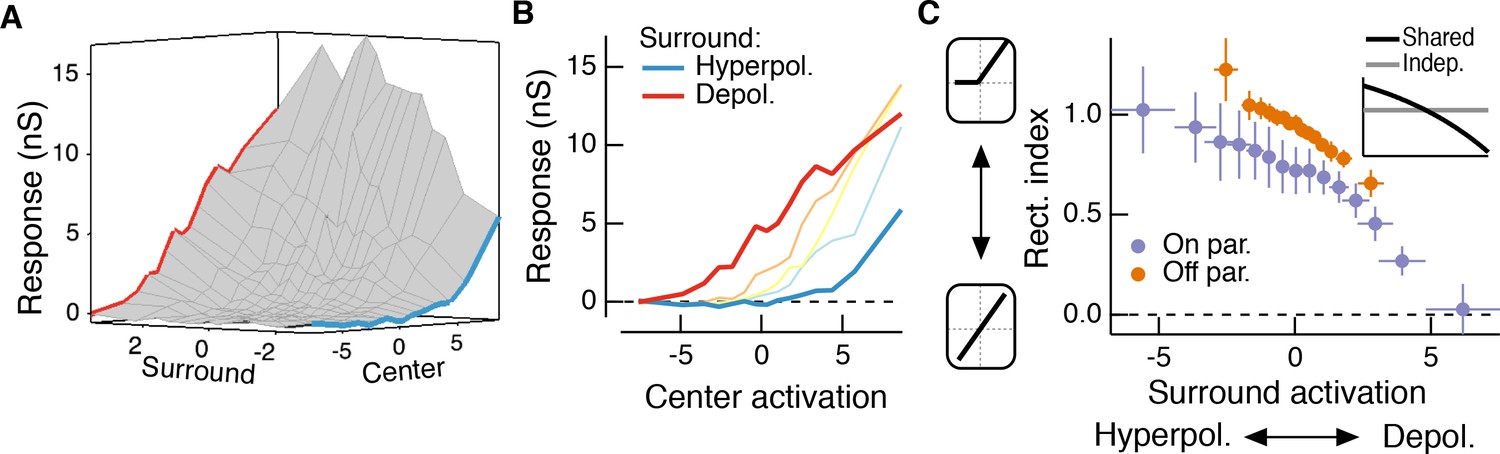
The RF surround changes the apparent rectification of inputs from the center.
(A) Response surface showing the mean excitatory conductance response from an Off parasol RGC as a function of filtered inputs to both the center and surround (center or surround ‘activation’, that is their generator signals). (B) Sections through this surface at various levels of surround activation reveal that the shape of the nonlinear dependence of excitatory conductance on center activation changes as the surround is modulated. (C) To quantify this change in center rectification, we used a rectification index (see Materials and methods), where values near 0 indicate a linear relationship between center activation and conductance response, and values near one indicate a sharply rectified relationship. Points are mean ( S.E.M.) (n = 7 On parasol cells and n = 8 Off parasol cells). Inset shows the expected relationship between rectification index and surround activation for a shared nonlinearity model (black curve) and an independent nonlinearity model (gray curve).
Figure 6
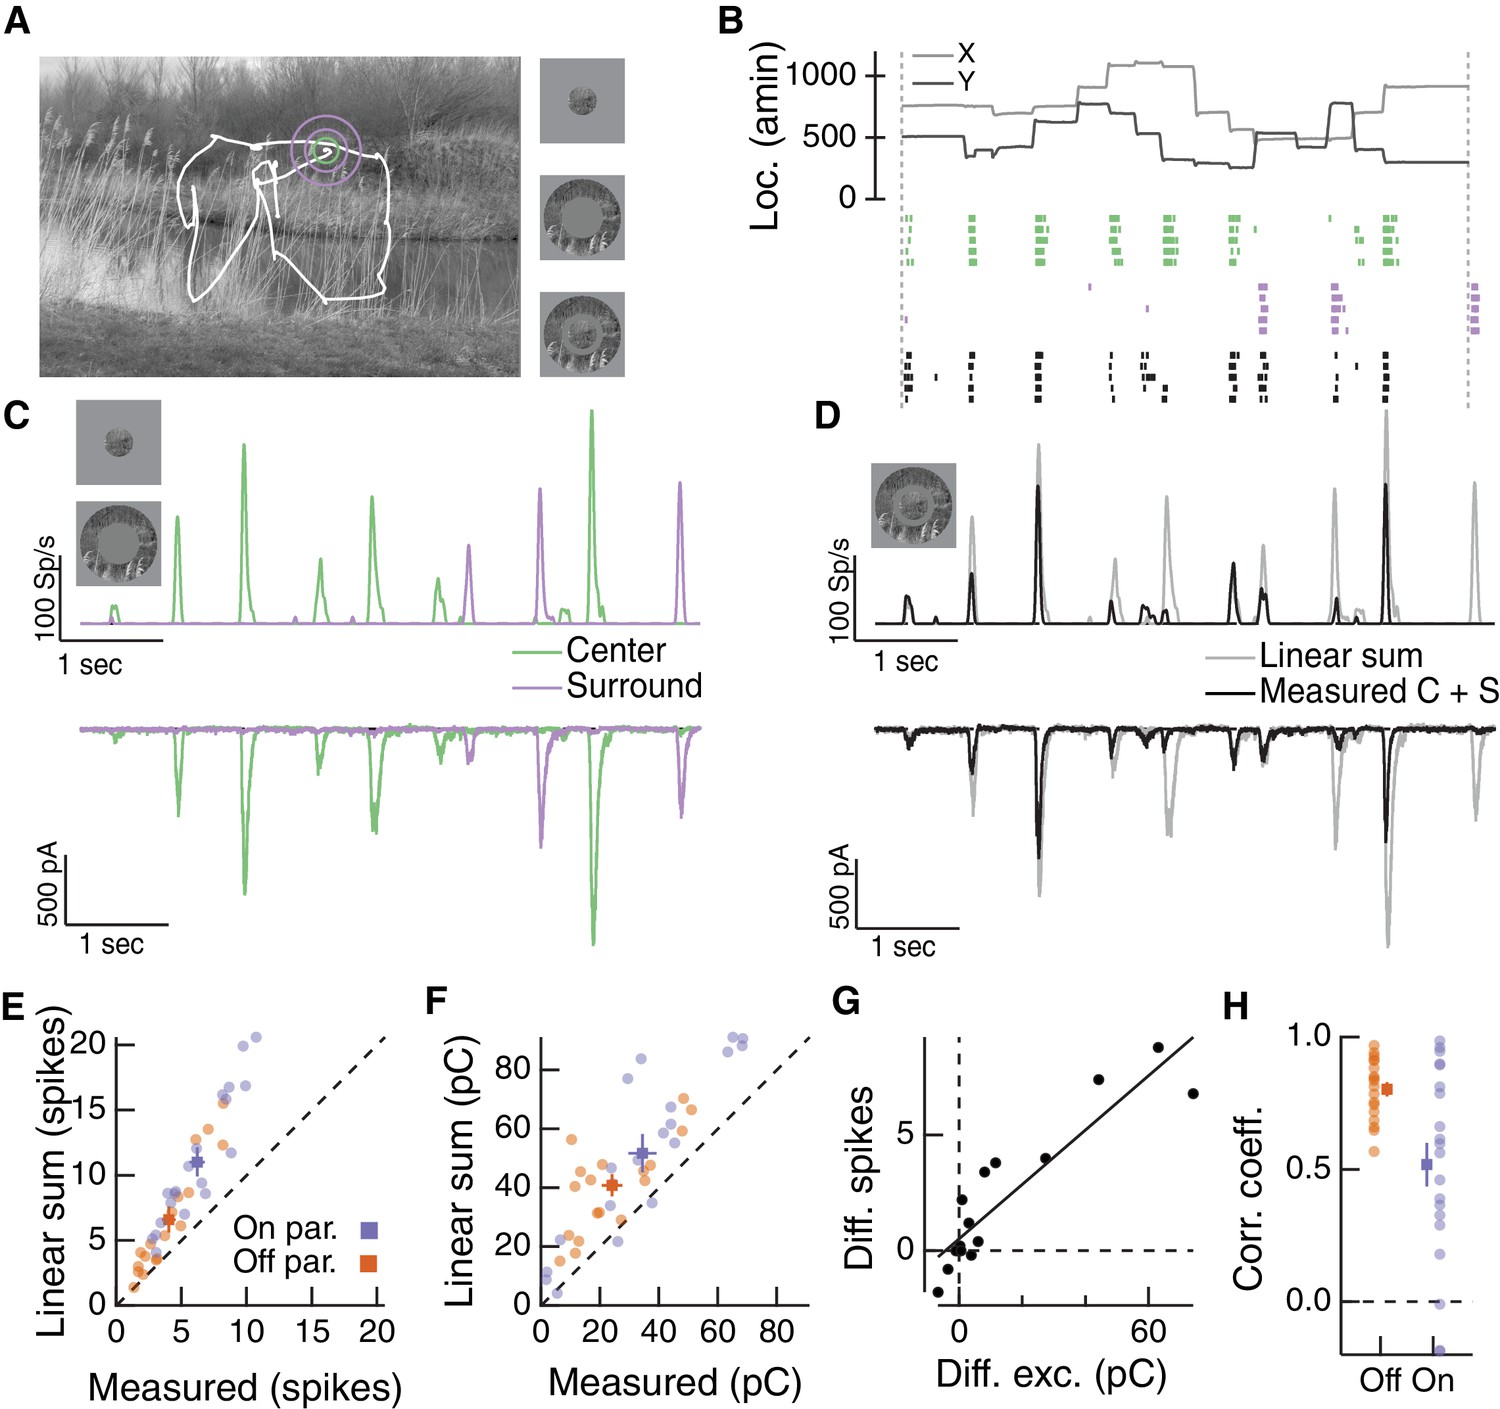
Natural movie stimuli elicit nonlinear interactions between the RF center and surround.
(A) Natural image and associated eye movement trajectory from (Van Der Linde et al., 2009). Right: example movie frames showing isolated center (top), surround (middle), and center-surround stimuli (bottom). (B) Rasters show example Off parasol RGC spike responses to these three movie stimuli. Top shows eye movement position. (C) Spike output (top) and excitatory synaptic input (bottom) in response to isolated center and surround stimuli. (D) Spike and excitatory synaptic input responses to the center-surround stimulus. Gray trace shows the linear sum of isolated responses to center- and surround-region stimuli. (E) Spike count in response to the center-surround stimulus compared to the linear sum of isolated center and surround responses. Each point is a different natural movie. Center and surround sum sub-linearly (On parasol RGCs: n = 20 natural movies across 8 cells, ; Off parasol RGCs: n = 18 natural movies across 7 cells, ). (F) Same as (E) but for excitatory charge transfer responses (On parasol RGCs: ; Off parasol RGCs: ). (G) For the example in (A–D), the difference between measured and linearly-summed spike responses was correlated with differences in excitatory synaptic inputs (r = 0.91). (H) Population data for the analysis in (G).
Figure 7
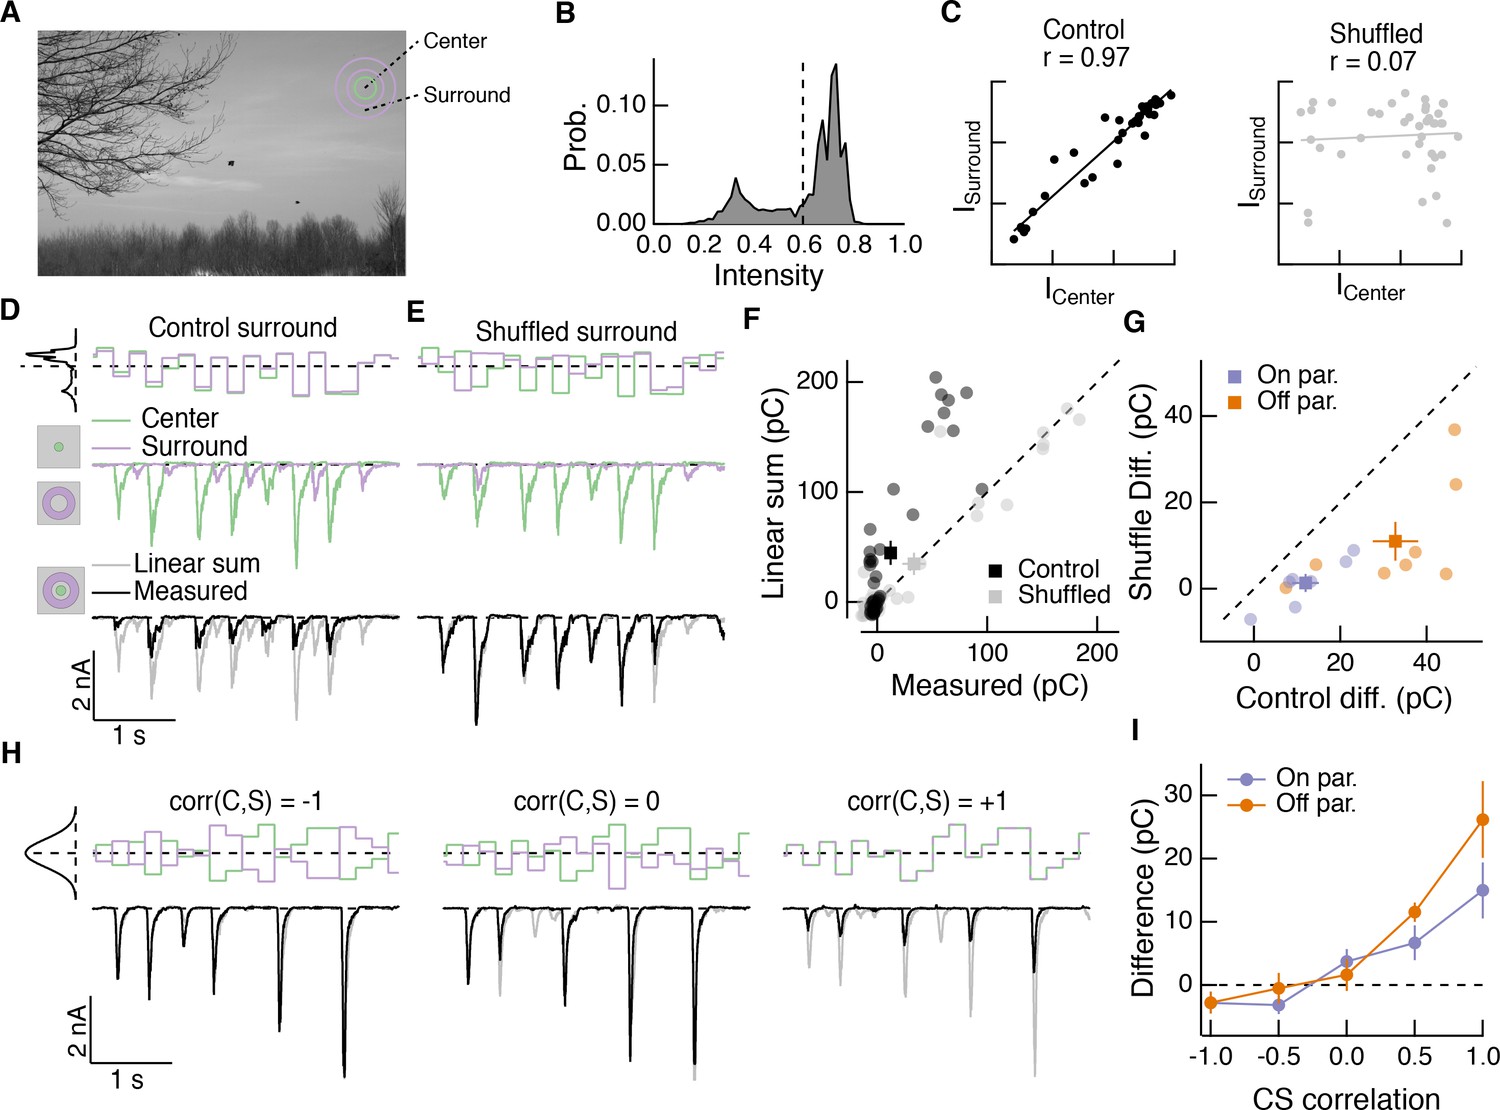
Spatial correlations in natural scenes promote nonlinear center-surround interactions.
(A) Example image (van Hateren and van der Schaaf, 1998) used to construct natural intensity stimuli. (B) Intensity histogram from the image in (A). Dashed vertical line indicates the mean intensity, which was used as the mean gray level in experiments that follow. (C) Center and surround intensity values for 40 image patches from the image in (A). (D) Example stimuli (top) and Off parasol RGC excitatory current responses to isolated center and surround (middle) and center-surround (bottom) stimulation. Gray trace in bottom shows linear sum of isolated center and surround responses. (E) Same as (D) for shuffled surround intensities. (F) The response magnitude (charge transfer) of each fixation is plotted for measured center-surround and linearly summed center and surround responses. Circles show mean responses for each fixation, squares show mean ( S.E.M.) across all fixations in this example cell. (G) Population data showing the mean difference between responses to the center-surround stimulus and the linearly summed response. Circles show average differences for each cell tested, and squares show population mean ( S.E.M) (n = 7 On parasol RGCs, ; n = 8 Off parasol RGCs, ). (H) White noise center-surround stimuli had variable center-surround correlations but constant marginal distributions. Shown are example excitatory current responses in an Off parasol RGC. Black traces show the measured center-surround stimulus response and gray traces show the linear sum of center and surround responses. (I) Population data from the experiments in (H) showing that nonlinear center-surround interactions depend on the correlation between center and surround inputs (n = 8 On parasol RGCs; n = 8 Off parasol RGCs).
-
Figure 7—source data 1
Included is a .mat file containing a data structure for the data in Figure 7A–G.
The structure contains excitatory current responses (baseline subtracted, in pA) of On and Off parasol RGCs to center-surround naturalistic luminance stimuli. Data are sampled at 10 Khz.
- https://doi.org/10.7554/eLife.38841.017
Figure 8 with 2 supplements
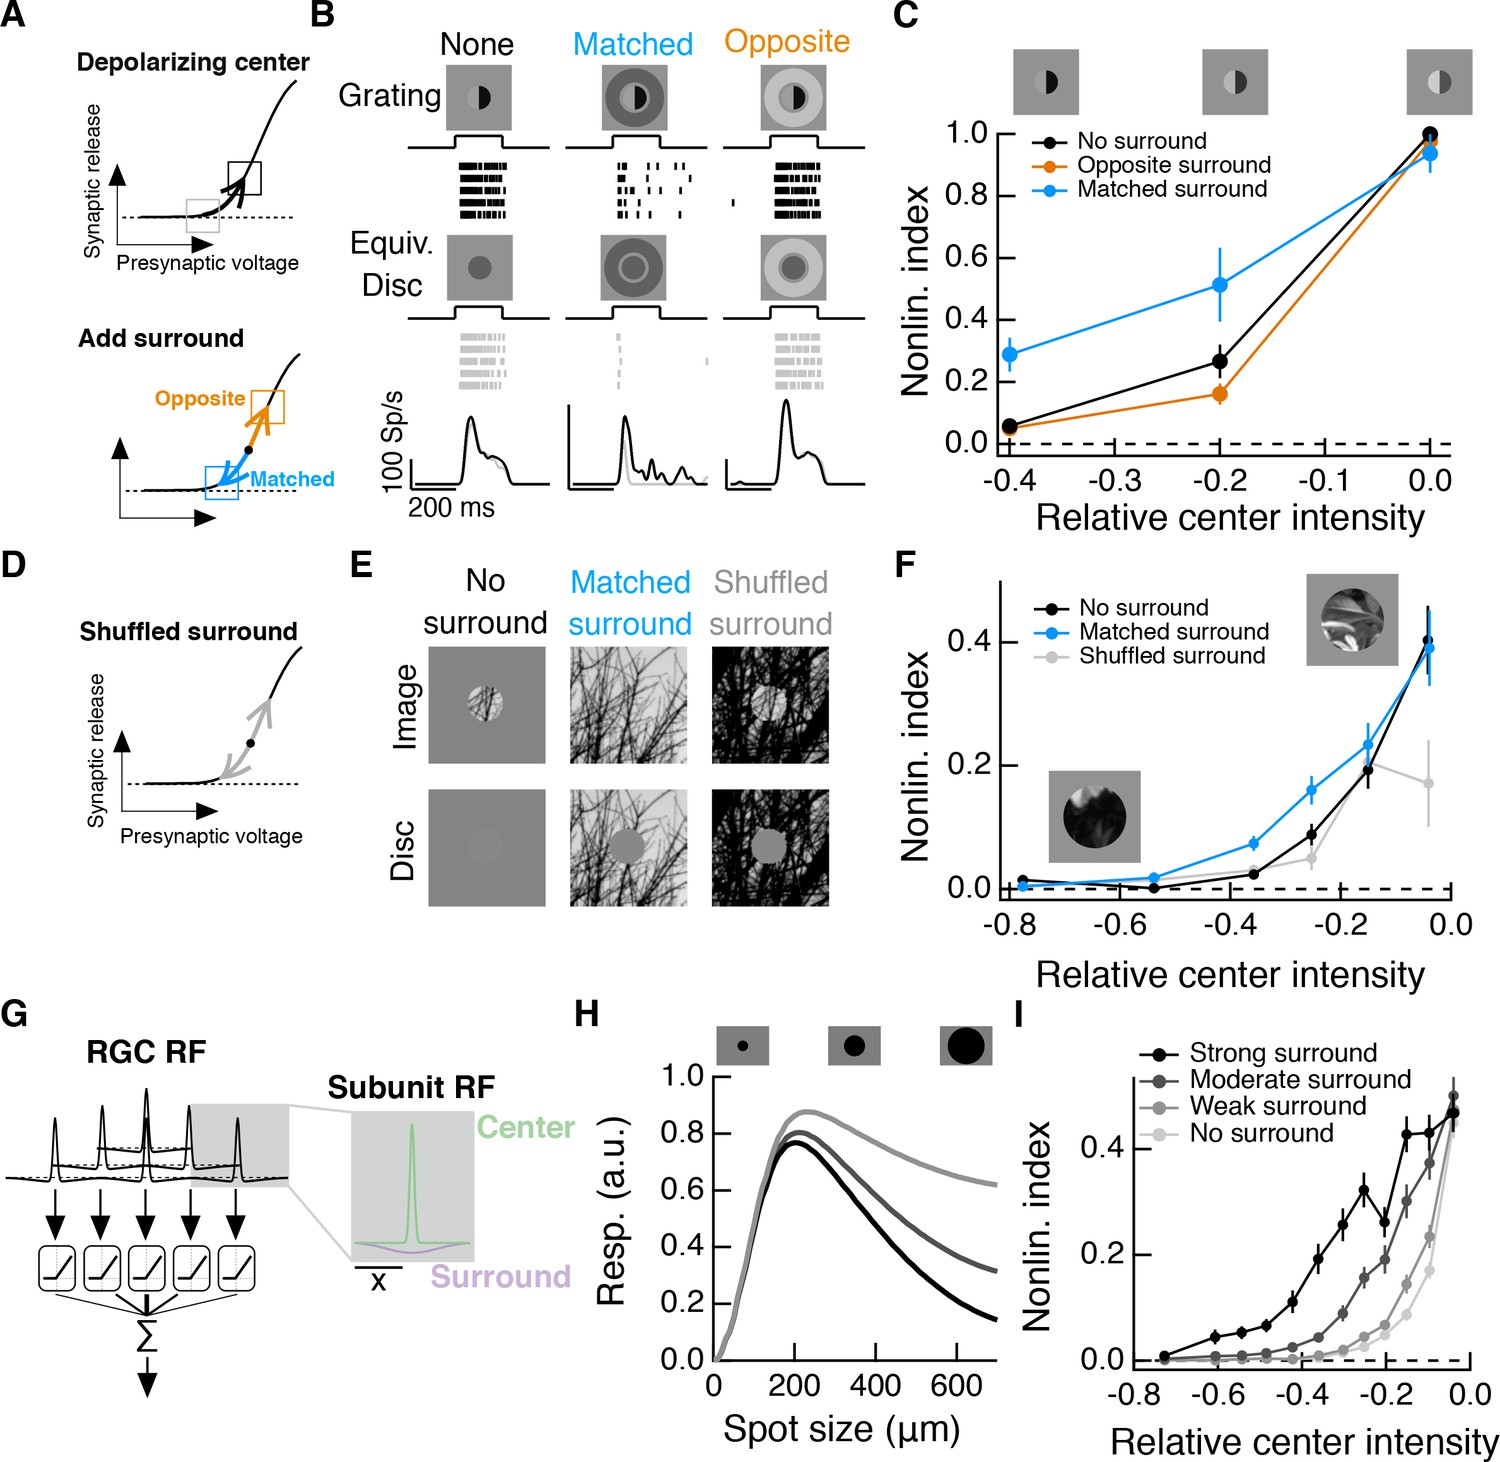
Intensity correlations across space promote nonlinear spatial integration in the RF center.
(A) Schematic showing the hypothesized interaction between center and surround inputs on local subunit rectification. A depolarizing input to the center may push the synapse into a locally linear state. A simultaneous surround input that is matched in luminance (blue arrow) can hyperpolarize the synaptic terminal and bring the synapse back into a rectified state, whereas a poorly matched surround will not (orange arrow). (B) During Off parasol spike recordings, we presented split-field grating stimuli to the RF center under three surround conditions. For each stimulus condition, rows of the raster correspond to repeated presentations of the same stimulus for the example cell. (C) Summary data showing the population mean S.E.M. NLI (see text) as a function of the mean intensity (relative to the background) of the center grating (n = 8 Off parasol RGCs). (D–F) We presented natural image patches and their linear equivalent disc stimuli to measure the NLI under three surround conditions: no surround, a matched surround image, and a shuffled surround image. (G) Schematic of a nonlinear subunit RF model. Each subunit has a difference-of-Gaussians spatial receptive field. The output of each subunit is passed through a private, rectifying output nonlinearity. Subunit outputs are then summed over visual space to yield the modeled RGC response. (H,I) We changed the strength of the subunit surround to model RGCs with three different surround strengths: a weak surround (light gray trace), an intermediate-strength surround (gray trace), and a strong surround (black trace). We presented this RF model with the natural image/disc stimuli shown in (E) and, following that analysis, measured the NLI as a function of the mean intensity of the image in the RF center.
Figure 8—figure supplement 1
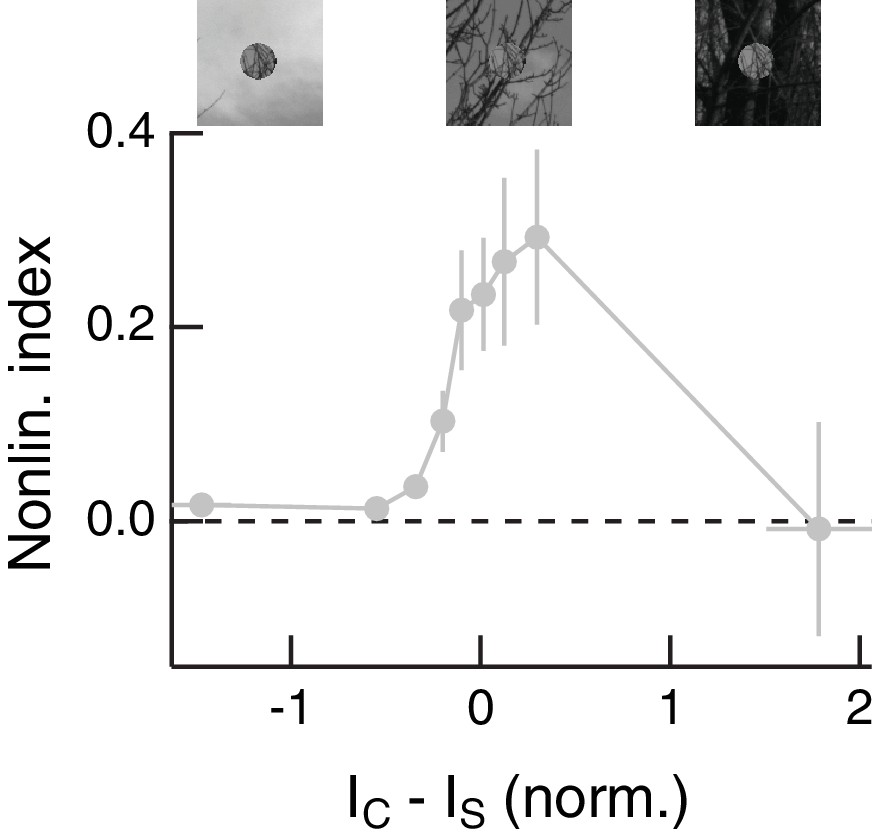
Center-surround intensity differences modulate spatial contrast sensitivity for randomly shuffled natural surrounds.
From the data shown in Figure 8D–F using the shuffled surround condition, we plotted thenonlinearity index as a function of the difference in mean intensity between the RF center and surround. Compare to Figure 2C. Shown are mean S.E.M. NLI values in equally-populated bins. Note that there are very few data points on the far right of the x axis because Off parasol RGCs very rarely spike in response to these stimuli (bright center and dark surround). Image patches above show example center and shuffled surround stimuli for the indicated center-surround intensity difference.
Figure 8—figure supplement 2
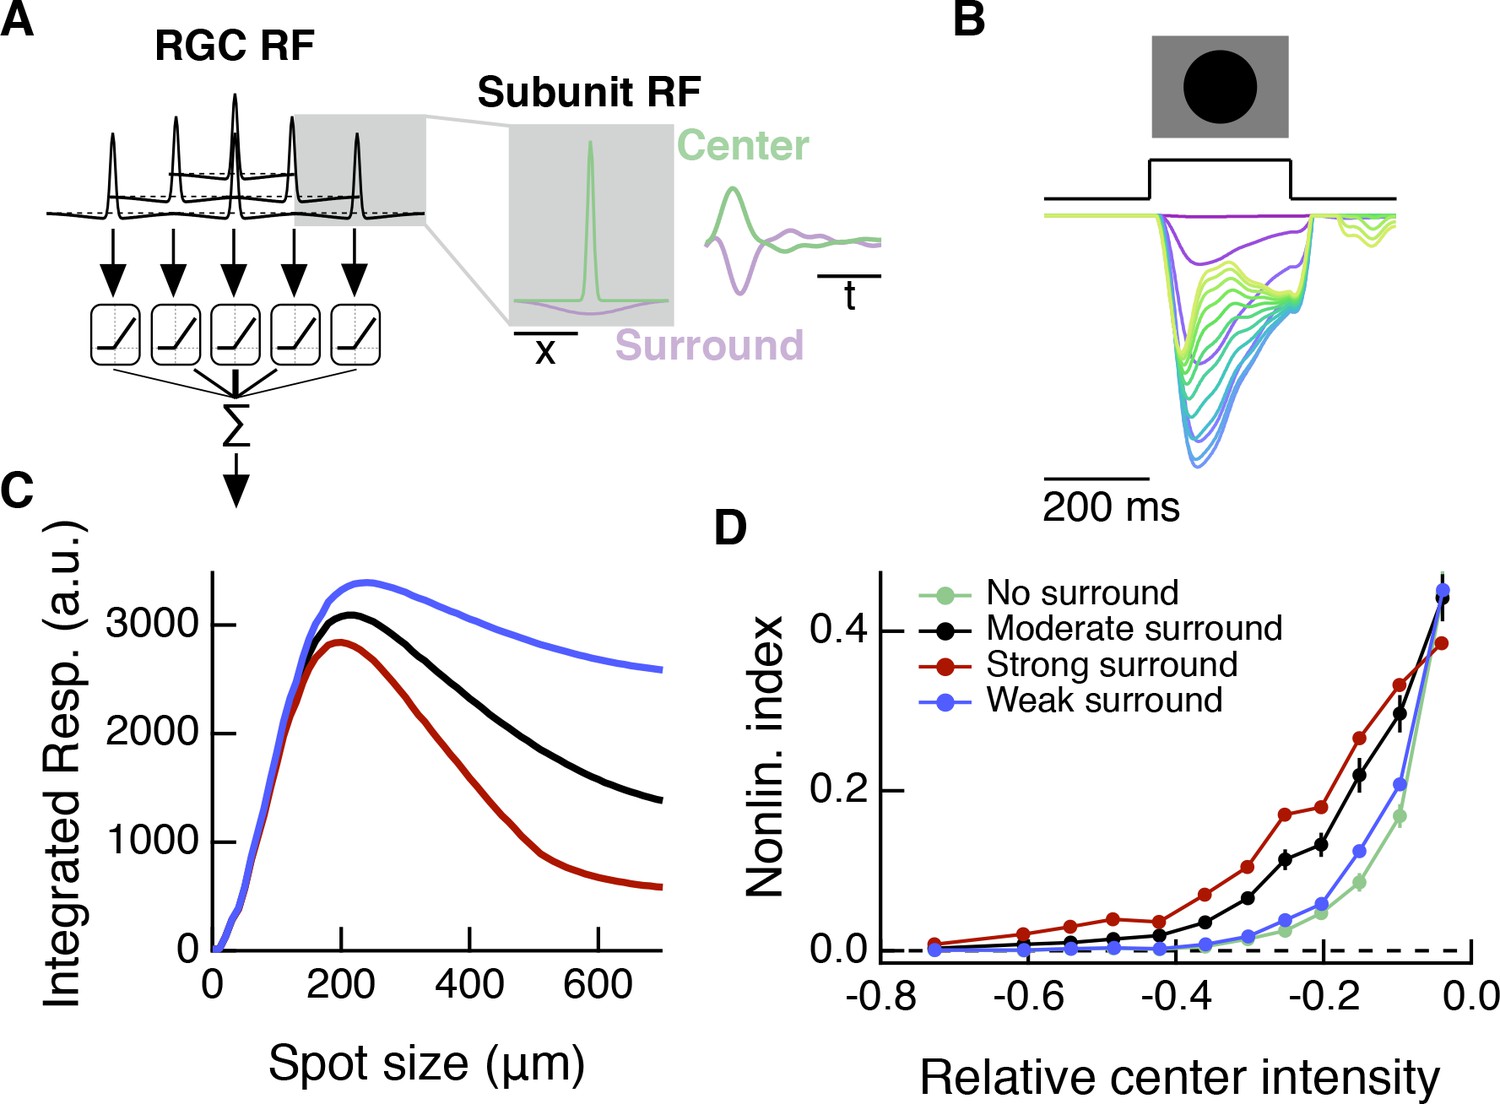
A spatiotemporal RF model also shows modulation of spatial contrast sensitivity with surround activation.
Compare to Figure 8G–I, which shows results for a simpler, spatial-only RF model. (A) In addition to the spatial subunit filters, this spatiotemporal model includes temporal linear filters which were measured from excitatory current responses to white noise stimulation (Figure 4). The temporal filters are applied to RF subunit center and surround sub-regions. (B) Response of the model (in arbitrary units) to dark spots of increasing diameter centered over the RF. From magenta to blue to yellow/green the traces show responses to spots of increasing diameter. (C) The spatiotemporal RF model shows center-surround organization to expanding spots stimuli. (D) As with the simpler spatial RF model (Figure 8), the spatiotemporal RF model shows an increase in spatial contrast sensitivity in the face of stronger center luminance signals, and this effect depends on surround strength.
Additional files
-
Source code 1
Example MATLAB code to load the Source Data files, plot responses, and perform basic analyses.
The analysis used to generate the figures in the paper is included in the corresponding GitHub repository (see Materials and methods) – this Source Code file is merely illustrative of how to access and interact with the provided Source Data files.
- https://doi.org/10.7554/eLife.38841.021
-
Transparent reporting form
- https://doi.org/10.7554/eLife.38841.022
Download links
A two-part list of links to download the article, or parts of the article, in various formats.
Downloads (link to download the article as PDF)
Open citations (links to open the citations from this article in various online reference manager services)
Cite this article (links to download the citations from this article in formats compatible with various reference manager tools)
Receptive field center-surround interactions mediate context-dependent spatial contrast encoding in the retina
eLife 7:e38841.
https://doi.org/10.7554/eLife.38841


