Single cell functional genomics reveals the importance of mitochondria in cell-to-cell phenotypic variation
- The Barcelona Institute of Science and Technology, Spain
- Universitat Pompeu Fabra, Spain
- Indian Institute of Technology, India
- Institució Catalana de Recerca i Estudis Avançats (ICREA), Spain
Figures
Figure 1
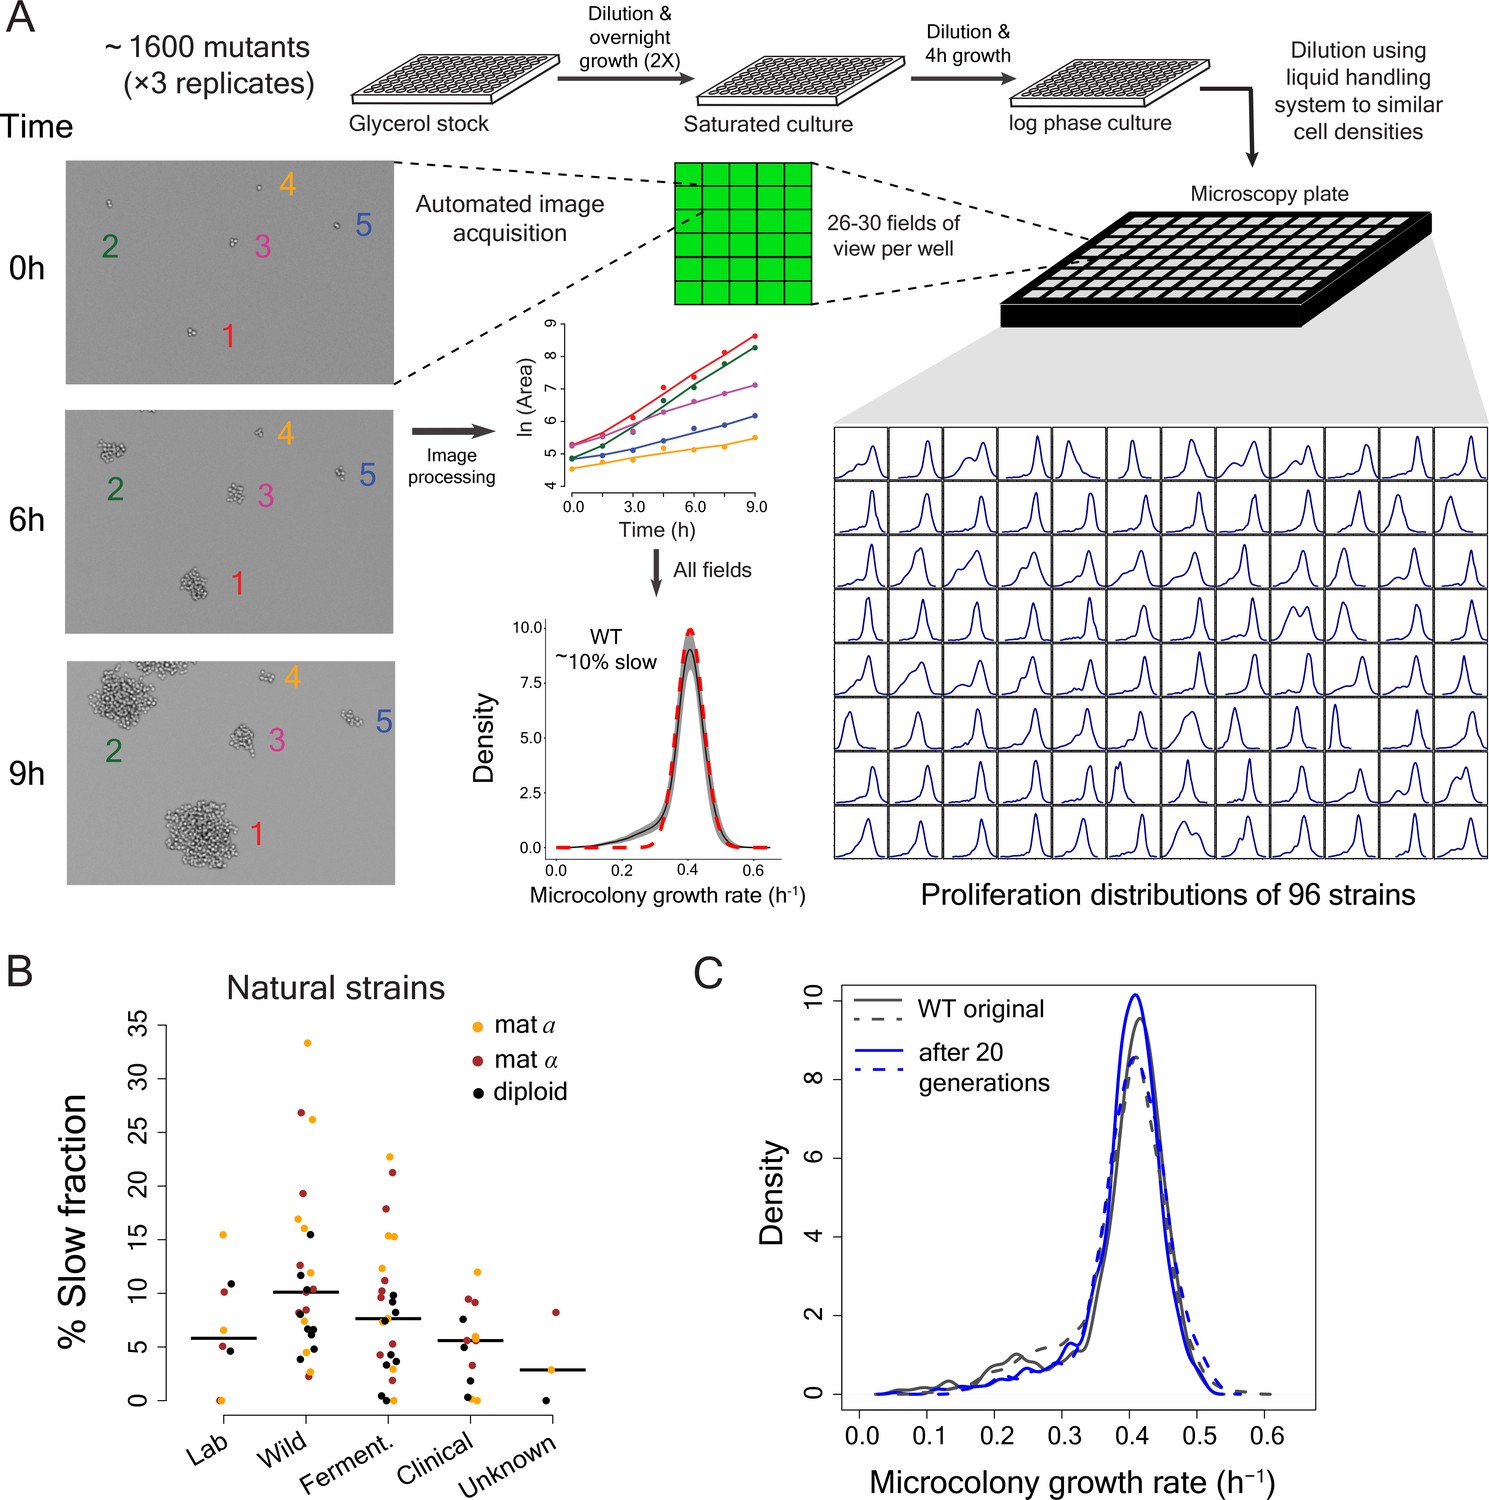
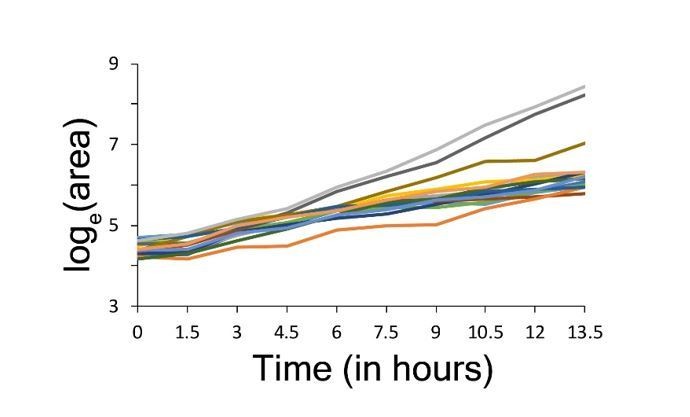
High-throughput analysis of single cell proliferation rate heterogeneity.
(A) High throughput microscopy setup – log phase yeast cells were diluted onto conA coated microscopy plate using Biomek NX liquid handling system to have similar cell density across wells. Cells were observed using an ImageXpress Micro system. Images were processed using custom scripts and data for area of microcolony vs. time were obtained. The points in the area vs. time graph show actual data and the solid lines show lowess fits. Data collected from all fields of view in a well constitute a microcolony proliferation rate distribution for a strain. The common lab yeast strain BY4741 (WT) has ~10% slow proliferating sub-population. The density shows mean density and the shaded areas in grey represent ±1 s.d. value at each point. The dotted red line shows the expected proliferation distribution if it were normally distributed. (B) Natural strains of yeast (Ziv et al., 2013) also have slow proliferating sub-populations. Each point represents data for one strain. Solid lines show median value. (C) WT strain re-created the original proliferation distribution even after 20 generations of growth. The plot shows data from two replicate measurements.
-
Figure 1—source data 1
Percentage of slow-growing cells in natural yeast strains.
- https://doi.org/10.7554/eLife.38904.003
Figure 2 with 2 supplements
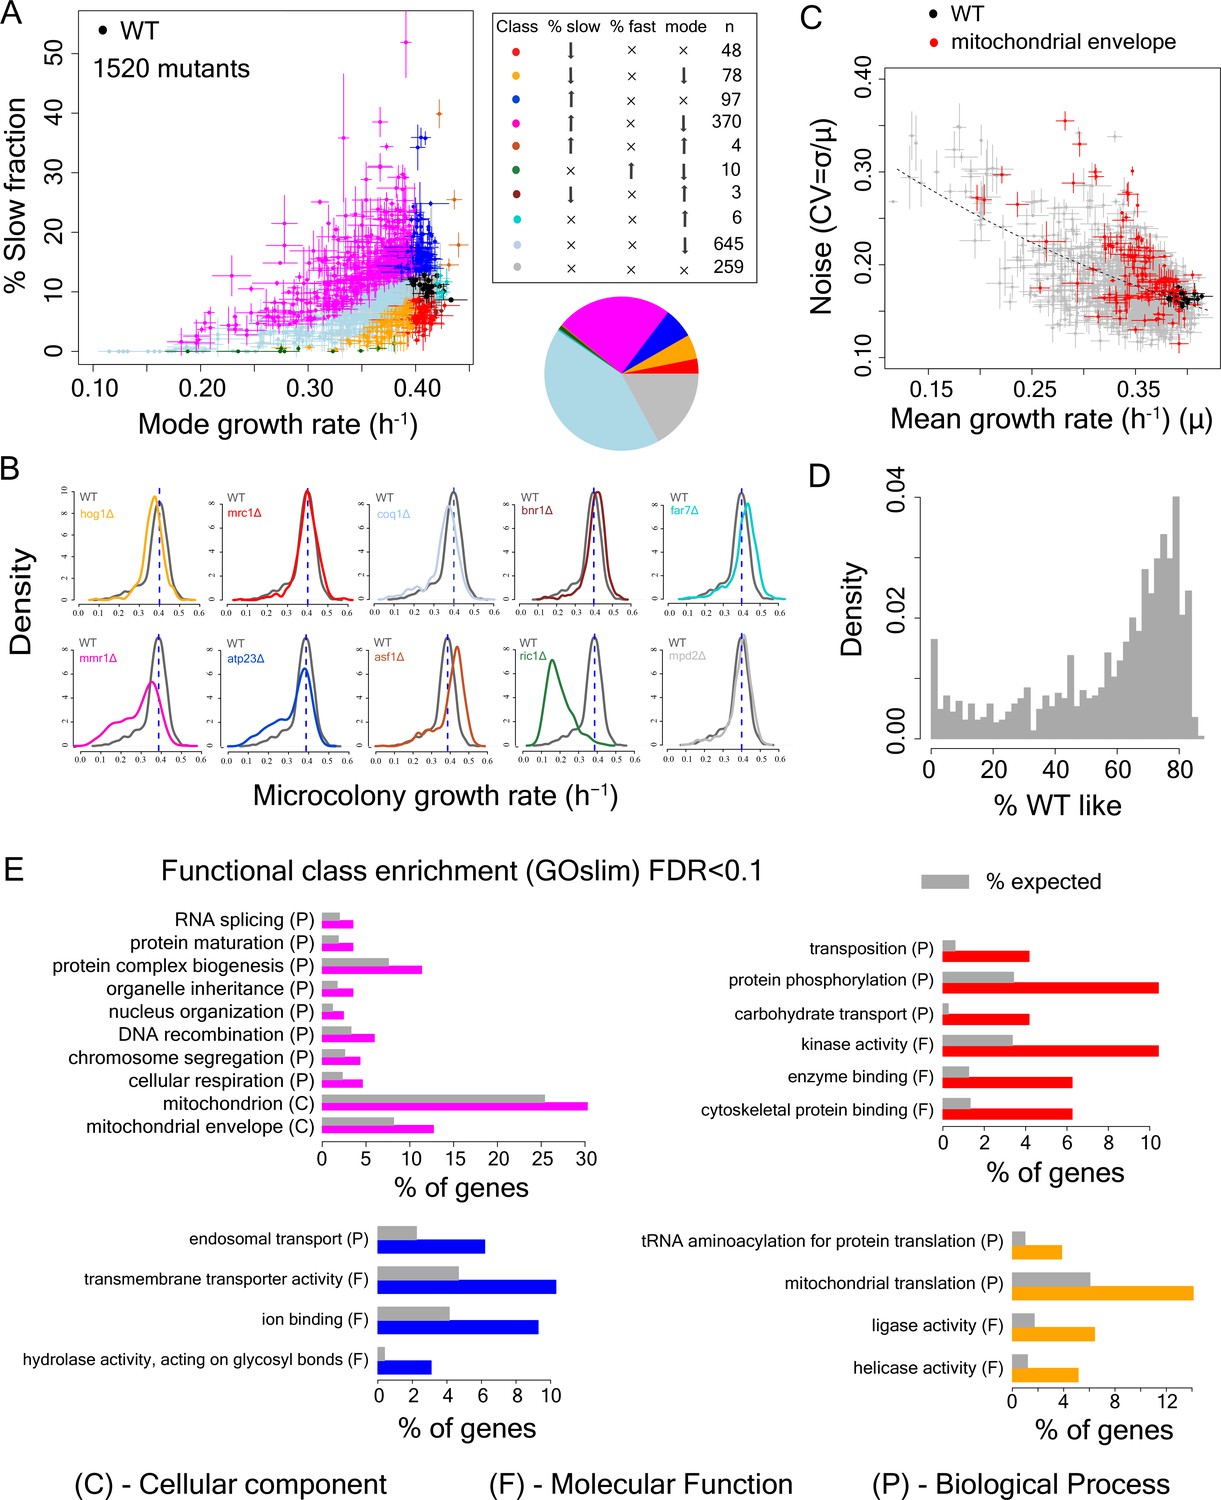
Single cell proliferation rate distributions for 1500 gene deletions.
(A) Mode growth rate (h−1) and % slow fraction for 1520 deletion strains. The points represent average values across replicates and the bars represent ±1 s.d. values. The colours show classification of mutants into different categories according to change in mode growth rate (see Materials and methods, FDR < 0.1) and change in % slow fraction (FDR < 0.1) compared to the wild-type (WT) strain. The table and pie chart show the number and proportion of strains in each group (colour coded). Replicate data for WT strain are shown by multiple black points. (B) Examples of growth distributions of mutants classified into different groups which are colour coded as in A. The distribution in dark grey shows WT growth distribution. (C) Coefficient of variation (CV) vs. mean growth rate for all strains. WT values are shown in black; mutants of genes that localize to mitochondrial envelope in red. The points represent average values across replicates and the bars represent ±1 s.d. values. (D) % of WT-like cells in all mutants showing variable mutation outcome. It was calculated for all mutants showing significant reduction in mean proliferation rate and had significant proportion of cells growing as fast as the bulk of the WT proliferation distribution (Wilcoxon rank-sum test). (E) Functional class enrichment (GOslim) analysis for different classification groups show significantly enriched functional classes (hypergeometric test, FDR < 0.1). P – Biological Process, F – Molecular Function, C- Cellular Component. Bars show % of genes in a particular group (colour coded) being present in that particular functional class.
-
Figure 2—source data 1
Percentage of slow-growing cells in WT and mutant strains.
- https://doi.org/10.7554/eLife.38904.007
Figure 2—figure supplement 1
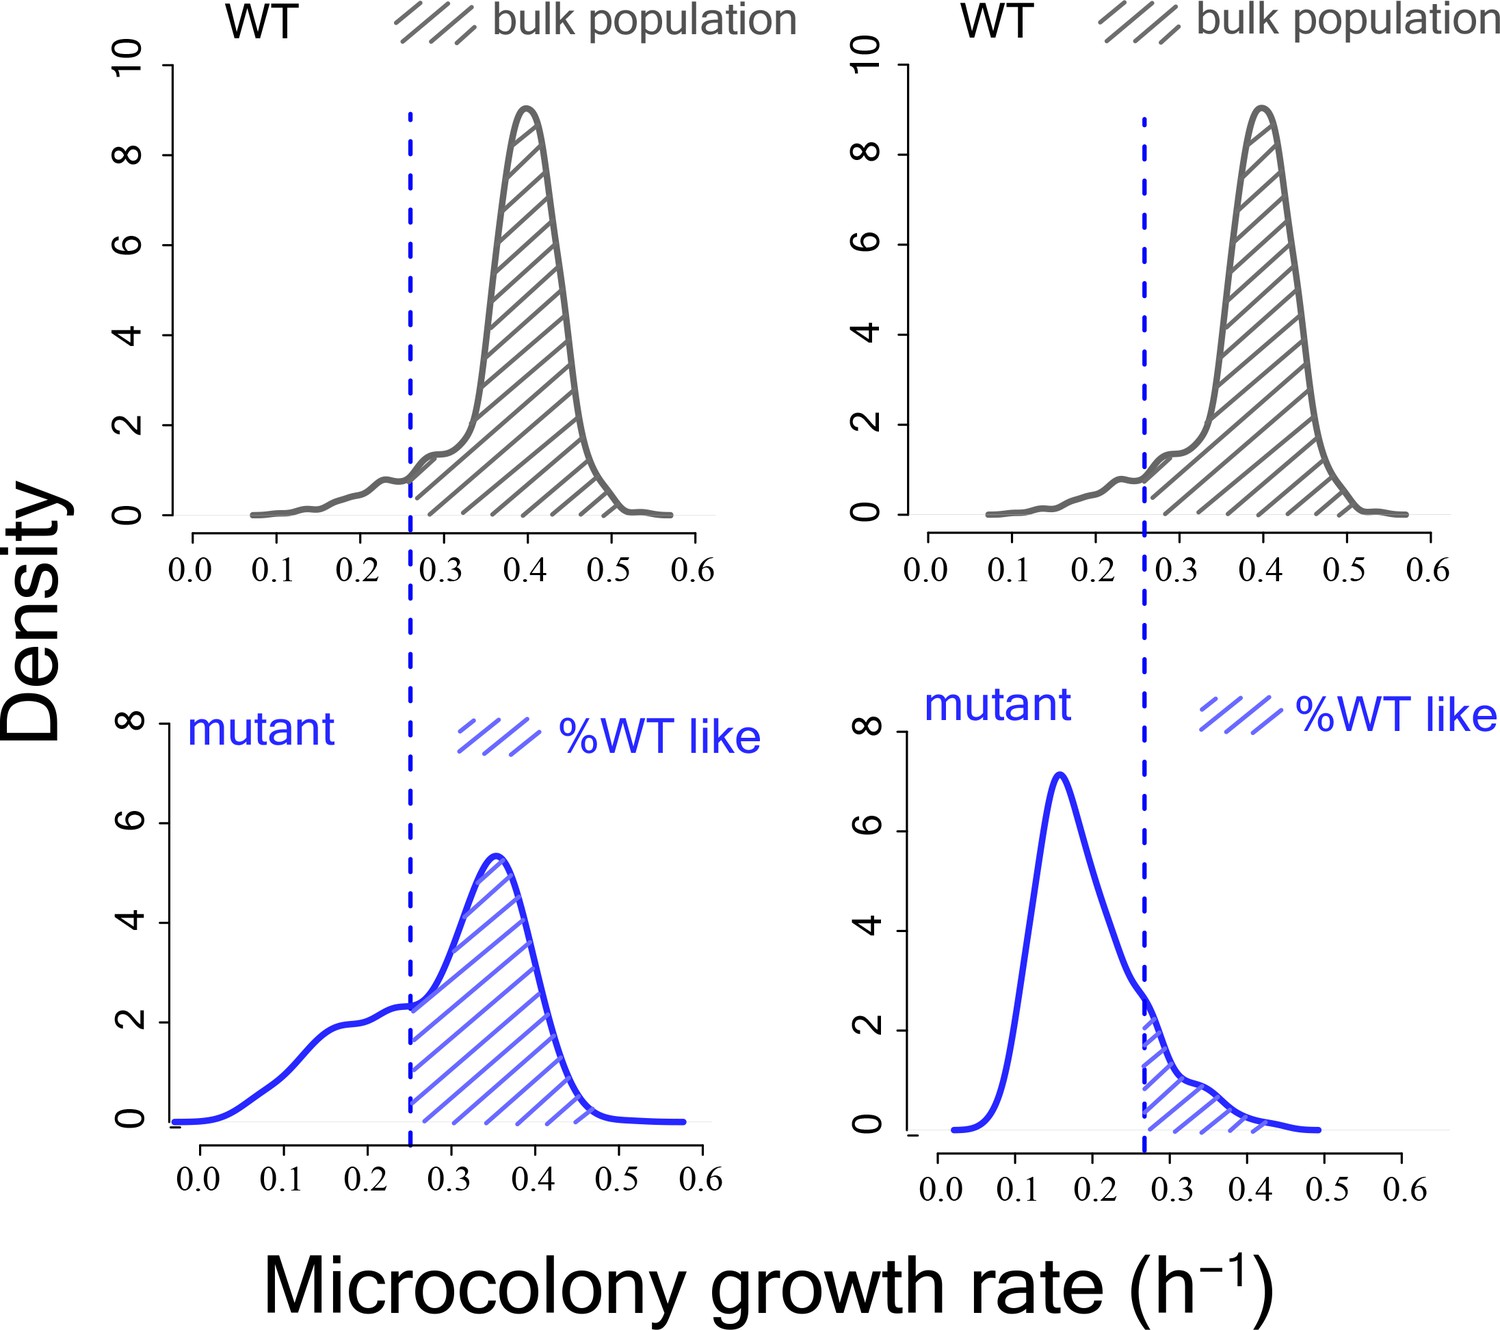
Schematic diagram showing calculation of %WT like cells from mutant proliferation distributions.
https://doi.org/10.7554/eLife.38904.005
Figure 2—figure supplement 2
Calculation of slow-growing sub-population and functional enrichment analysis.
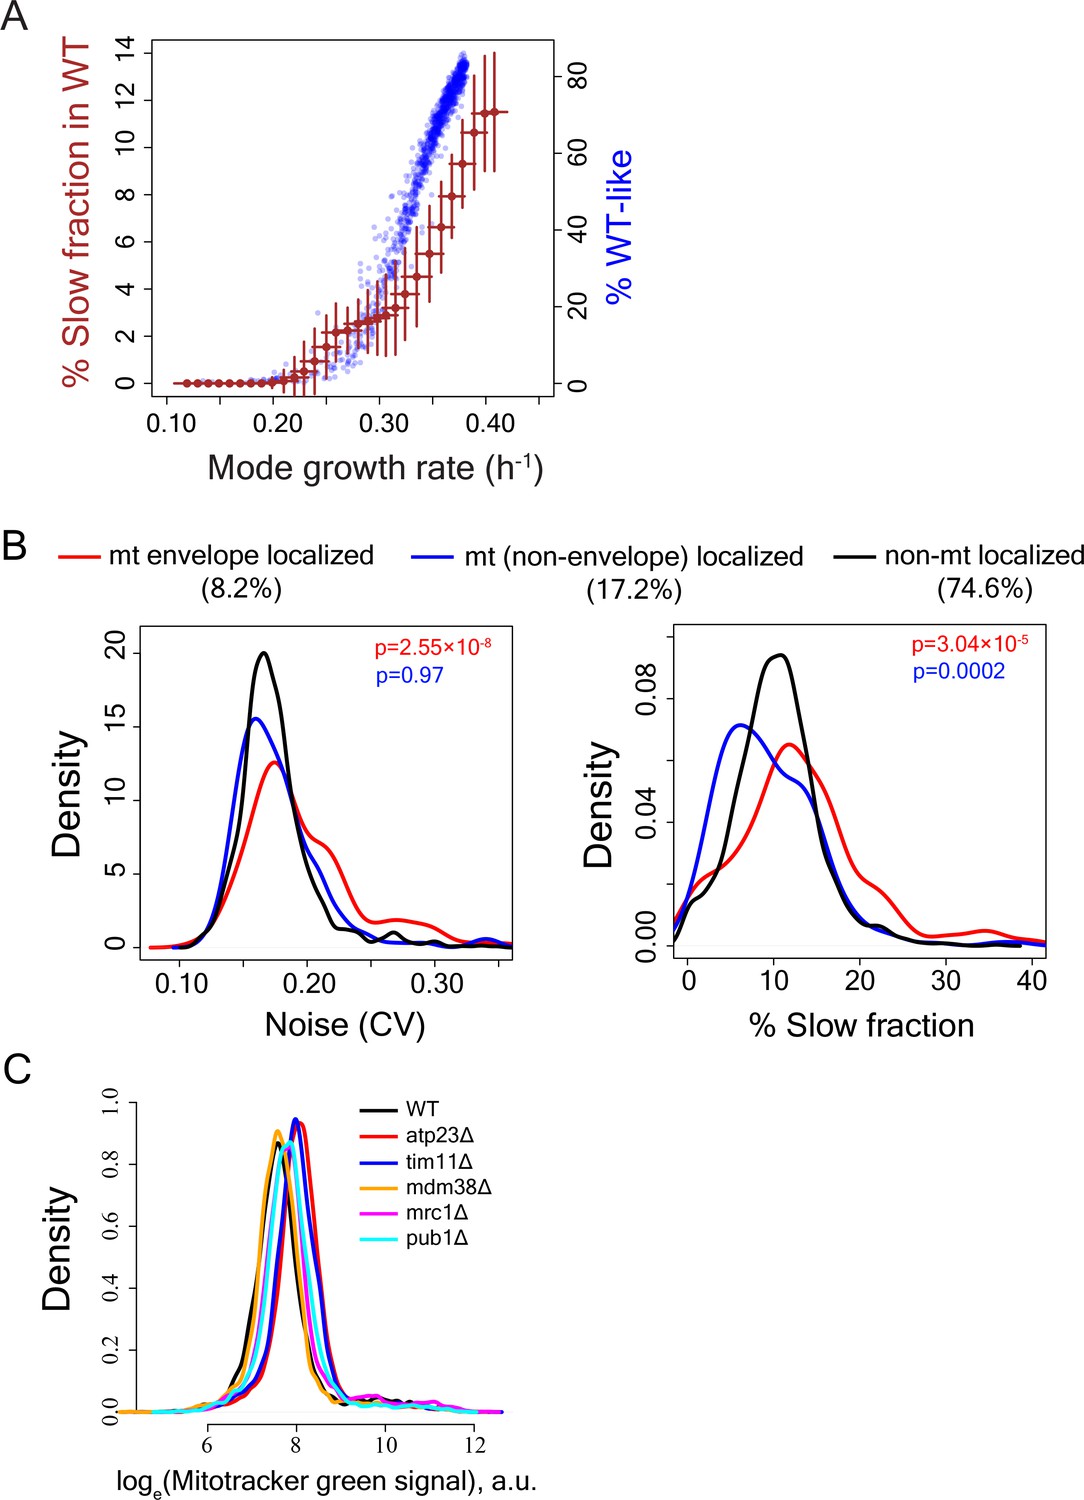
(A) To test how reduction in mode growth rate without any change in growth rate of slow sub-population might influence our capability to detect slow fraction, the main sub-population of WT strain was computationally moved by reducing mode growth rate in steps of 0.01 h−1 without altering the growth rate of the slow sub-population. This was done for all independent measurements of growth rate distributions for WT. The brown points show average value for all such independent computations and the error bars show ±1 s.d. values from all computations. The blue points show the %WT-like cells vs. mode growth rate (h−1) for mutants exhibiting incomplete penetrance (IP). A mutant was considered to be incompletely penetrant if its proliferation distribution had significant overlap with the bulk of the WT proliferation distribution. (B) Distribution of Noise (Coefficient of variation or CV) (left) and distribution of percentage slow fraction (right) for knock-out of genes that localize to mitochondrial envelope (in red), genes that localize to mitochondria (excluding mitochondrial envelope) (blue) and rest of the genes (black) in our dataset. P-value in red is from statistical test between red and black distributions and P-value in blue is from statistical test between blue and black distributions (Mann-Whitney U test). (C) Mitochondrial amount of WT and mutant strains as measured by Mitotracker green intensity using flow cytometry.
Figure 3 with 2 supplements
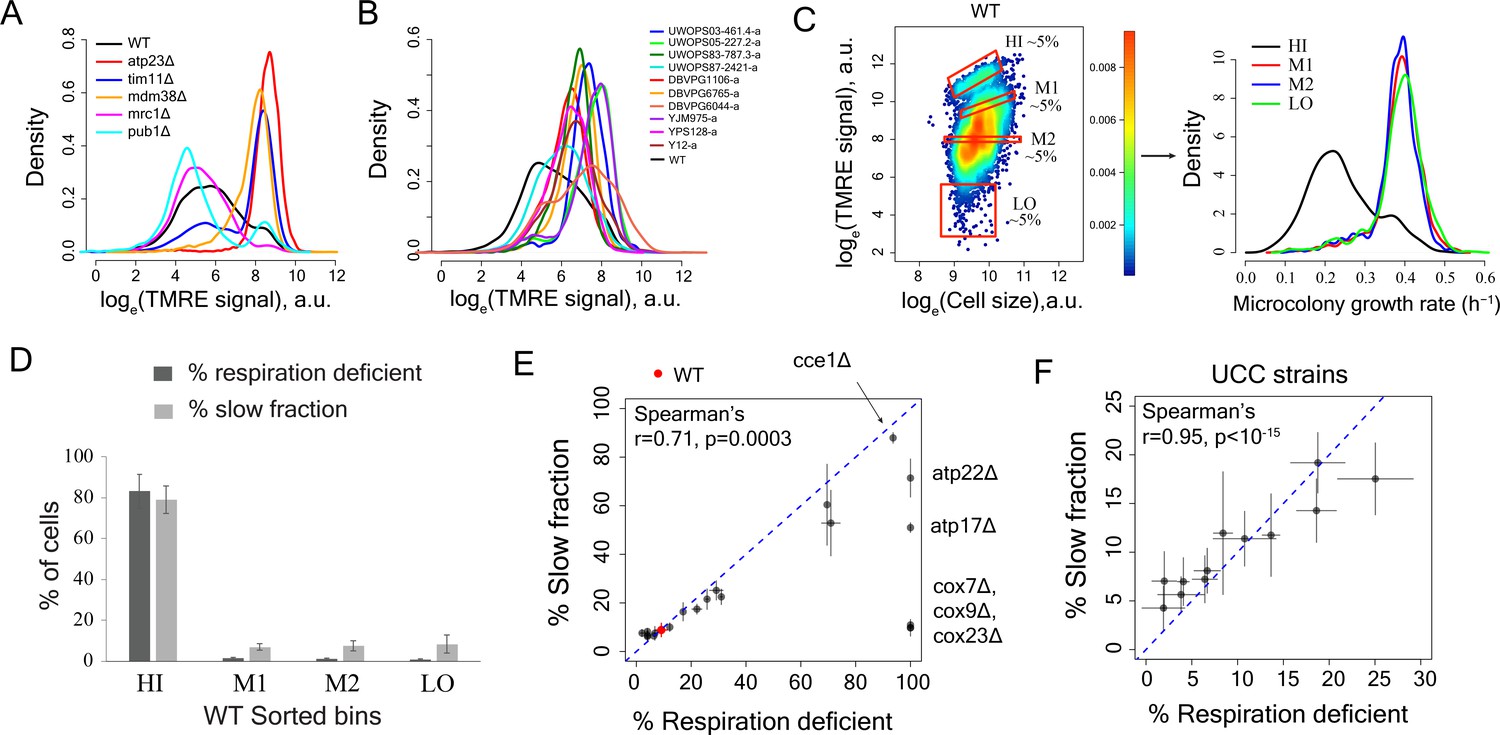
Variation in mitochondria potential across single cells underlies proliferation heterogeneity.
(A) TMRE stain intensity (log transformed) measured by flow cytometry in WT and deletion mutants. (B) TMRE intensity in WT and natural isolates of S. cerevisiae strains. (C) WT cells were sorted by TMRE signal intensity into four bins HI, M1, M2 and LO with gates as shown (~5% of the population sorted in each bin) and growth rate distributions were measured using high throughput microscopy setup. HI bin was enriched for slow growing cells. (D) % of respiration deficient cells in each bin from WT strain. The columns represent the average values from 12 independent experiments and the bars show ±1 s.d. values. (E) Percentage of respiration deficient cells in WT and mutant strains is positively correlated with the percentage of slow growing cells. The blue dotted line represents y = x line. The error bars represent ±1 s.d. measured from at least two biological replicates for each strain. (F) Percentage of respiration deficient cells in UCC strains (Dimitrov et al., 2009) is strongly positively correlated with the percentage of slow growing cells. The blue dotted line represents y = x line. The error bars represent ±1 s.d. measured from at least two biological replicates for each strain.
-
Figure 3—source data 1
TMRE intensity distribution in WT and mutant strains.
- https://doi.org/10.7554/eLife.38904.011
Figure 3—figure supplement 1

Cells with high mitochondrial membrane potential in mutant yeast strains, natural yeast isolates and diploid strain BY4743 show enrichment for slow-growing and respiration deficient cells.
(A) TMRE staining and sorting of BY4743 diploid strain. Bin HI showed higher percentage of slow cells in high throughput microscopy assay. Bin HI showed enrichment for respiration deficient cells. The results are from two independent experiments. (B) Sorting of mutant strains based on TMRE intensity and subsequent growth rate measurements showed slower growth in high TMRE cells (left). Cells with high TMRE signal were also enriched for respiration deficient cells in mutants (right). (C) Cells showing high TMRE intensity in Y12 strain (Mat a derivative) were enriched for slow growing fraction and respiration deficient cells. (D) Cells showing high TMRE intensity in YJM975 strain (Mat a derivative) were enriched for slow growing fraction and respiration deficient cells.
Figure 3—figure supplement 2
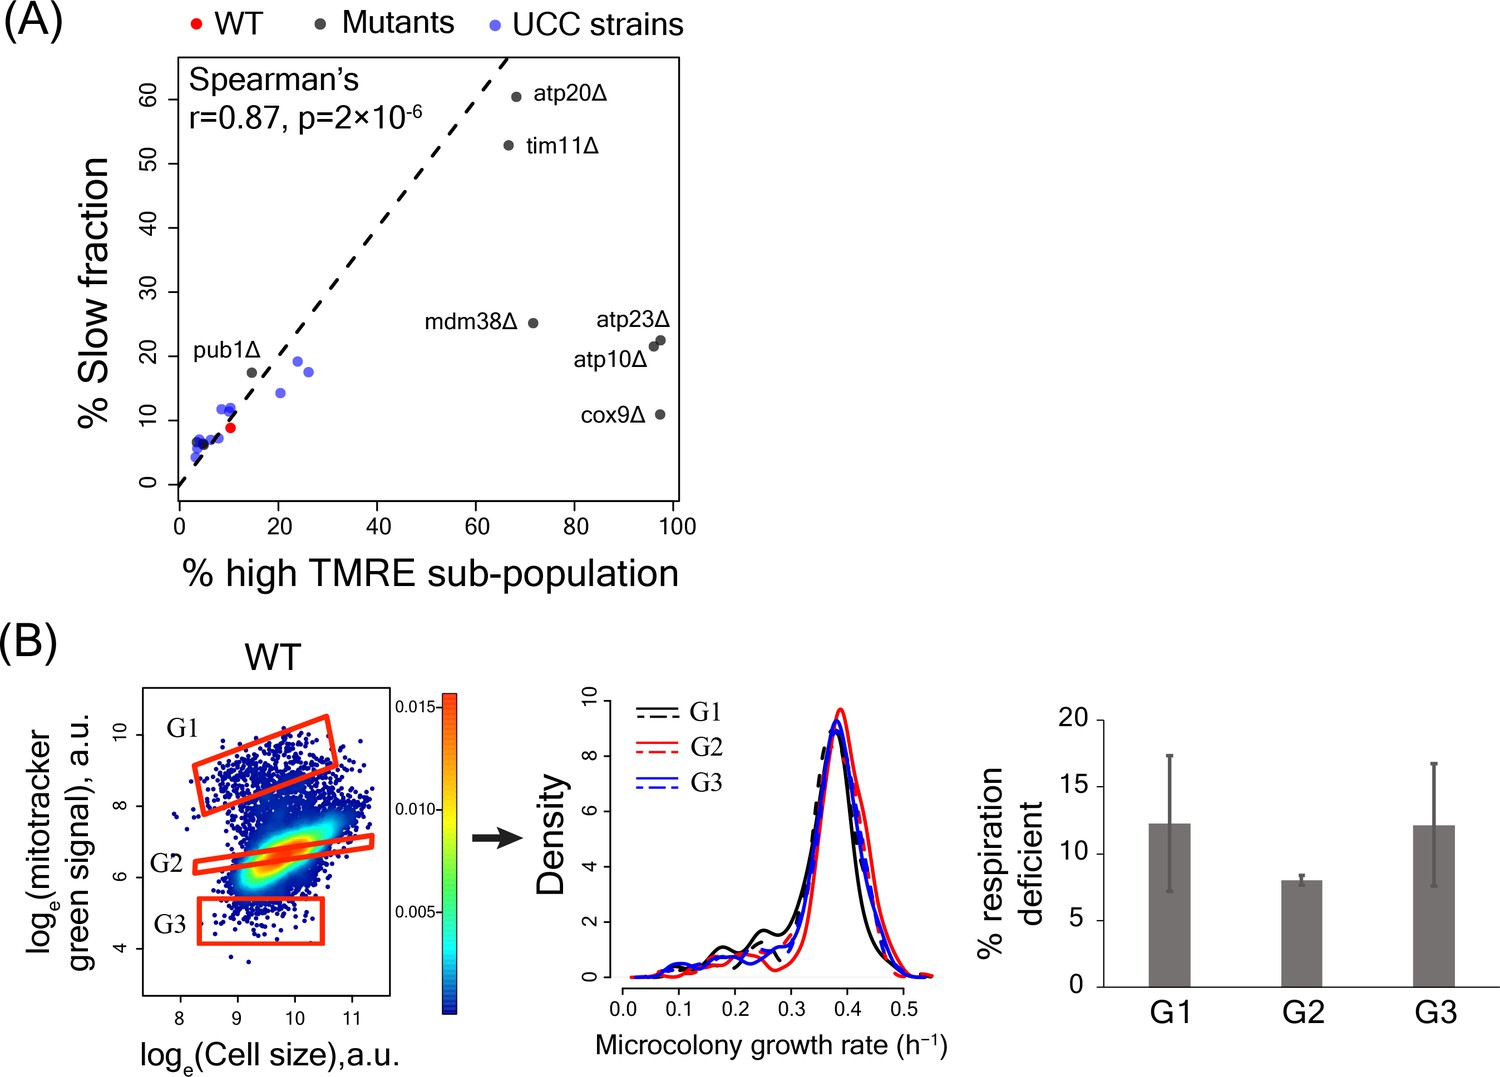
High TMRE signal but not mitotracker green signal predicts slow-growing subpopulation
(A) Percentage of slowly proliferating sub-population was significantly correlated with percentage of high TMRE cells across WT, deletion mutants and UCC strains. (B) Sorting WT cells by Mitotracker green intensity did not enrich for slow growth or percentage of respiration deficient cells in any sorted bin.
Figure 4 with 1 supplement
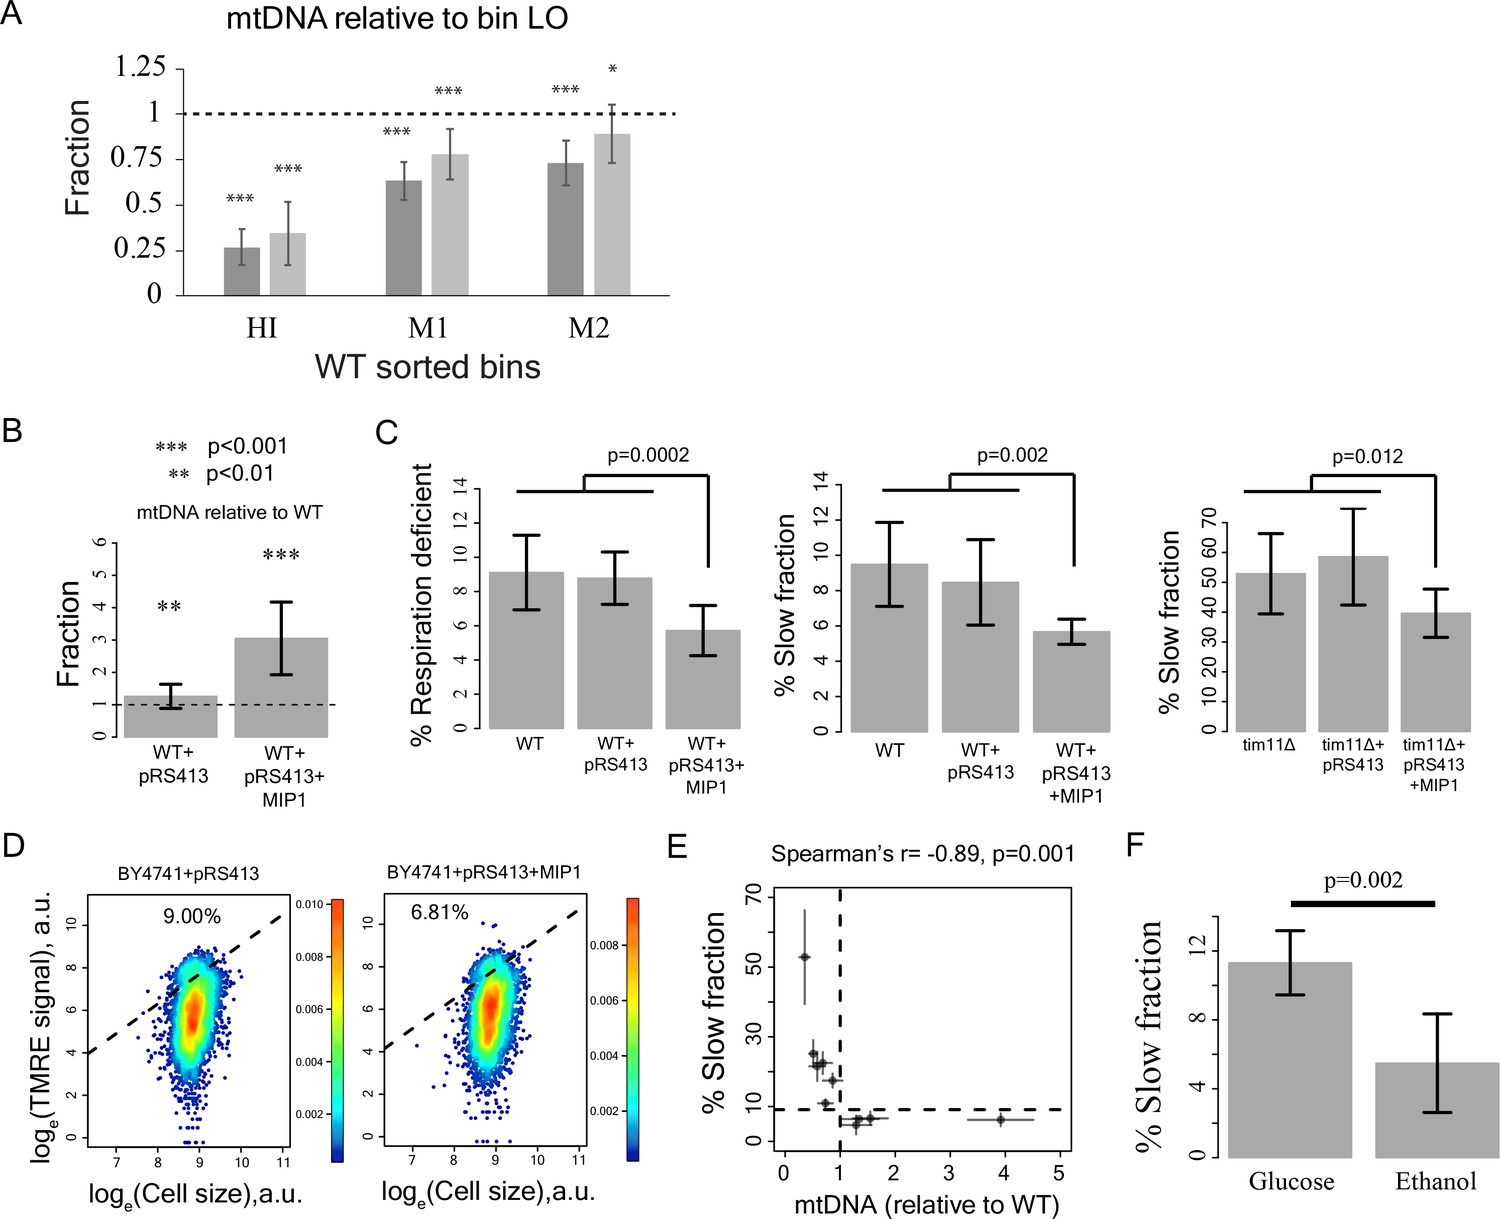
Reduction in mtDNA copy number causes slow growth.
(A) mitochondrial DNA (mtDNA) copy number in the sorted bins HI-LO from WT strain measured through quantitative PCR. Two columns show results from two independent experiments. The column represents average mtDNA copy number calculated based on five pairs of primers binding mtDNA and five pairs of primers binding nuDNA and three technical replicates for each of these primers. The bars show ±1 s.d. values. (B) Overexpression of Mip1 gene in WT strain led to significant increase in mtDNA copy number (C) Overexpression of Mip1 gene led to significant reduction in percentage of respiration deficient cells and in slow growing subpopulation in WT strain and tim11Δ mutant. Data are from at least four biological replicates. (D) Overexpression of MIP1 gene in WT strain reduced percentage of cells with high TMRE signal. (E) Percentage of slow growing sub-population was strongly correlated with mtDNA copy number in mutant strains. The dotted lines represent values for WT strain. The error bars represent ±1 s.d. values. (F) Pre-growing WT strain overnight in medium containing ethanol as sole carbon source (that required respiration) reduced percentage of slow growing sub-population by ~50% compared to pre-growth in medium containing glucose as the sole carbon source. Data are from six biological replicates.
-
Figure 4—source data 1
mtDNA copy number, % slow fraction and % respiration deficient cells in WT and mutant strains.
- https://doi.org/10.7554/eLife.38904.014
Figure 4—figure supplement 1
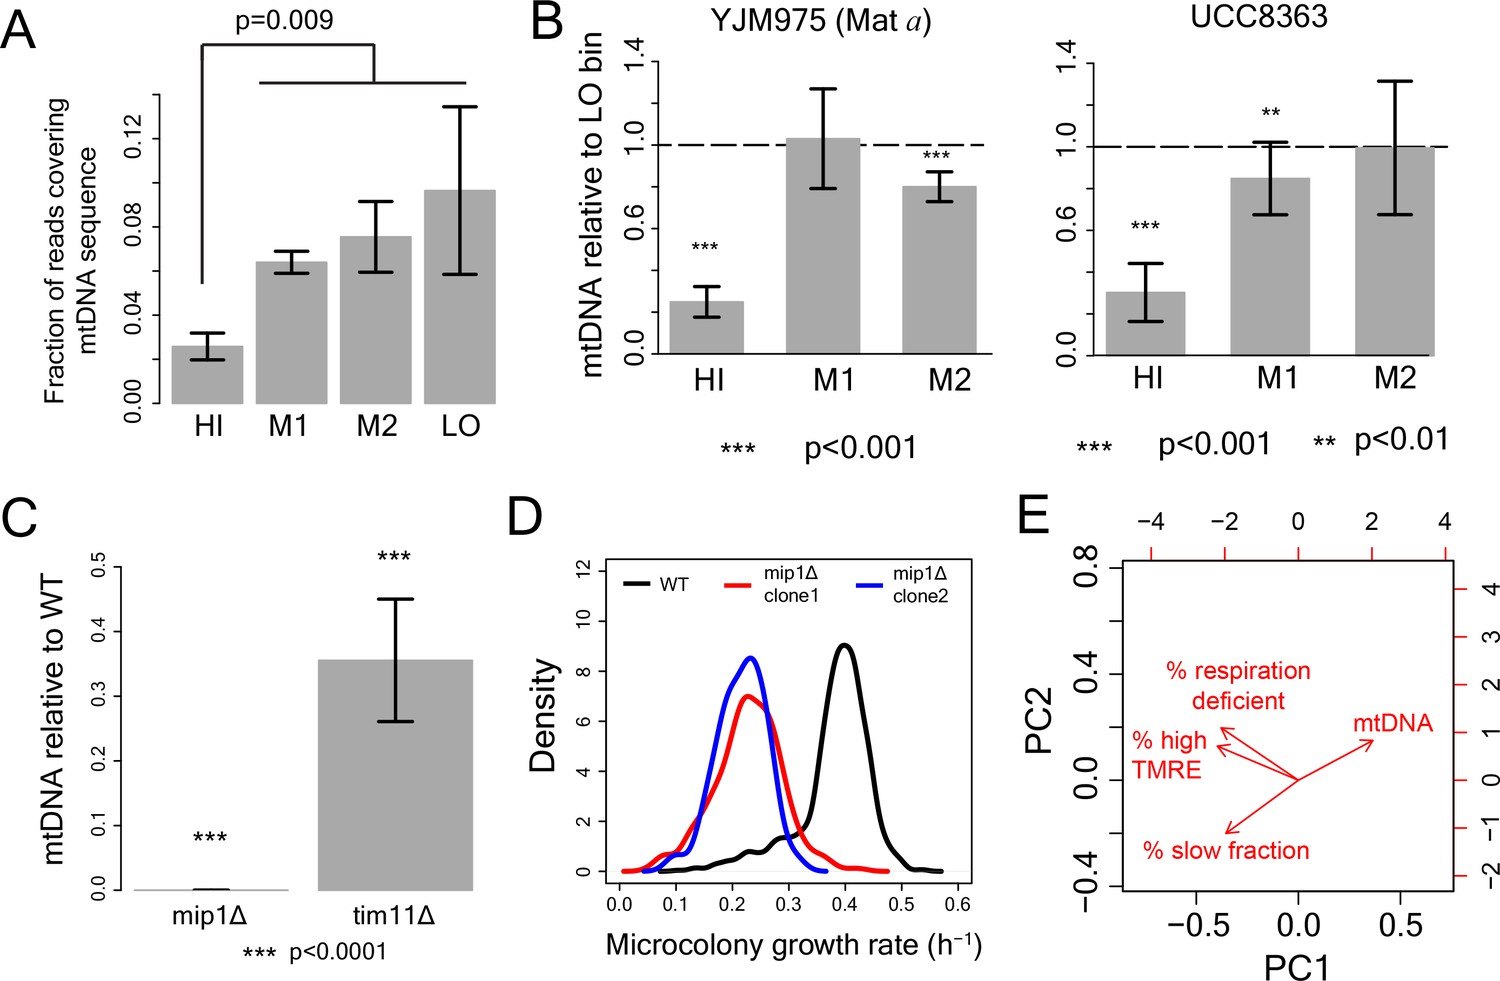
Role of mtDNA in generating slow growth and high mitochondrial membrane potential .
(A) From DNA sequencing, fraction of total reads mapping to mtDNA sequence in HI-LO bins from WT strain. The results are from three independent experiments. (B) mitochondrial DNA (mtDNA) copy number in the sorted bins HI-LO from a natural strain (YJM975 Mat a) and UCC8363 strain measured through quantitative PCR. (C–D) Knocking out Mip1 gene encoding for a mitochondrial DNA polymerase led to complete loss of mtDNA and also made the entire yeast population slow growing (Genga et al., 1986). (E) PCA analysis of WT and mutant strains with % slow fraction, % high TMRE cells, % respiration deficient cells and mtDNA copy number.
Figure 5 with 12 supplements
Cell-to-cell variation in mitochondria potential predicts single cell drug resistance.
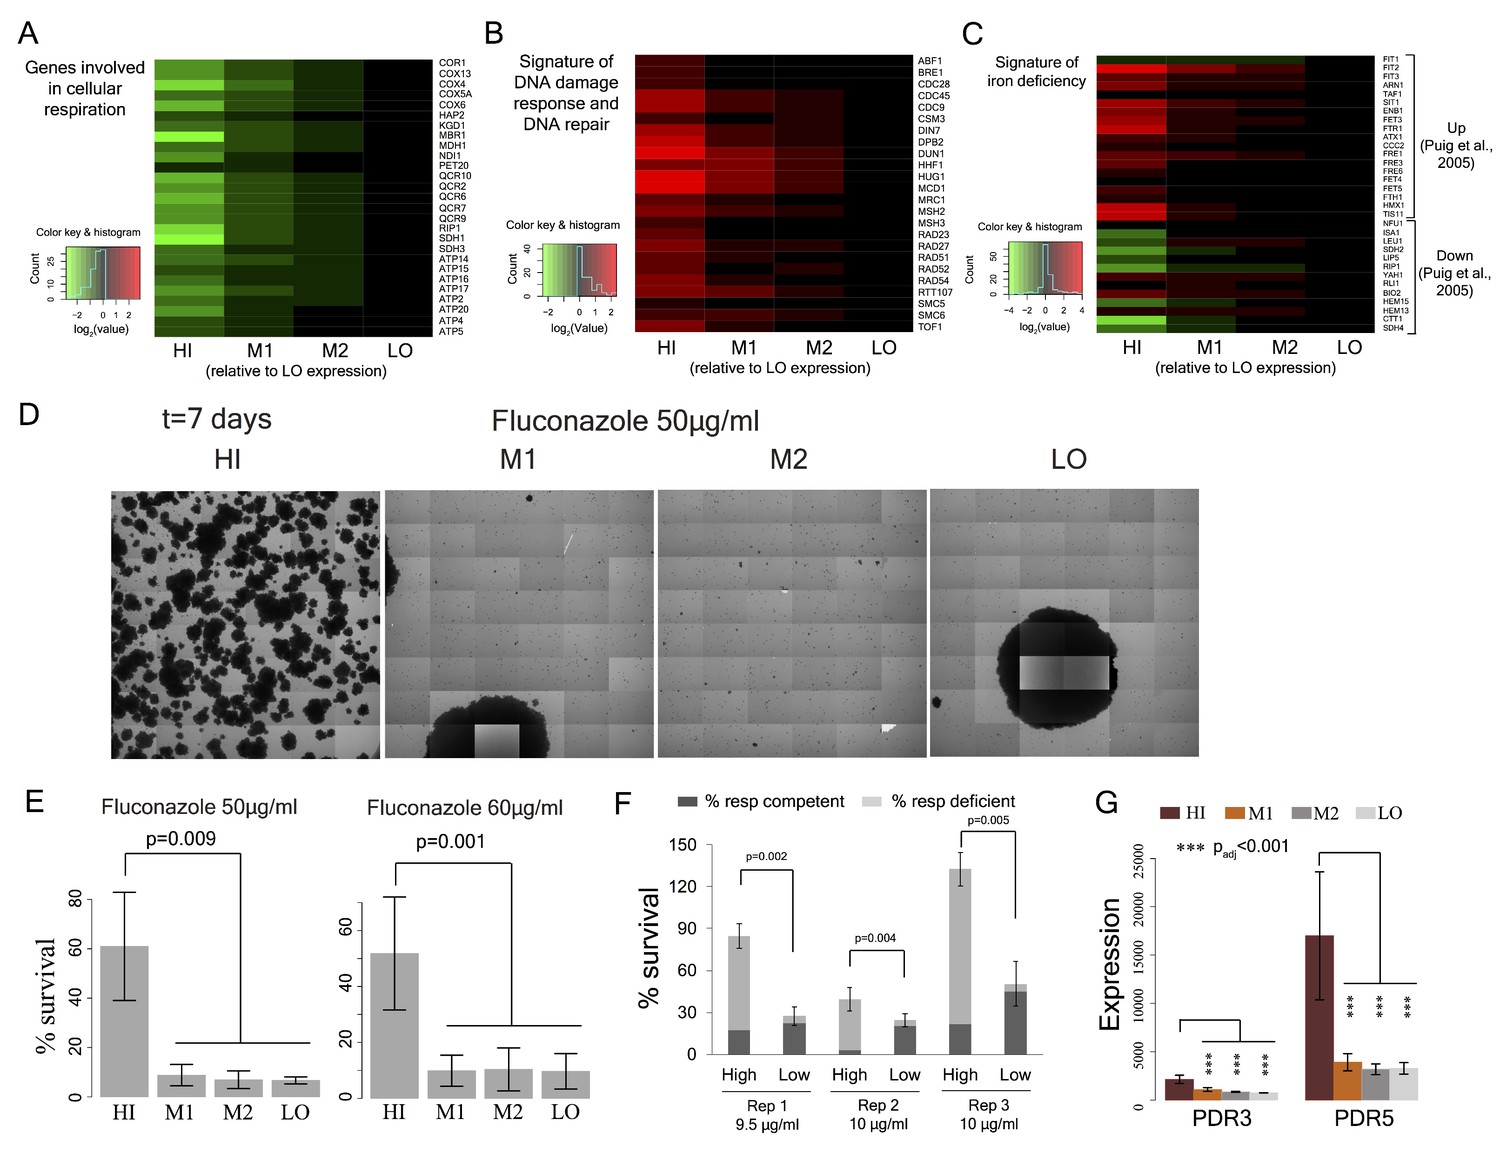
(A) Heatmap of expression of respiration genes in cells sorted by their TMRE signal intensity (bins HI-LO). (B) Heatmap of expression of DNA damage response and DNA repair genes. (C) Heatmap of expression of genes associated with iron deficiency (Puig et al., 2005; Veatch et al., 2009). Data are from four independent experiments. (D) Sorted bins from WT cells were grown in a commonly used antifungal drug fluconazole and were observed under microscope for growth over 7 days. The images show growth of cells in bins HI, M1, M2 and LO in 50 μg/ml of fluconazole after 7 days. (E) Cells of HI bin showed significantly higher survival compared to other bins in both 50 μg/ml (three independent experiments) and 60 μg/ml fluconazole (four independent experiments). Cells were grown in liquid medium supplemented with fluconazole on microscopy plates and viability was calculated from microscopic observations over 7 days. Colonies showing growth rate above 0.02 h−1 after first time point were considered to be survivors. Error bars show ±1 s.d. values. (F) Percentage survival of high and low TMRE cells on fluconazole plates. High TMRE cells showed higher survival than low TMRE cells (Mann-Whitney U test). A substantial fraction of surviving high TMRE cells were respiration competent. The error bars represent ±1 s.d. values from six technical replicates for each bin. X-axis shows fluconazole concentrations used from three independent experiments. (G) From RNA sequencing data, cells from HI bin showed significantly higher expression of multidrug transporter PDR5 gene and its transcriptional activator PDR3 compared to cells from bins M1, M2 and LO. Results are from four independent experiments.
-
Figure 5—source data 1
Transcriptomic changes and increased antifungal resistance in high TMRE cells.
- https://doi.org/10.7554/eLife.38904.028
Figure 5—figure supplement 1
Expression patterns of diverse gene functional classes in cells with low, medium and high mitochondrial membrane potential.
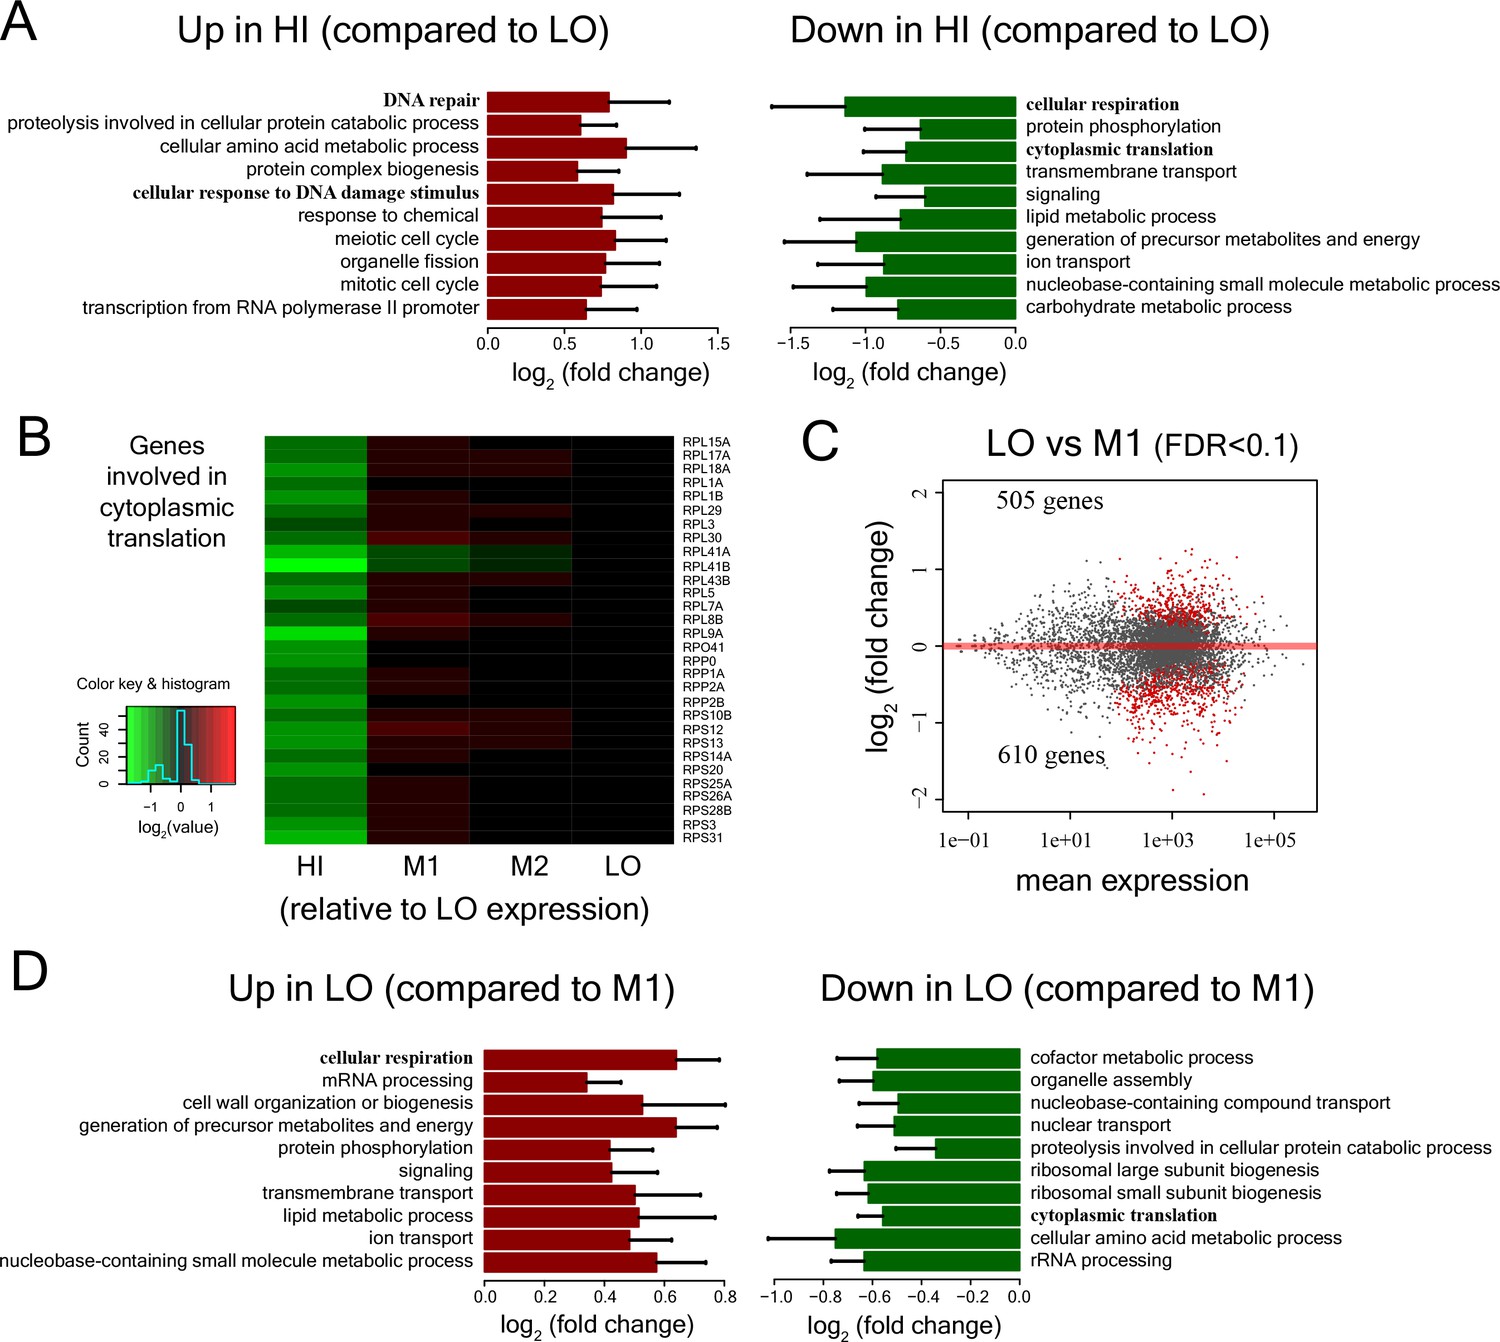
(A) Functional classes showing significant enrichment among genes over-expressed in cells of bin HI compared to LO (hypergeometric test, p<0.01) and significantly enriched functional classes among genes showing lower expression in cells of bin HI compared to bin LO and the corresponding fold-change in expression. (B) Heatmap of expression of genes involved in cytoplasmic translation. (C) MA plot (Langmead and Salzberg, 2012) showing mean expression of genes vs. fold change in expression for comparison between cells in bin LO and bin M1. Differentially expressed genes are marked in red (FDR < 0.1). (D) Functional classes showing significant enrichment among genes over-expressed in cells of bin LO compared to M1 (p<0.01) and significantly enriched functional classes among genes showing lower expression in cells of bin LO compared to bin M1.
Figure 5—figure supplement 2
Stress survival and expression of stress response genes in cells with different levels of mitochondrial membrane potential.
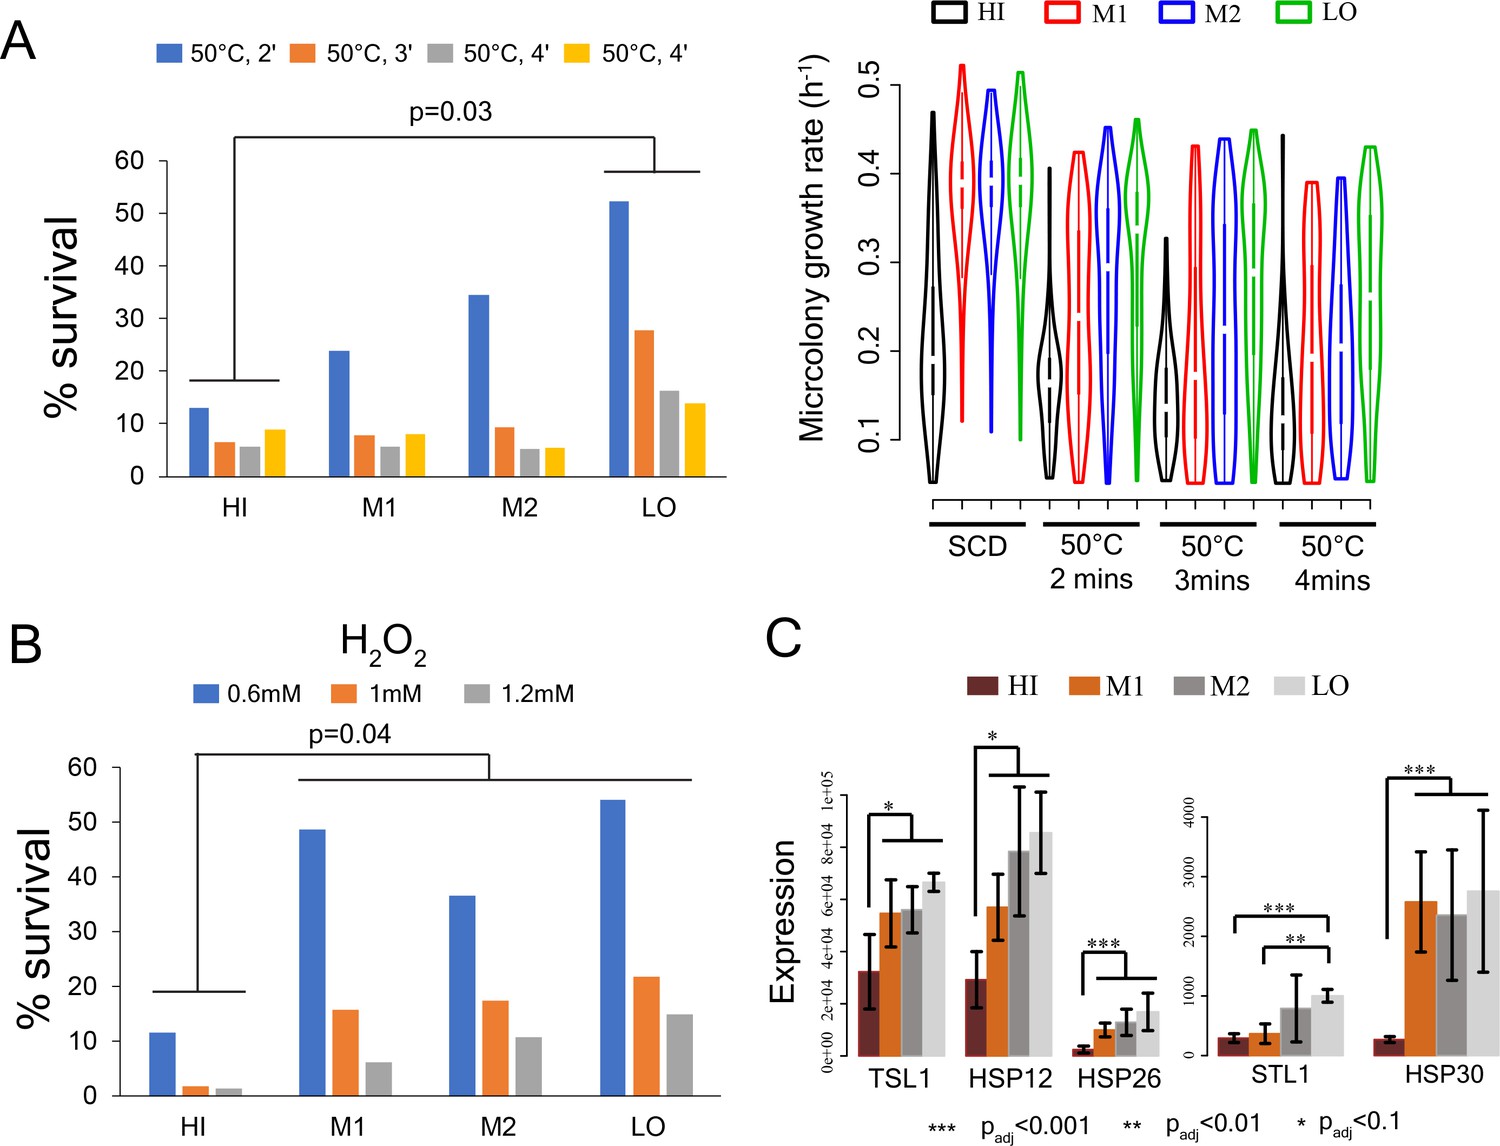
(A) Left - % survival of cells from sorted bins HI-LO from WT strain after heat shock at 50°C for 2 min, 3 min and 4 min (Mann-Whitney U test). Right - Growth rate of cells in sorted bins HI, M1, M2 and LO from WT strain in SCD medium without any heat shock, after heat shock at 50°C for 2mins, 3mins and 4mins. (B) % survival of cells from HI-LO bins in 0.6 mM, 1 mM and 1.2 mM hydrogen peroxide (Mann-Whitney U test) (C) Expression of some key heat shock and stress response genes in bins HI-LO from RNA sequencing (data from four independent experiments).
Figure 5—figure supplement 3

Molecular pathways that underlie increased drug resistance in cells with high mitochondrial membrane potential.
(A) Percentage survival of sorted cells from bins HI, M1, M2, and LO from diploid BY4743 strain in 50 µg/ml of antifungal drug fluconazole. Cells from bin HI exhibited higher drug survival (results from two independent experiments). (B) PDR5-GFP strain was stained with TMRE and a sub-population of cells with high TMRE signal (corresponding to bin HI) also showed higher expression of PDR5 gene. (C) Deletion of the transcriptional activator PDR3 in PDR5-GFP strain wiped out the sub-population of cells showing higher expression of PDR5 gene. (D) Heatmap depicting expression of ergosterol biosynthesis genes in bins HI-LO sorted from WT cells.
Figure 5—figure supplement 4
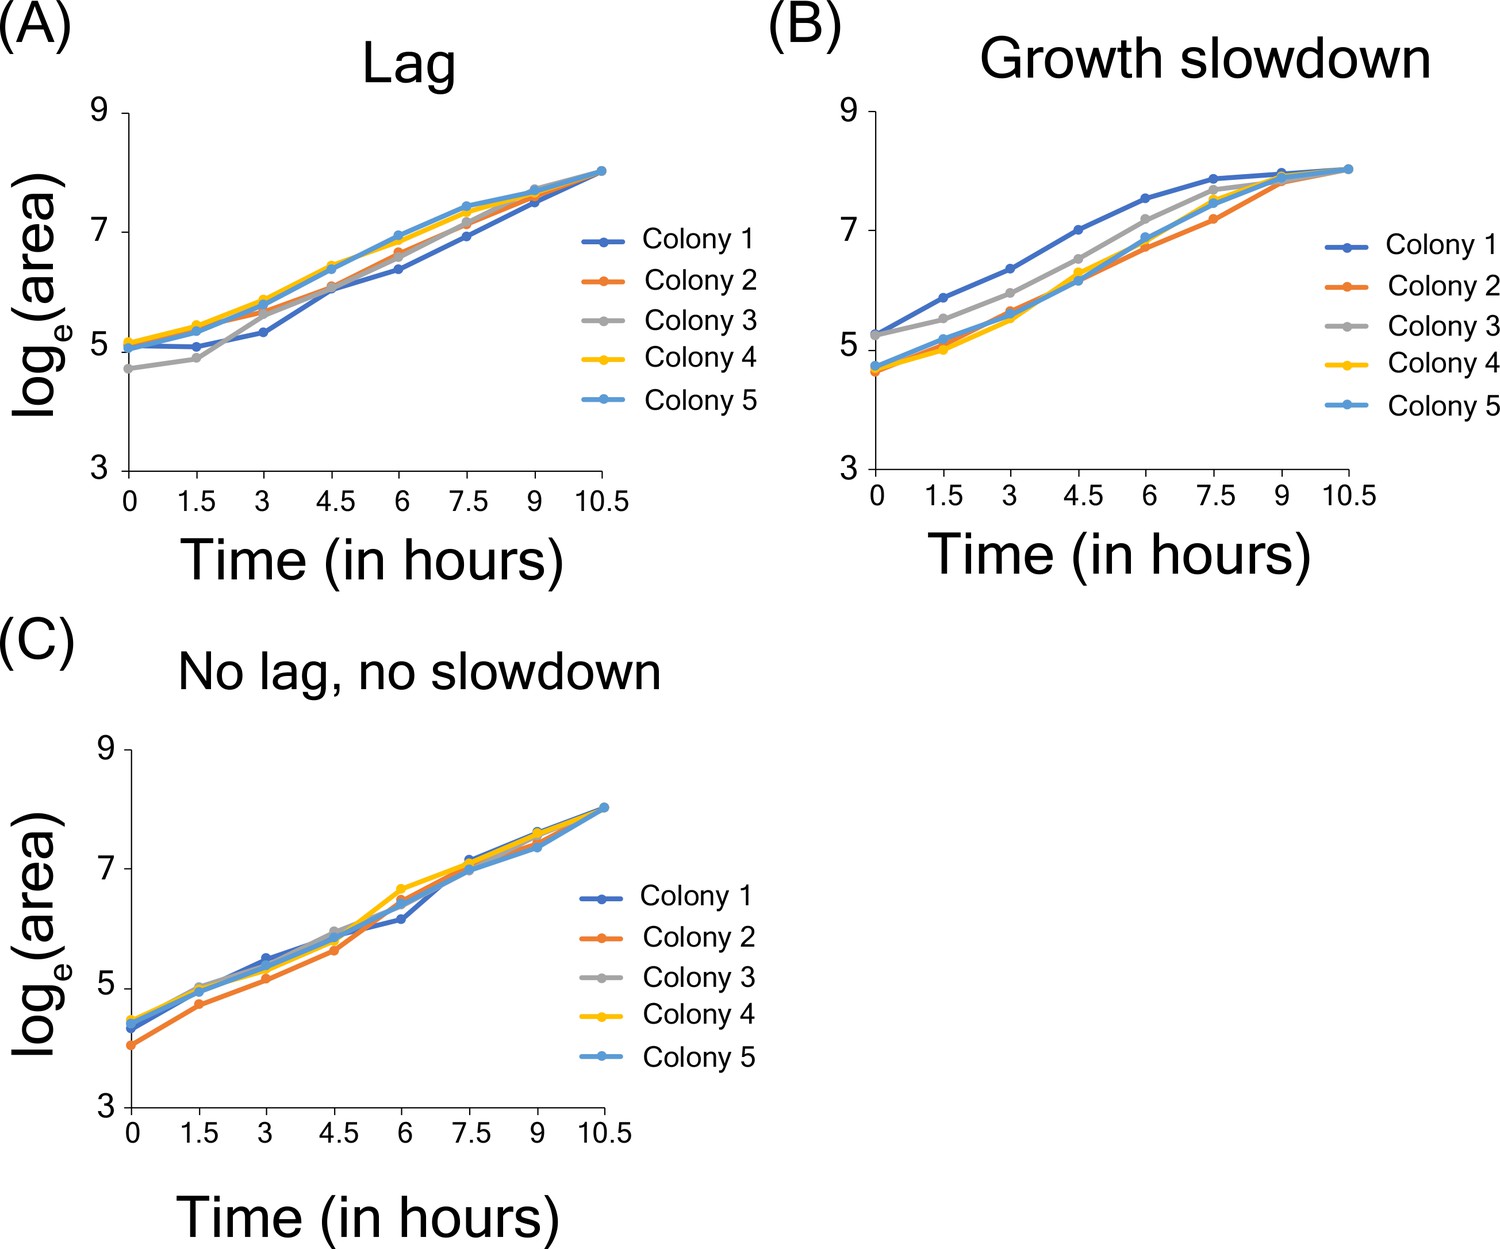
Growth lag and slowdown in high-throughput microscopy assay.
(A) Example of microcolonies showing lag phase in growth. (B) Example of microcolonies showing growth slow down near the end of observation (C) Example of cells showing no lag and no growth slowdown.
Figure 5—figure supplement 5

Correlation of growth rates of deletion mutants within experimental replicates and with published datasets.
(A) Correlation between replicate measurements of mode growth rate of all strains and between replicate measurements of percentage slow fraction as well as between mode growth rate and percentage slow fraction. The panels below the diagonal show plots with the actual data points and the numbers above the diagonal show correlation values (generated using R package corrgram). (B) Correlation of mean growth rate for deletion mutants from our experiment and published data. The pie charts below the diagonal show magnitude of correlation and the numbers above the diagonal show the actual correlation values.
Figure 5—figure supplement 6

Test for recovery of growth rate, mtDNA copy number and respiration capability in slow-growing sub-population.
(A) Proliferation distribution measurement after 48 hr growth of sorted bins HI-LO from WT strain. (B) mtDNA copy number (using quantitative PCR) of colonies from sorted bins (HI-LO) from WT strain after 7 day growth on SCD plate. (C) Growth rate distribution measurement of small (respiration deficient) and big (respiration competent) colonies from high TMRE bin of WT strain after 48 hr of growth in SCD. Colonies were picked from SCDG plates after 7 days of growth and each curve represents data from one clone. (D) Percentage of colonies that regained capability to respire from the sub-population in the TMRE sorted bins HI, M1, M2 and LO in WT strain. Each data point shows result from an independent experiment. (E) Percentage of respiration deficient cells in sorted bins HI-LO from WT strain right after sorting (left), following 24 hr of growth in SCD medium (middle) and after 48 hr of growth in SCD medium (right).
Figure 5—figure supplement 7
Slow to fast switching in sorted sub-populations and in gene deletion mutants.
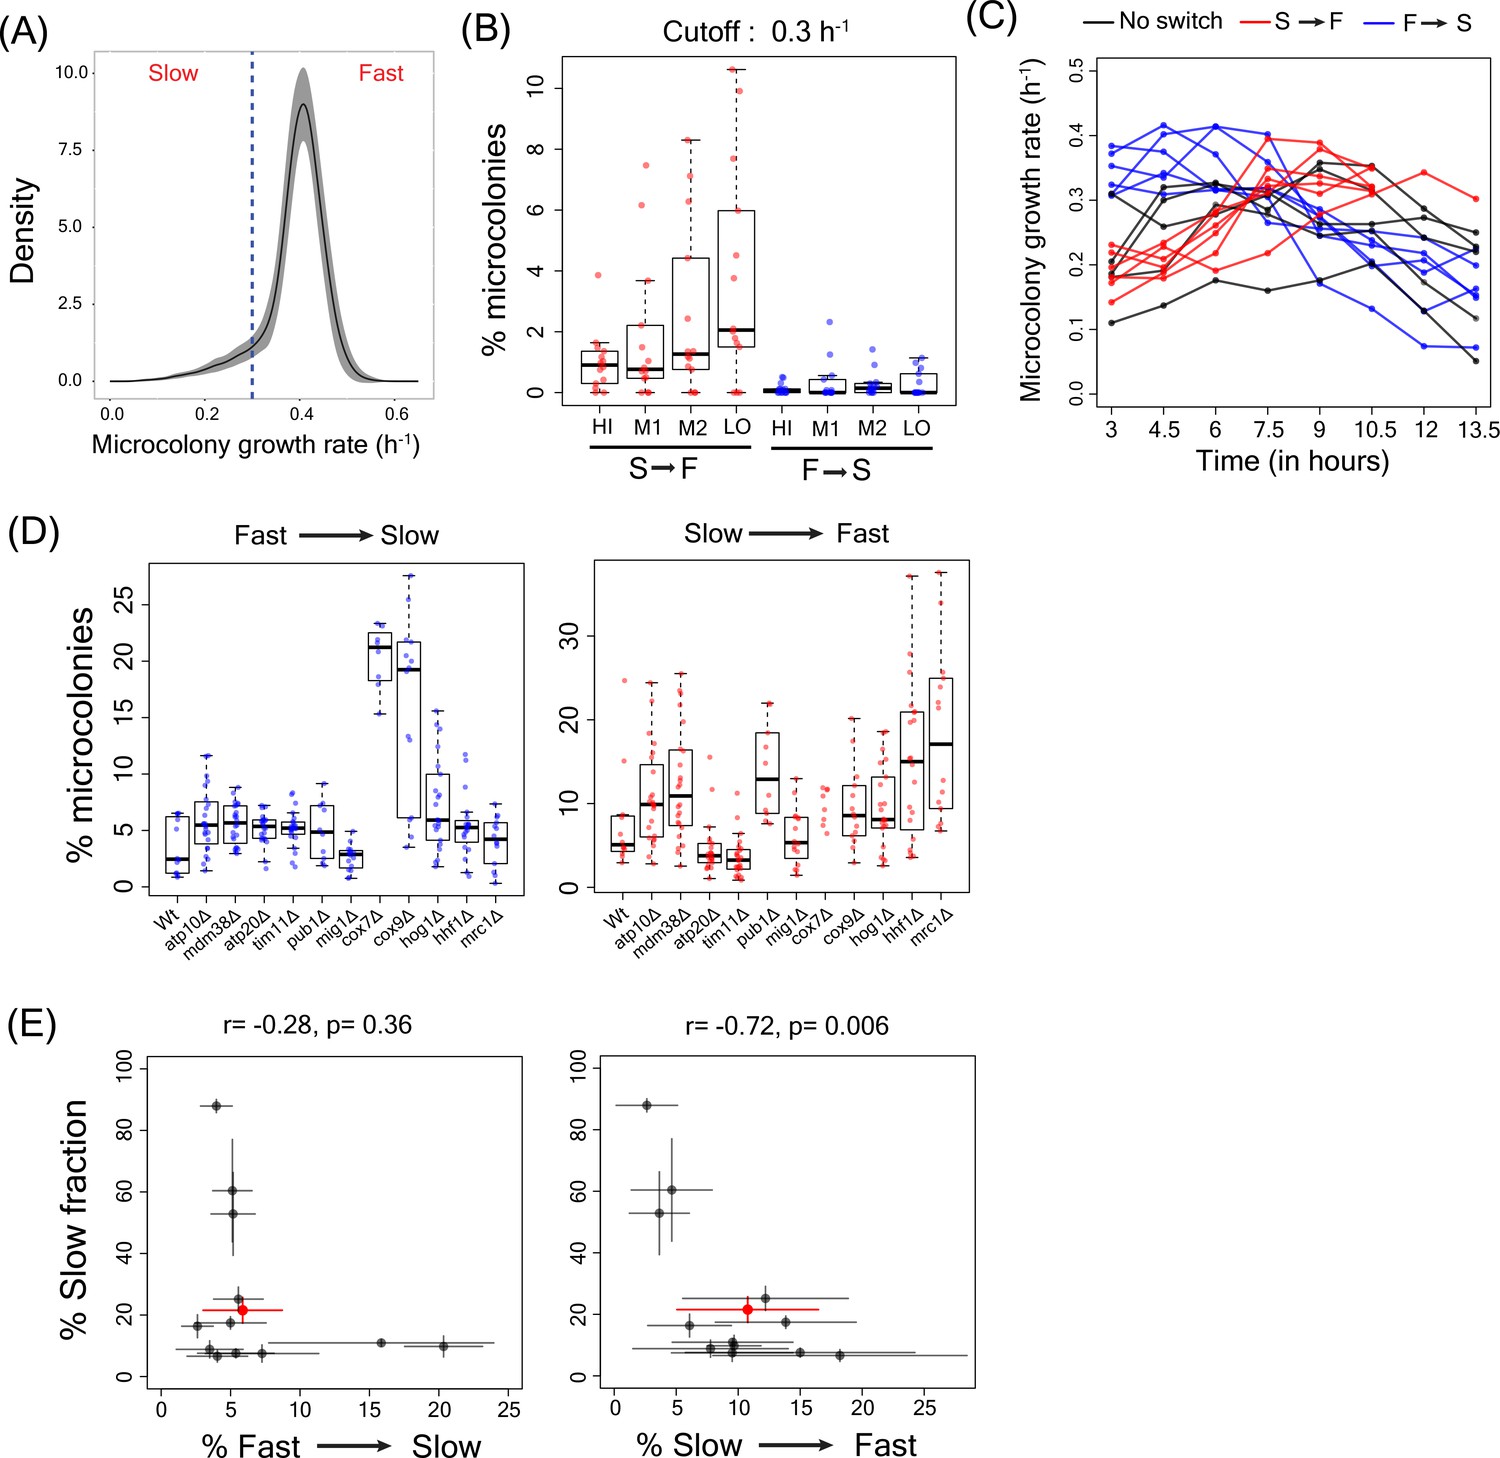
(A) Figure showing the microcolony growth rate distribution for the WT strain. The dotted line represents the growth rate of 0.3 h−1 which was used as cutoff for defining slow and fast cells and to estimate slow to fast and fast to slow switching in microcolonies. (B) Percentage of microcolonies showing slow to fast switching and fast to slow switching in the sub-population of cells in TMRE sorted bins HI, M1, M2 and LO from WT strain. (C) Data showing the growth rates of microcolonies showing slow to fast switching (in red), fast to slow switching (in blue) and no switching (in black) from sorted bins in WT strain (D) Percentage of microcolonies showing slow to fast and fast to slow switching in WT strain and other deletion strains using the growth rate cutoff of 0.3 h−1. (E) Correlation between percentage of cells showing fast to slow switching in WT and deletion strains and percentage of cells showing slow to fast transition with percentage of slow growing sub-population.
Figure 5—figure supplement 8

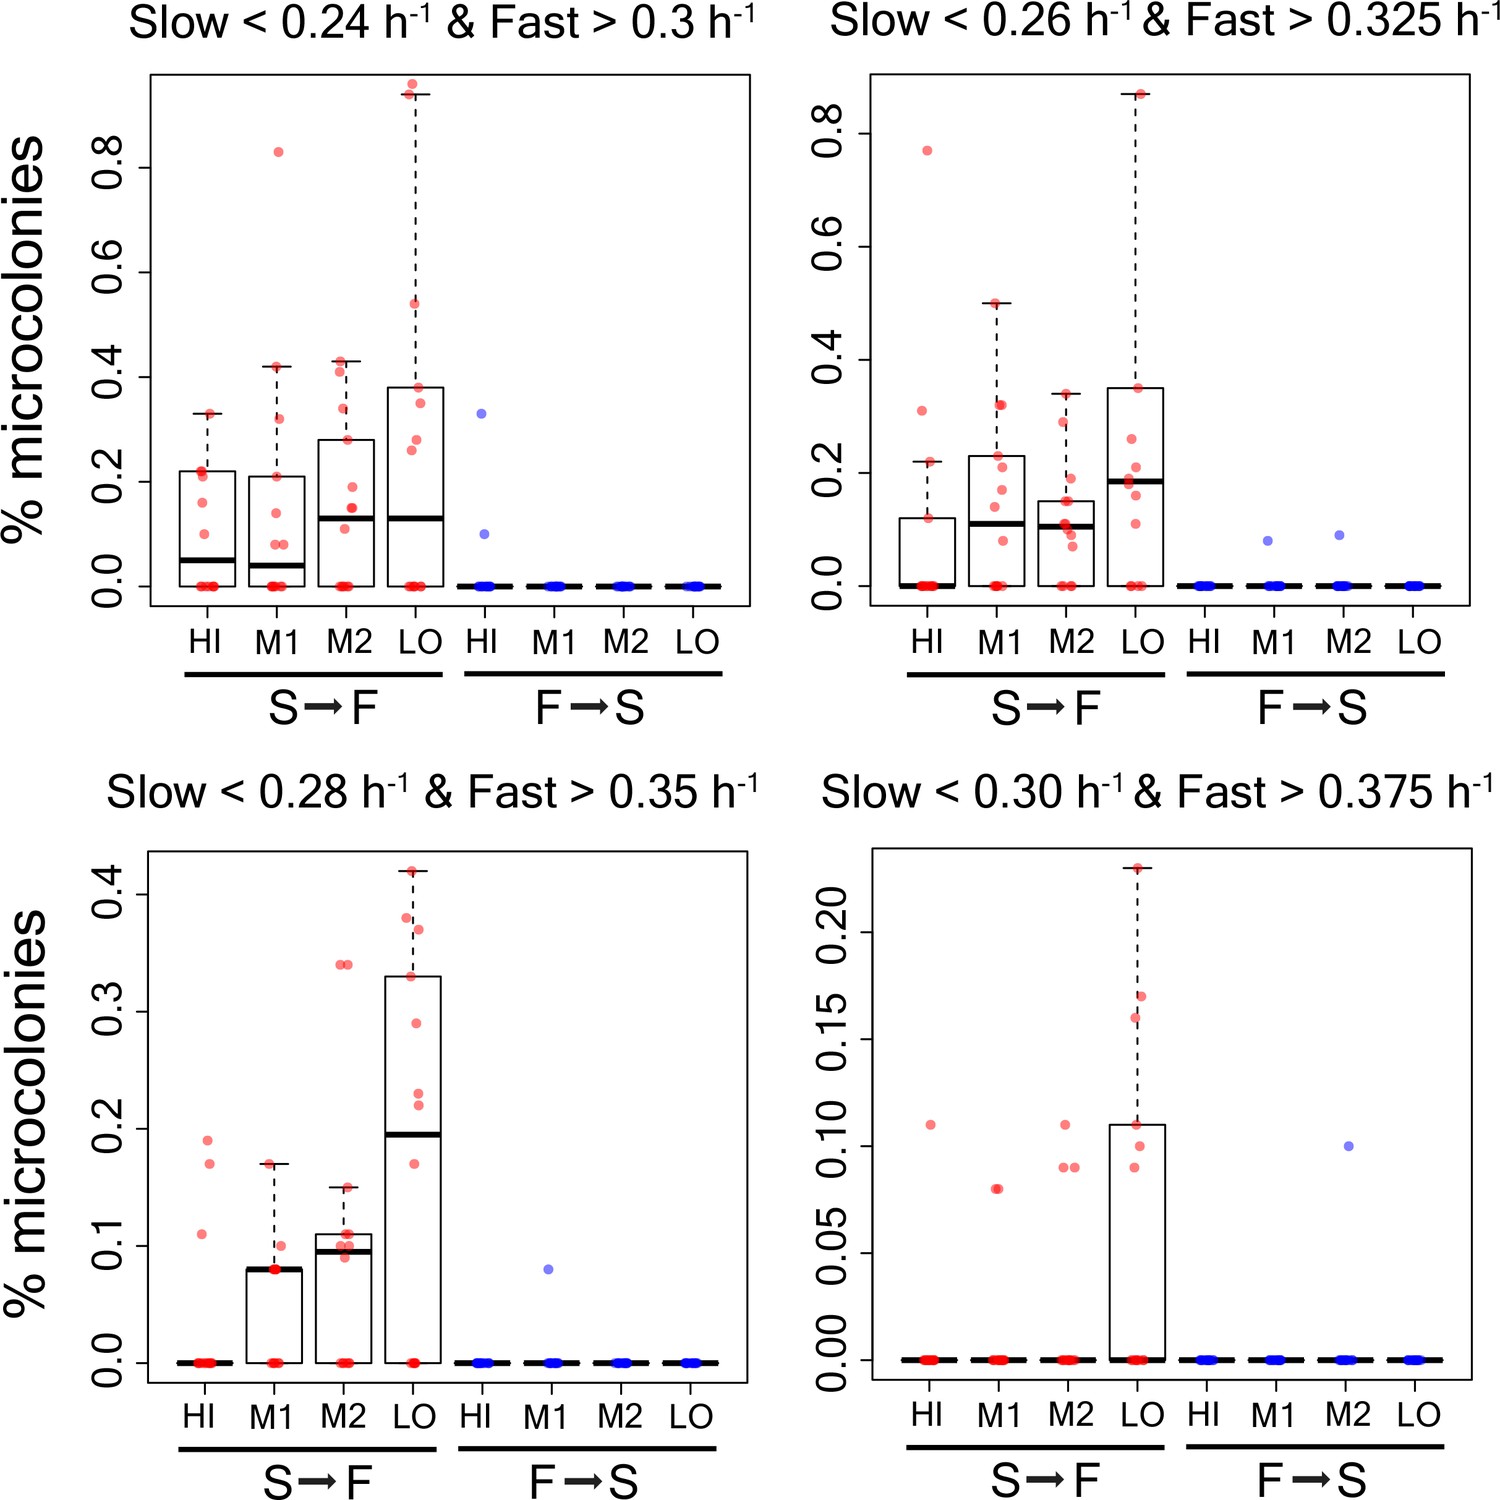
Percentage of microcolonies showing slow to fast switching and fast to slow switching in the sub-population of cells in TMRE sorted bins HI, M1, M2 and LO from WT strain using different growth rate cutoffs (0.24 h−1, 0.26 h−1,0.28h−1,0.30h−1,0.32h−1,0.34h−1, and 0.36 h−1).
Each data point shows result from an independent experiment.
Figure 5—figure supplement 9
Percentage of microcolonies showing slow to fast switching and fast to slow switching in the sub-population of cells in TMRE sorted bins HI, M1, M2 and LO from WT strain using alternative growth rate cutoffs as shown in the figure.
https://doi.org/10.7554/eLife.38904.024
Figure 5—figure supplement 10
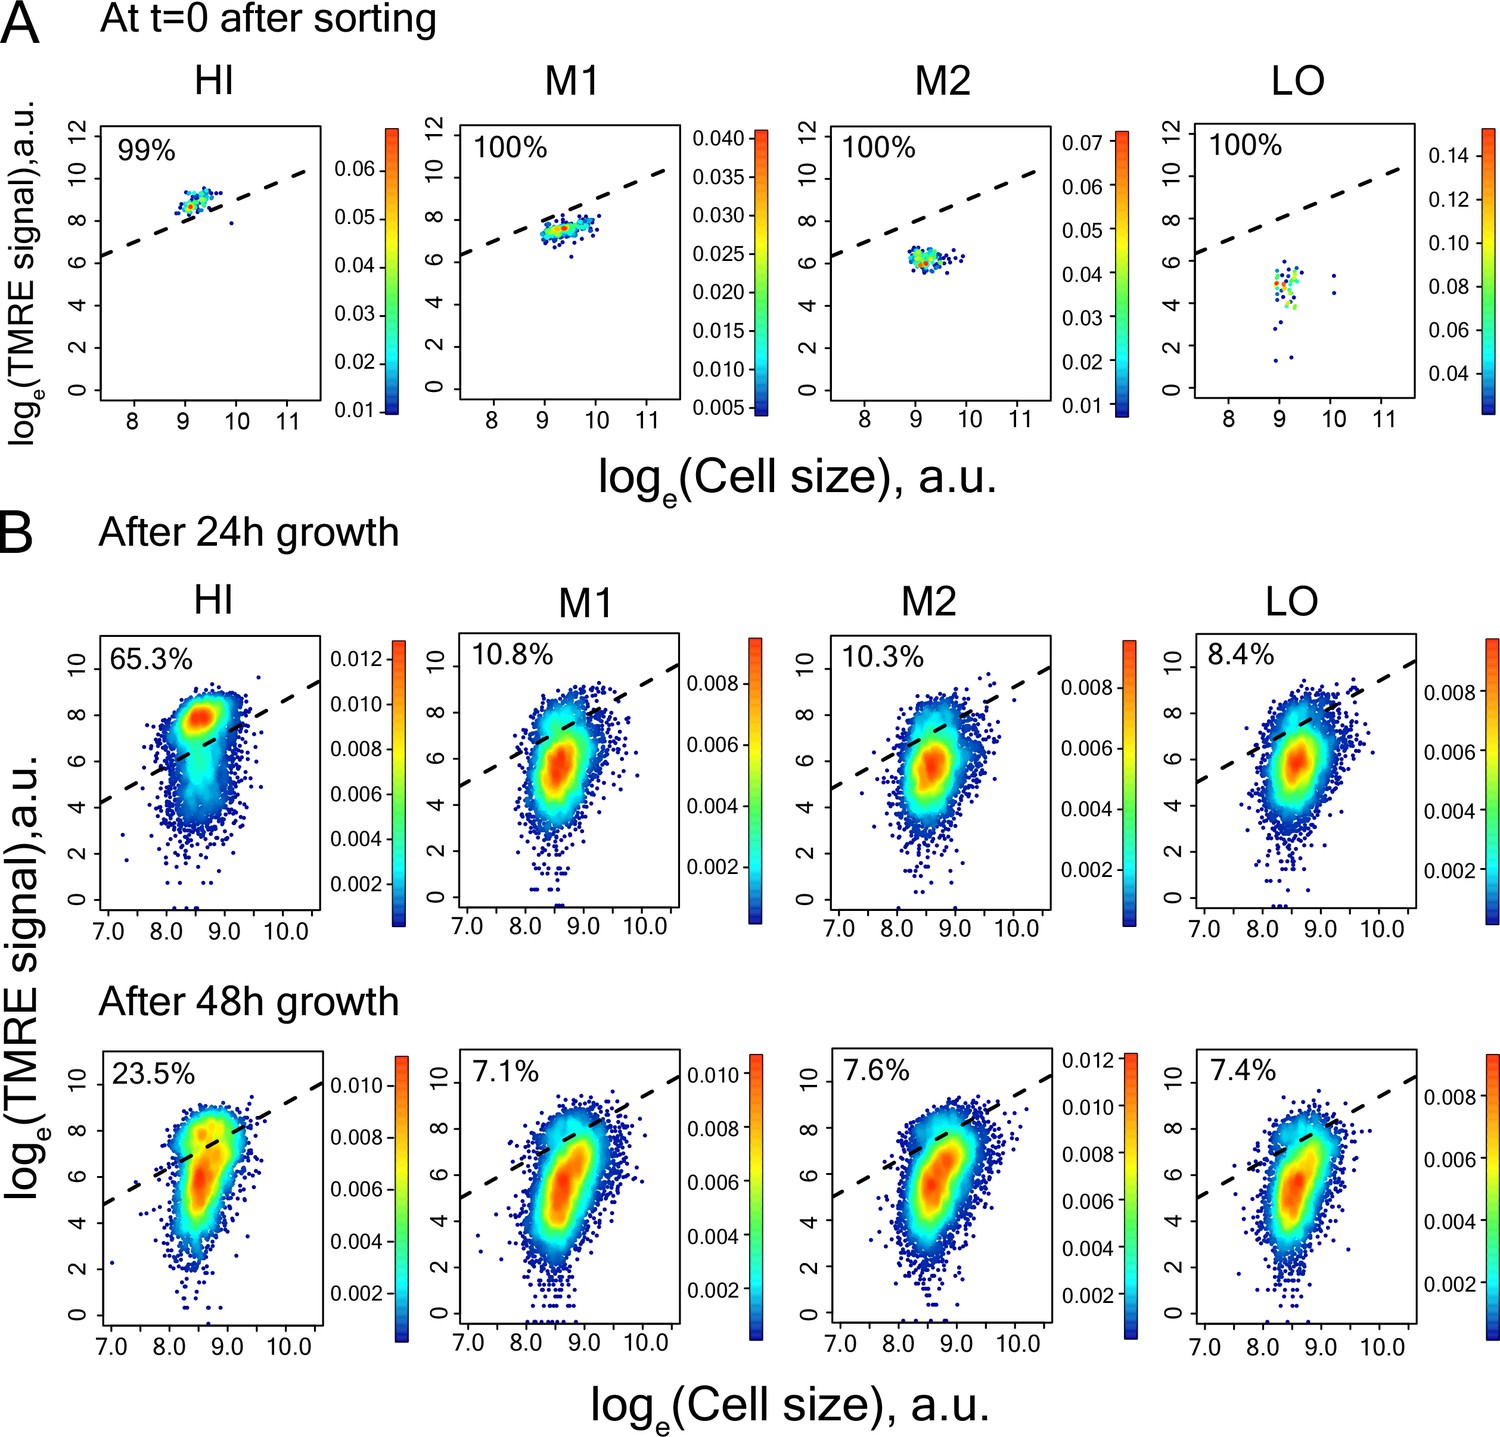
Measurement of TMRE in cells of sorted bins HI-LO from WT strain.
(A) right after sorting (B) after 24 hr and 48 hr growth in SCD medium.
Figure 5—figure supplement 11

Microcolony growth rate distribution for cells in HI bin from TMRE sorted WT strain for calculation of switching rate from high to low TMRE state.
80% of the cells were estimated to be slow-growing. The mean growth rate (geometric mean) of the slow-growing sub-population was estimated to be 0.20 h−1 and the mean growth rate of the fast-growing sub-population was estimated to be 0.37 h−1.
Figure 5—figure supplement 12
Reproducibility of RNAseq experiments and growth rate measurements.
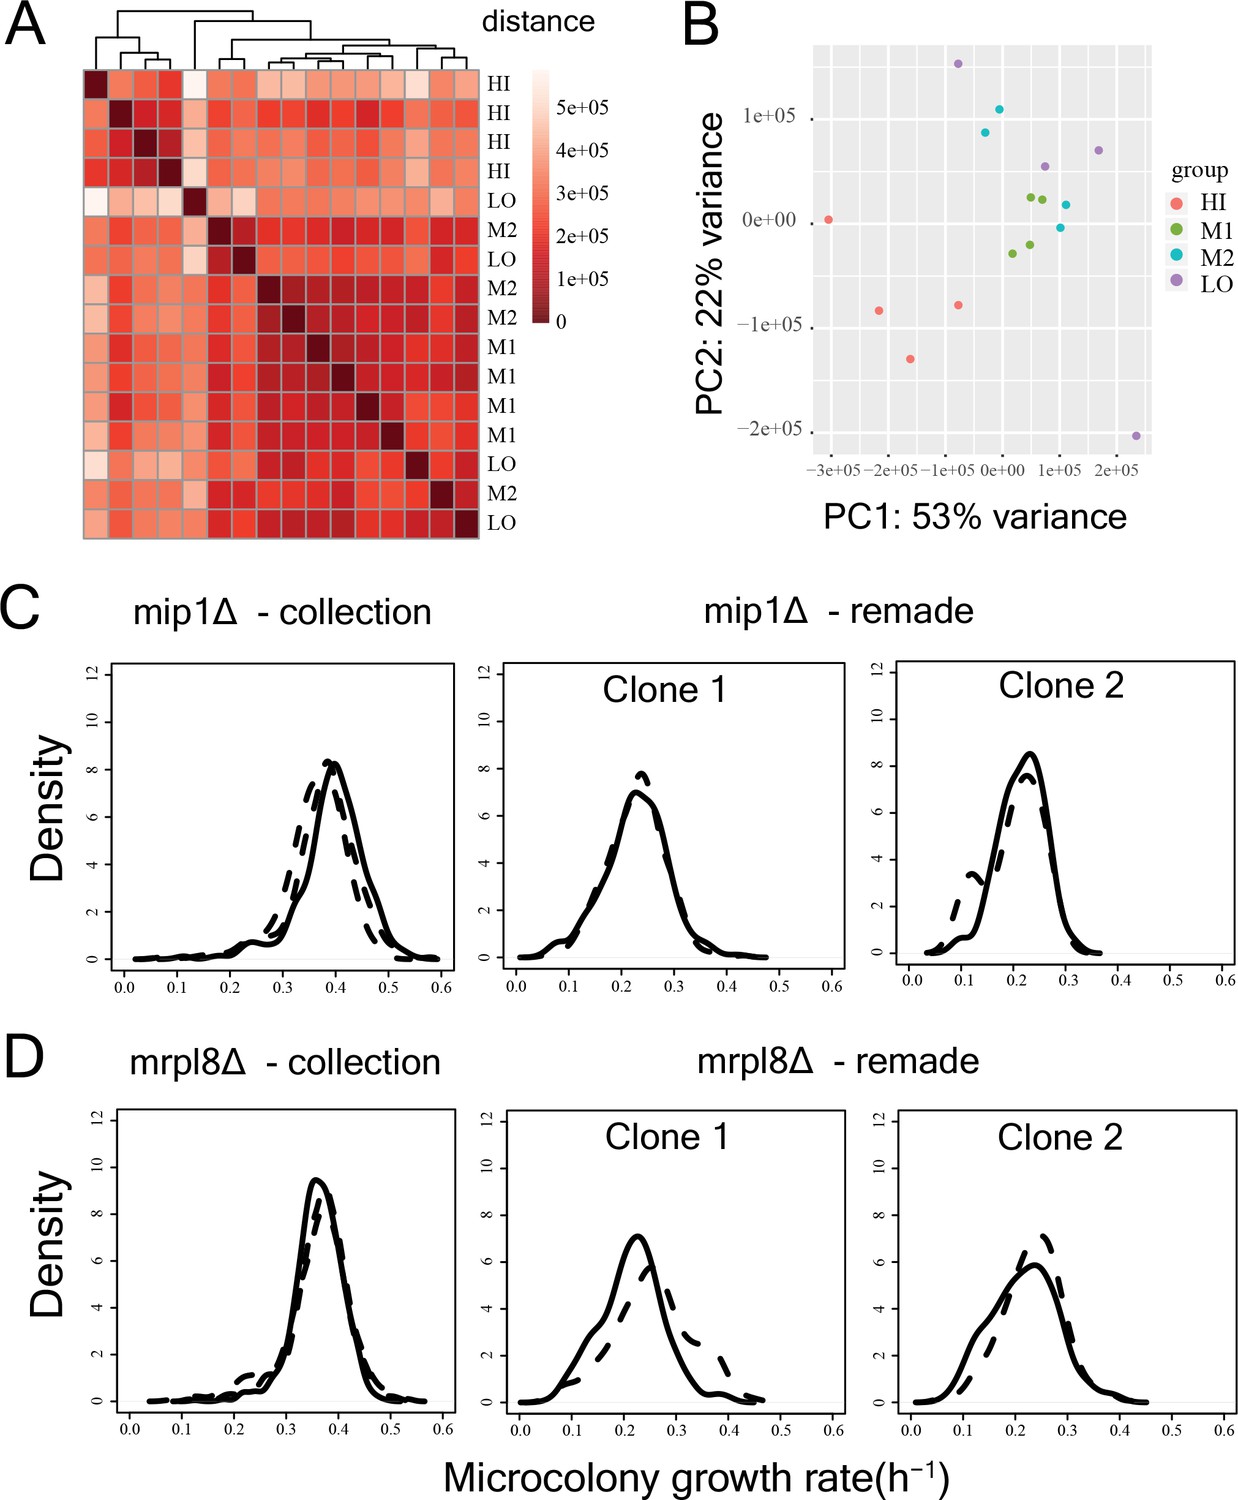
(A) Heatmap depicting distance between replicate RNA-seq samples of the sorted bins HI-LO of the WT strain. One replicate of LO bin showed high distance from all clusters. (B) PCA analysis of expression level of all genes for all replicates of bin HI-LO. Again, one replicate of bin LO was an outlier which was discarded before subsequent analyses. (C) Growth distributions for mip1Δ strain from the deletion collection and for two remade clones. The solid and the dotted lines represent replicate measurements on different days. The data clearly show that the growth rate in the strain from the collection is compensated. (D) Growth distributions for mrpl8Δ strain from the deletion collection and for two remade clones.
Author response image 1
Additional files
-
Supplementary file 1
Mean and Mode growth rate (h−1) and % slow fraction for the natural yeast strains from SGRP collection.
- https://doi.org/10.7554/eLife.38904.029
-
Supplementary file 2
Mean, median and mode growth rates (h−1), Standard deviation (SD), Noise (Coefficient of variation, CV), % slow fraction, number of replicates showing reproducible results and the classification colour code (as in Figure 2A) for all the mutants with reproducible results.
- https://doi.org/10.7554/eLife.38904.030
-
Supplementary file 3
Primer pairs used for quantifying mtDNA copy number using quantitative PCR.
- https://doi.org/10.7554/eLife.38904.031
-
Supplementary file 4
Proliferation distributions of 1520 deletion mutants for which reproducible measurements were obtained.
Multiple lines in each plot represent reproducible replicate measurements. x-axis represents microcolony growth rate (h−1) and y-axis represents density.
- https://doi.org/10.7554/eLife.38904.032
-
Supplementary file 5
An example of gating strategy used for cell sorting experiments.
- https://doi.org/10.7554/eLife.38904.033
-
Supplementary file 6
Key Resources Table.
- https://doi.org/10.7554/eLife.38904.034
-
Transparent reporting form
- https://doi.org/10.7554/eLife.38904.035
Download links
A two-part list of links to download the article, or parts of the article, in various formats.
Downloads (link to download the article as PDF)
Open citations (links to open the citations from this article in various online reference manager services)
Cite this article (links to download the citations from this article in formats compatible with various reference manager tools)
Single cell functional genomics reveals the importance of mitochondria in cell-to-cell phenotypic variation
eLife 8:e38904.
https://doi.org/10.7554/eLife.38904


