A novel mechanism of gland formation in zebrafish involving transdifferentiation of renal epithelial cells and live cell extrusion
- University of Auckland, New Zealand
Figures
Figure 1
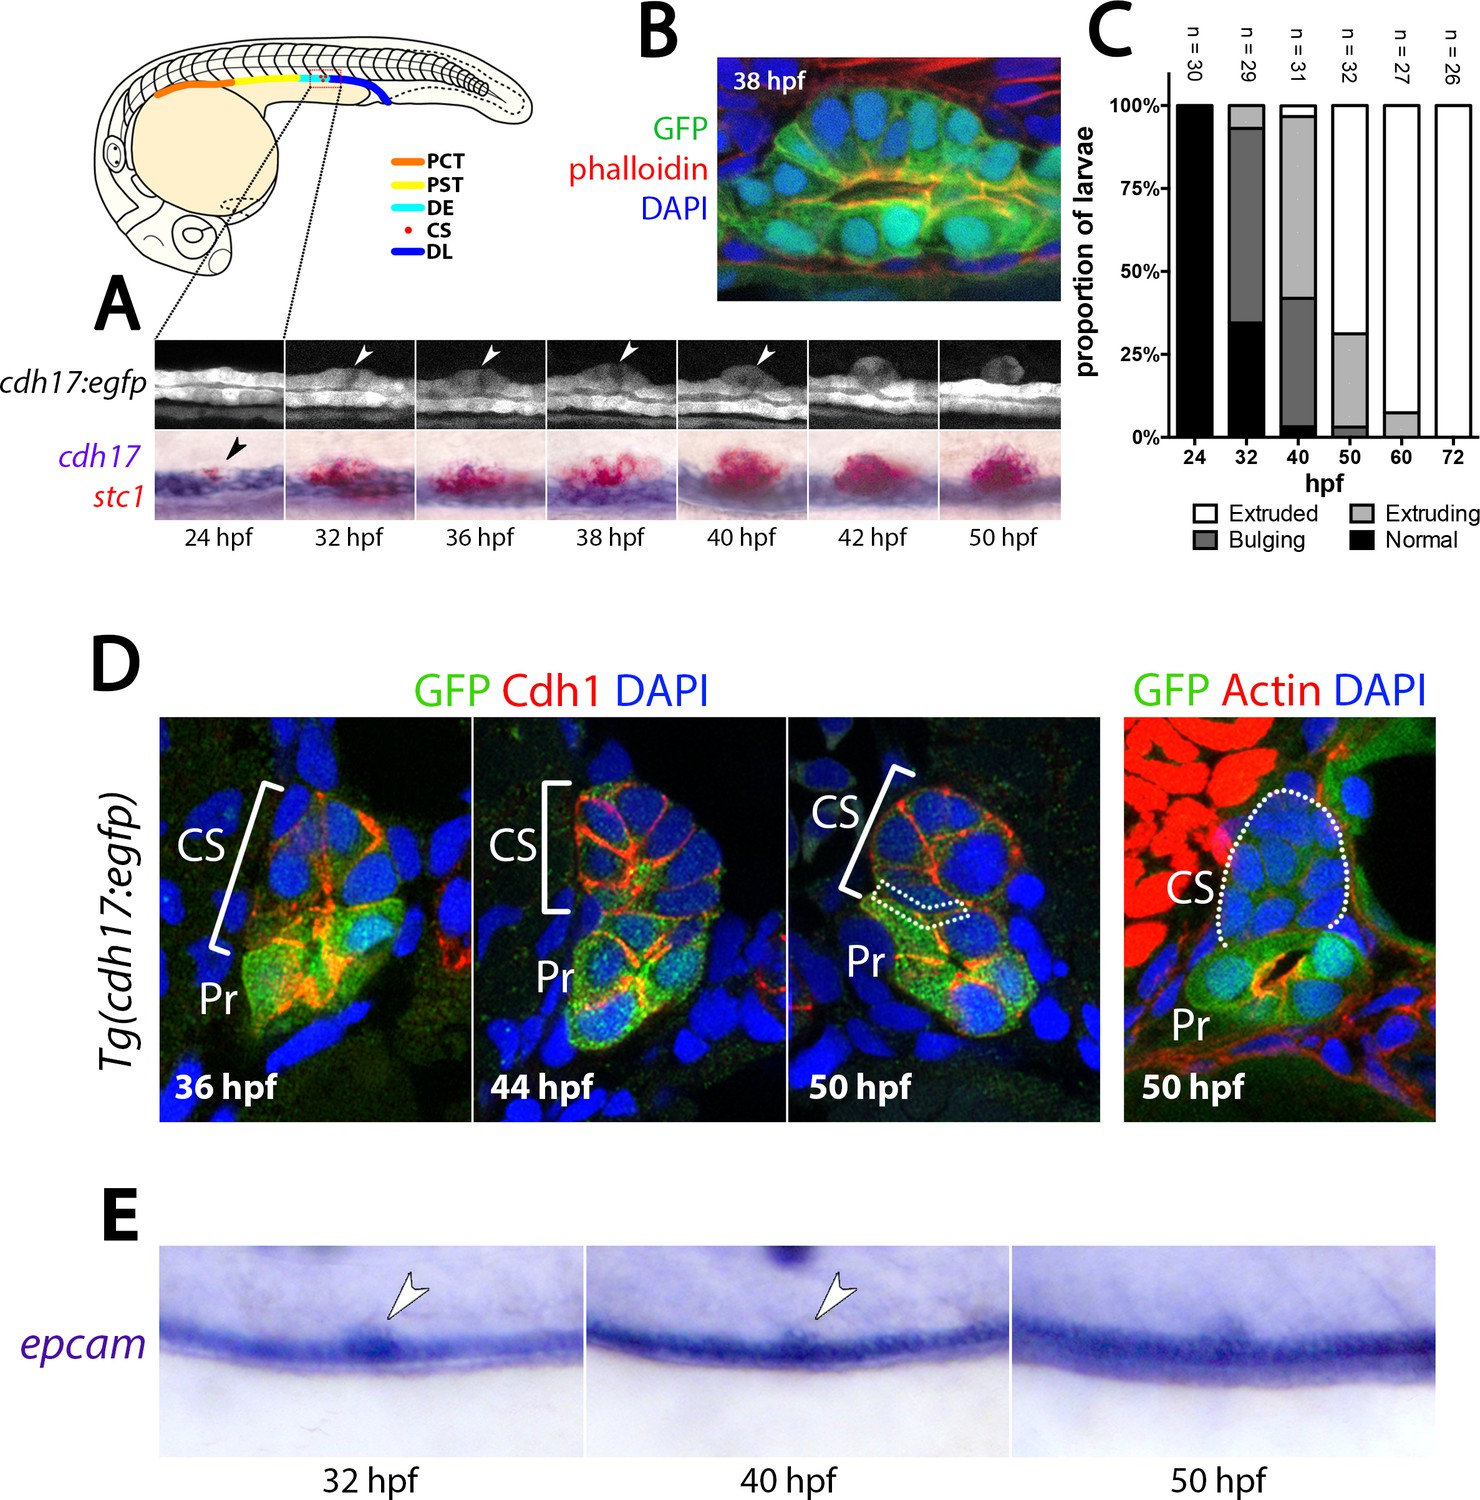
CS extrusion is achieved by apical extrusion of multiple renal epithelial cells.
(A) Lateral views of a stage series analysis of CS extrusion in a single live Tg(cdh17:egfp) embryo (top panels) and embryos fixed at the stages shown and stained for cdh17(purple)/stc1(red). (B) Image of a sagittal section through the pronephros of a Tg(cdh17:egfp) embryo co-labelled with Phalloidin (F-actin, red) and DAPI (nuclear stain, blue) at the site of the extruding CS at 38 hpf. (C) Histogram shows the frequency of the four stages of CS extrusion at 24 hpf, 32 hpf, 40 hpf and 50 hpf. (D) Panels show transverse sections through the CS gland of Tg(cdh17:egfp) embryos at the stages indicated. Green fluorescence is from the endogenous GFP, Cdh1 is labelled red and nuclei are labelled blue (DAPI). Dotted box in the 50 hpf panel indicates weak/absent Cdh1 staining at the interface between the ventral side of the CS gland and the dorsal side of the tubule. (E) Panels show lateral views of an extruding CS gland in embryos at the indicated stages labelled with epcam. Abbreviations: PT, Proximal tubule; DE, Distal early tubule segment; CS, Corpuscles of Stannius; DL, Distal Late tubule segment; hpf, hours post fertilisation; Pr, Pronephros.
Figure 2 with 2 supplements
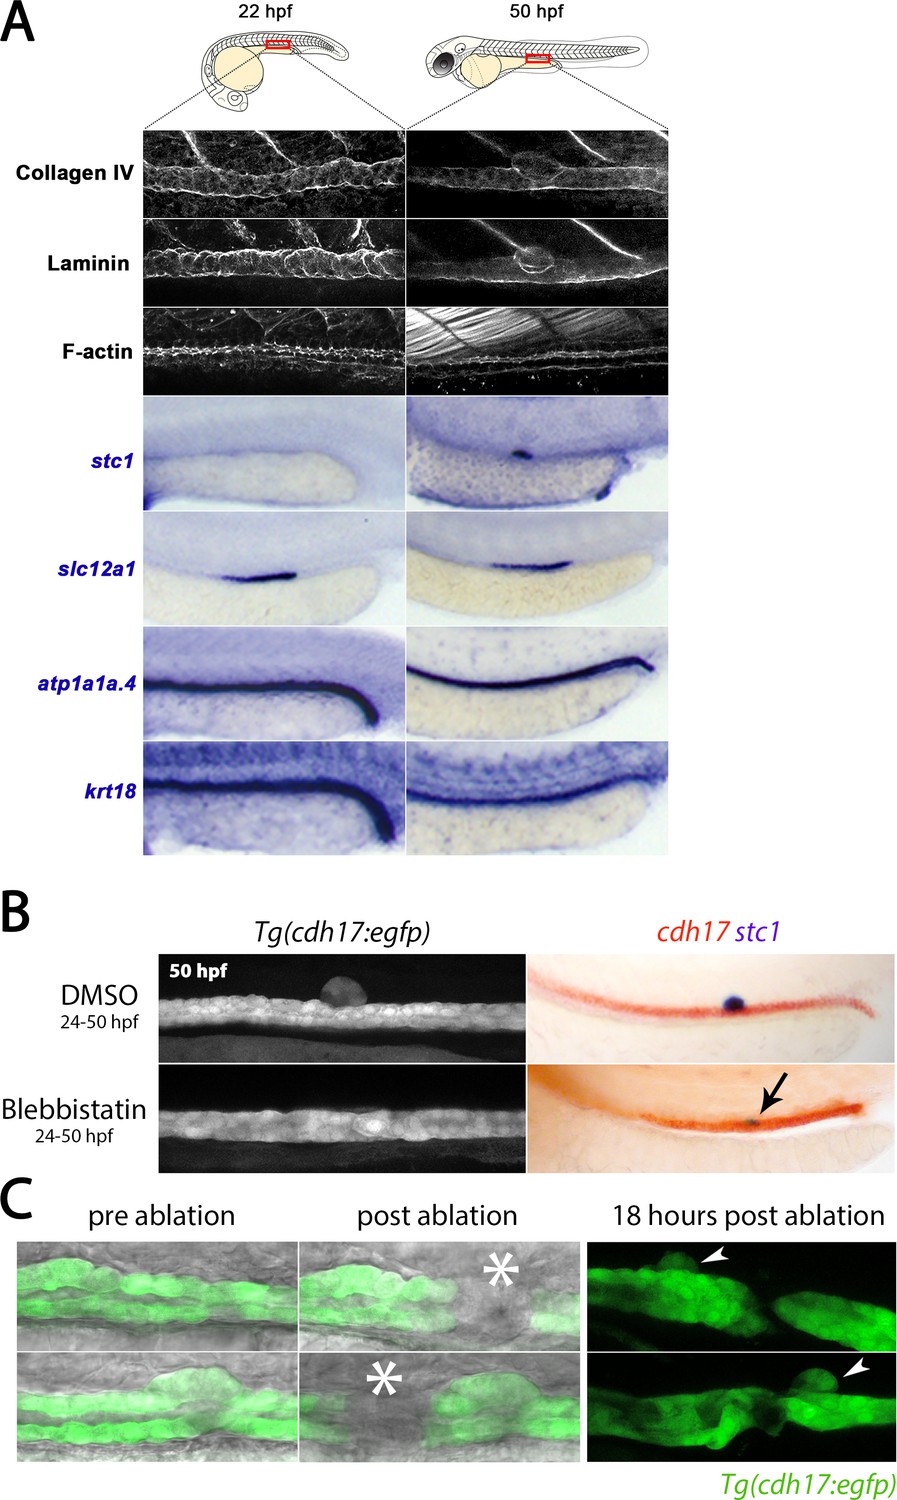
CS extrusion is mediated by apical constriction.
(A) Panels show lateral views of the markers indicated in the region of the trunk where the CS will be derived (at 22 hpf) and is extruded (at 50 hpf). (B) Panels show lateral views of the trunk from live Tg(cdh17:egfp) embryos (left) and embryos stained for cdh17 (red)/stc1 (purple) transcripts (right) in control and Blebbistatin treated embryos. Black arrow indicates the position of stc1+ cells in the Blebbistatin treated embryo. (C) Panels show brightfield/fluorescence in Tg(cdh17:egfp) embryos before and after laser ablation (site of ablation indicated with asterisk). Panels on the right show embryos 18 hr post-ablation and arrowheads indicate the extruded CS gland.
Figure 2—figure supplement 1
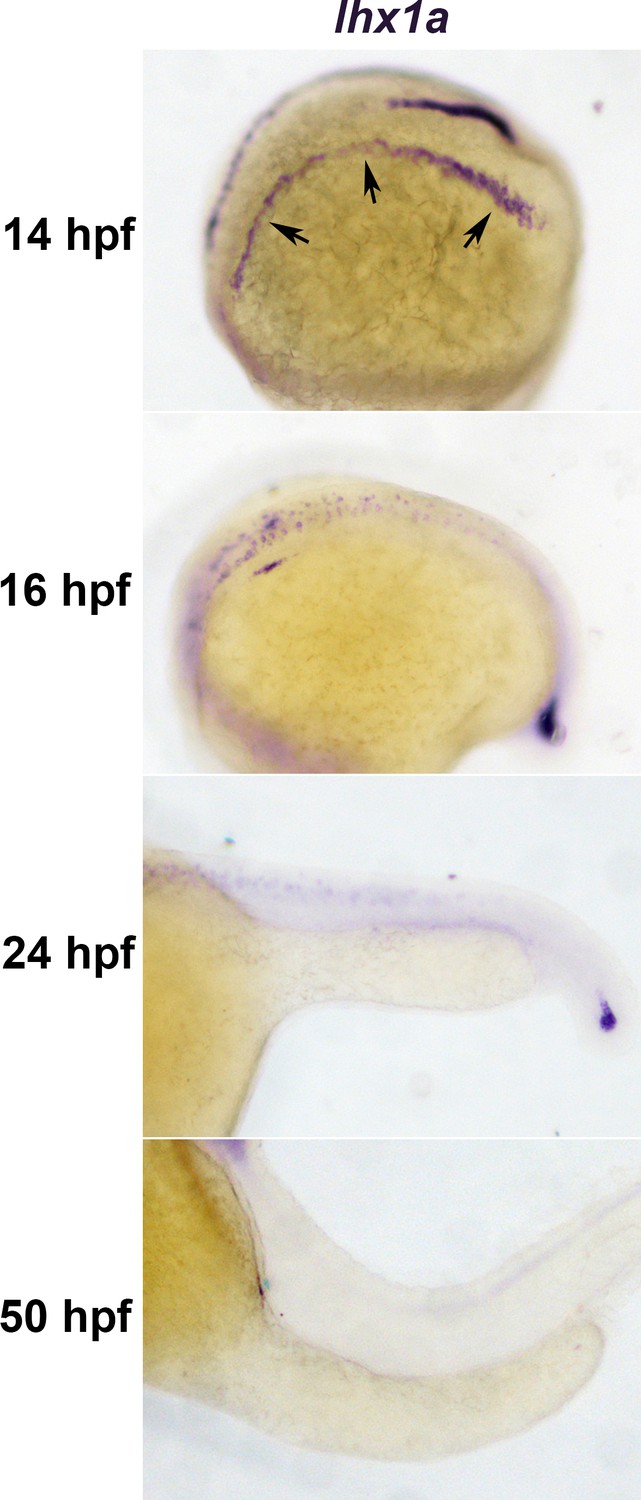
lhx1a expression stage series.
Panels show lateral images of zebrafish embryos stained for lhx1a transcripts at the indicated stages. Arrows indicate the intermediate mesoderm.
Figure 2—figure supplement 2
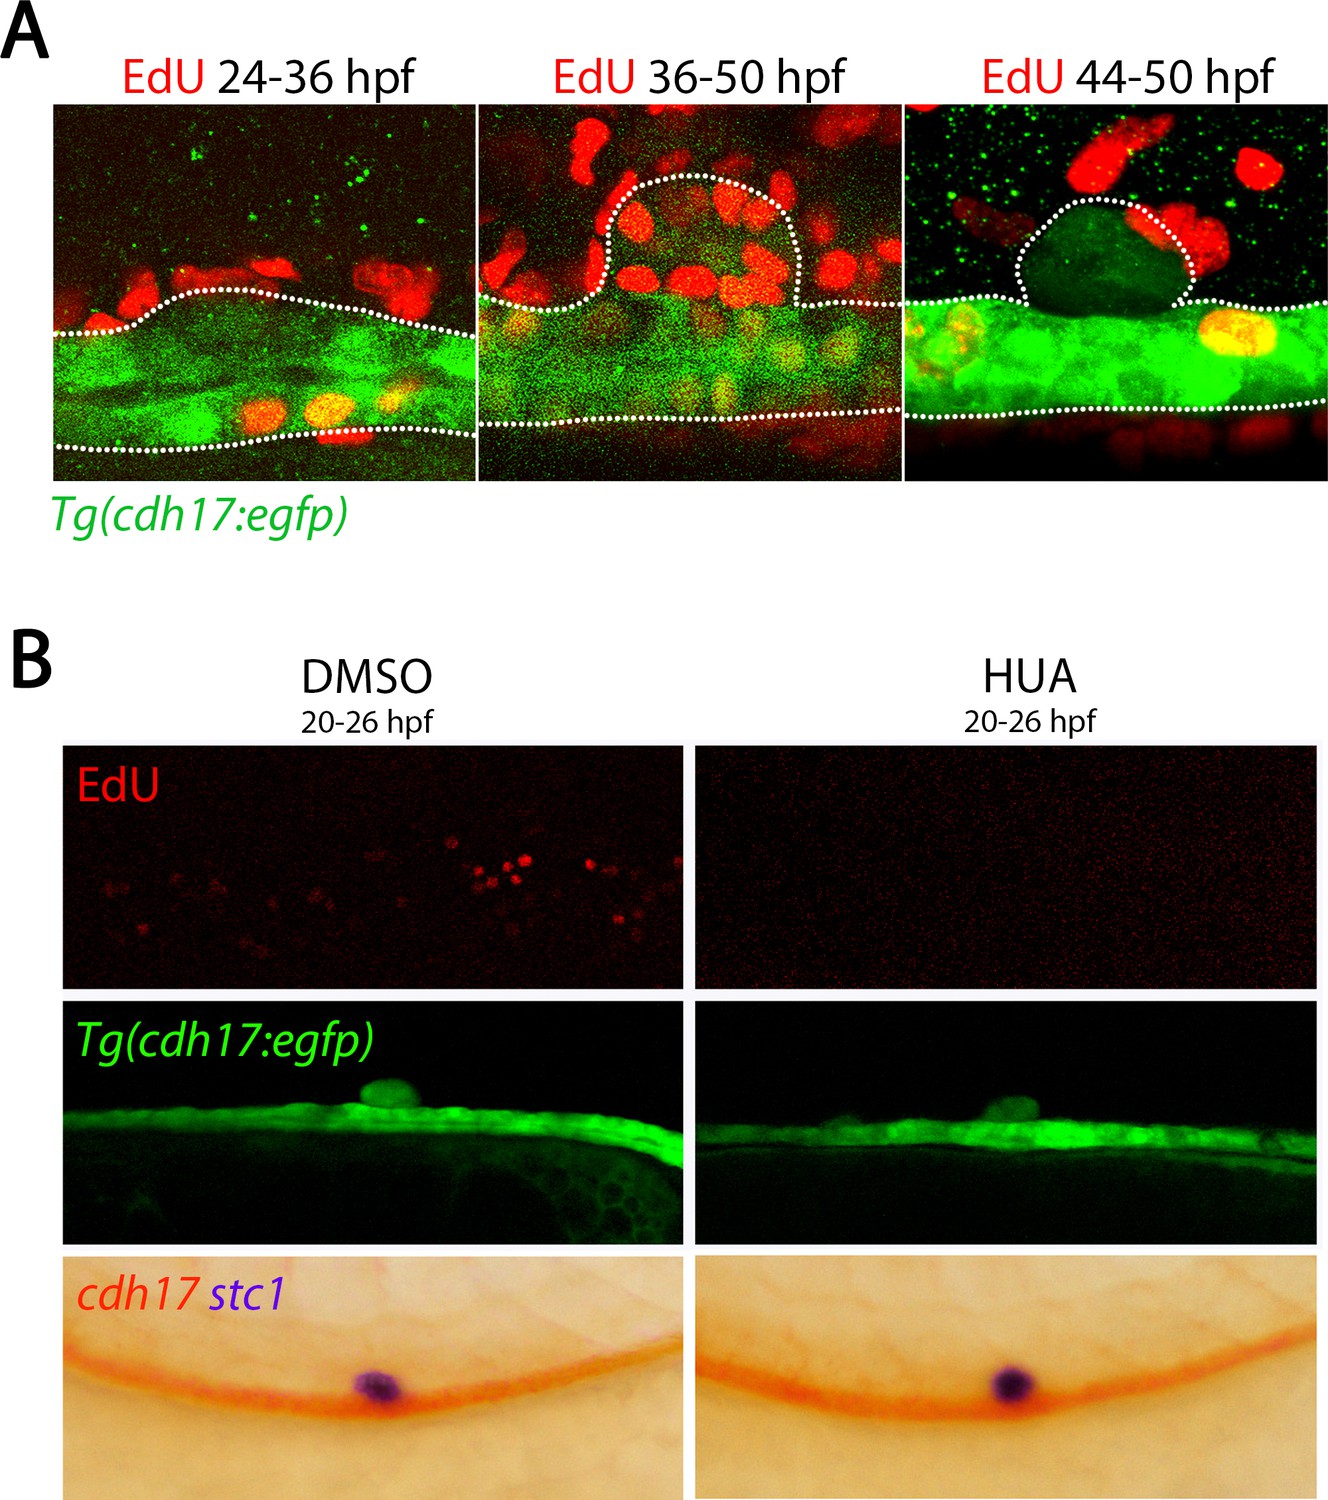
Cell division is not required for CS formation.
(A) Panels show lateral views of Tg(cdh17:egfp) embryos stained for EdU labelling at 36 hpf (left panel) and 50 hpf (two right panels) after treatment with EdU between the stages shown. (B) Lateral views of DMSO vehicle control (left panels) and HUA treated animals treated from 20 to 26 hpf and then fixed at 50 hpf. Top panels are EdU labelling, middle panels are of Tg(cdh17:egfp) embryos and bottom panels are of embryos stained for cdh17 (red) and stc1 (purple) expression.
Figure 3 with 2 supplements
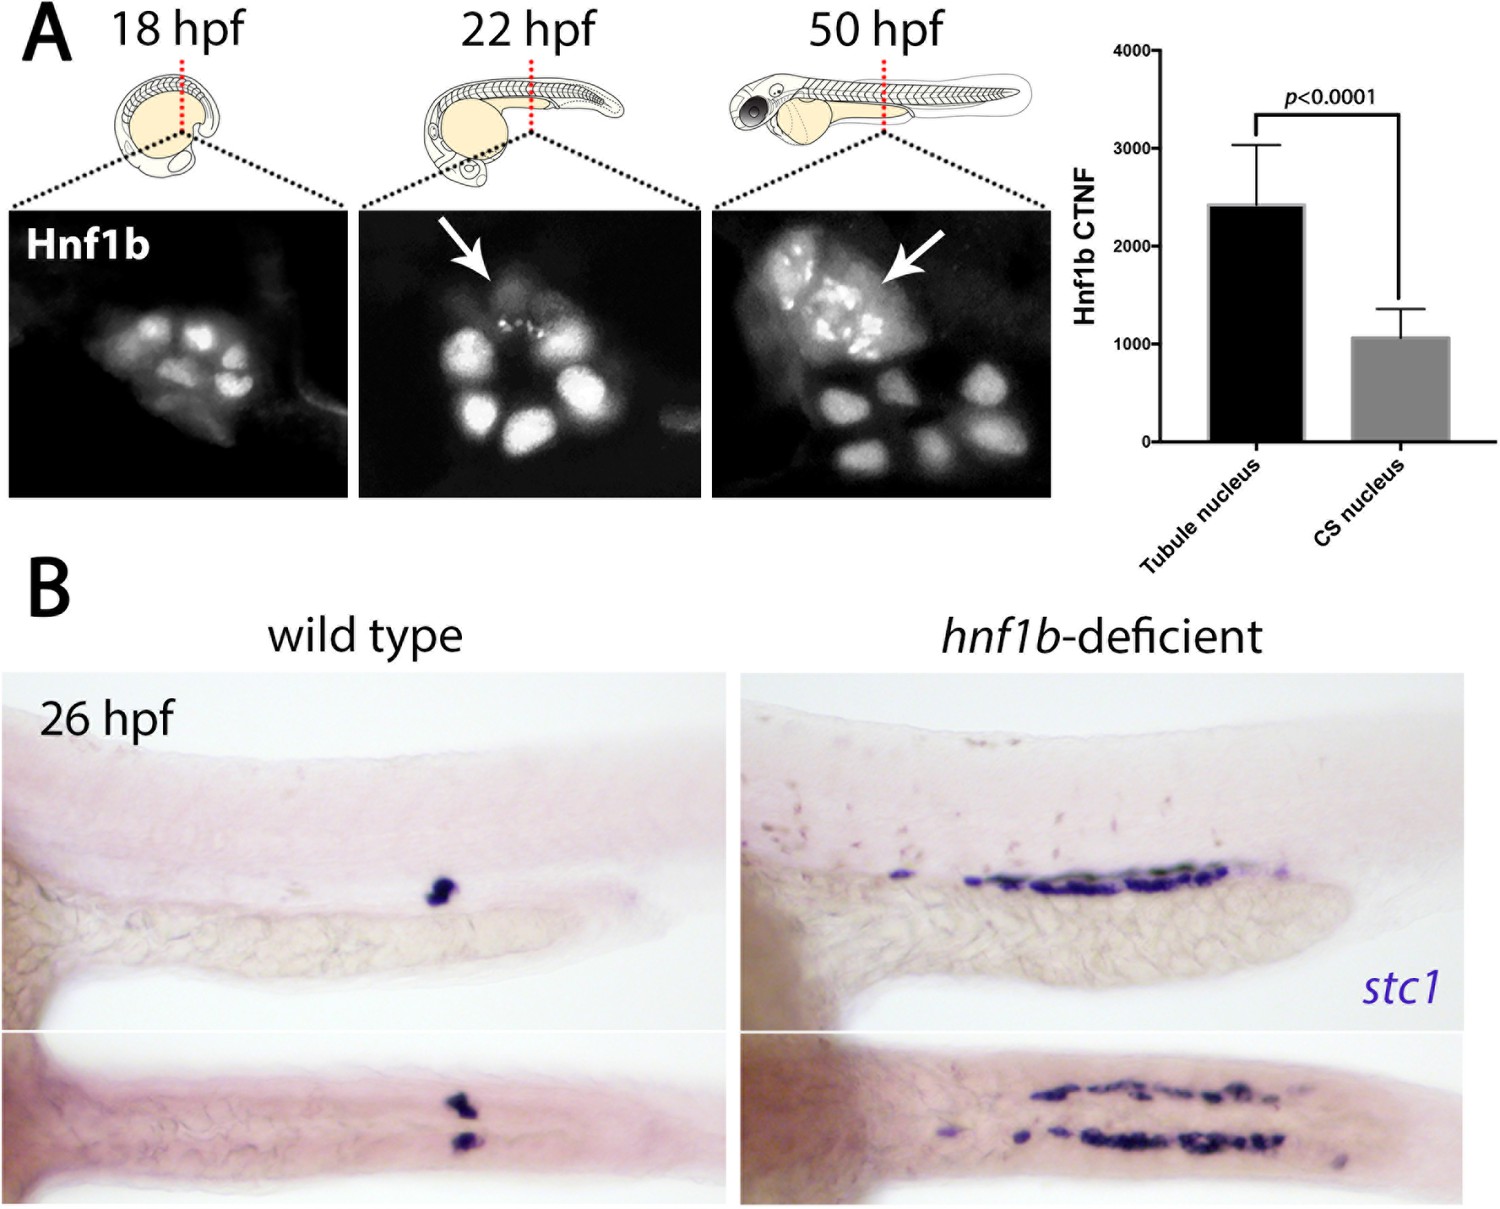
Hnf1b is translocated to the cytoplasm in prospective CS cells.
(A) Panels show Hnf1b immunostains (graysale) on transverse cryosections of zebrafish embryos through the region of the trunk where CS glands form at 22 hpf, 36 hpf and 50 hpf. Arrows indicate CS cells that have undergone nuclear export of Hnf1b. Histogram on the right indicates ‘corrected total nuclear fluorescence’ (CTNF) of nuclei in the tubule versus nuclei in the CS gland at 22 hpf (n = 8). (B) Top panels show lateral views and bottom panels show dorsal views of wild-type and hnf1b-deficient embryos stained for stc1.
Figure 3—figure supplement 1
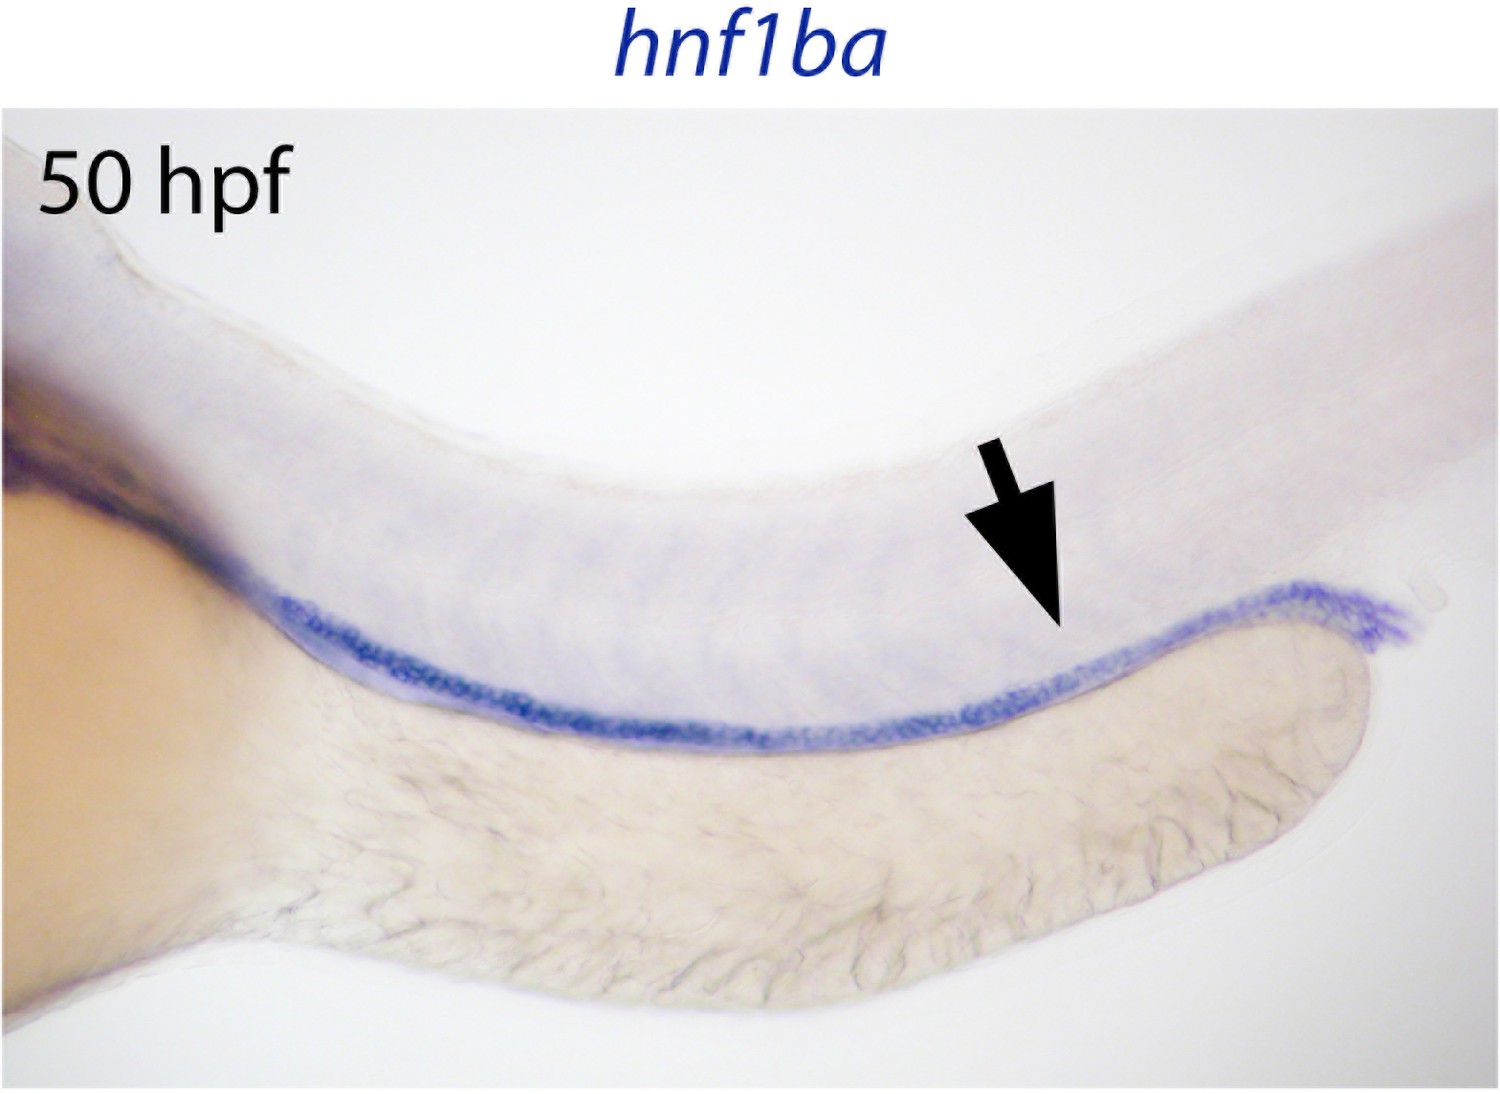
hnf1ba is not expressed in the CS gland.
Panel shows a 50 hpf wild-type embryo stained for hnf1ba transcripts. Black arrow indicates the approximate position of the CS gland.
Figure 3—figure supplement 2
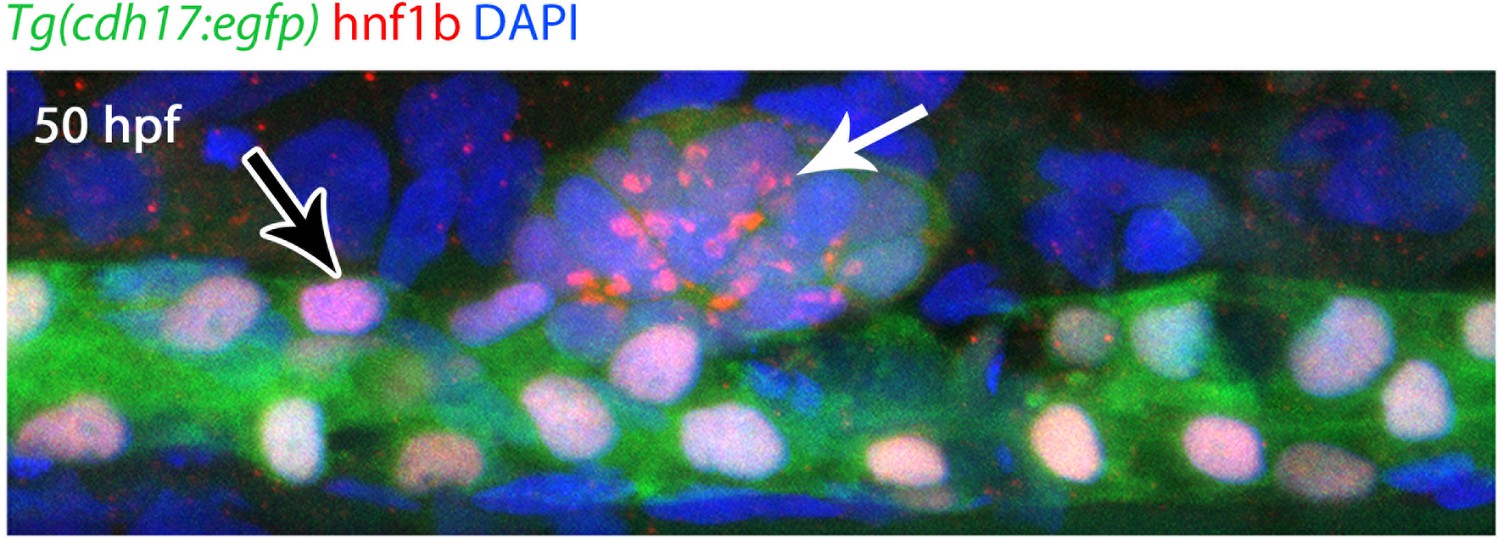
Hnf1b nuclear export at 50 hpf.
Lateral view of a 50 hpf Tg(cdh17:egfp) (green) embryo immunostained for Hnf1b (red) and counterstained for DAPI (blue). Hnf1b in the CS is largely non-nuclear (white arrow), in contrast to nuclear Hnf1b in the tubules (black arrow).
Figure 4
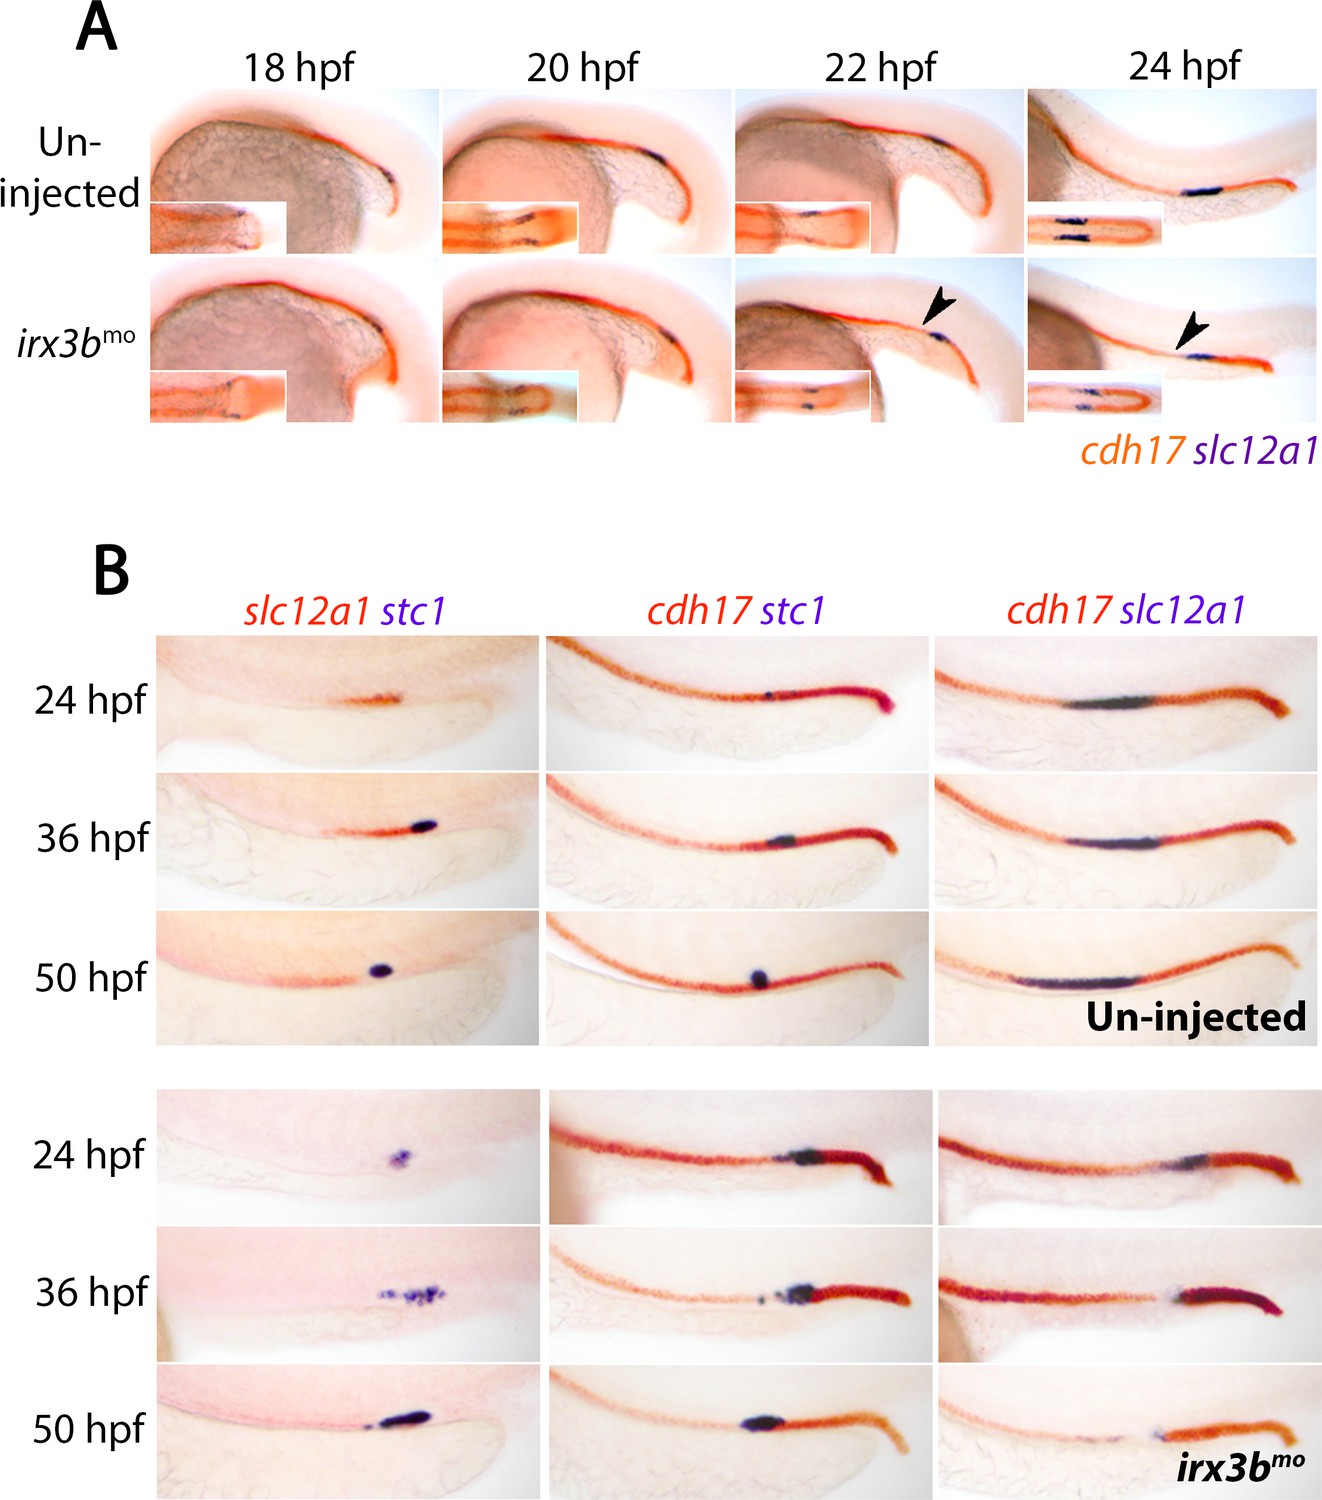
irx3b depletion converts the DE segment to CS fate.
(A) Panels show lateral views of 18 hpf, 20 hpf, 22 hpf and 24 hpf wild-type and irx3b morphant embryos co-stained for cdh17 (red) and slc12a1 (purple). Black arrowheads highlight the initiation of pronephric phenotypes in irx3b morphants. (B) Panels show lateral views of control (un-injected) embryos and irx3b morphants double-stained for either slc12a1(red)/stc1(purple), cdh17(red)/stc1(purple) or cdh17(red)/slc12a1(purple) at 24 hpf, 36 hpf and 50 hpf.
Figure 5
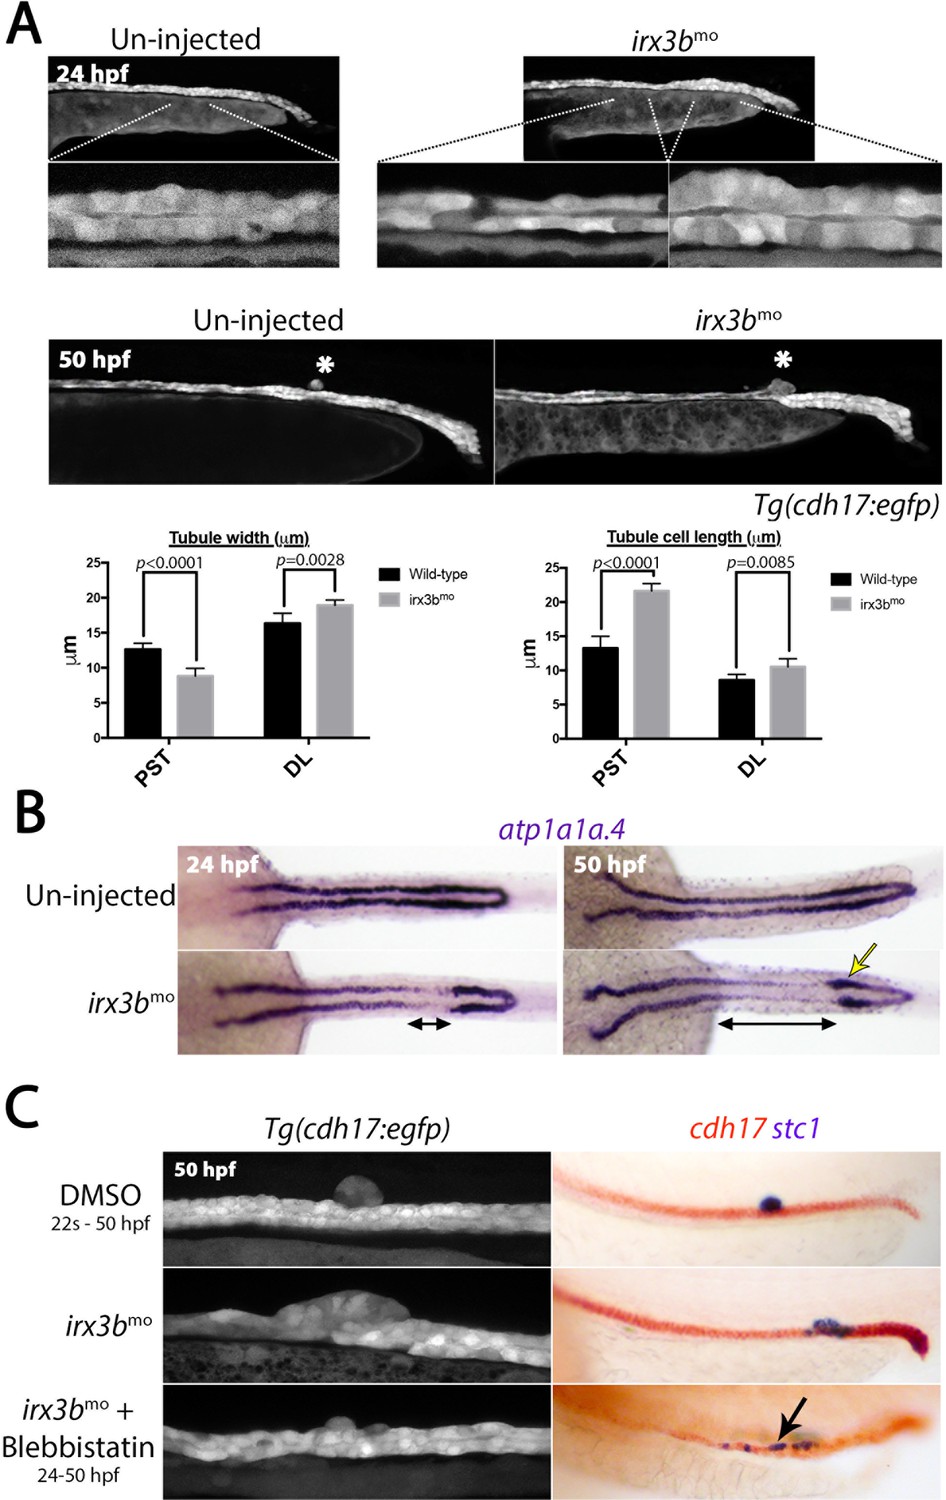
irx3b depletion causes aberrant pronephric morphogenesis.
(A) Lateral views of live un-injected and irx3b morphant Tg(cdh17::egfp) embryos with lower panels showing higher magnification of indicated pronephric regions. Histograms show the width of the tubule (left) and length of tubule cells (right) in the PST and DL regions of wild-type and irx3b morphants (n = 10). (B) Panels show dorsal view images of embryos stained for atp1a1a.4 at the stages indicated. Double-ended black arrows highlight areas of reduced atp1a1a.4 expression immediately anterior to a thickened distal tubule (yellow arrow) at 24 hpf and 50 hpf in irx3b morphants. (C) Lateral views of the trunk of Tg(cdh17:egfp) embryos (left panels) and embryos double stained for cdh17 (red) and stc1 (purple; right panels) after the indicated treatments. Black arrow highlights the ectopic stc1+ cells that remain in the tubule after irx3b knock down and Blebbistatin treatment.
Figure 6 with 4 supplements
Notch inhibition precludes CS gland formation.
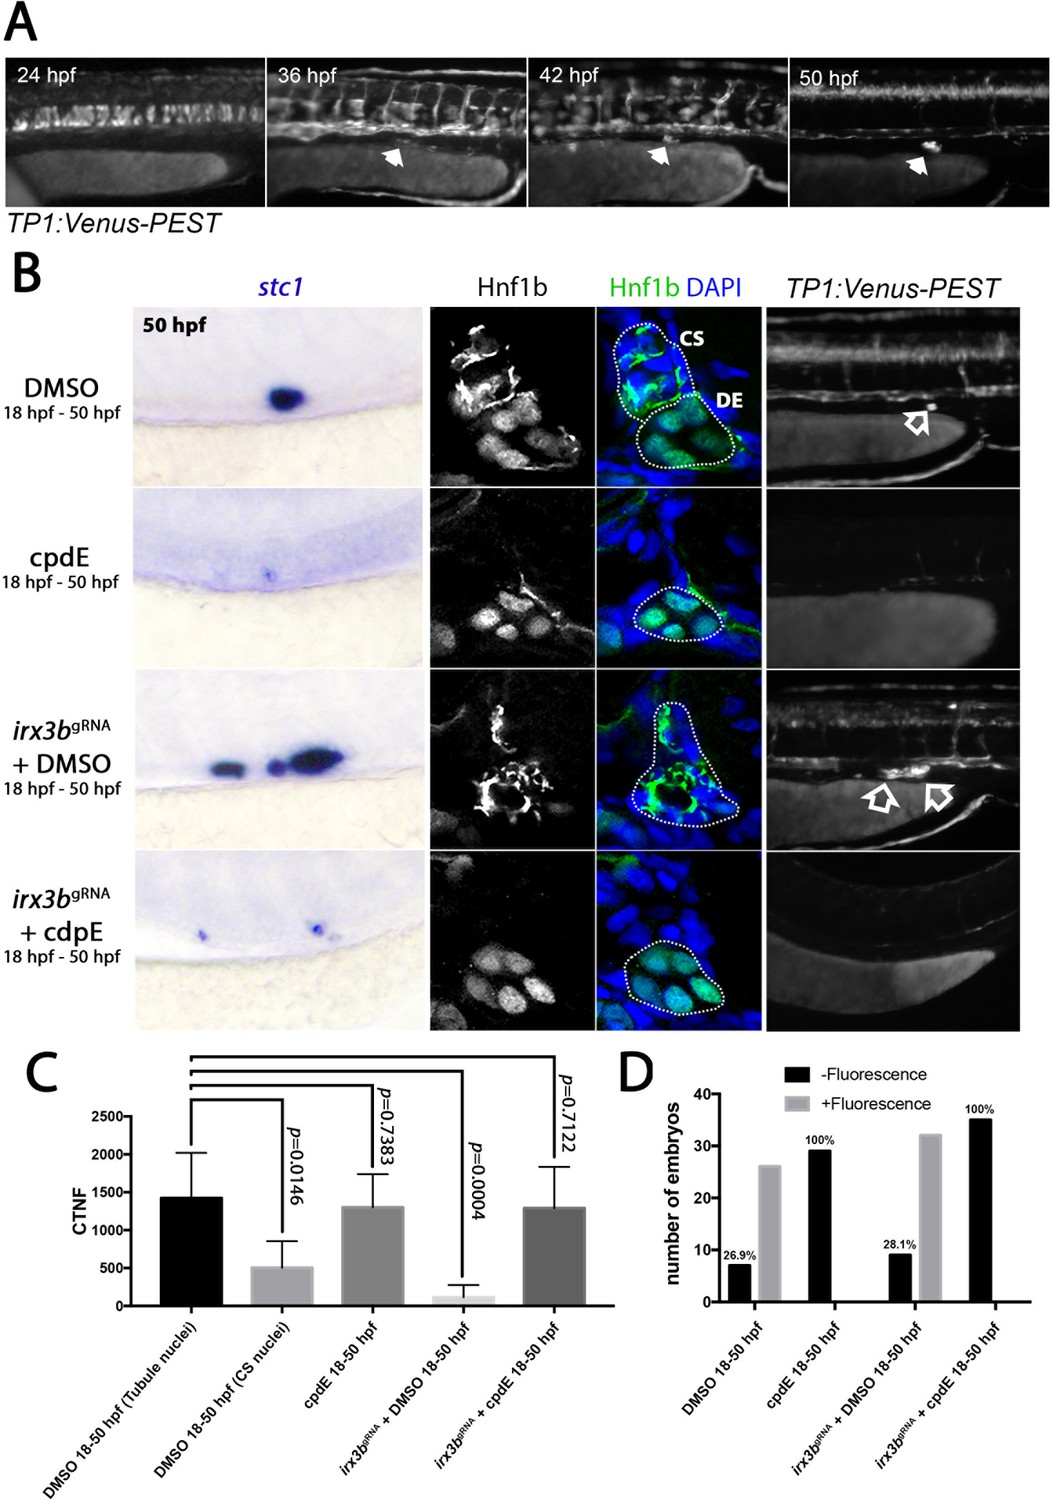
(A) Panels show a stage series of fluorescent images of the TP1:VenusPEST transgenic line in the trunk region (arrows mark fluorescence in the region of the CS gland). (B) Left panels show lateral views of the posterior trunk showing stc1 expression after the indicated treatments. Middle panels show transverse sections of the pronephric tubule and position of the CS gland showing Hnf1b staining (±DAPI) after the same treatments. Right panels show lateral views of the trunk in the region of the CS gland (highlighted by unfilled arrow). (C) Histogram showing ‘corrected total nuclear fluorescence’ (CTNF) measurements of nuclei in the positions indicated. (D) Histograms showing the number of embryos with fluorescence in the CS gland in progeny from TP1:VenusPEST in-crosses with the indicated treatments.
Figure 6—figure supplement 1
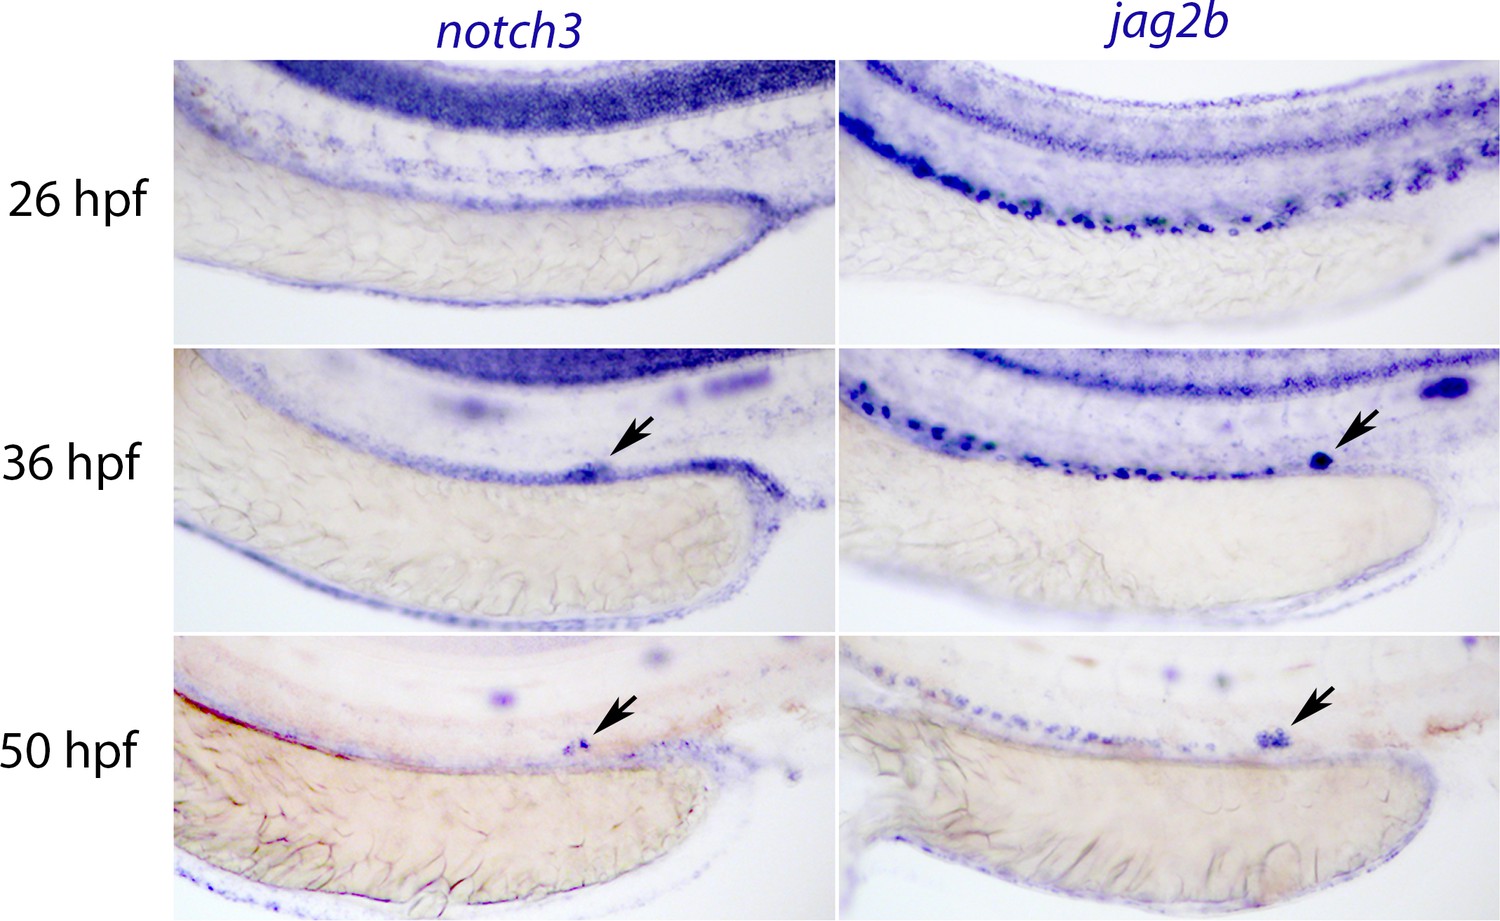
Notch components are expressed in the CS gland.
Lateral views of wild-type embryos stained for notch3 and jagged2b (jag2b) at the stages shown, black arrows indicate expression of notch factors in the CS gland.
Figure 6—figure supplement 2
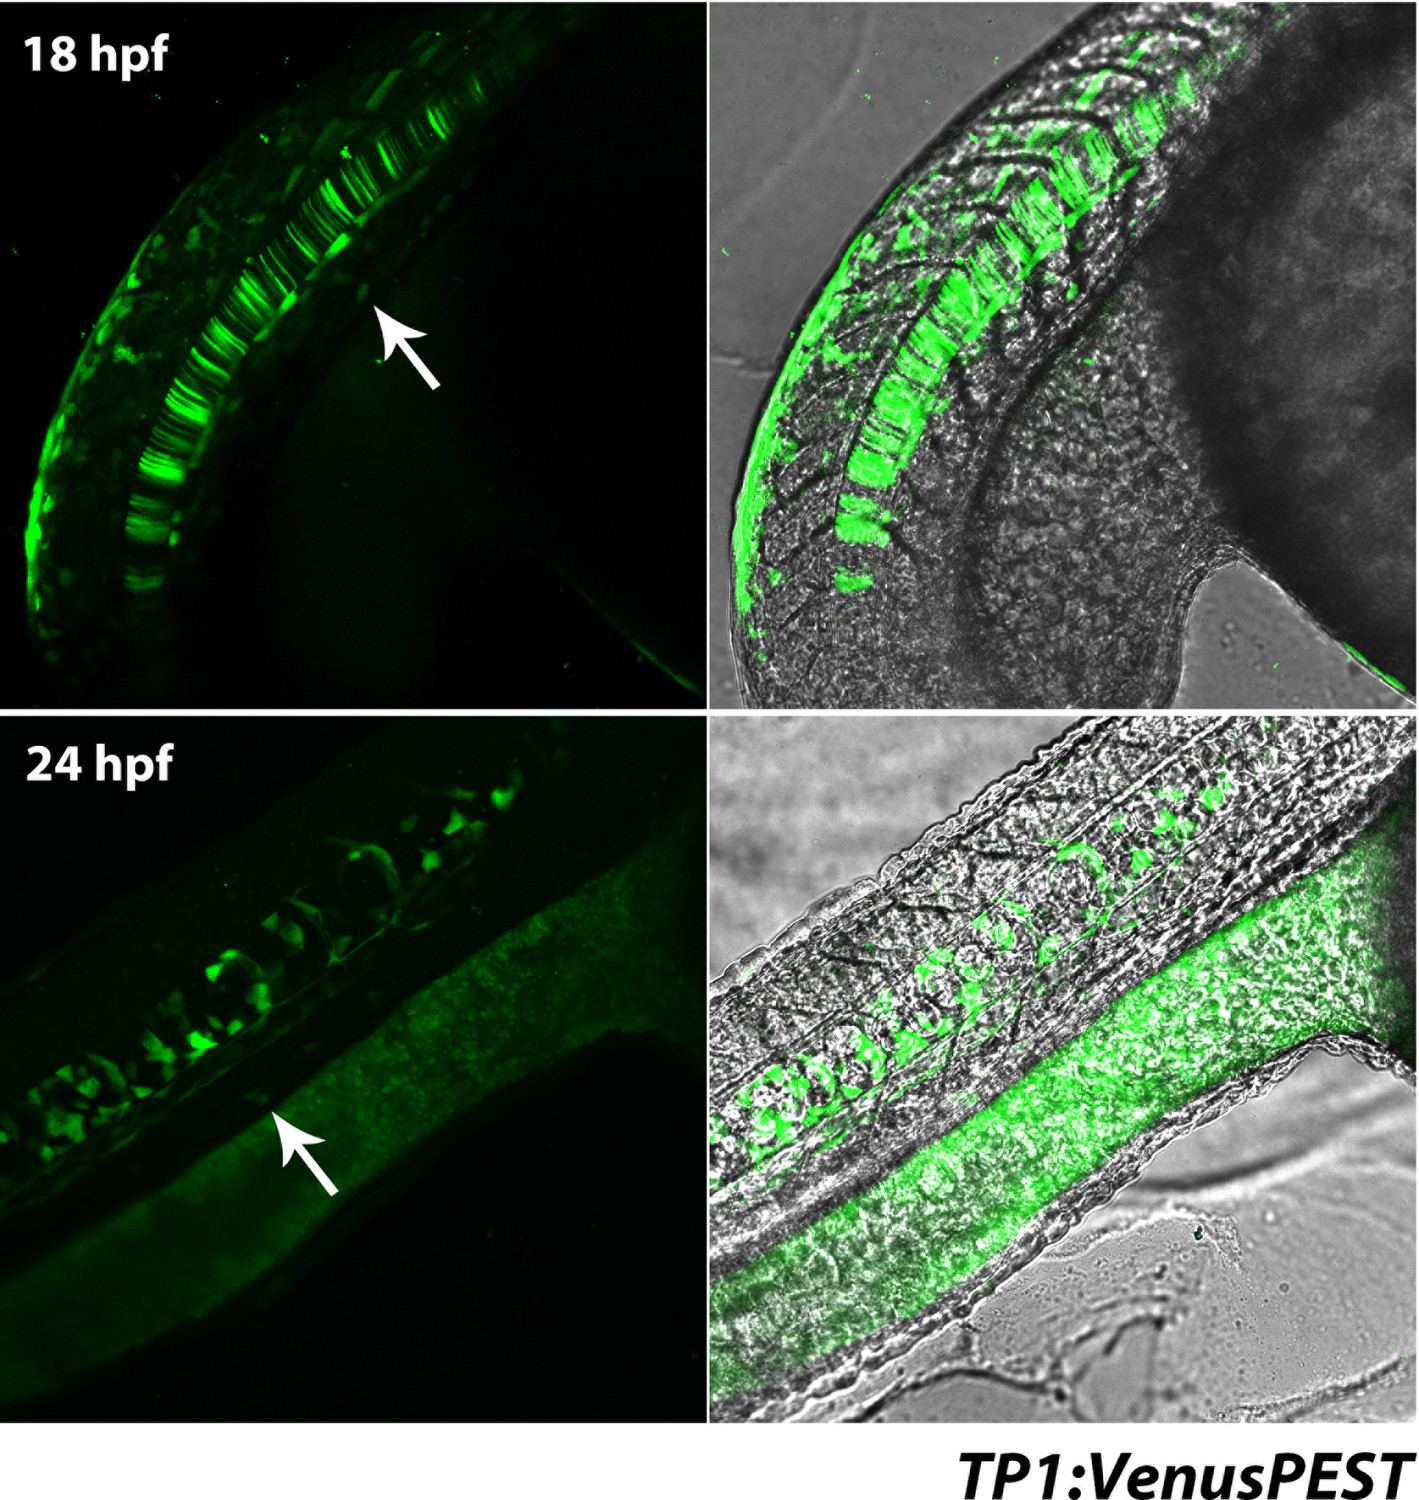
Notch activity in the pronephros is not observed early in development in the TP1:VenusPEST reporter line.
Top panels show lateral views of the trunk of an 18 hpf embryo, bottom panels show lateral views of the trunk region at 24 hpf. Venus+ cells in the region of the pronephros (arrows) were in the epidermis when analysed along the Z-axis.
Figure 6—figure supplement 3
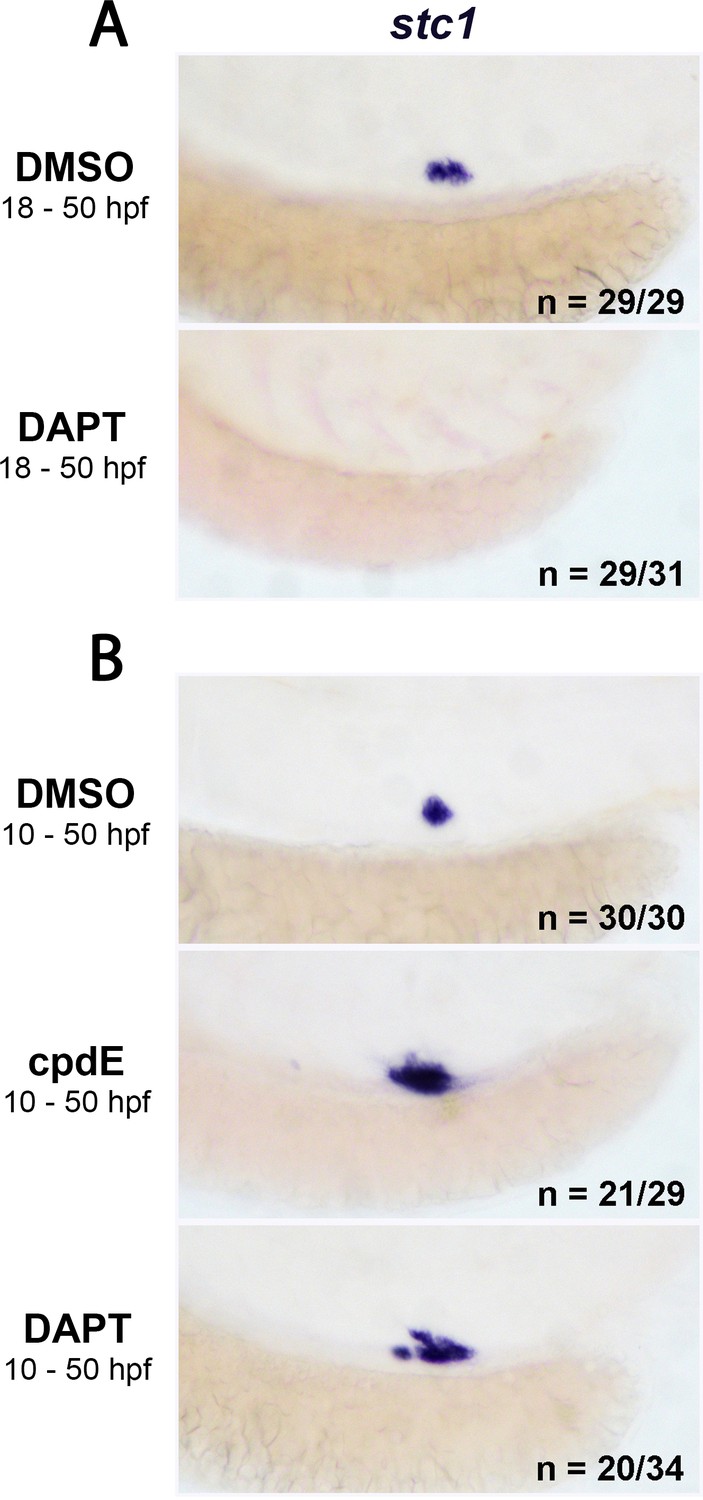
Early Notch inhibition promotes CS gland formation but later treatment inhibits CS development.
(A) Panels show lateral views of the trunk of 50 hpf embryos stained for stc1 after early (from 10 hpf) treatments with cpdE and DAPT. (B) Lateral views of stc1 stained embryos treated with DMSO and DAPT from 18 hpf.
Figure 6—figure supplement 4
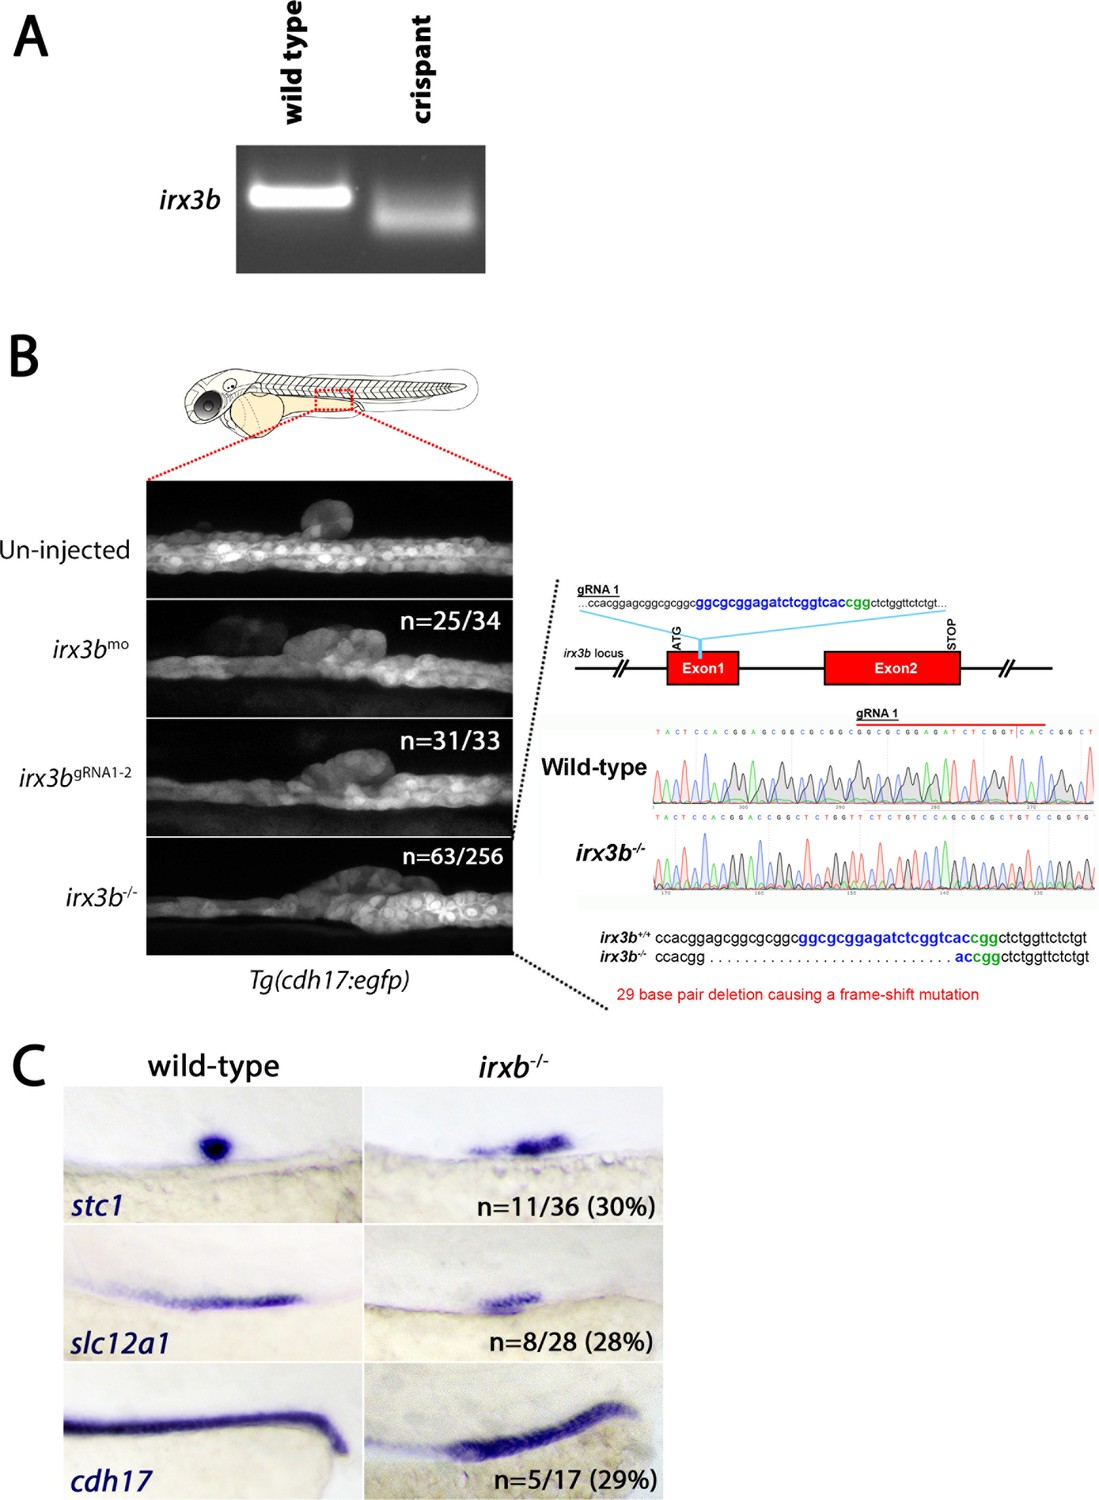
irx3b crispants and stable mutants recapitulate the renal phenotypes associated with irx3b morpholino knock down.
(A) Panel shows the gel image of the irx3b PCR product amplified from genomic DNA and processed through the T7 endonuclease one protocol (see materials and methods section). (B) Panels show lateral views of Tg(cdh17:egfp) embryos in wild-type, irx3b morphant, irx3b crispant and germline stable irx3b mutant embryos. Sanger sequencing analysis (right) shows a 29 bp deletion that causes a frame-shift mutation in exon 1 of the irx3b gene. (C) Panels show lateral views of the posterior trunk of stable irx3b mutants stained for stc1, slc12a1 and cdh17 transcripts.
Videos
Video 1
Time-lapse imaging showing extrusion of the CS endocrine gland from the pronephric tubule Movie shows a lateral view of the posterior trunk region of a Tg(cdh17:egfp) embryo between 32 hpf and 48 hpf.
Green fluorescent cells label the pronephric tubule and the CS cells, with the latter observed as a bulge of cells that undergo extrusion during the time-lapse.
Tables
Table 1
Empirical results for the effect of irx3b morpholino on cdh17, stc1 and slc12a1 expression at 24 hpf, 36 hpf and 50 hpf Un-injected wild-type embryos showed no phenotypes in the pronephros.
The phenotypes for irx3b morphants are: slc12a1, reduction in staining; stc1, increased/ectopic staining; cdh17, expanded DL domain, reduced DE staining and reduced/stretched PST segment. Experiments were repeated multiple times (at least three times) and the results showed are from one representative experiment.
| slc12a1/stc1 | 24 hpf | 36 hpf | 50 hpf |
|---|---|---|---|
| Un-injected | 33 | 34 | 33 |
| irx3bmo slc12a1 phenotype | 17/23 | 27/32 | 30/39 |
| irx3bmo stc1 phenotype | 18/23 | 27/32 | 33/39 |
| cdh17/stc1 | 24 hpf | 36 hpf | 50 hpf |
|---|---|---|---|
| Un-injected | 27 | 30 | 31 |
| irx3bmo cdh17 phenotype | 25/27 | 29/31 | 30/38 |
| irx3bmo stc1 phenotype | 22/27 | 26/31 | 31/38 |
| cdh17/slc12a1 | 24 hpf | 36 hpf | 50 hpf |
|---|---|---|---|
| Un-injected | 23 | 23 | 27 |
| irx3bmo cdh17 phenotype | 24/27 | 29/30 | 32/35 |
| irx3bmo slc12a1 phenotype | 26/27 | 27/30 | 34/35 |
Additional files
-
Transparent reporting form
- https://doi.org/10.7554/eLife.38911.018
Download links
A two-part list of links to download the article, or parts of the article, in various formats.
Downloads (link to download the article as PDF)
Open citations (links to open the citations from this article in various online reference manager services)
Cite this article (links to download the citations from this article in formats compatible with various reference manager tools)
A novel mechanism of gland formation in zebrafish involving transdifferentiation of renal epithelial cells and live cell extrusion
eLife 7:e38911.
https://doi.org/10.7554/eLife.38911


