Feedback optimizes neural coding and perception of natural stimuli
- McGill University, Canada
Figures
Figure 1

(A) Schematic of the experimental setup showing the awake-behaving preparation where a stimulus (left) is presented to the animal while neural (upper middle) and behavioral (upper right) responses are recorded simultaneously.
The stimuli consisted of amplitude modulations of the animal’s own EOD: shown are an example AM waveform (blue), its envelope (red), and the full signal received by the animal (cyan) with their respective frequency contents. (B) Simplified schematic showing the relevant anatomy and circuitry of the electrosensory system. Peripheral receptors make excitatory synaptic contact with ON-type pyramidal cells (green) within the electrosensory lateral line lobe (ELL) and local interneurons (granule cells: GC) that inhibit OFF-type pyramidal cells (blue). All ELL pyramidal cells project to the midbrain torus semicircularis (TS) via the lateral lemniscus (LL), which in turn projects to higher brain areas (black) but also projects back to the nucleus praeeminentialis (nP). Stellate cells (St) within nP receive input from TS and project back to ELL pyramidal cells via the tractus stratum fibrosum (TsF). This feedback loop is known as the direct feedback pathway. A subclass of ELL pyramidal cells (deep cells) projects to nP multipolar cells (MP) that, together with several other cell types within nP (not shown) (Sas and Maler, 1983; Sas and Maler, 1987), in turn project to the Eminentia Granularis posterior (EGp) via the praeeminentialis electrosensory tract (PET). EGp granule cells (not shown) project back to ELL via parallel fibers (PF). This feedback loop is known at the indirect feedback pathway.
Figure 2
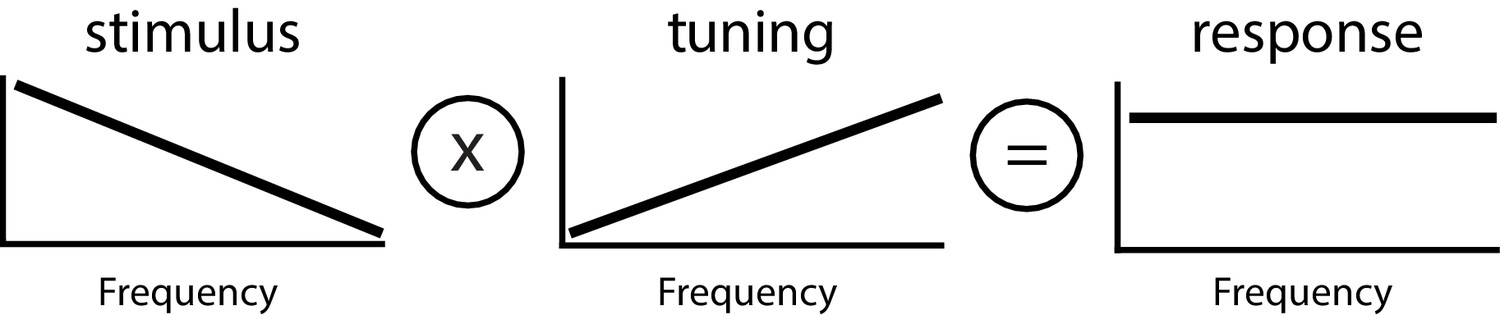
Principle of whitening by which the neural tuning curve (center) increases in order to effectively compensate for the decaying power spectrum of natural envelope stimuli (left), such that the resulting response power is independent of frequency (i.e., ‘whitened’, right).
https://doi.org/10.7554/eLife.38935.003
Figure 3
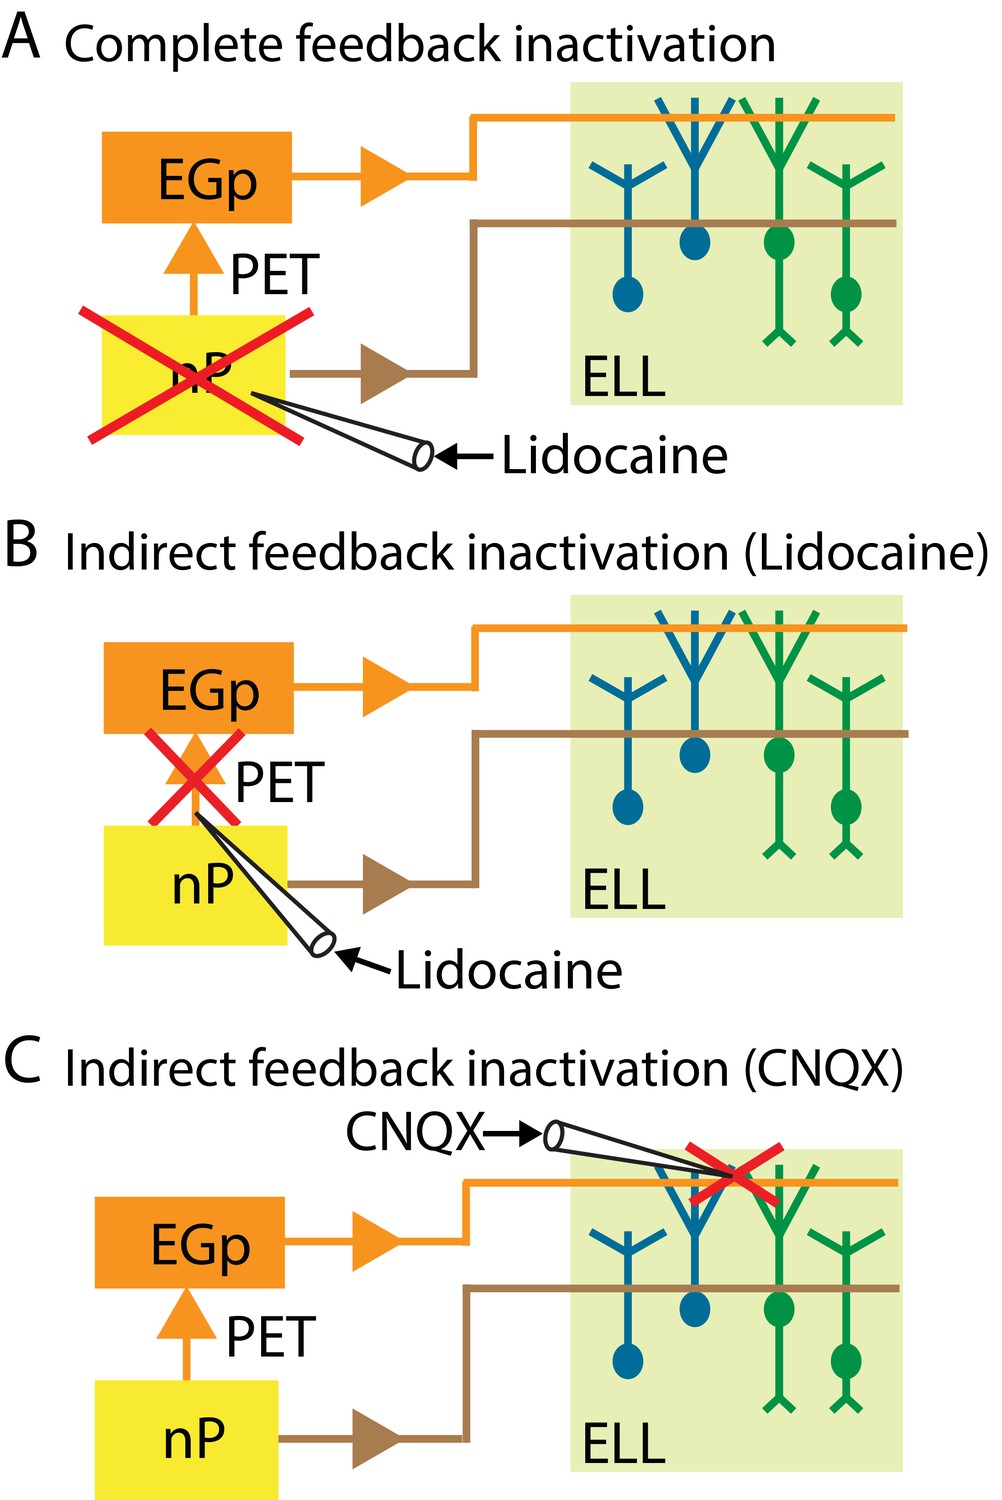
Summary of the different manipulations that were performed to either completely or selectively inactivate feedback input onto ELL pyramidal cells.
In all cases, neural recordings were obtained from pyramidal cells within the ipsilateral ELL. (A) Schematic showing a method to inactivate both the direct and the indirect feedback pathways (i.e., complete feedback inactivation) that involves injecting lidocaine bilaterally into nP. (B) Schematic showing a method to inactivate the indirect feedback that involves injecting lidocaine bilaterally (for behavior) or ipsilaterally (for neurons) into PET. (C) Schematic showing an alternative method to inactivate the indirect feedback that involves injecting CNQX into the ipsilateral ELL molecular layer.
Figure 4 with 3 supplements

Feedback input enhances and optimizes information transmission via whitening.
Results are shown before and after complete feedback inactivation was achieved via injection of lidocaine into nP. (A) Top: sinusoidal envelope waveform (red). Middle: time dependent firing rate from a typical ELL pyramidal cell before (black) and after (purple) lidocaine application. Bottom: spiking activity from this same neuron in response to stimulation before (black) and after (purple) lidocaine application. (B) Population-averaged tuning curve quantified by the neural gain as a function of envelope frequency before (black) and after (purple) lidocaine application. The dashed lines show the best power law fits to the data. Inset: Population-averaged best-fit power law exponents before (black) and after (purple) lidocaine injection were significantly different from one another (p=0.0156, Wilcoxon Signed-Rank Test). (C) Population-averaged neural response power as a function of envelope frequency before (black) and after (purple) lidocaine application. The dashed lines show the best power law fits to the data. (D) Top: sinusoidal envelope waveform (red). Bottom: time dependent EOD frequency from a typical fish before (black) and after (purple) lidocaine application. (E) Population-averaged behavioral gain as a function of envelope frequency before (black) and after (purple) lidocaine application. The dashed lines show the best power law fits to the data. Inset: Population-averaged best-fit power law exponents before (black) and after (purple) lidocaine injection were significantly different from one another (p=0.0313, Wilcoxon Signed-Rank Test). (F) Left: population-averaged white index values before (black) and after (purple) lidocaine application were significantly different from one another (p=0.0234, Wilcoxon Signed-Rank Test). Right: population-averaged relative changes in neural (left) and behavioral (right) gain following lidocaine application were both significantly different from zero (neuron: p=4.77*10−4, Wilcoxon Signed-Rank Test, behavior: p=0.002, Wilcoxon Signed-Rank Test). ‘*' indicates statistical significance at the p=0.05 level.
Figure 4—figure supplement 1
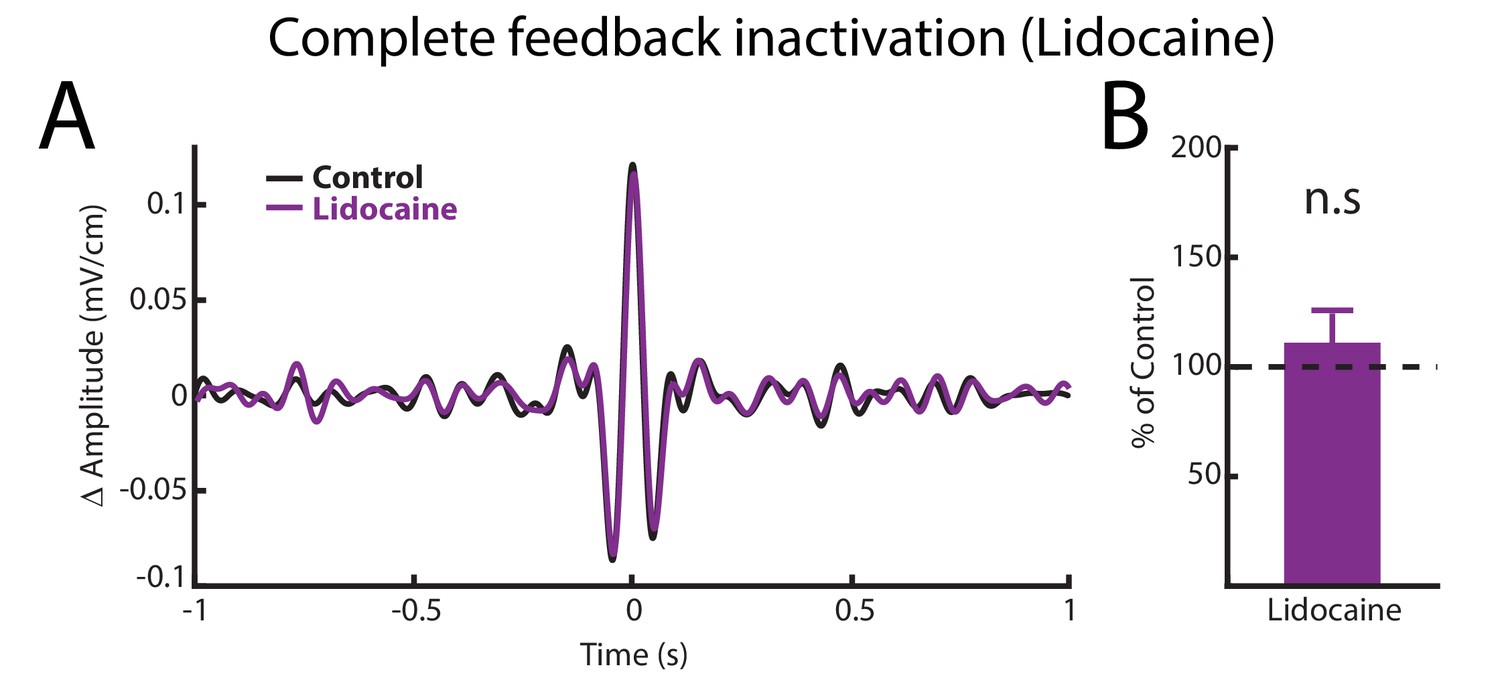
Complete feedback inactivation does not affect ELL pyramidal cell responses to AMs.
(A) Spike-triggered average (STA) of the noisy AM stimulus waveform before (black) and after (purple) complete feedback inactivation for a typical ON-type pyramidal cell. (B) Population-averaged STA amplitudes before and after injection were not significantly different from one another (p=0.469, Wilcoxon Signed-Rank Test).
Figure 4—figure supplement 2
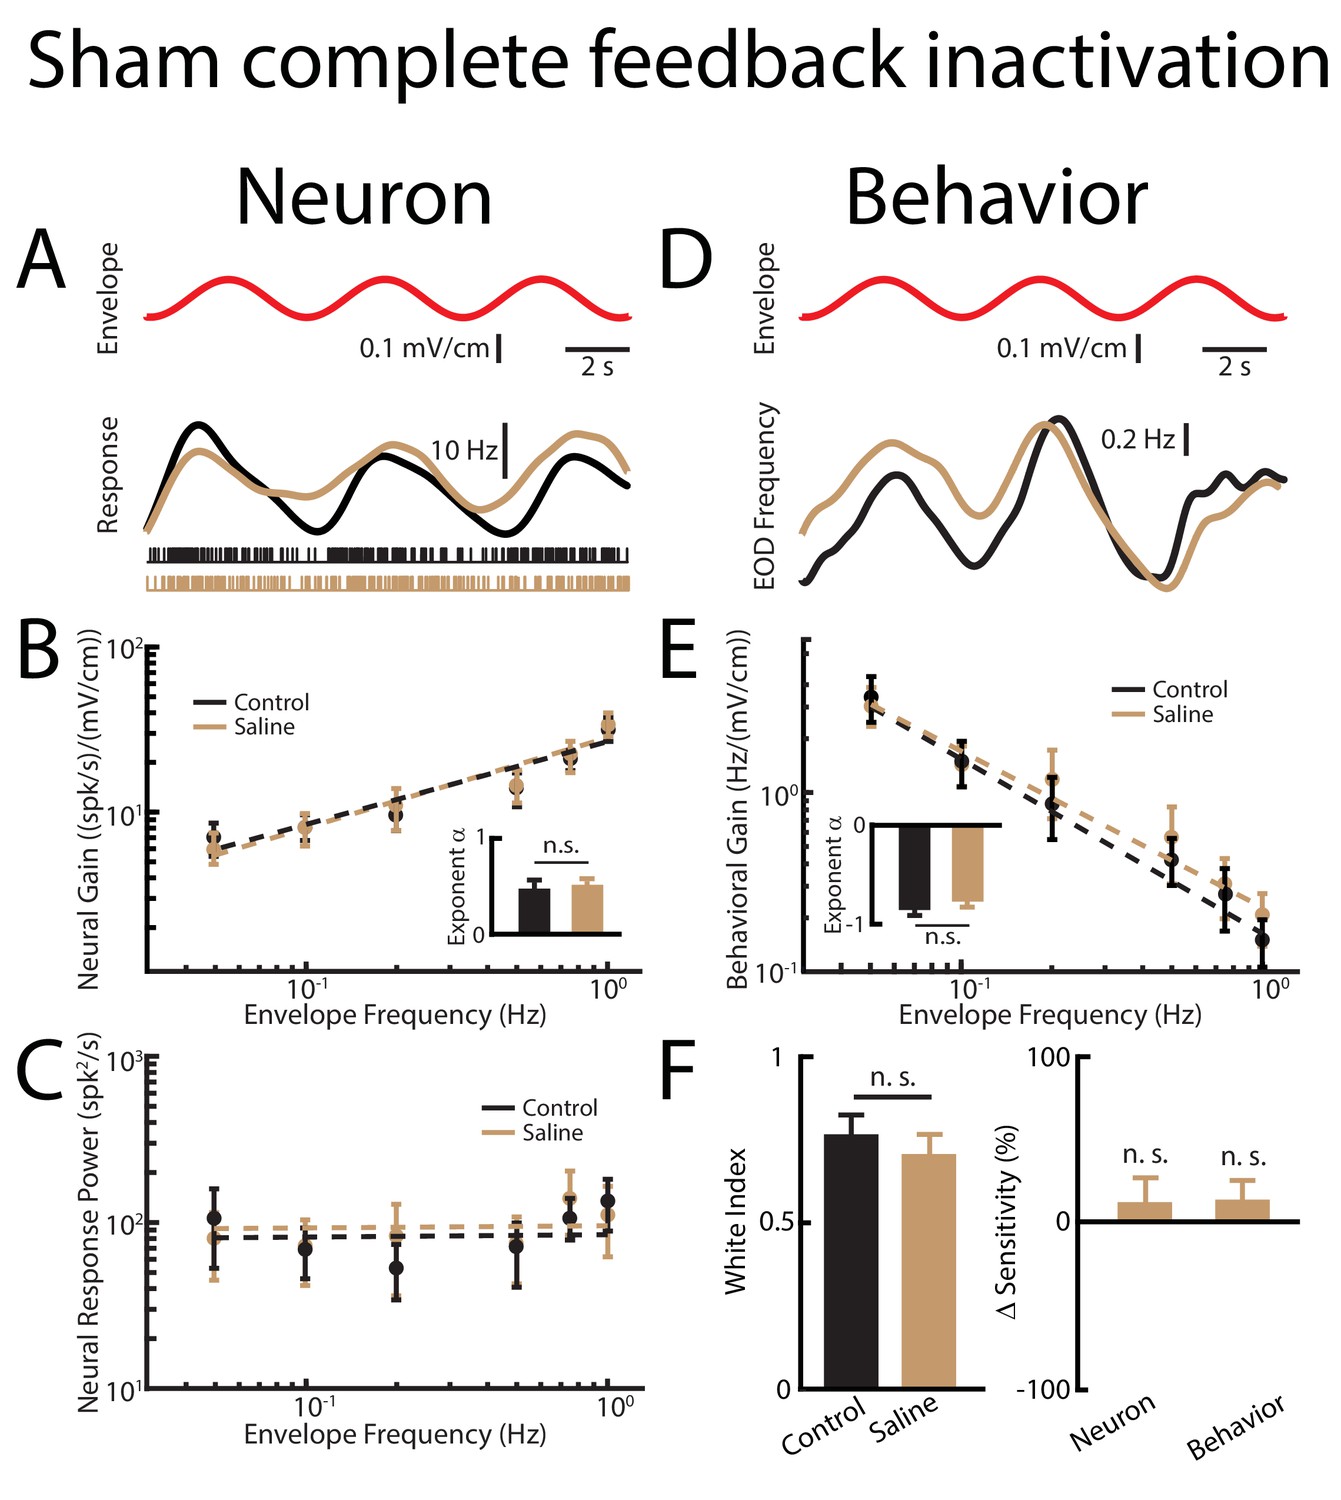
Sham complete feedback inactivation achieved by injecting saline bilaterally into nP has no effect on behavior and ELL pyramidal cell tuning properties, as well as optimized coding of natural stimuli.
(A) Top: sinusoidal envelope waveform (red). Middle: time dependent firing rate from a typical ELL pyramidal cell before (black) and after (beige) saline application. Bottom: spiking activity from this same neuron before (black) and after (beige) saline application. (B) Population-averaged tuning curve quantified by the neural gain as a function of envelope frequency before (black) and after (beige) saline application. The dashed lines show the best power law fits to the data. Inset: population-averaged best-fit power law exponent before (black) and after (beige) saline injection. No significant changes were observed (p=0.641 Wilcoxon Signed-Rank Test). (C) Population-averaged neural response power before (black) and after (beige) saline application. The dashed lines show the best power law fits to the data. (D) Top: Sinusoidal envelope waveform (red). Bottom: time dependent EOD frequency in response to the stimulus from a typical fish before (black) and after (beige) saline application. (E) Population-averaged behavioral gain as a function of envelope frequency before (black) and after (beige) saline application. The dashed lines show the best power law fits to the data. Inset: population-averaged best-fit power law exponent before (black) and after (beige) saline injection. No significant changes were observed (p=0.938, Wilcoxon Signed-Rank Test). (F) Left: population-averaged white index values before (black) and after (beige) saline application. No significant changes were observed (p=0.547, Wilcoxon Signed-Rank Test). Right: population-averaged relative changes in neural and behavioral sensitivities following saline application. No significant changes were observed (neuron: p=0.710, Wilcoxon Signed-Rank Test, behavior p=0.750, Wilcoxon Signed-Rank Test). ‘n. s.’ indicates that the p-value was greater than 0.05.
Figure 4—figure supplement 3
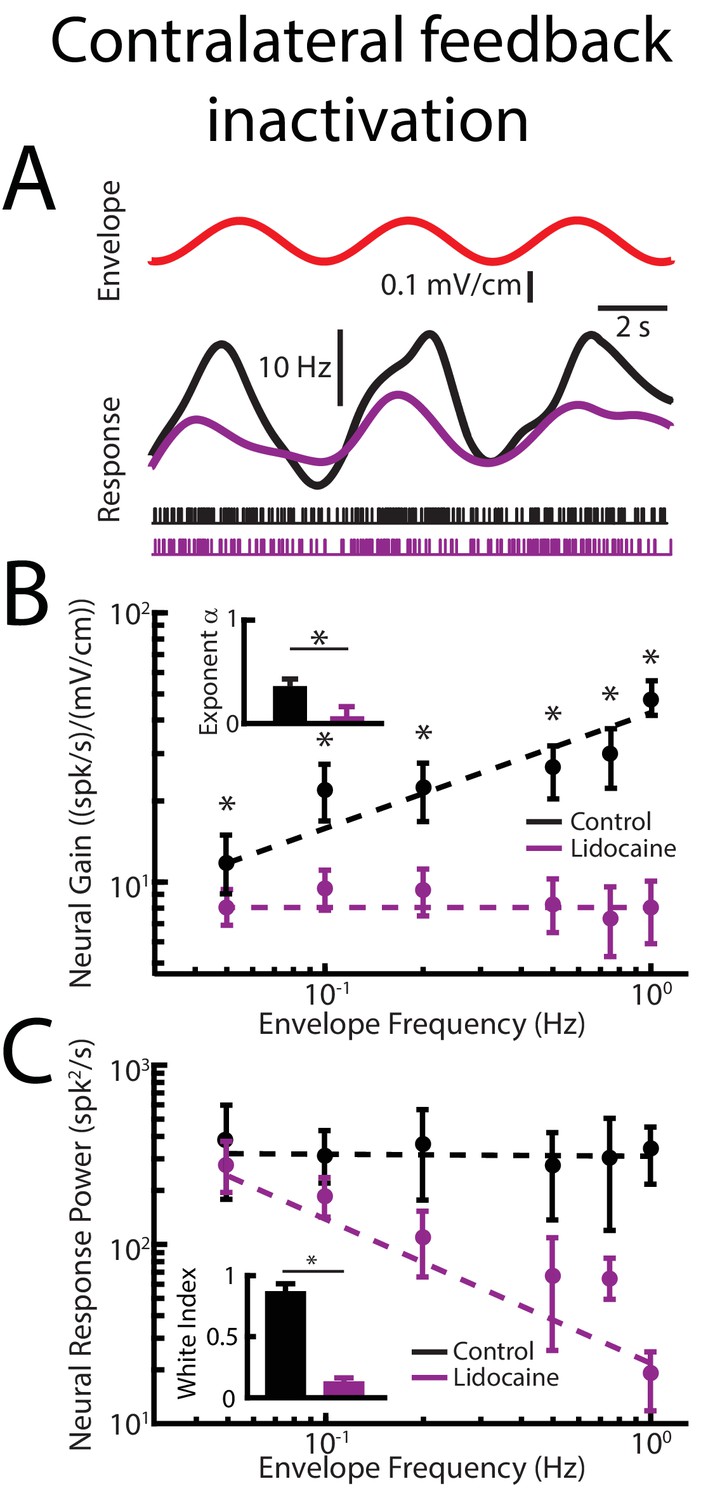
Contralateral feedback inactivation achieved by injecting lidocaine into the contralateral nP gives rise to effects qualitatively similar to those observed when injecting lidocaine bilaterally when recording from pyramidal cells within the ipsilateral ELL.
(A) Top: sinusoidal envelope waveform (red). Middle: time dependent firing rate from a typical ELL pyramidal cell before (black) and after (purple) contralateral lidocaine application. Bottom: spiking activity from this same neuron before (black) and after (purple) lidocaine application. (B) Population-averaged tuning curve quantified by neural gain as a function of envelope frequency before (black) and after (purple) lidocaine application. The dashed lines show the best power law fits to the data. Inset: population-averaged best-fit power law exponent before (black) and after (purple) lidocaine application (p=0.0039, Wilcoxon Signed-Rank Test). (C) Population-averaged neural response power as a function of envelope frequency before (black) and after (purple) lidocaine application. The dashed lines show the best power law fits to the data. Inset: white index for neural response power before (black) and after (purple) lidocaine application (p=0.0156, Wilcoxon Signed-Rank Test).
Figure 5 with 3 supplements
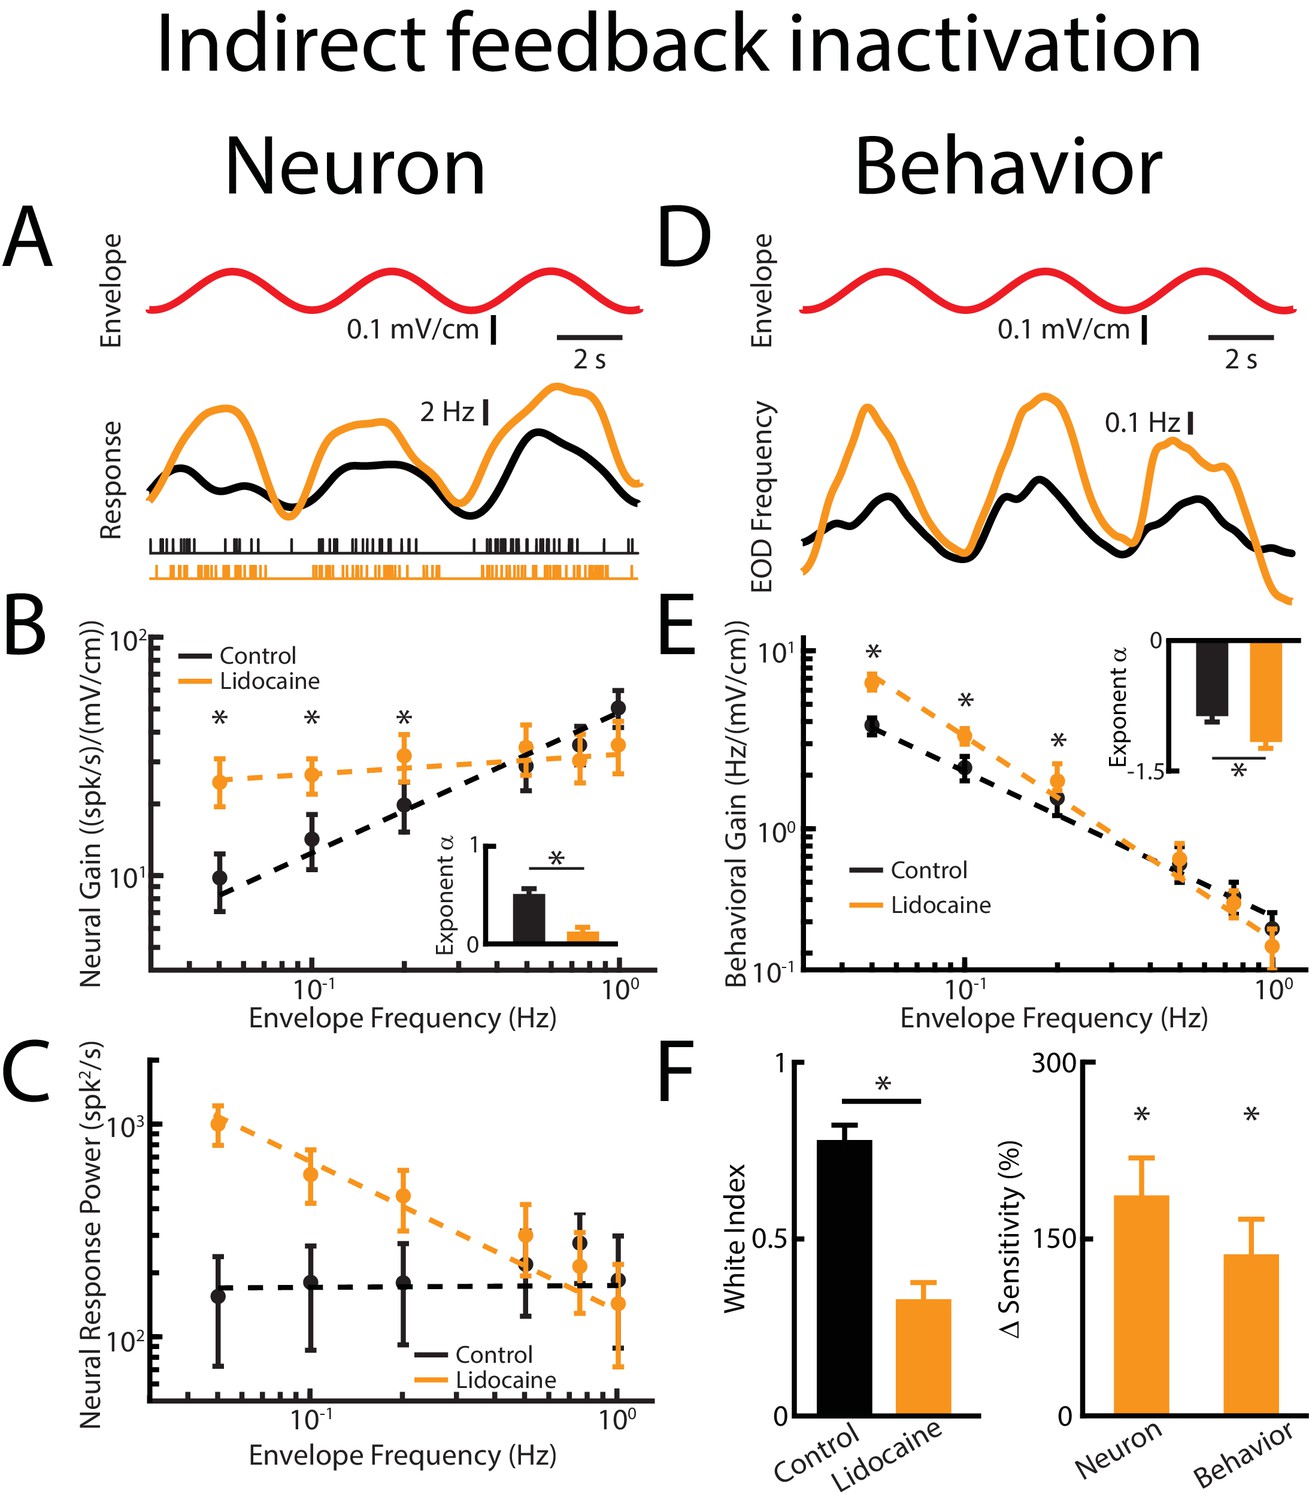
Direct feedback input enhances while indirect input optimizes neural responses.
Results are shown before and after indirect feedback inactivation was achieved via bilateral injection of lidocaine into the PET. Data obtained from ELL pyramidal neurons were pooled as there are no significant differences between the envelope response of ON- and OFF-type pyramidal cells (Huang and Chacron, 2016). (A) Top: Sinusoidal envelope waveform (red). Middle: Time dependent firing rate from a typical ELL pyramidal cell before (black) and after (orange) lidocaine application. Bottom: spiking activity from this same neuron in response to stimulation before (black) and after (orange) lidocaine application. (B) Population-averaged tuning curve quantified by neural gain to sinusoidal envelopes as a function of envelope frequency before (black) and after (green) lidocaine application. The dashed lines show the best power law fits to the data. Inset: population-averaged best-fit power law exponent before (black) and after (orange) lidocaine injection (p=0.0039, Wilcoxon Signed-Rank Test). (C) Population-averaged neural response power as a function of envelope frequency before (black) and after (orange) lidocaine application. The dashed lines show the best power law fits to the data. (D) Top: sinusoidal envelope waveform (red). Bottom: Time dependent EOD frequency from a typical fish before (black) and after bilateral (orange) lidocaine injection. (E) Population-averaged behavioral gain as a function of envelope frequency before (black) and after (orange) lidocaine injection. Inset: population-averaged best-fit power law exponent before (black) and after (orange) lidocaine injection (p=0.0234, Wilcoxon Signed-Rank Test). The dashed lines show the best power law fits to the data. (F) Left: population-averaged white index before (black) and after (orange) lidocaine application (p=0.0273, Wilcoxon Signed-Rank Test). Right: population-averaged relative changes in neural and behavioral sensitivity following lidocaine application (neuron: p=7.03*10−6, Wilcoxon Signed-Rank Test, behavior: p=6.74*10−4, Wilcoxon Signed-Rank Test). ‘*' indicates statistical significance at the p=0.05 level.
Figure 5—figure supplement 1
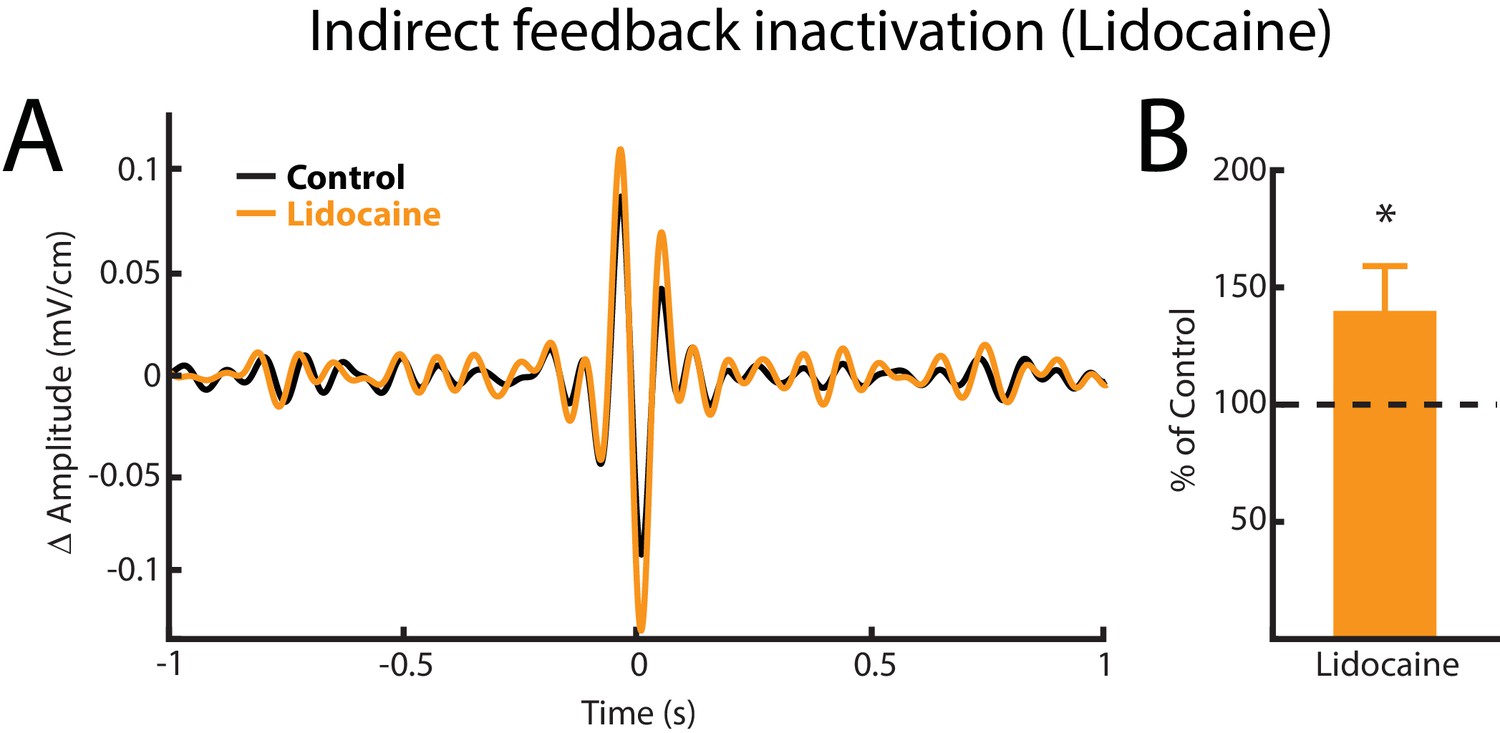
Indirect feedback inactivation achieved by injecting lidocaine bilaterally into PET increases ELL pyramidal cell responses to AMs, consistent with previous results (Bastian, 1986b).
(A) Spike-triggered average (STA) of the noisy AM stimulus waveform from an example ELL pyramidal cell before (black) and after (orange) lidocaine injection. (B) Population-averaged STA amplitude was significantly increased by lidocaine injection (p=0.0391, Wilcoxon Signed-Rank Test).
Figure 5—figure supplement 2
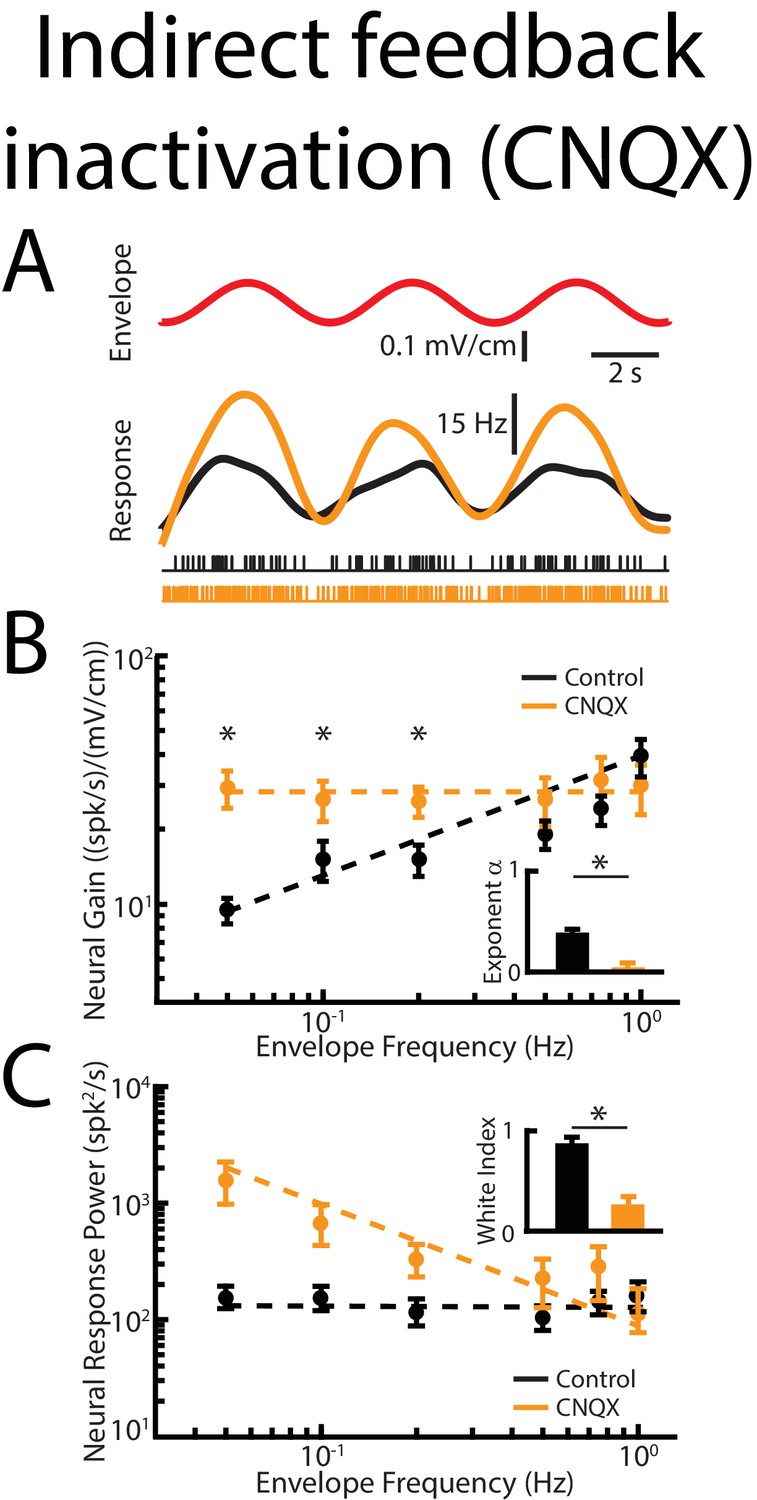
Indirect feedback inactivation achieved by injecting CNQX within the ELL molecular layer gives rise to effects on ELL pyramidal cell responses to envelopes that are qualitatively similar to those observed when injecting lidocaine into PET.
(A) Top: sinusoidal envelope waveform (red). Middle: time dependent firing rate from a typical ELL pyramidal cell before (black) and after (orange) CNQX application. Bottom: spiking activity from this same neuron in response to stimulation before (black) and after (orange) CNQX application. (B) Population-averaged tuning curve quantified by neural gain as a function of envelope frequency before (black) and after (orange) CNQX application. The dashed lines show the best power law fits to the data. Inset: Population-averaged best-fit power law exponent before (black) and after (orange) CNQX application were significantly different from one another (p=0.0156, Wilcoxon Signed-Rank Test). (C) Population-averaged neural response power as a function of envelope frequency before (black) and after (orange) CNQX application. The dashed lines show the best power law fits to the data. Inset: Population-averaged white index values before (black) and after (orange) CNQX application were significantly different from one another (p=0.039, Wilcoxon Signed-Rank Test).
Figure 5—figure supplement 3
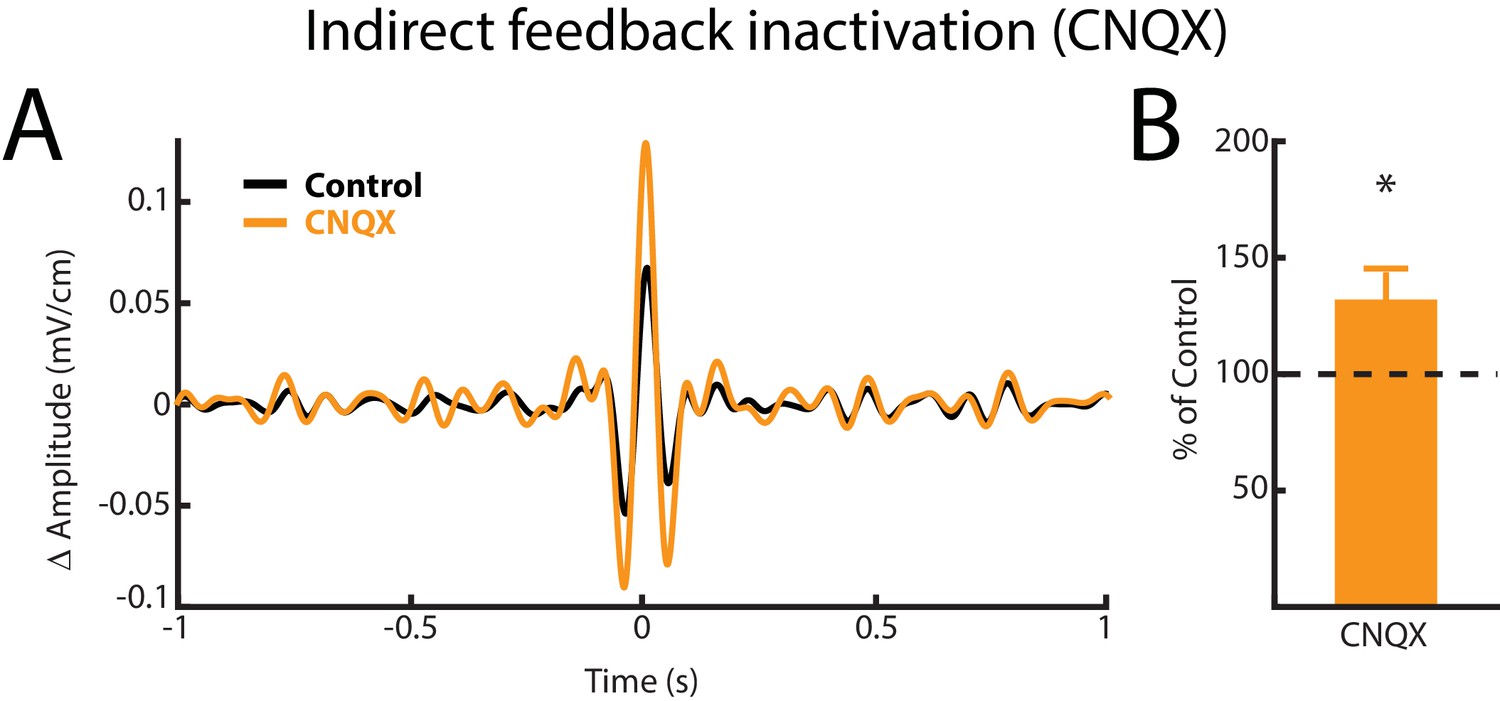
Indirect feedback inactivation achieved by injecting CNQX within the ELL molecular layer increases ELL pyramidal cell responses to AMs, consistent with previous results (Bastian et al., 2004; Clarke and Maler, 2017).
(A) Spike-triggered average (STA) of the noisy AM stimulus waveform from an example ELL pyramidal cell before (black) and after (orange) CNQX injection. (B) Population-averaged STA amplitude was significantly increased by CNQX injection (p=0.008, Wilcoxon Signed-Rank Test).
Figure 6 with 1 supplement
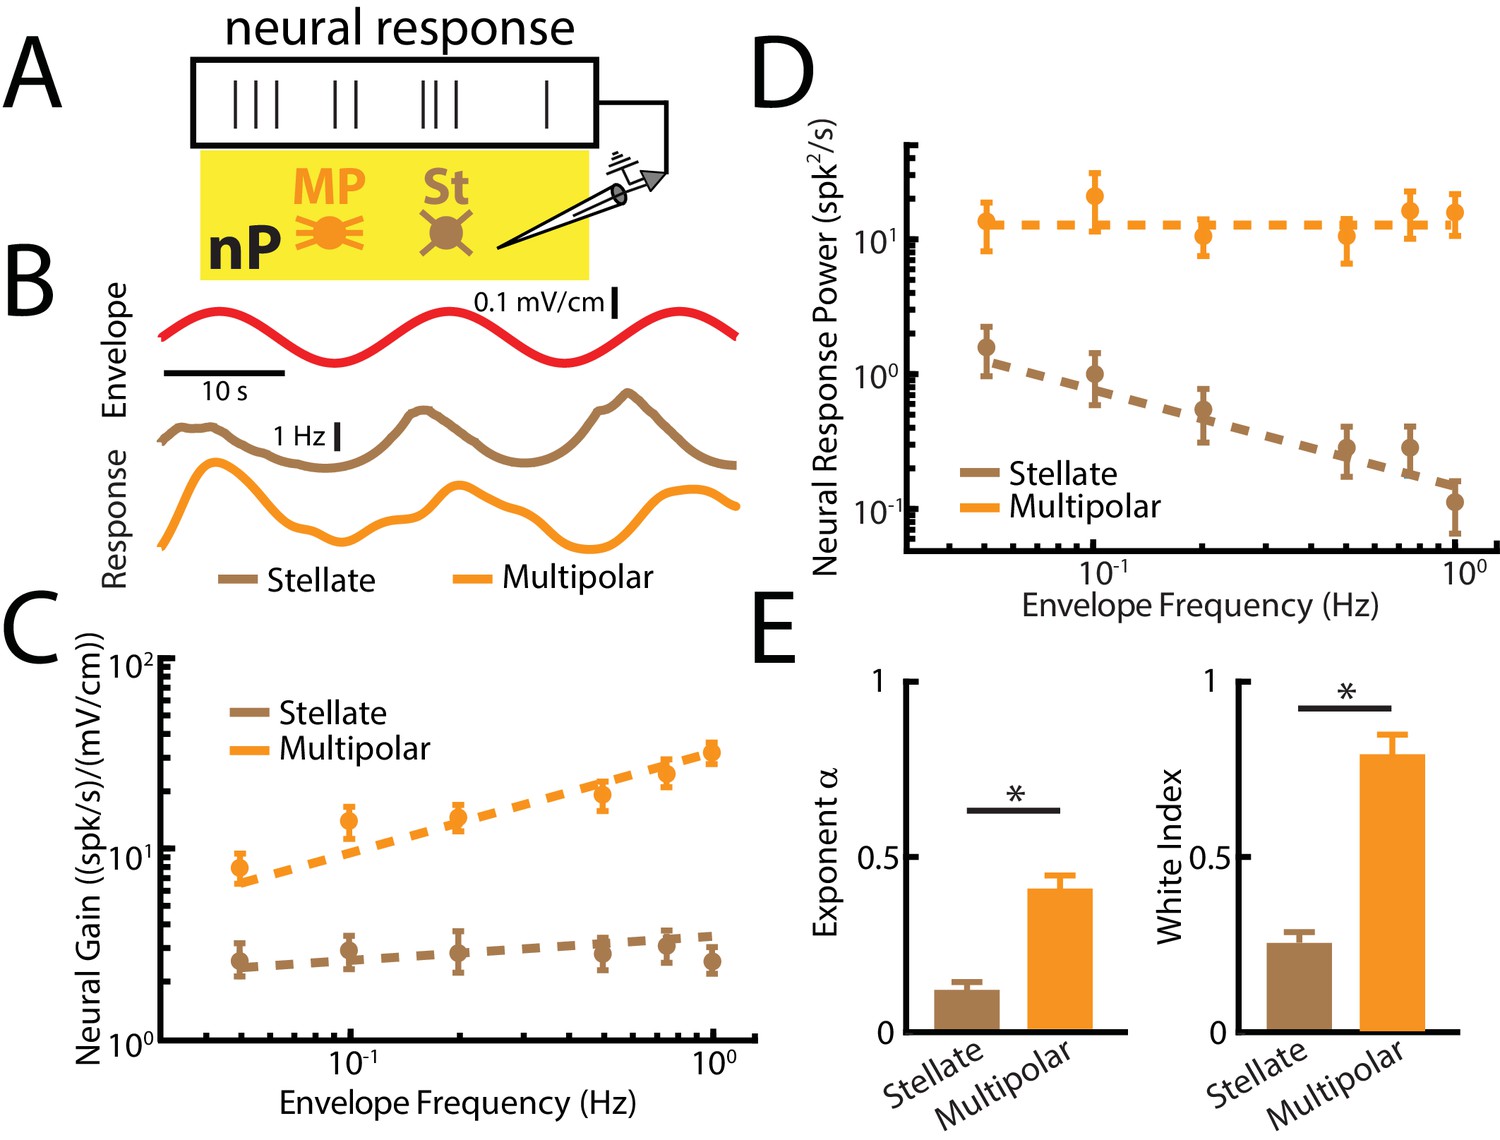
nP neurons projecting indirectly to ELL display tuning properties that are optimized to natural stimulus statistics.
(A) Recordings were obtained from either Stellate (St) or multipolar (MP) cells within nP. (B) Top: sinusoidal envelope waveform (red). Bottom: Time dependent firing from typical nP stellate (brown) and multipolar (orange) cells. (C) Population-averaged tuning curve quantified by neural gain as a function of envelope frequency for nP stellate (brown) and multipolar (orange) cells. The dashed lines show the best power law fits to the data. (D) Population-averaged neural response power for stellate (brown) and multipolar (orange) cells. The dashed lines show the best power law fits to the data. (E) Population-averaged best-fit power law exponents (left) and white index (right) values for stellate (brown) and multipolar (orange) cells. In both cases, values obtained for stellate and multipolar cells were significantly different from one another (exponent: χ2 = 12, p=5.32*10 - 4, Kruskal-Wallis ANOVA; white index: χ2 = 10.7, p=0.0011, Kruskal-Wallis ANOVA). ‘*' indicates statistical significance at the p=0.05 level.
Figure 6—figure supplement 1
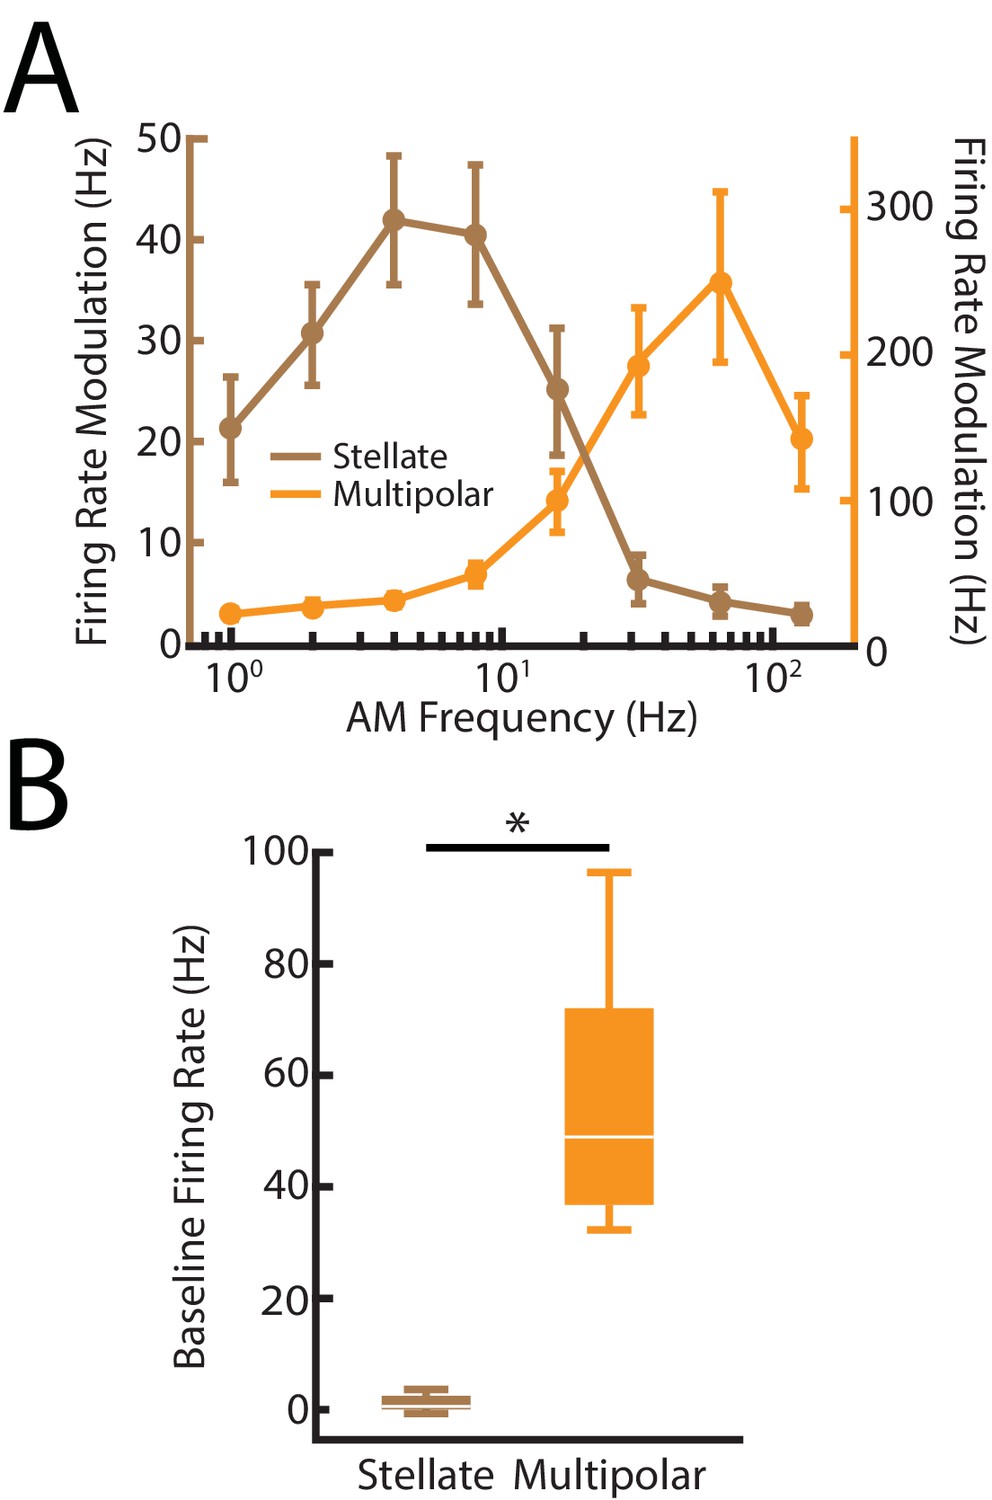
Distinguishing between nP stellate and multipolar cells using previously characterized differences in their electrophysiological properties.
(A) Brown: AM frequency tuning curve for nP stellate cells. Note that the tuning curve rapidly drops off at higher frequencies > 32 Hz due to a lack of spiking responses to those frequencies. Orange: AM frequency tuning curve for nP multipolar cells. Note that the multipolar cells in contrast respond to the higher frequencies > 32 Hz. The tuning curves are in agreement with previous studies (Bastian and Bratton, 1990; Bratton and Bastian, 1990). (B) Whisker-boxplot of baseline (i.e., in the absence of stimulation firing rate distributions of stellate (brown) and multipolar (orange) cells from our dataset. Consistent with previous studies (Bastian and Bratton, 1990; Bratton and Bastian, 1990), multipolar cells have significantly higher baseline firing rates than stellate cells (χ2 = 12, p=5.32*10- 4, Kruskal-Wallis ANOVA). ‘*' indicates statistical significance at the p=0.05 level.
Additional files
-
Transparent reporting form
- https://doi.org/10.7554/eLife.38935.015
Download links
A two-part list of links to download the article, or parts of the article, in various formats.
Downloads (link to download the article as PDF)
Open citations (links to open the citations from this article in various online reference manager services)
Cite this article (links to download the citations from this article in formats compatible with various reference manager tools)
Feedback optimizes neural coding and perception of natural stimuli
eLife 7:e38935.
https://doi.org/10.7554/eLife.38935


