A mechanism for exocytotic arrest by the Complexin C-terminus
- University of Saarland, Germany
- Otto-von-Guericke University, Germany
Figures
Figure 1 with 2 supplements
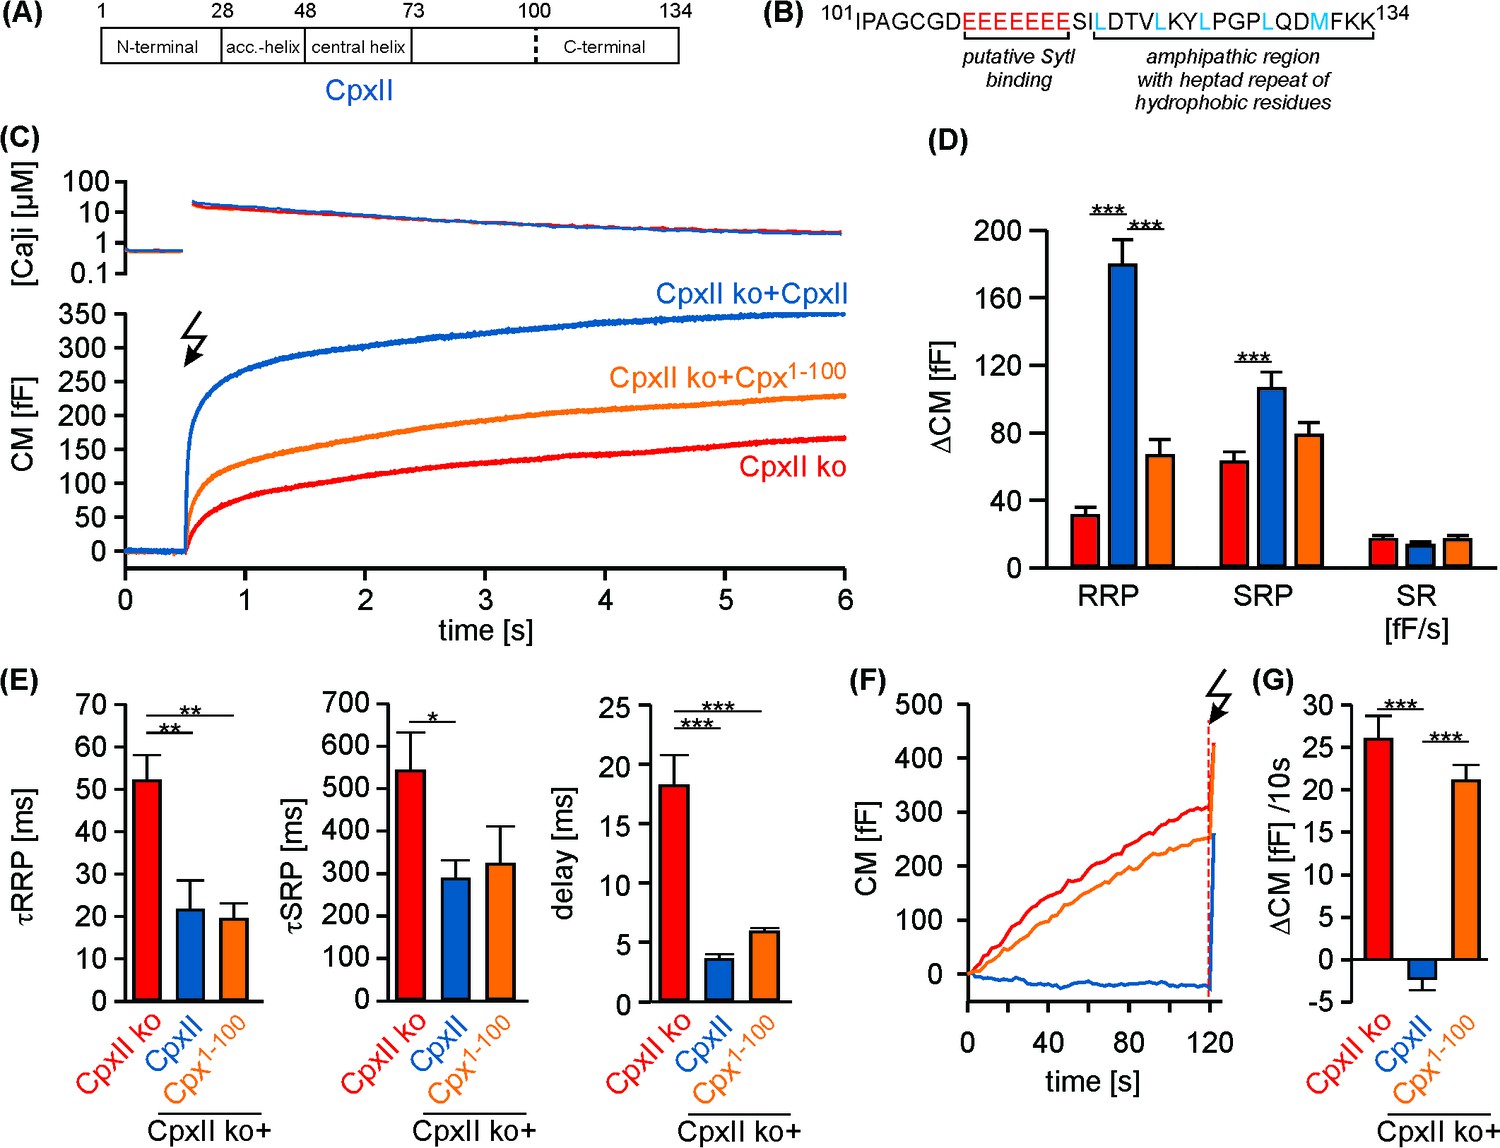
The C-terminal domain of CpxII controls the magnitude of synchronous secretion.
(A) Schematic view on CpxII subdomains (numbers indicate amino acid positions within CpxII). (B) Primary sequence of the CpxII C-terminal region (residue 101–134) highlighting its structural characteristics (glutamate cluster, red; heptad repeat of hydrophobic residues, blue). (C) Mean [Ca2+]i levels (top) and corresponding CM signals (bottom) of CpxII ko cells (n = 25) and those expressing CpxII (n = 32) or the mutant Cpx1-100 (n = 29). Flash is at t = 0.5 s (arrow). (D) Amplitudes of RRP and SRP, the rate of sustained release (SR; femtofarad/second) determined for CpxII ko (red), CpxII ko + CpxII (blue), CpxII ko+Cpx1-100 (orange). (E) The time constants for the EB components (τRRP and τSRP), and the exocytotic delay. (F) Mean tonic CM traces of the cells shown in (C) before the triggering flash response (arrow). (G) The rate of tonic exocytosis (determined at similar [Ca2+]i: in nM, CpxII ko: 714 ± 32; CpxII ko + CpxII: 639 ± 23; CpxII ko+ CpxII1-100: 628 ± 30) is significantly reduced with CpxII but not with its mutant. ANOVA followed by Tukey-Kramer post-hoc test. *p<0.05; **p<0.01; ***p<0.001. Error bars indicate mean ± SEM.
Figure 1—figure supplement 1
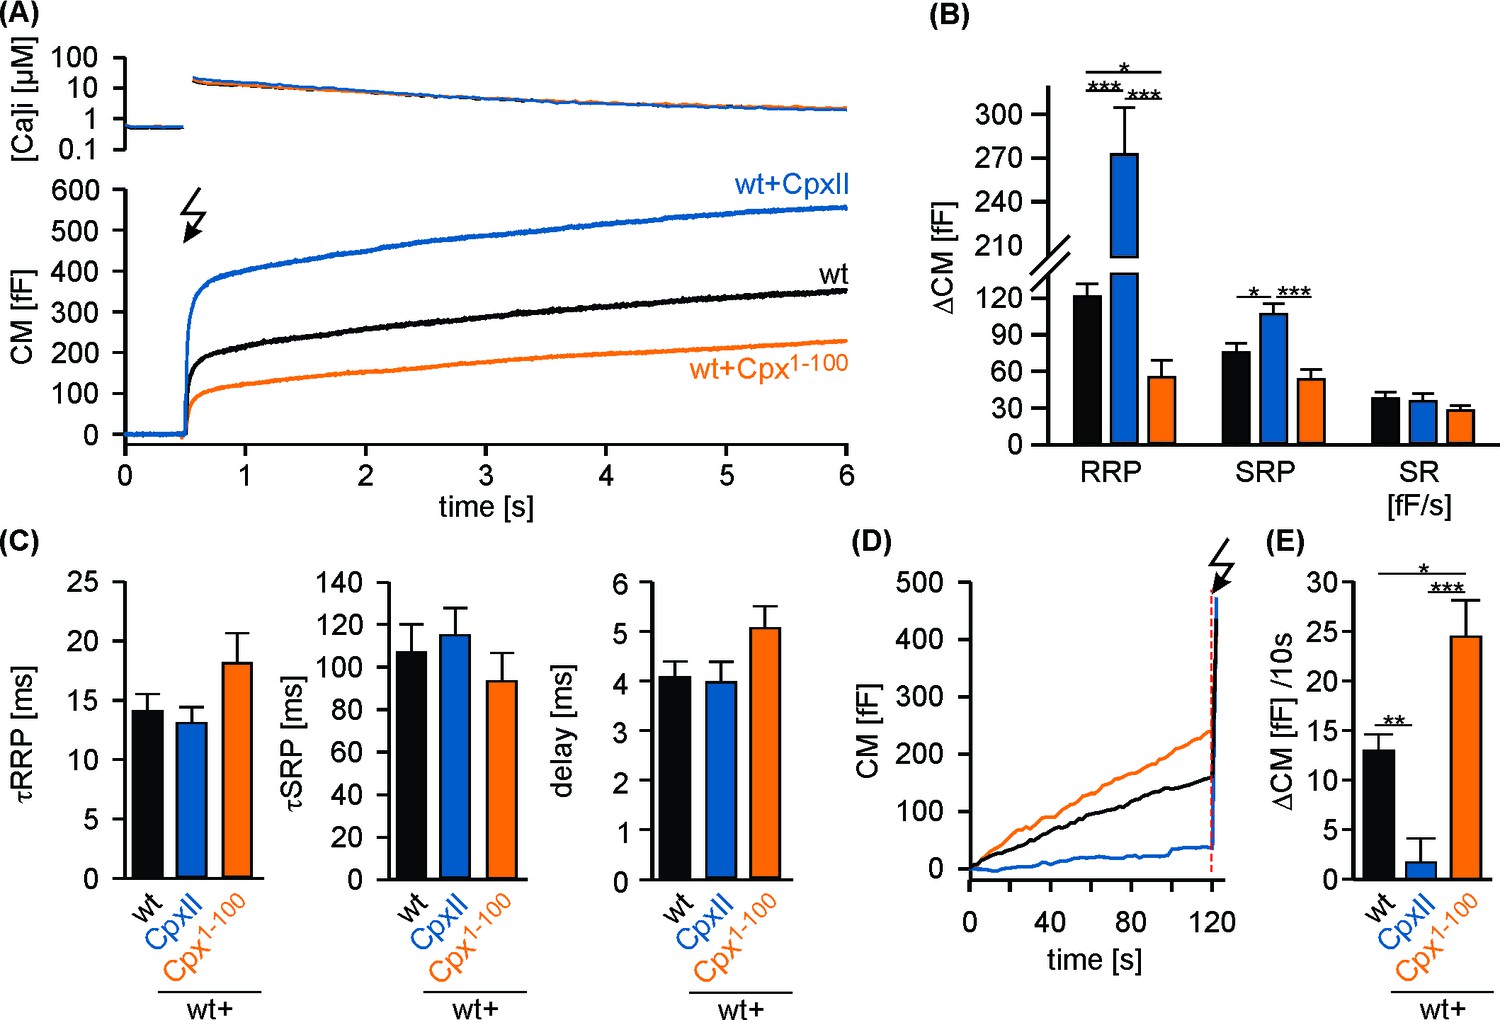
CpxII1-100 competes with the endogenous CpxII for the control of secretion.
(A) Mean [Ca2+]i levels (top) and corresponding CM signals (bottom) of wt cells (n = 17) and those over expressing CpxII (n = 14) or the mutant Cpx1-100 (n = 16). Flash is at t = 0.5 s (arrow). (B) Amplitudes of RRP and SRP, the rate of sustained release (SR; femtofarad/second) determined for wt (black), CpxII (blue), Cpx1-100 (orange). (C) The time constants for the EB components (τRRP and τSRP), and the exocytotic delay. (D) Mean tonic CM traces of the cells shown in (A) during infusion of similar submicromolar [Ca2+]i. (E) Rate of tonic exocytosis determined at similar [Ca2+]i (in nM, wt: 552 ± 25; wt + CpxII: 541 ± 17; wt+ Cpx1-100: 533 ± 38) before the flash. ANOVA followed by Tukey-Kramer post-hoc test. *p<0.05; **p<0.01; ***p<0.001. Error bars indicate mean ± SEM.
Figure 1—figure supplement 2

CpxII CTD clamps tonic release and hinders the expansion of the initial fusion pore.
(A) Mean CM response upon intracellular infusion of 19 µM free Ca2+ containing solution in wt cells (black) and wt cells expressing either full-length CpxII (blue) or Cpx1-100 (orange). (B) Corresponding changes in total ΔCM (top, after 120 s) and amperometric event frequency (bottom) averaged from the indicated number of cells. (C) Cumulative frequency distributions for the indicated parameters of the main amperometric spike. (D) Expression of CpxII (blue) but not Cpx1-100(orange) increases the prespike duration and charge when compared with controls (black). (E) Exemplary prespike signals (area highlighted in white indicate the prespike phase) for wt cells and those expressing CpxII. Fluctuations of transmitter release during the prespike phase are reduced with CpxII expression. Deflections of the current derivative (red trace) beyond the threshold (dashed lines = ±4 xSD of base line noise) were counted as fluctuations (blue trace). The displayed exemplary events have similar total charge and 50–90% rise time (wt: 328 fC, 240 µs; wt + CpxII: 349 fC, 280 µs), indicating that the different fluctuation behavior is not due to diffusional smearing. (F) Cell-weighted averages of prespike duration and charge indicate significant alterations in fusion pore dynamics with CpxII expression. (G, H) Fluctuation frequency (upward and downward deflections) and rms noise of the current derivative during the prespike are reduced with expression of CpxII but not Cpx1-100. Cell-weighted average values are given as mean of median determined from the parameter’s frequency distribution for each cell. Data are collected from cells/events measured for wt (18/2011), wt + CpxII (18/1085), wt+Cpx1-100 (18/3492). Only cells with >20 events were considered. Data are represented as mean ± SEM. ANOVA followed by Tukey-Kramer post-hoc test. **p<0.01, ***p<0.001.
Figure 2 with 1 supplement
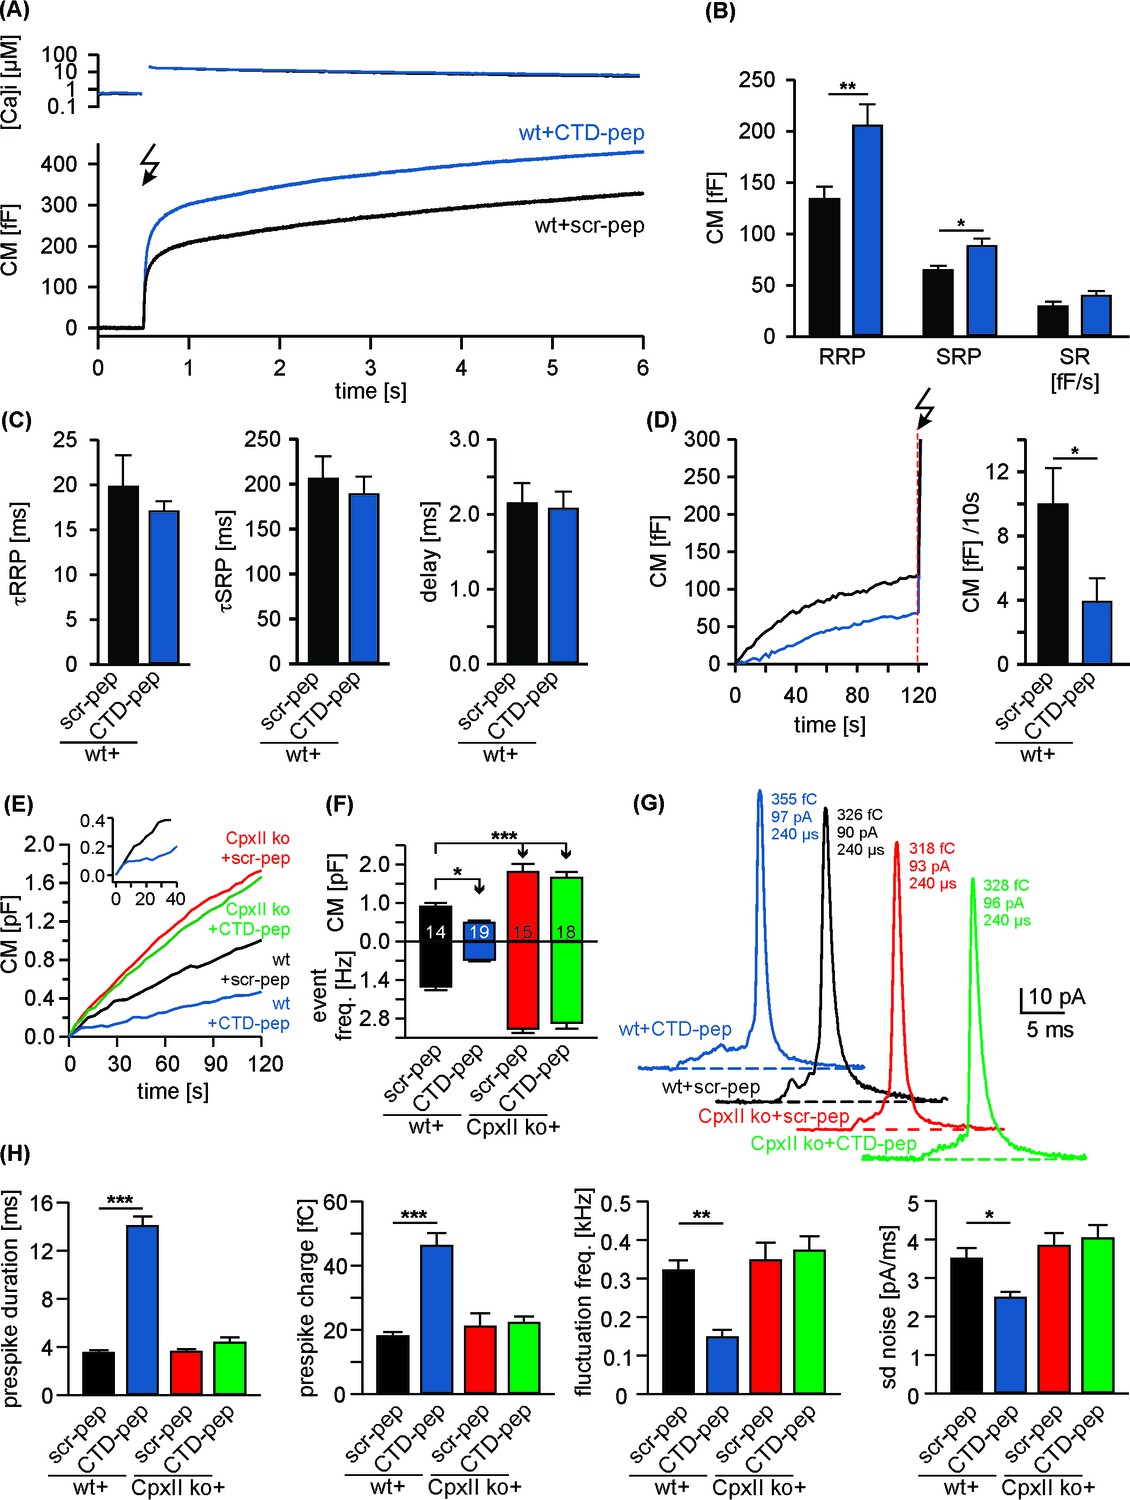
Acute infusion of CpxII-CTD inhibits premature exocytosis and boosts synchronous secretion.
(A) Mean [Ca2+]i levels (top) and corresponding capacitance responses (bottom) of wt cells infused with either CpxII C-terminal peptide (wt + CTD pep, n = 29) or scrambled peptide (wt + scr pep, n = 29). Flash is at t = 0.5 s (arrow). (B) RRP and SRP size are significantly enhanced with CTD-pep infusion. (C) Neither the CTD-pep nor its scramble variant alters the kinetics of stimulus-secretion coupling (τRRP, τSRP and delay). (D) Mean tonic CM increase of the cells shown in A (left panel) before the UV-flash (arrow). Mean rate of ΔCM over 120 s (right panel, Mann Whitney U-test versus control). (E–H) CpxII-CTD is essential but not sufficient for clamping tonic release and early fusion pore. (E) The CTD-pep reduces tonic secretion (upon infusion with 19 µM [Ca2+]i) in wt cells, but fails to do so in CpxII ko cells (t = 0 is the time point about 10–15 s after establishing the whole-cell configuration). The inset displays the initial CM response of wt cells infused with scr-pep (black) or CTD-pep (blue) at the expanded time scale. (F) Total ΔCM after 120 s (upper panel) and amperometric event frequency (lower panel, numbers indicate averaged cells). (G) Exemplary single vesicular release events (with similar charge and 50–90% rise time) illustrate the CTD-mediated increase in prespike duration only in wt cells (colour code as in E). (H) CTD-pep infusion significantly reduces fusion pore dynamics in wt cells but not in CpxII ko cells. Values are given as mean of median determined from the parameter’s frequency distribution for each cell. Data are averaged from cells/events measured for wt + scr pep (14/1531), wt + CTD pep (19/889), CpxII ko+ scr pep (15/2692) and CpxII ko+ CTD pep (18/3052) (>20 events/cell). Error bars indicate mean ± SEM. ANOVA followed by Tukey-Kramer post-hoc test. *p<0.05, **p<0.01, ***p<0.001.
Figure 2—figure supplement 1
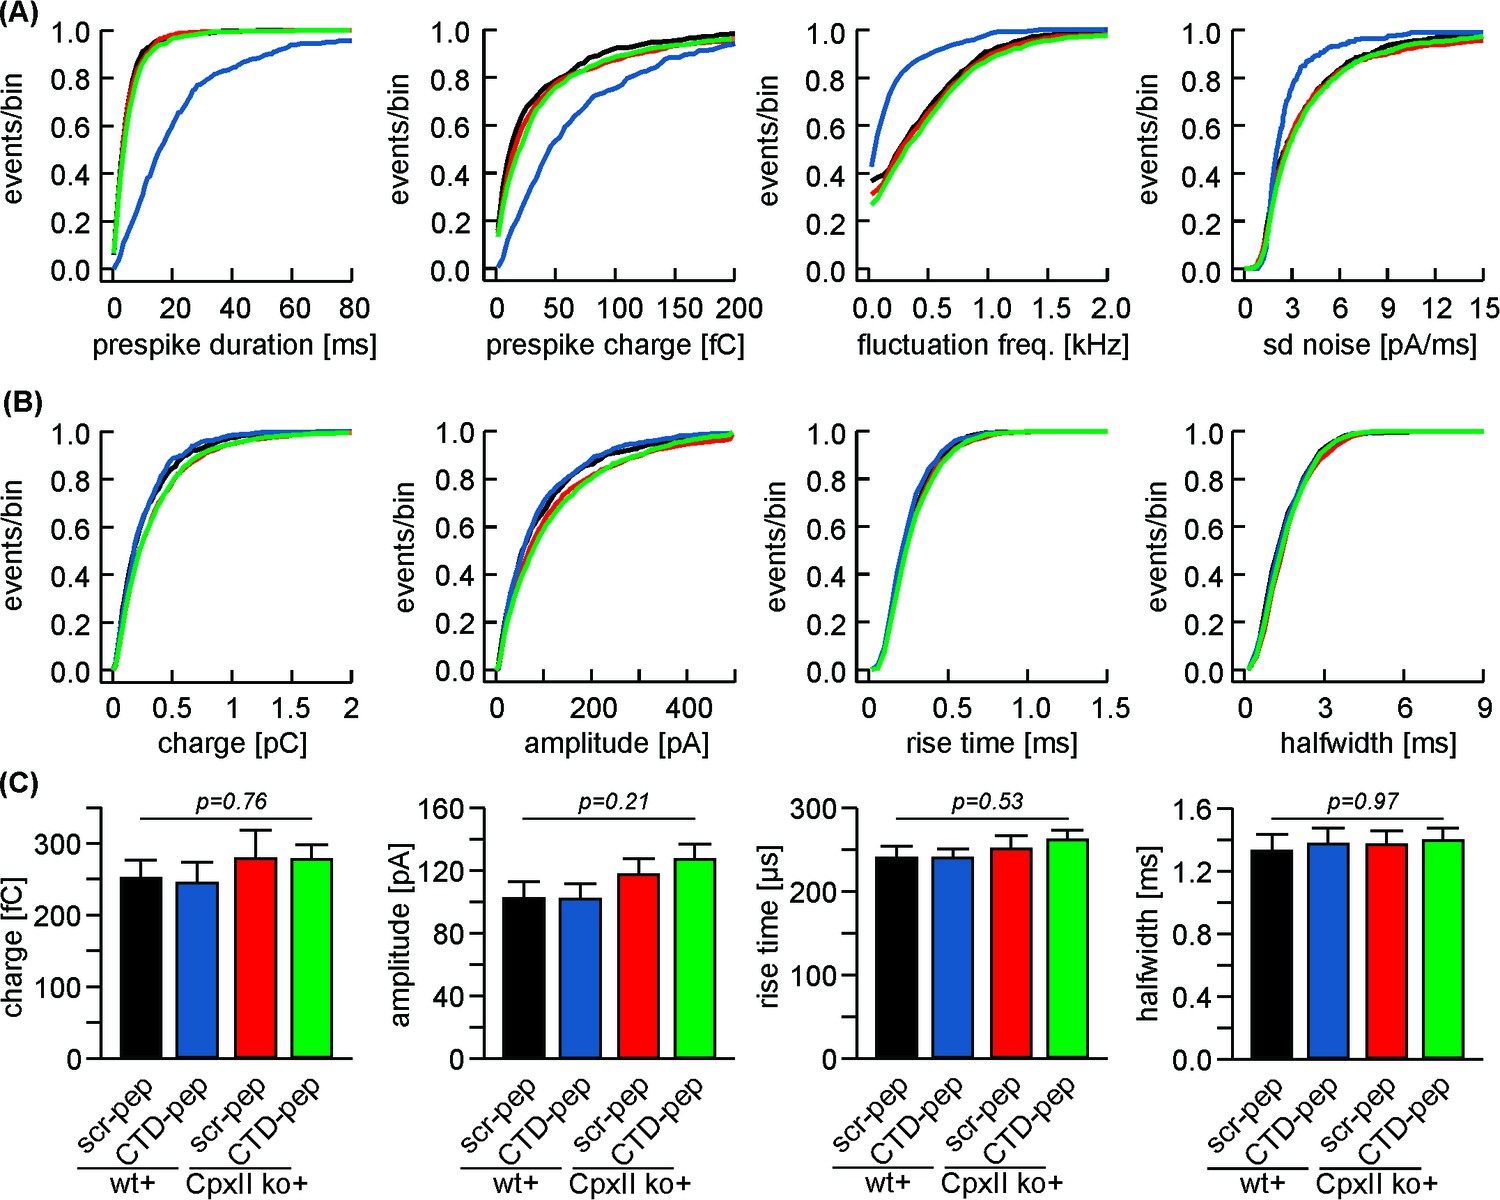
Infusion of CpxII C-terminal peptide slows the expansion of the initial fusion pore but leaves bulk release phase unchanged.
(A) Cumulative frequency distribution plots of prespike parameters indicate a strongly hindered fusion pore dynamics with the CTD peptide in wt cells (blue) but not in CpxII ko cells (green). Wt + scrambled pep (black) and CpxIIko + scrambled pep (red) served as controls. Corresponding data of the cell weighted averages shown in Figure 2H. (B, C) Properties of amperometric events during spike phase displayed as cumulative frequency distribution and as cell weighted averages for wt + scr pep (black, n = 14), wt + CTD pep (blue, n = 19) CpxII ko +scr pep (red, n = 15) and CpxII ko + CTD pep (green, n = 18). Error bars indicate mean ± SEM. ANOVA followed by Tukey-Kramer post-hoc test.
Figure 3 with 2 supplements
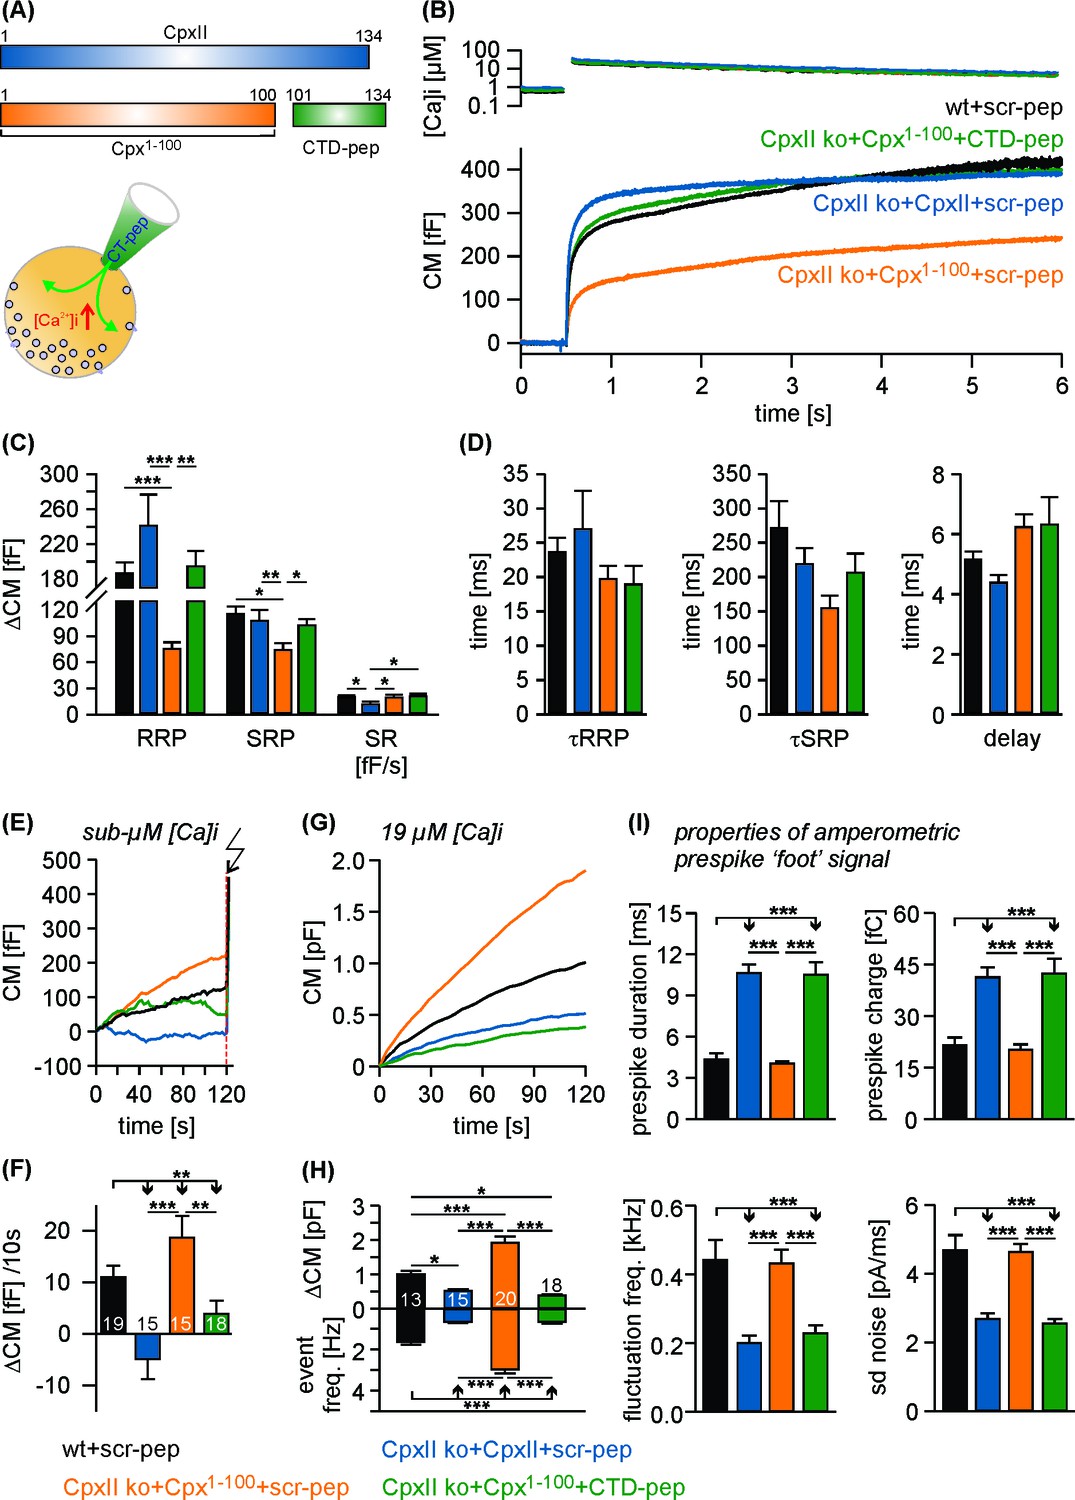
The CTD peptide and the Cpx1-100 act in tandem to clamp tonic exocytosis and fusion pore expansion.
(A) The CTD-pep (green) or scr-pep is infused into CpxII ko cells expressing either full-length CpxII (blue) or the truncated Cpx1-100 (orange). (B) Average [Ca2+]i levels (top) and corresponding capacitance responses (bottom) for infusion of either scr-pep or CTD-pep in the indicated groups. Data were collected from the following number of cells: wt + scr pep (black, n = 19), CpxII ko + CpxII + scr-pep (blue, n = 15), CpxII ko+Cpx1-100+scr pep (orange, n = 15) and CpxII ko+Cpx1-100+CT pep (green, n = 18). Flash is at t = 0.5 s. (C) The CTD peptide (green), but not its scrambled variant (orange) recues the RRP and SRP in Cpx1-100 expressing cells, matching nearly the phenotype of full length CpxII expression (blue). The rate of sustained release (SR, fF/s) is slightly reduced with CpxII expression. (D) Neither the time constants of the EB components (τRRP, τSRP) nor the exocytotic delay are altered for the tested groups. (E, F) Contrary to the scrambled peptide the CTD suppresses premature secretion at submicromolar [Ca]i before the flash response (arrow) in Cpx1-100 expressing cells almost like the CpxII protein (same cells as shown in B). (G) Like CpxII expression in CpxII ko cells, the CTD hinders tonic secretion (in response to 19 µM [Ca]i) in Cpx1-100 expressing cells, whereas the scr-pep failed to do so. (H) Total CM after 120 s (upper panel) and amperometric event frequency (lower panel) for the groups in G. Numbers of cells are depicted in the bars. (I) The CTD-pep together with Cpx1-100 increases the fusion pore expansion time (upper panels) and reduces its dynamics (lower panels) like CpxII. Values are determined from the individual parameter’s frequency distribution for each cell. Data are averaged from the cells/events measured for wt + scr pep (13/1558), CpxII ko + CpxII + scr-pep (15/731), CpxII ko+Cpx1-100 + scr pep (20/3292) and CpxII ko+Cpx1-100+CTD pep (18/857) (>20 events/cell). Error bars indicate mean ± SEM. ANOVA followed by Tukey-Kramer post-hoc test. *p<0.05, **p<0.01, ***p<0.001.
Figure 3—figure supplement 1

Neither CpxII expression nor a combination of Cpx1-100 expression and acute peptide infusion affects the main phase of transmitter discharge from single vesicles.
(A, B) Properties of amperometric events during spike phase displayed as cumulative frequency distribution and cell weighted averages for wt + scr pep (black), CpxII ko + CpxII + scr-pep (blue), CpxII ko+Cpx1-100+scr pep (orange) and CpxII ko+Cpx1-100 + CTD pep (green). Error bars indicate mean ± SEM. ANOVA followed by Tukey-Kramer post-hoc test.
Figure 3—figure supplement 2

CSPα−anchored Cpx1-100 fails to support secretion like CpxII.
(A) Schematic representation of the Cpx1-100CSPα mutant. (B) Average [Ca2+]i levels (top) and corresponding CM signals (bottom) of Cpx ko cells (n = 22) and those expressing CpxII (n = 25) or the mutant Cpx1-100CSPα (n = 23). Flash, t = 0.5 s. (C, D) Expression of CpxII1-100CSPa (olive) rescues neither the EB (RRP and SRP) nor its kinetics (τRRP, delay) when compared with CpxII ko cells (red) or those expressing CpxII (blue). (E, F) Cpx1-100CSPα does not hinder premature secretion like CpxII (arrow indicates UV-flash). (G) Cpx1-100CSPα has a dominant negative effect on synchronous secretion of wt cells. Average flash-induced [Ca2+]i levels (top) and corresponding CM signals (bottom) of wt cells (n = 16) and those over-expressing CpxII (n = 17) or the mutant Cpx1-100CSPα (n = 15). Flash, t = 0.5 s. (H, I) Cpx1-100CSPα (olive) suppresses the RRP component of the exocytotic burst and leaves the kinetics of stimulus-secretion coupling (τRRP, τSRP, delay) unchanged when compared with CpxII expression in wt cells (blue). (J) Mean tonic CM responses of the cells shown in B during infusion of similar submicromolar [Ca2+]i. (K) Rate of tonic exocytosis determined before the flash-evoked synchronous release. ANOVA followed by Tukey-Kramer post-hoc test. *p<0.05; **p<0.01; ***p<0.001. Error Bars indicate means ± SEM.
Figure 4
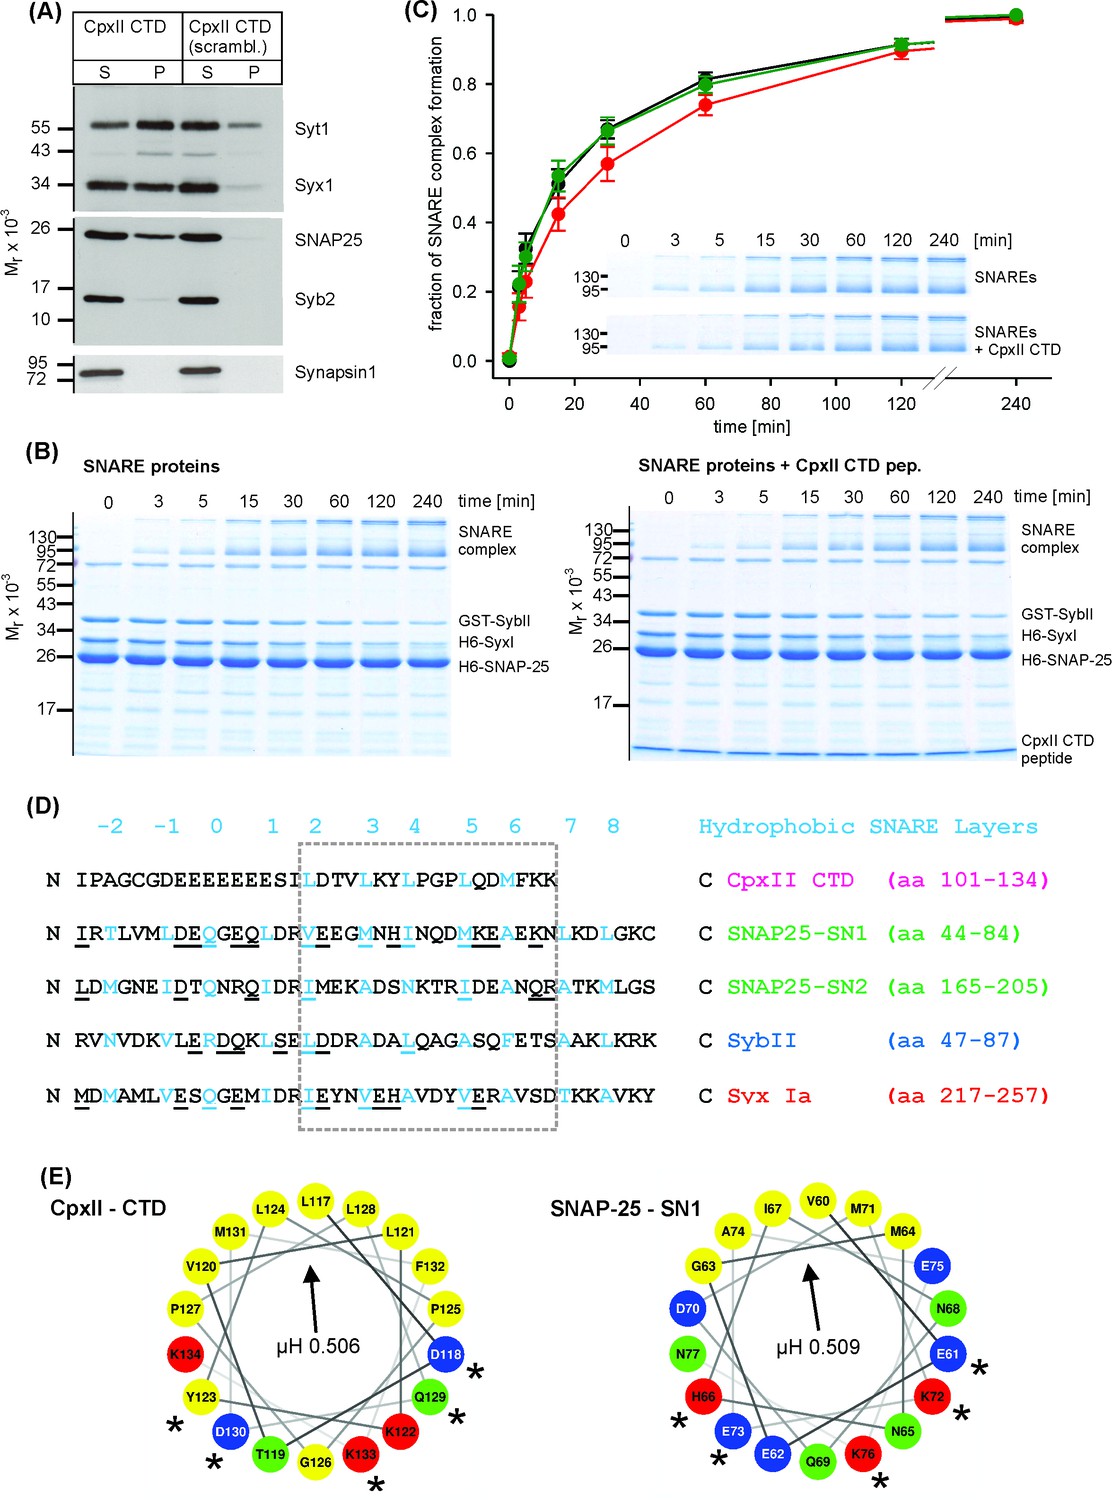
The CpxII CTD slows down the rate of SNARE complex formation.
(A) The CpxII CTD peptide co-precipitates SytI and preferentially the t-SNAREs, Syx1a and SNAP25, from detergent extract of mouse brain. Equal volumes of supernatant (S) and pellets (P) were analyzed by SDS-PAGE (12% gel) and Western blotting with antibodies against the indicated antigens. No binding of other proteins like synapsin could be detected. The scrambled variant binds unspecifically some SytI and Syx1. (B) Time-dependent SNARE complex formation between GST-syb2 (3 µM) and preincubated t-SNAREs (syntaxin 1, amino acids 1–262, 3 µM and SNAP25, amino acids 1–206, 15 µM) in the absence (left) and the presence (right) of the CpxII-CTD (50 µM). Complex formation was determined at 25°C for the indicated times and analyzed by SDS-PAGE. Exemplary Coomassie-stained SDS gels are shown. (C) The CpxII CTD peptide (red) slows down the time course of SNARE complex formation when compared with no peptide (SNAREs alone, black) or the scrambled peptide (green). Inset highlights delayed complex assembly in the presence of the CpxII CTD peptide (same gels as shown in B). Data were normalized to the complex formation after 240 min and averaged from the following number of trials (SNAREs, n = 8; SNAREs + CpxII CTD, n = 8; SNAREs + scr pep, n = 7). (D) Sequence alignment between CpxII CTD and the SNARE motifs of SNAP25, SybII and Syx1 (hydrophobic layer region −2 to +8, blue). The CpxII-CTD shows a high degree of similarity (underlined residues) to SNAP25-SN1 (50%, calculated for the boxed region, hydrophobic layers + 2 to+7, using the BLOSUM62 matrix). (E) Helical wheel projections of CpxII CTD (residues 117–134, boxed region in D) and SNAP25-SN1 (residues 60–77) show the amphipathic nature of the protein regions with similar hydrophobic moments (µH). Similar amino acids in the hydrophilic faces of the helices are marked with asterisks (*).
Figure 5 with 1 supplement
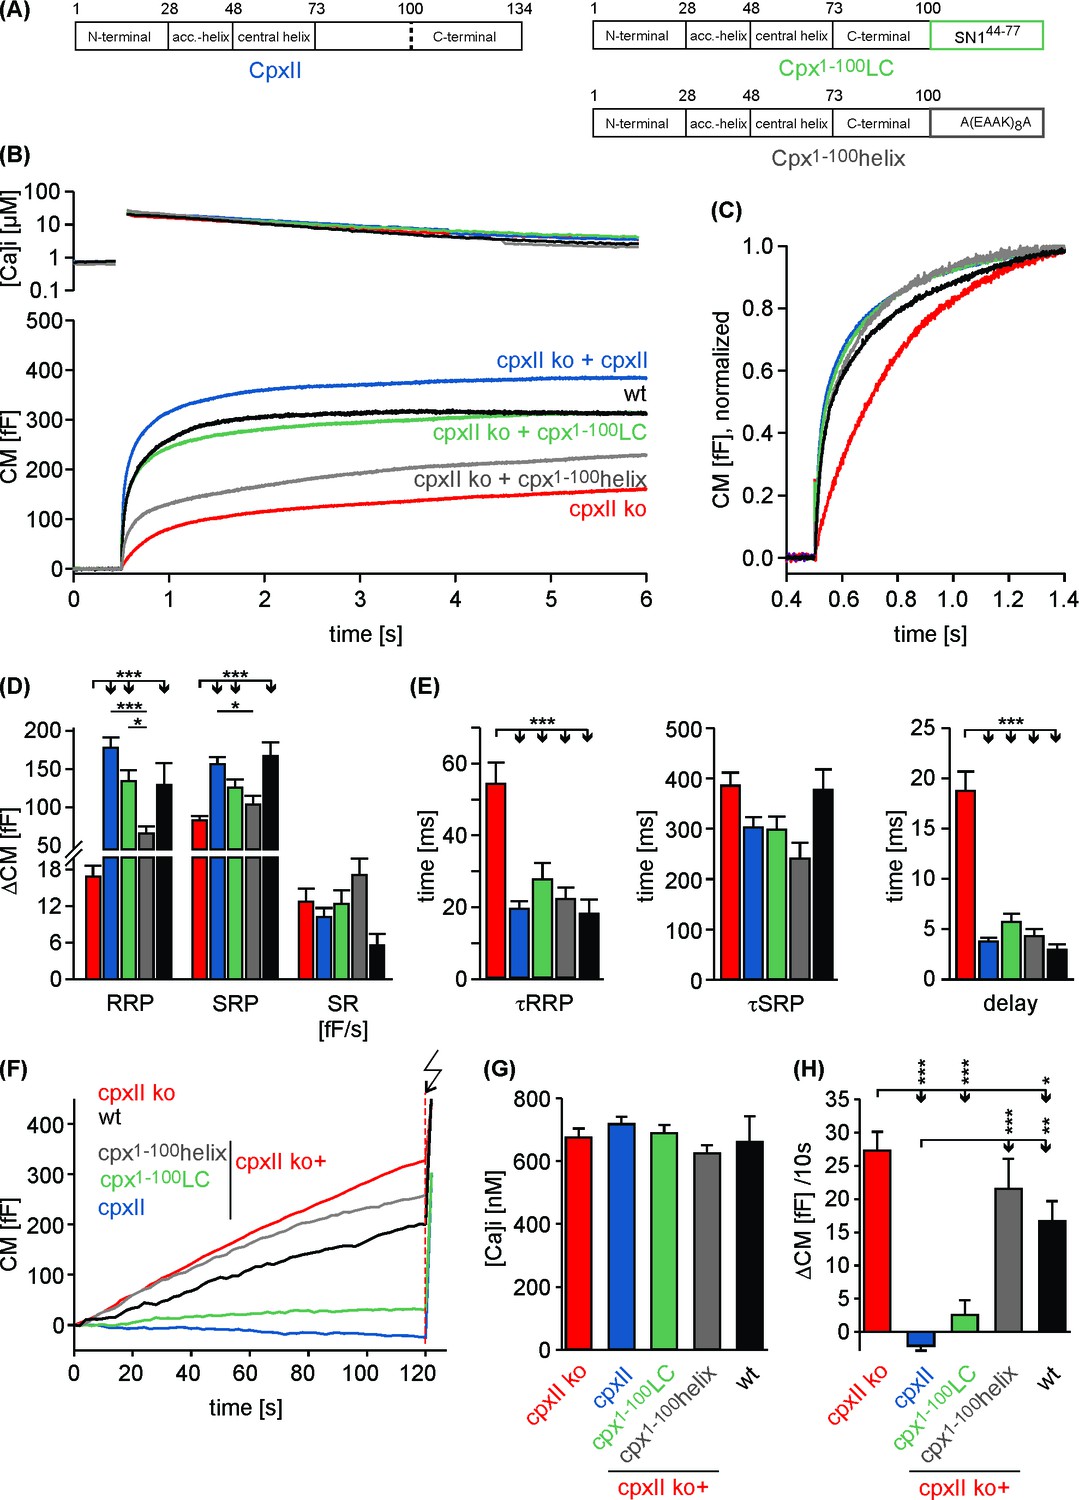
Replacing the CpxII C-terminus with SNAP25-SN1 (residues 44 to 77) largely restores synchronous exocytosis.
(A) Cartoon illustrates CpxII domains and the structure of the tested mutants. (B) Expression of the Cpx1-100LC largely restores synchronous secretion reaching the response level of wt cells. The Cpx1-100helix supports exocytosis like Cpx1-100 (compare with Figure 1B). Mean [Ca2+]i levels (top) and corresponding CM signals (bottom) of wt cells (n = 11), CpxII ko cells (n = 58), and ko cells expressing CpxII (n = 68) or its mutants (Cpx1-100LC, n = 41; Cpx1-100helix, n = 20). Flash, t = 0.5 s. (C) Normalized CM (as shown in B) scaled to the wt response (1 s after flash). (D) Cpx1-100LC (green) restores RRP and SRP almost like CpxII (blue). (E) The time constants of the EB components (τRRP and τSRP), and the exocytotic delay are similarly changed for CpxII and its chimera (color coding as in A). (F–H) The Cpx1-100LC clamps tonic secretion (F) of CpxII ko cells at similar [Ca]i (G) almost like CpxII (F, H). ANOVA followed by Tukey-Kramer post-hoc test. *p<0.05; **p<0.01; ***p<0.001. Error bars indicate mean ± SEM.
Figure 5—figure supplement 1
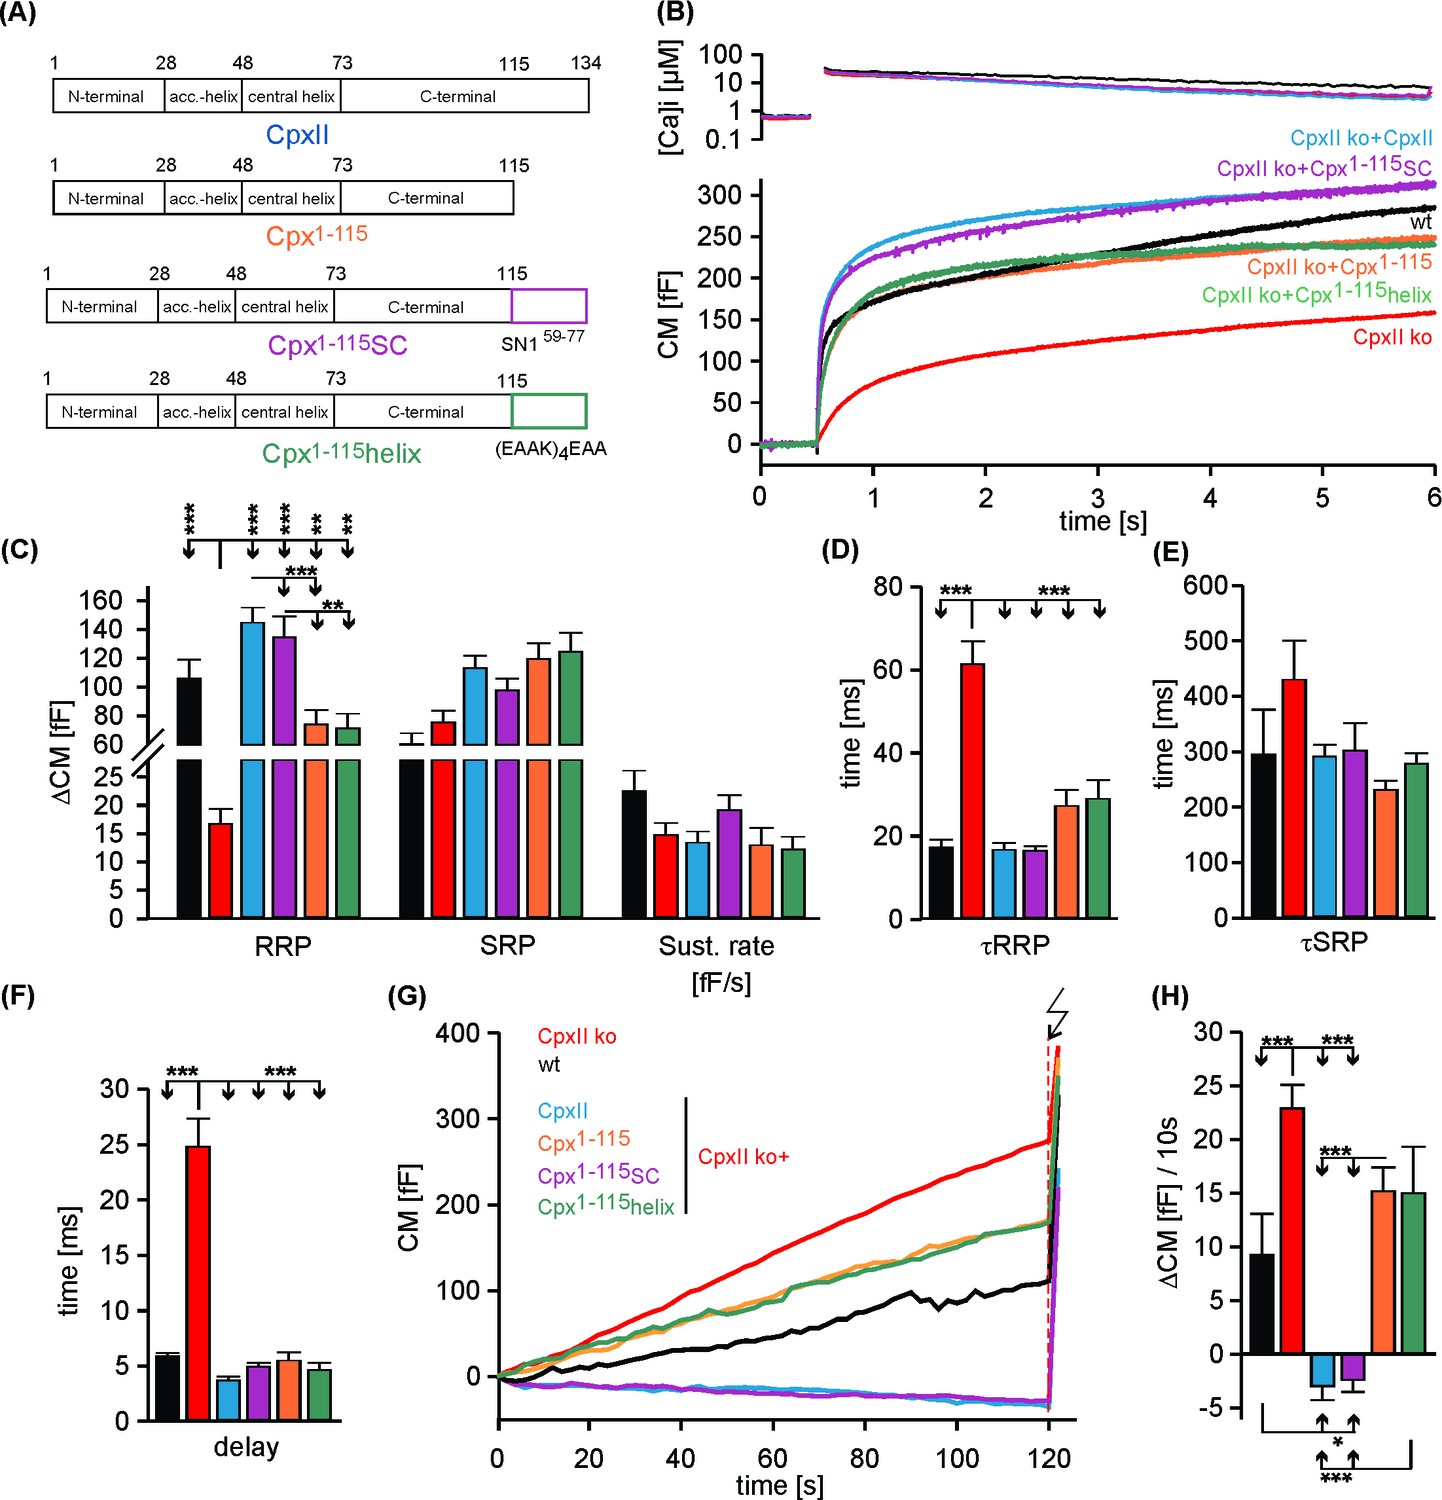
The Cpx1-115SC arrests tonic release and fully rescues synchronous secretion like CpxII.
(A) Cartoon of the tested truncated and chimera mutants of CpxII. (B) Cpx1-115SC but not Cpx1-115helix restores synchronous release like CpxII. Mean [Ca2+]i levels (top) and corresponding capacitance responses (bottom) of wt (black, n = 11), CpxII ko (red, n = 43), CpxII ko expressing CpxII (blue, n = 46), Cpx1-115 (autumn orange, n = 28), Cpx1-115SC (purple, n = 33), Cpx1-115helix (dark green, n = 19). Flash at t = 0.5 s. (C) Amplitudes of RRP and SRP, the rate of sustained release (SR, fF/s). (D–F) The time constants of the exocytotic burst components (τRRP, τSRP) and the exocytotic delay. C-terminal truncated or mutated CpxII variants restore exocytosis timing like CpxII (see also Dhara et al., 2014) (G) Cpx1-115SC clamps premature secretion as CpxII. Averaged tonic capacitance responses (same group of cells as in B) over 120 s at submicromolar [Ca2+]i infusion (arrow, UV-flash). (H) Mean rate of ΔCM before the flash. ANOVA followed by Tukey-Kramer post-hoc test. **p<0.01; ***p<0.001. Error bars indicate mean ± SEM.
Figure 6 with 2 supplements
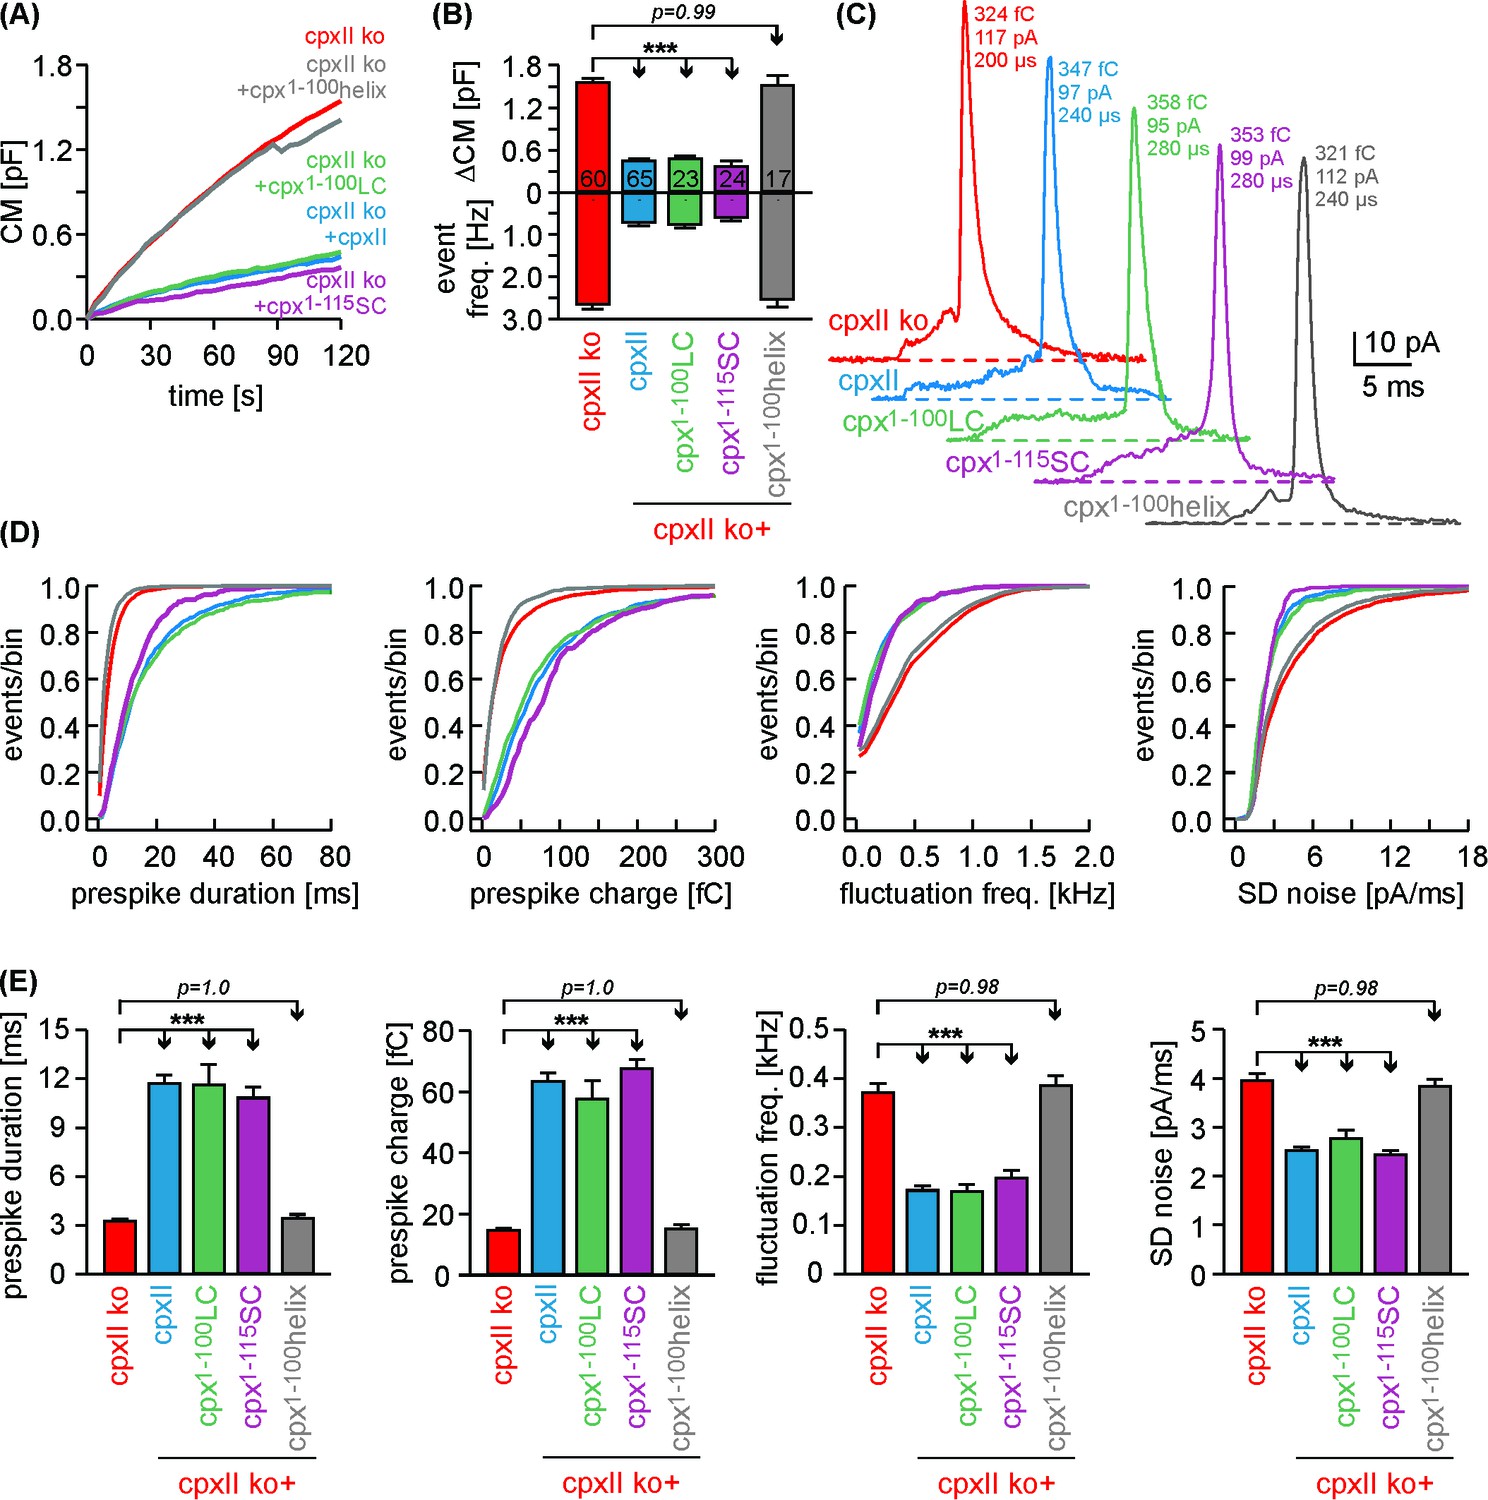
Cpx1-100LC and Cpx1-115SC hinder tonic secretion and regulate fusion pore dynamics like CpxII.
(A) Mean CM responses upon intracellular perfusion with 19 µM [Ca2+]i for the indicated groups. (B) Corresponding ΔCM (determined after 120 s, top panel) and amperometric event frequency (bottom panel, number of cells denoted in the bars). (C) Exemplary single vesicular release events illustrate the slower fusion pore expansion time for CpxII and the CpxII:SNAP-25 chimeras. (D, E) Cumulative frequency distributions (D, color coding as in A) and cell-weighted averages (E) of the indicated prespike parameters show that Cpx1-100LC and Cpx1-115SC prolongs the fusion pore expansion time and reduces fusion pore jitter as seen with CpxII. Values are determined from the individual parameter’s frequency distribution for each cell. Data are collected from events/cells measured for CpxII ko (10735/60), ko + CpxII (3842/65), ko+Cpx1-100LC (1143/23), ko+Cpx1-115SC (1192/24) and ko+Cpx1-100helix (2873/17) (>20 events/cell). Error bars indicate mean ± SEM. ANOVA followed by Tukey-Kramer post-hoc test. ***p<0.001.
Figure 6—figure supplement 1
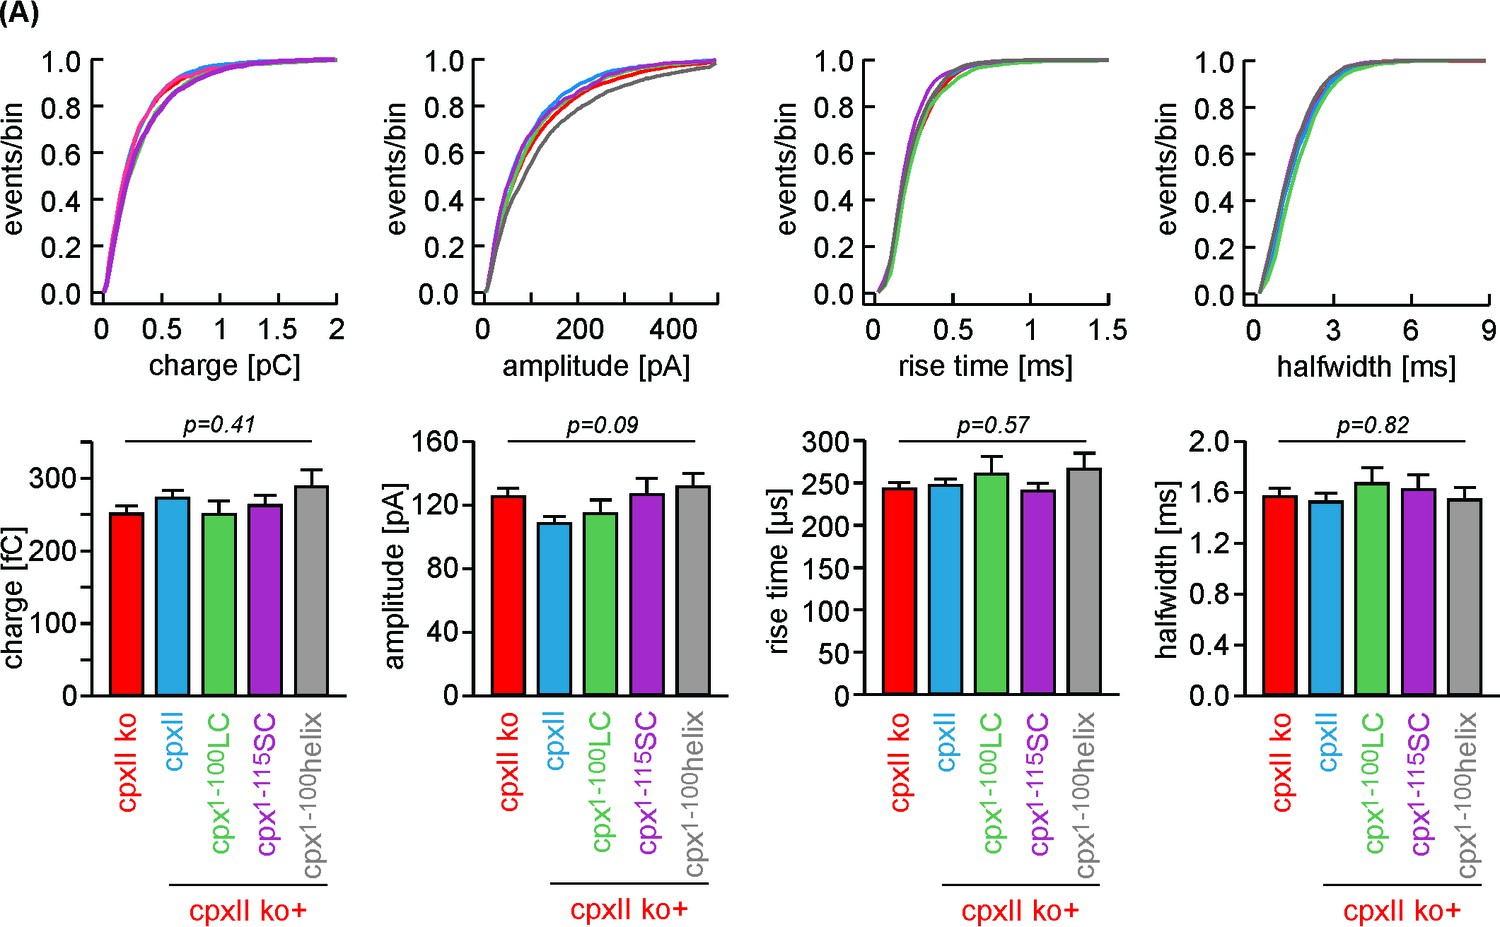
Chimera mutants of CpxII do not affect the main phase of transmitter discharge from single vesicles.
(A) Properties of amperometric events during spike phase displayed as cumulative frequency distribution (top row) and cell weighted averages (bottom row) for the indicated groups. None of the spike phase parameters is altered with CpxII variants compared to controls. Error bars indicate mean ± SEM. ANOVA followed by Tukey-Kramer post-hoc test.
Figure 6—figure supplement 2

Expression analysis of full-length CpxII and its mutant proteins.
(A) Exemplary images of a wt, CpxII ko and CpxII ko cells overexpressing either CpxII or the mutated CpxII proteins. Immunosignals are detected with a polyclonal CpxII antibody (epitope Cpx1-100). Signals are visualized after adjustment of the camera’s exposure time (wt, 200 ms; CpxII ko +CpxII and mutants 30 ms). (B) Mean total fluorescence intensity of wt and CpxII ko cells expressing CpxII or the indicated mutants (determined 5 hr after transfection). Note that mutant variants do not differ from CpxII regarding the level of protein expression (wt, n = 56; CpxII ko, n = 34; CpxII, n = 49; Cpx1-100, n = 24; Cpx1-100LC, n = 21; Cpx1-115, n = 24; Cpx1-115SC, n = 28; Cpx1-100helix, n = 23; Cpx1-115helix, n = 27; Cpx1-100CSPα, n = 19). Error bars indicate mean ± SEM. ANOVA followed by Tukey-Kramer post-hoc test. ***p<0.001.
Figure 7 with 1 supplement
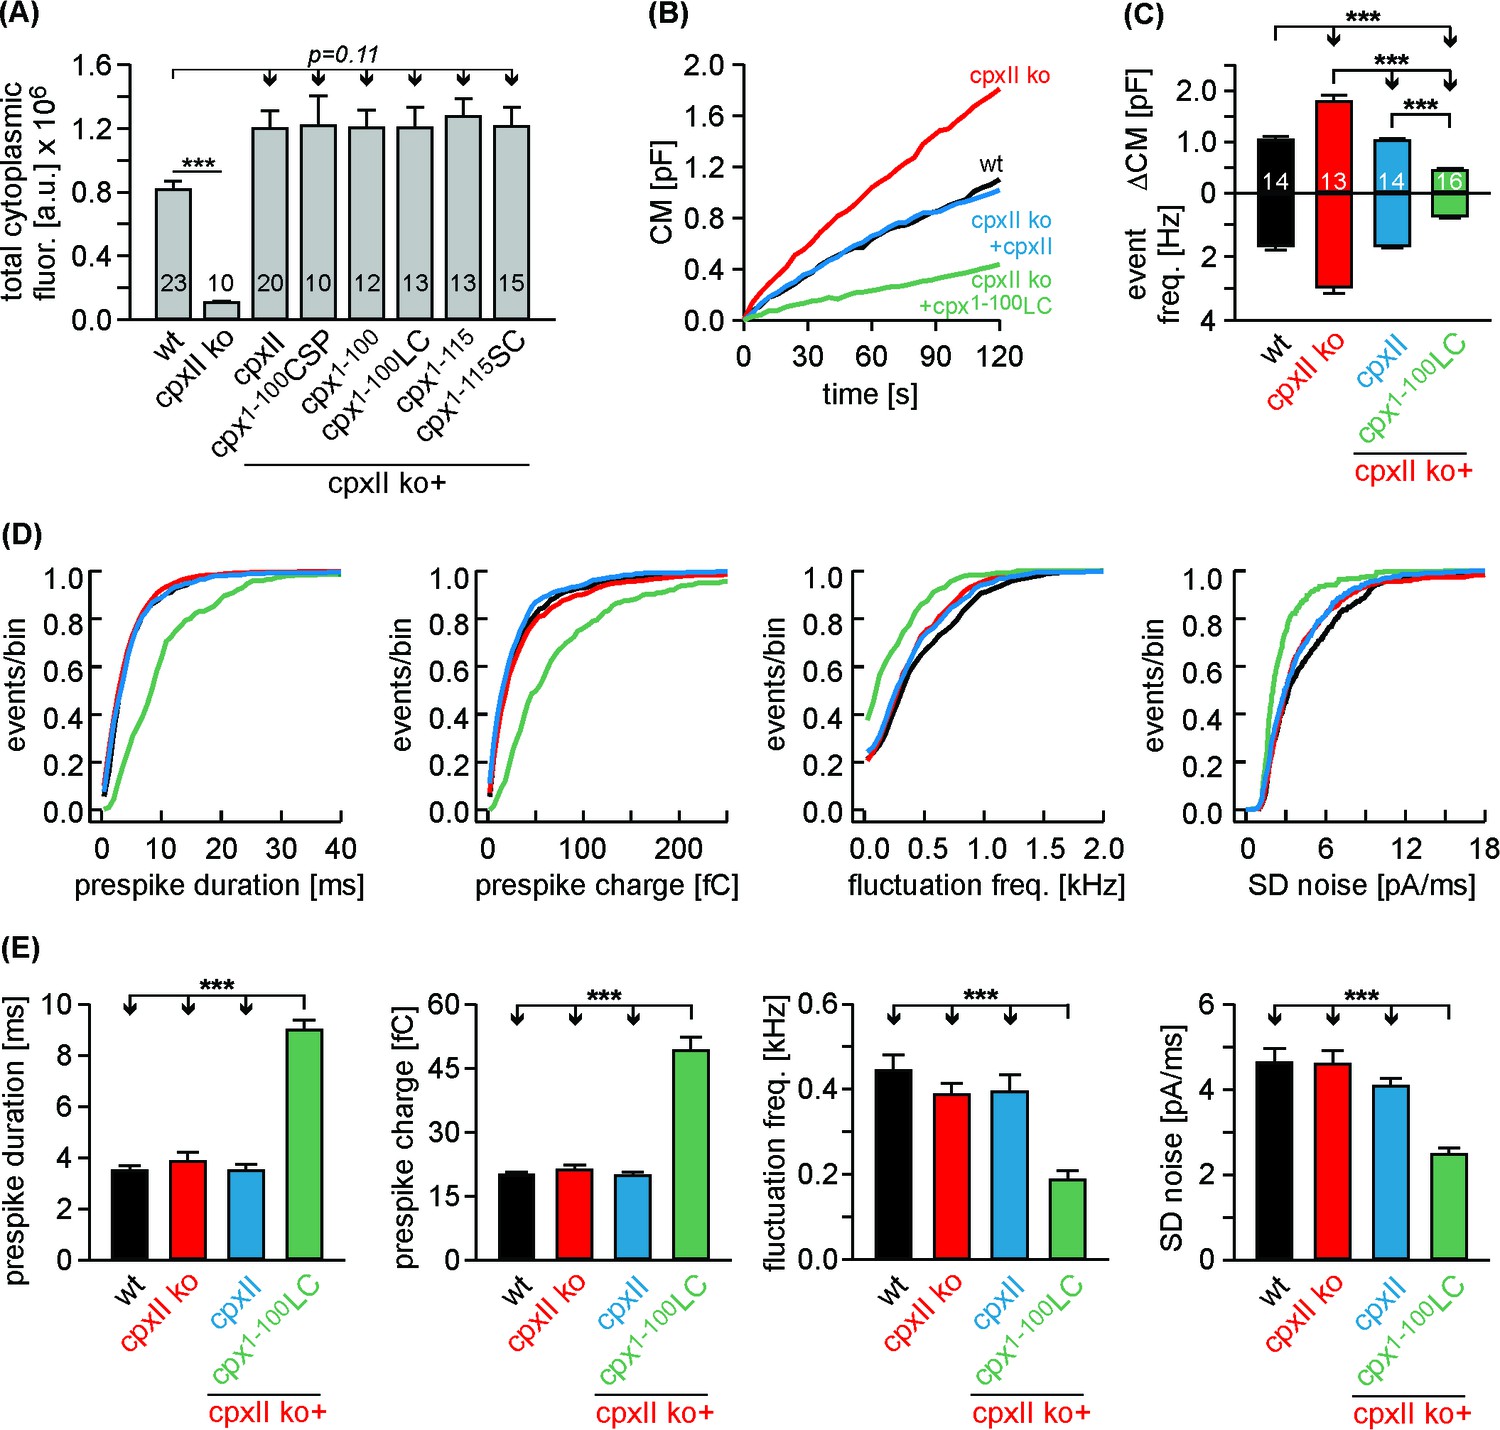
The Cpx1-100LC ‘superclamps’ tonic secretion and fusion pore dynamics after adapting the expression to endogenous CpxII levels.
(A) Mean total fluorescence intensity for wt and CpxII ko cells expressing either CpxII or the indicated mutants (measured 3 hr after transfection, number of cells is indicated in the bars). CpxII and its mutant variants show similar protein expression levels compared to endogenous CpxII. (B) Mean CM responses upon intracellular perfusion with 19 µM free Ca2+ for the indicated groups. Note that Cpx1-100LC hinders tonic secretion more efficiently than CpxII (compare with Figure 6A). (C) Total ΔCM after 120 s (top panel) and amperometric event frequency (bottom panel) averaged from the indicated number of cells. (D, E) Properties of the prespike foot signal, displayed as cumulative frequency distribution (D) and as cell weighted averages (E) for the indicated parameters. The Cpx1-100LC selectively slows the expansion rate of initial fusion pore and reduces the prespike kinetics compared to controls. Values are determined from the individual parameter’s frequency distribution for each cell. Data are collected from events/cells measured for wt (1072/14), CpxII ko (1726/13), ko + CpxII (1125/14), ko+Cpx1-100LC (600/16) (>20 events/cell). Error bars indicate mean ± SEM. ANOVA followed by Tukey-Kramer post-hoc test. ***p<0.001.
Figure 7—figure supplement 1
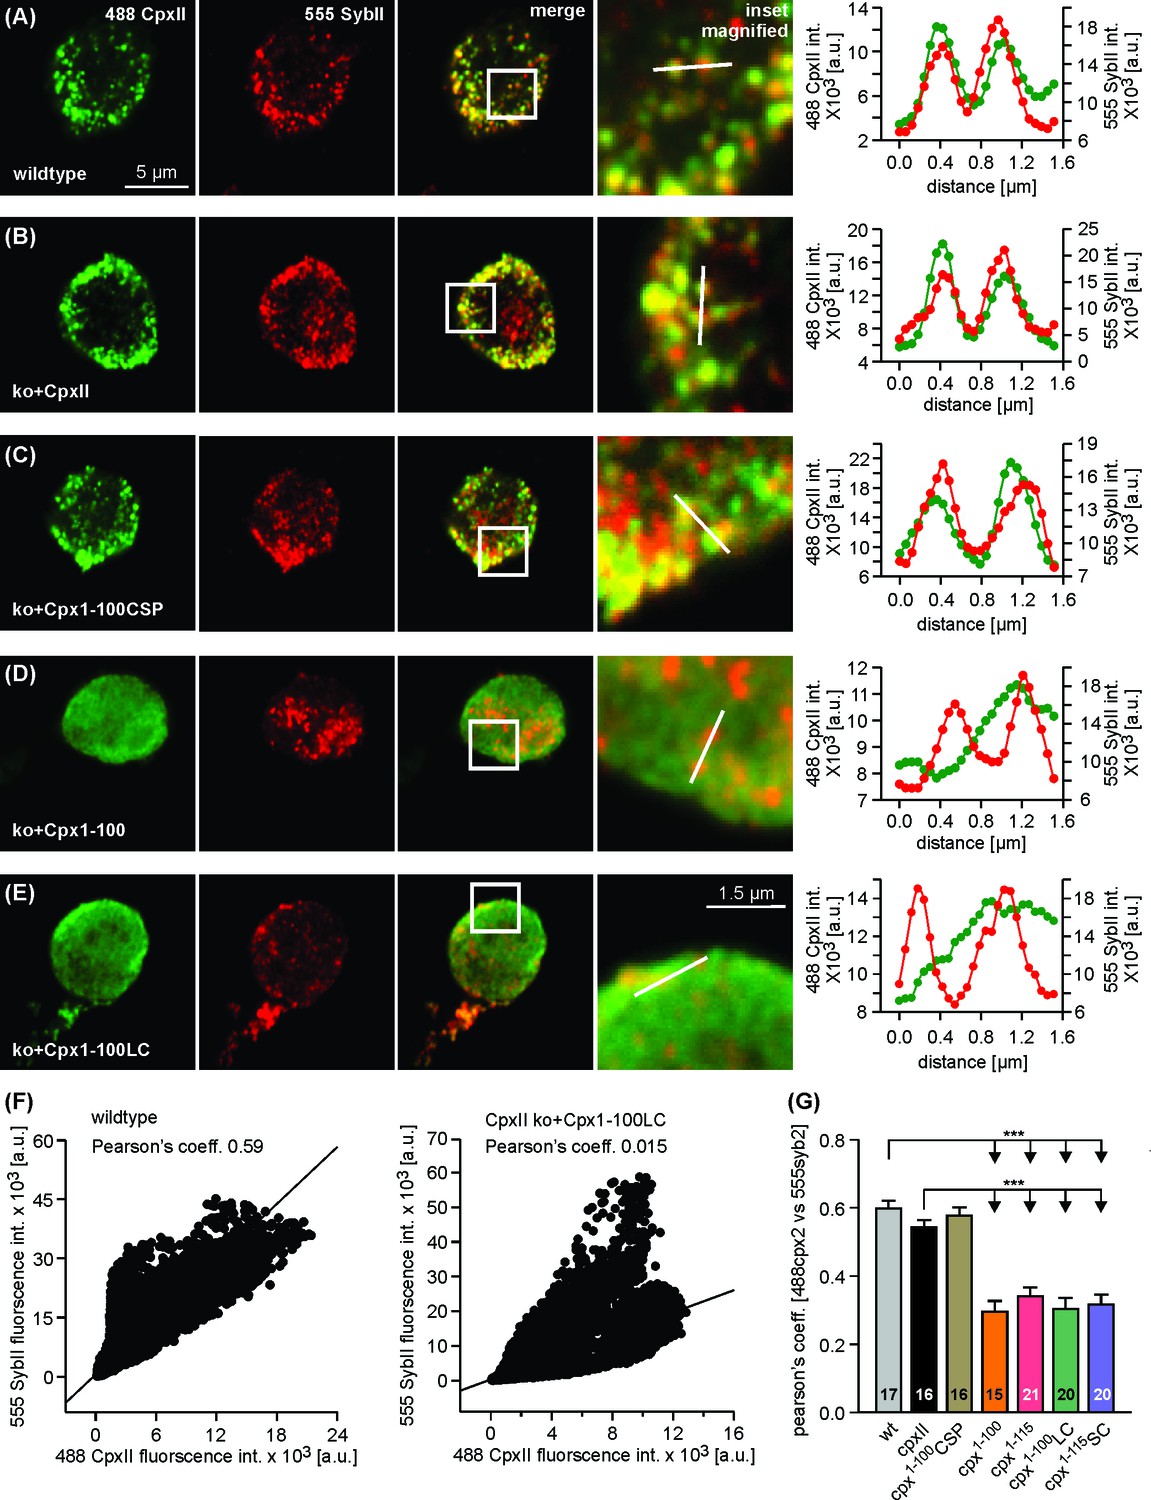
The CTD concentrates CpxII on chromaffin granules.
(A–E) Exemplary immunostainings (imaged with LSM-710) for CpxII (green) and SybII (red) in wt chromaffin cells and CpxII ko cells expressing CpxII or mutant variants (top to bottom: Cpx1-100CSPα,Cpx1-100, Cpx1-100LC). Cells were fixed after 3.5 hr of viral infection and imaged within the footprint area to minimize the contribution of ER/Golgi-derived fluorescence in virus-transfected cells. The merged images and their magnified view display colocalization between CpxII and sybII in wt, CpxII ko + CpxII and CpxII ko+Cpx1-100CSPαgroups, as also illustrated in the corresponding line scans (magnified view, dashed lines). Notably, Cpx1-100 (D) and Cpx1-100LC (E) do not concentrate at vesicular structures. (F) Exemplary cytofluorgrams for wt and Cpx1-100LC (same cells as in A and E) show a lower Pearson’s colocalization coefficient (PCC) for the mutant. (G) Pearson’s colocalization coefficient (threshold 6xSD of the background fluorescence) for CpxII or its mutants versus sybII shows that virally expressed CpxII and Cpx1-100CSPαconcentrate on vesicles like the endogenous protein (PCC ~ 0.6). Cpx1-100, Cpx1-100LC, Cpx1-115 and Cpx1-115SC show significantly lower PCC (~0.3). Error bars indicate mean ± SEM. ANOVA followed by Tukey-Kramer post-hoc test. ***p<0.001.
Figure 8
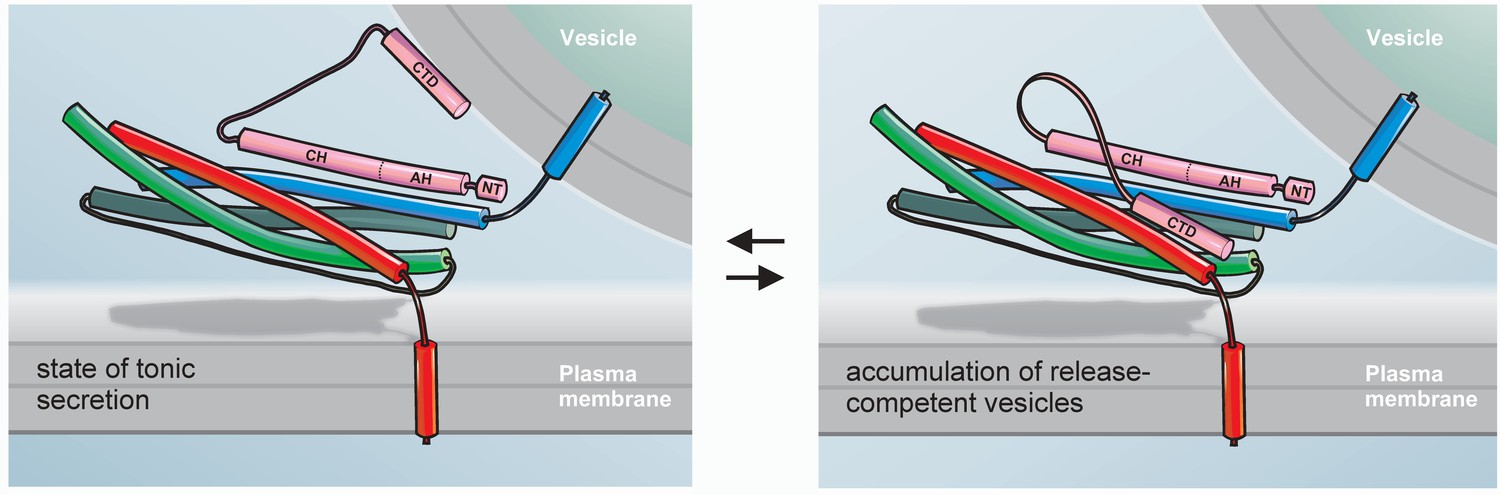
Hypothetical model for the exocytotic arrest by the CTD of CpxII.
SybII (blue), Syx (red), and SNAP-25 (green) partially assemble into trans-SNARE complex forming a high affinity binding site for the central domain (CH) of Cpx (pink). In the membrane associated or free state of the CTD (left panel) CpxII does not inhibit tonic secretion, whereas in the SNARE-interacting state (right panel) the CpxII CTD folds back on the partially assembled SNARE complex, hinders its further zippering and thereby allows for the accumulation of release ready vesicles (adapted from Mohrmann et al., 2015). Halting the SNARE machinery before the triggering Ca2+-stimulus most likely requires the combined action of multiple peptide domains from Cpx (e.g. accessory α-helix, AH, [Giraudo et al., 2009]) as well as other proteins like SytI (Littleton et al., 1994; Martin et al., 1995). The N-terminus of Cpx (NT) enhances fusion kinetics and fusogenicity (Dhara et al., 2014; Xue et al., 2010).
Tables
Key resources table
| Reagent type (species) or resource | Designation | Source or reference | Identifiers | Additional information |
|---|---|---|---|---|
| Strain, strain background (Mus musculus) | C57BL/6 | |||
| Genetic reagent (Mus musculus) | CPX II null allele | Reim et al., 2001. Complexins regulate a late step in Ca2+-dependent neurotransmitter release. Cell, 104, 71–81 | PMID 11163241 | |
| Antibody | mouse anti-Syntaxin1 | Synaptic Systems | Cat# 110 001 | Western blot: 1:1000 |
| Antibody | mouse anti- SNAP25 | Synaptic Systems | Cat# 111 011 | Western blot: 1:1000 |
| Antibody | mouse anti- SynaptobrevinII | Synaptic Systems | Cat# 104 211 | ICC, Western blot: 1:1000 |
| Antibody | mouse anti- Synaptotagmin I | Synaptic Systems | Cat# 105 011 | Western blot: 1:1000 |
| Antibody | mouse anti-Synapsin 1 | Synaptic Systems | Cat# 106 001 | Western blot: 1:1000 |
| Antibody | rabbit anti-CpxII | this paper | Material and methods | ICC, Western blot 1:5000 |
| Antibody | HRP conjugated goat-anti mouse | Bio-Rad laboratories | Cat# 170–5047 | Western blot: 1:1000 |
| Antibody | HRP conjugated goat-anti rabbit | Bio-Rad laboratories | Cat# 170–5046 | Western blot: 1:1000 |
| Antibody | Alexa Fluor 555 goat anti-mouse | Invitrogen | Cat# A21422 | ICC: 1:1000 |
| Antibody | Alexa Fluor 488 goat anti-rabbit | Invitrogen | Cat# A11008 | ICC: 1:1000 |
| cDNA (Mus musculus) | CpxII-WT | GenBank: U35101.1 | ||
| Transfected construct (Mus musculus) | pSFV-Cpx1-100- IRES-EGFP | this paper | derived from U35101.1 with indicated mutations | |
| Transfected construct (Mus musculus) | pSFV-Cpx1-115- IRES-EGFP | this paper | derived from U35101.1 with indicated mutations | |
| Transfected construct (Mus musculus) | pSFV-Cpx1-100LC- IRES-EGFP | this paper | derived from U35101.1 with indicated mutations | |
| Transfected construct (Mus musculus) | pSFV-Cpx1-115SC- IRES-EGFP | this paper | derived from U35101.1 with indicated mutations | |
| Transfected construct (Mus musculus) | pSFV-Cpx1-100helix- IRES-EGFP | this paper | derived from U35101.1 with indicated mutations | |
| Transfected construct (Mus musculus) | pSFV-Cpx1-115helix- IRES-EGFP | this paper | derived from U35101.1 with indicated mutations | |
| Transfected construct (Mus musculus) | pSFV-Cpx1-100CSPα- IRES-EGFP | this paper | derived from U35101.1 with indicated mutations | |
| Recombinant DNA reagent | pGEX-KG-vector | this paper | ||
| Recombinant DNA reagent | pET-28a | this paper | ||
| Peptide, recombinant protein | C-terminal domain peptide | this paper | Material and methods | |
| Peptide, recombinant protein | scrambled peptide | this paper | Material and methods | |
| Software algorithm | IgorPro | WaveMetrics Software | ||
| Software algorithm | AutesP | Npi electronics | ||
| Software algorithm | Zen2008 | Zeiss |
Additional files
-
Transparent reporting form
- https://doi.org/10.7554/eLife.38981.019
Download links
A two-part list of links to download the article, or parts of the article, in various formats.
Downloads (link to download the article as PDF)
Open citations (links to open the citations from this article in various online reference manager services)
Cite this article (links to download the citations from this article in formats compatible with various reference manager tools)
A mechanism for exocytotic arrest by the Complexin C-terminus
eLife 7:e38981.
https://doi.org/10.7554/eLife.38981


