Reconstructing the functions of endosymbiotic Mollicutes in fungus-growing ants
- University of Copenhagen, Denmark
Figures
Figure 1 with 3 supplements
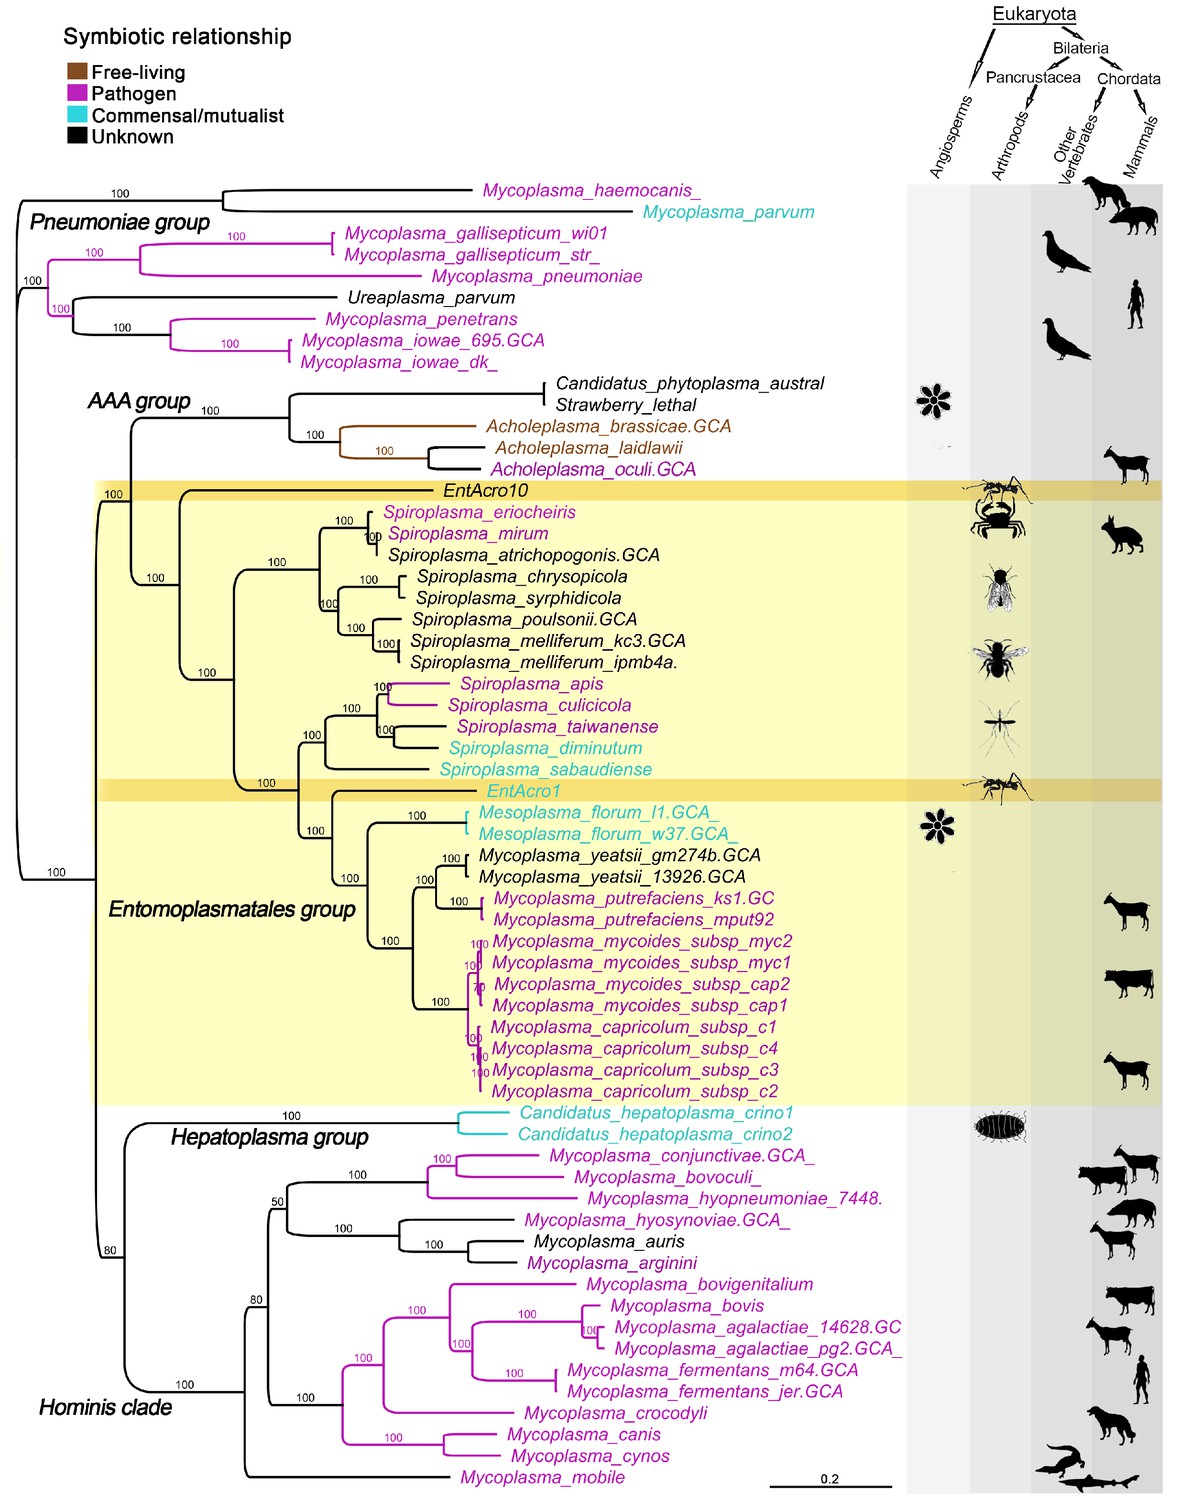
Unrooted phylogeny illustrating the evolutionary relationships and host associations of 59 strains of the bacterial class Mollicutes for which sequenced genomes were available.
The Maximum likelihood tree was constructed using a concatenated amino acid alignment of 65 single-copy orthologs (Supplementary file 2) giving 100% bootstrap support for almost all branches. Color-coded Latin names specify different types of symbiotic associations (top left, Supplementary file 4) and host associations are illustrated by images in the right-hand columns. The light yellow background highlights all representatives of the Entomoplasmatales and the two ant symbionts EntAcro1 and EntAcro10 are marked with a dark yellow background. Black bold-faced text towards the left refers to subclades of Mollicutes identified in a previous phylogenomics study (Leclercq et al., 2014).
Figure 1—figure supplement 1
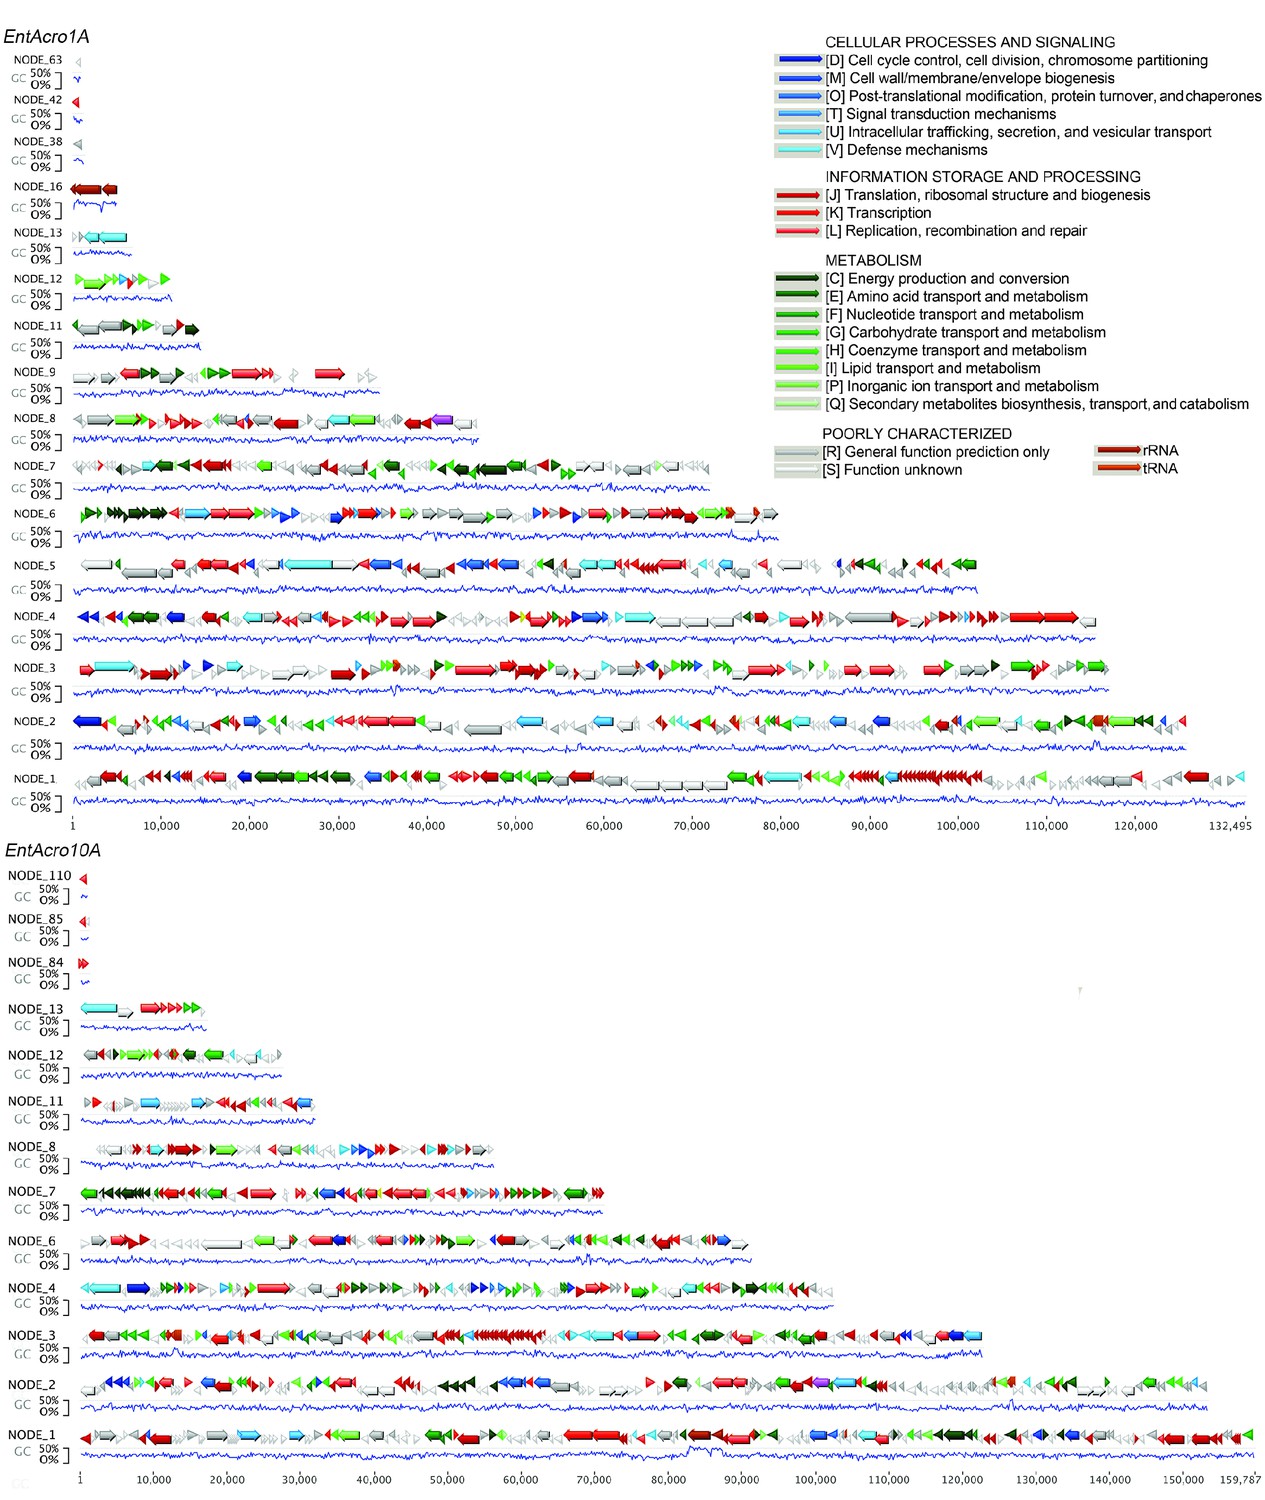
Overview of the assembled draft genome contigs of EntAcro1A (top) and EntAcro10A (bottom).
Functional annotation was performed using the eggNOG database (see Materials and methods). The functional categories and subcategories for the predicted coding sequences (CDS; arrows) are given in colors following the top right legend. Gene orientation is shown by the direction of arrow heads and the GC content of sequences is given just below the predicted CDS. Numbers under the GC content show length in basepairs (bp) and contig identifiers are given at the top left of each contig, using the same headers as the ones deposited in the NCBI database. Analyses revealed 338 and 358 poorly or uncharacterized proteins for EntAcro1A and EntAcro10A, respectively, which is ca. 25% and 21% of their draft genomes similar to percentages in 14 other closely related insect-associated Mollicutes that have 18 – 25% of their genomes encode predicted genes of unknown function (source data file 4). Of the remaining CDSs in EntAcro1A, 153 were associated with metabolism (green), 196 with information storage and processing (red), and 72 with cellular processes (blue). Figures for EntAcro10A were similar for information storage and processing (196) and cellular processes (71) genes, but there were fewer (133) CDSs associated with metabolism.
Figure 1—figure supplement 2
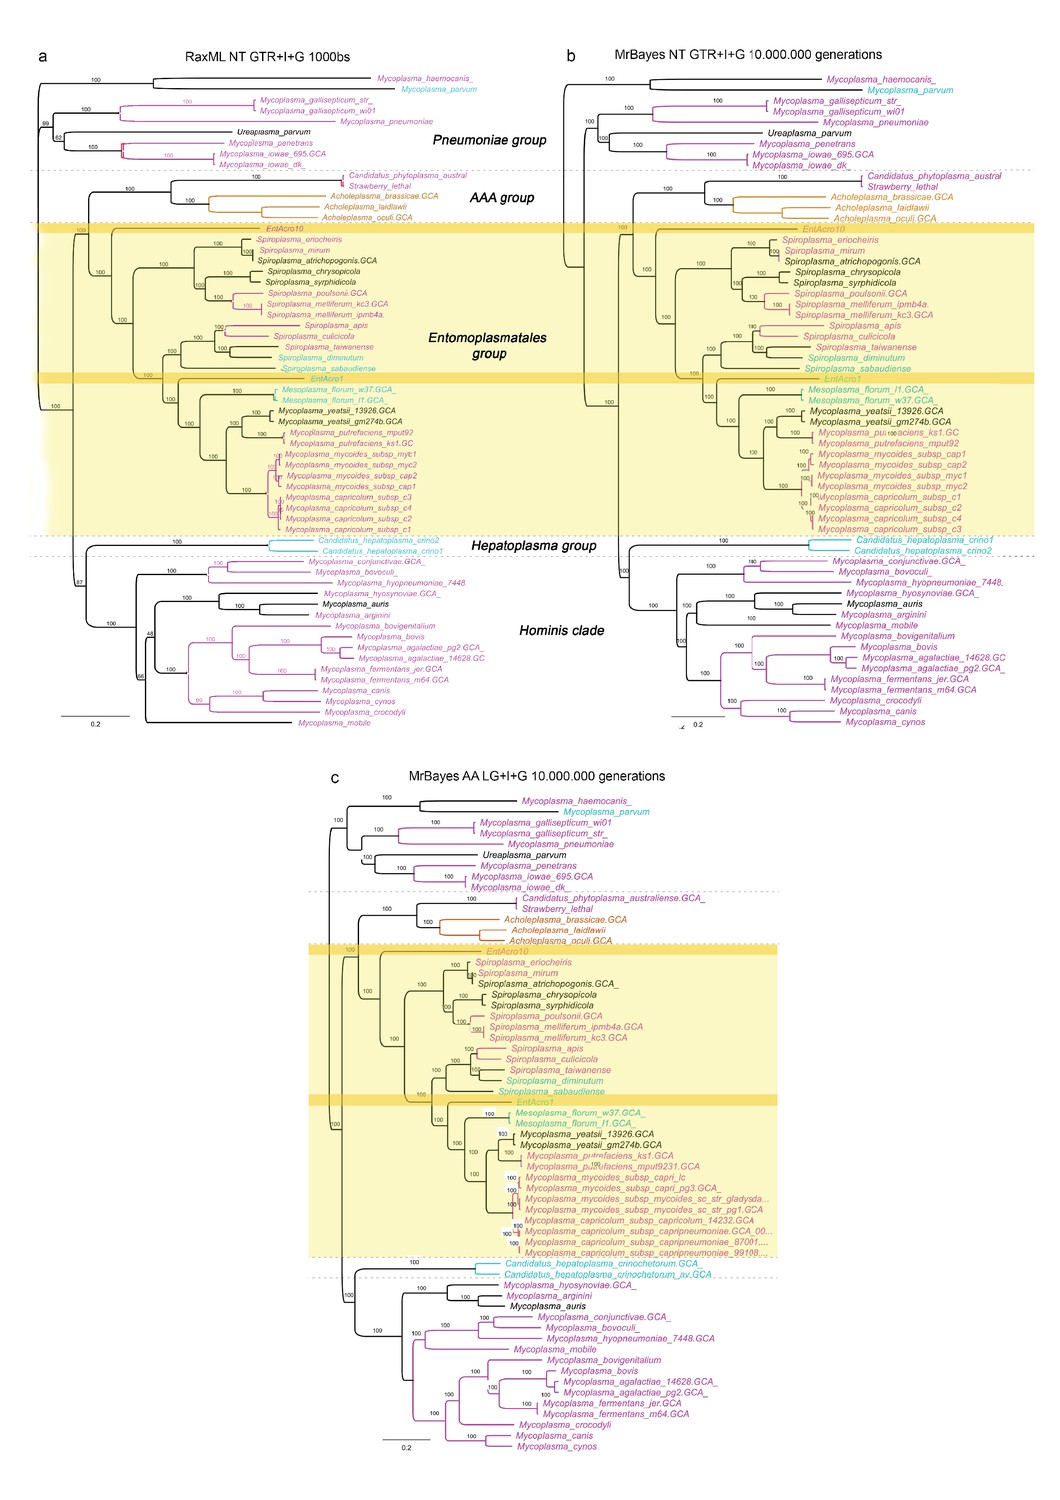
Alternative unrooted phylogenies based on the concatenated nucleotide and protein alignments of the 65 single-copy orthologs showing the phylogenetic relationships among 59 Mollicutes strains with sequenced genomes.
(A) Maximum likelihood phylogeny constructed using the concatenated nucleotide alignment of the 65 single-copy orthologs, (B) Bayesian phylogeny using the concatenated nucleotide alignment, and (C) Bayesian phylogeny using the concatenated aminoacid alignment. Software, alignment type, type of model, and number of bootstraps or generations used in the analyses are given at the top of each phylogenetic tree. Bootstrap support is given for all genomes and the color-coded Latin species names refer to the different types of symbiotic associations found among Mollicutes and their hosts (Figure 1). Gray bold-faced text and dashed lines delineate clades and groups identified in a previous study (Leclercq et al., 2014). Both EntAcro strains are within the Entomoplasmatales group which has higher diversity of hosts, targeting vertebrates, invertebrates and plants, than any of the other groups where hosts appear to be more clade-specific. Related lineages to EntAcro10 (S. mirum and S. eriocheiris) and EntAcro1 (M. florum and M. yeatsii) are associated with taxonomically very different hosts than ants, suggesting that there have been no major constraints for radical host shifts among these Entomoplasmatales.
Figure 1—figure supplement 3
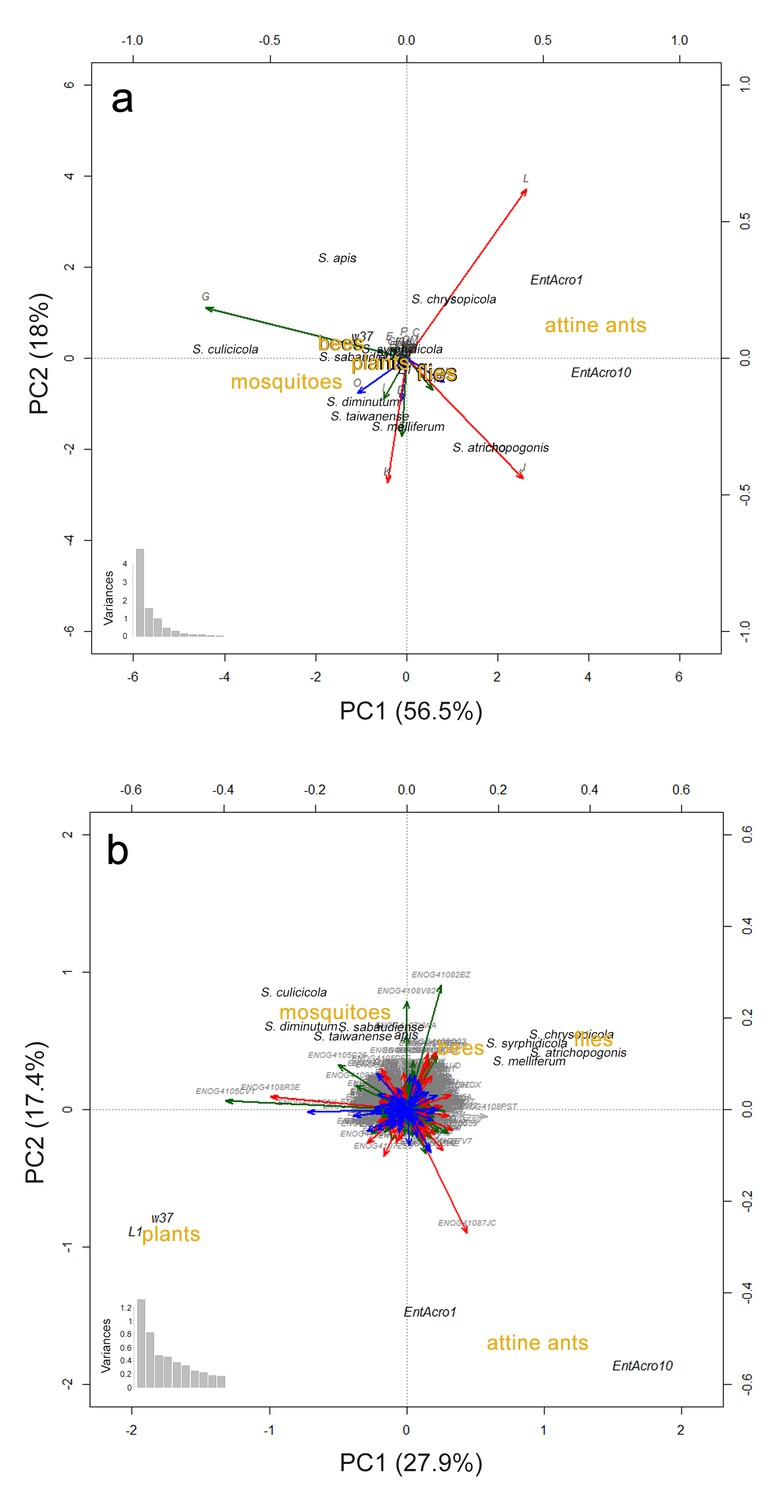
Principal Components Analyses (PCA) visualizing gene content similarities of EntAcro1, EntAcro10 and the eleven most closely related Mollicutes genomes.
We used the same nine insect-associated Spiroplasma strains in all our comparative analyses (see Materials and methods) and two additional Mesoplasma strains (L1 and W37) which are the closest relatives of EntAcro1. We excluded the male-killing S. poulsonii strain from the comparisons because of its extreme (induced by a large number of transposases; see above and (Paredes et al., 2015)) genomic differences relative to the other Mollicutes strains, which masked the differences among the remaining strains. PCAs were based on proportional similarity in annotated genes across functional categories (A), and across orthogroups (B), as identified using the bactNOG database. The functional categories in (A) and the orthogroups in (B) are presented as vectors using the same color coding as in Figure 1—figure supplement 1. The distributions of variances among the vectors are given at the bottom left of each plot. Mollicutes strains are presented in black text, functional categories and orthogroups in grey text, and hosts of the Mollicutes strains in brown text. The plots do not include genes of unknown function (the S role category in Figure 1—figure supplement 1). In both the (A) and (B) panels segregation effects were primarily loaded by orthogroups related to metabolism and secondary by orthogroups related to information. In both analyses clustering of strains was more distinct when based on host similarities than on overall bacterial phylogenomic relationships.
-
Figure 1—figure supplement 3—source data 1
Functional annotation results for the 14 closely related insect-associated Mollicutes genomes using the bacterial eggnog (bactNOG) database.
The proportional counts of genes (counts of each functional category or orthogroup divided by the total number of annotated genes) assigned to distinct functional categories via bactNOG are presented.
- https://doi.org/10.7554/eLife.39209.007
Figure 2 with 3 supplements
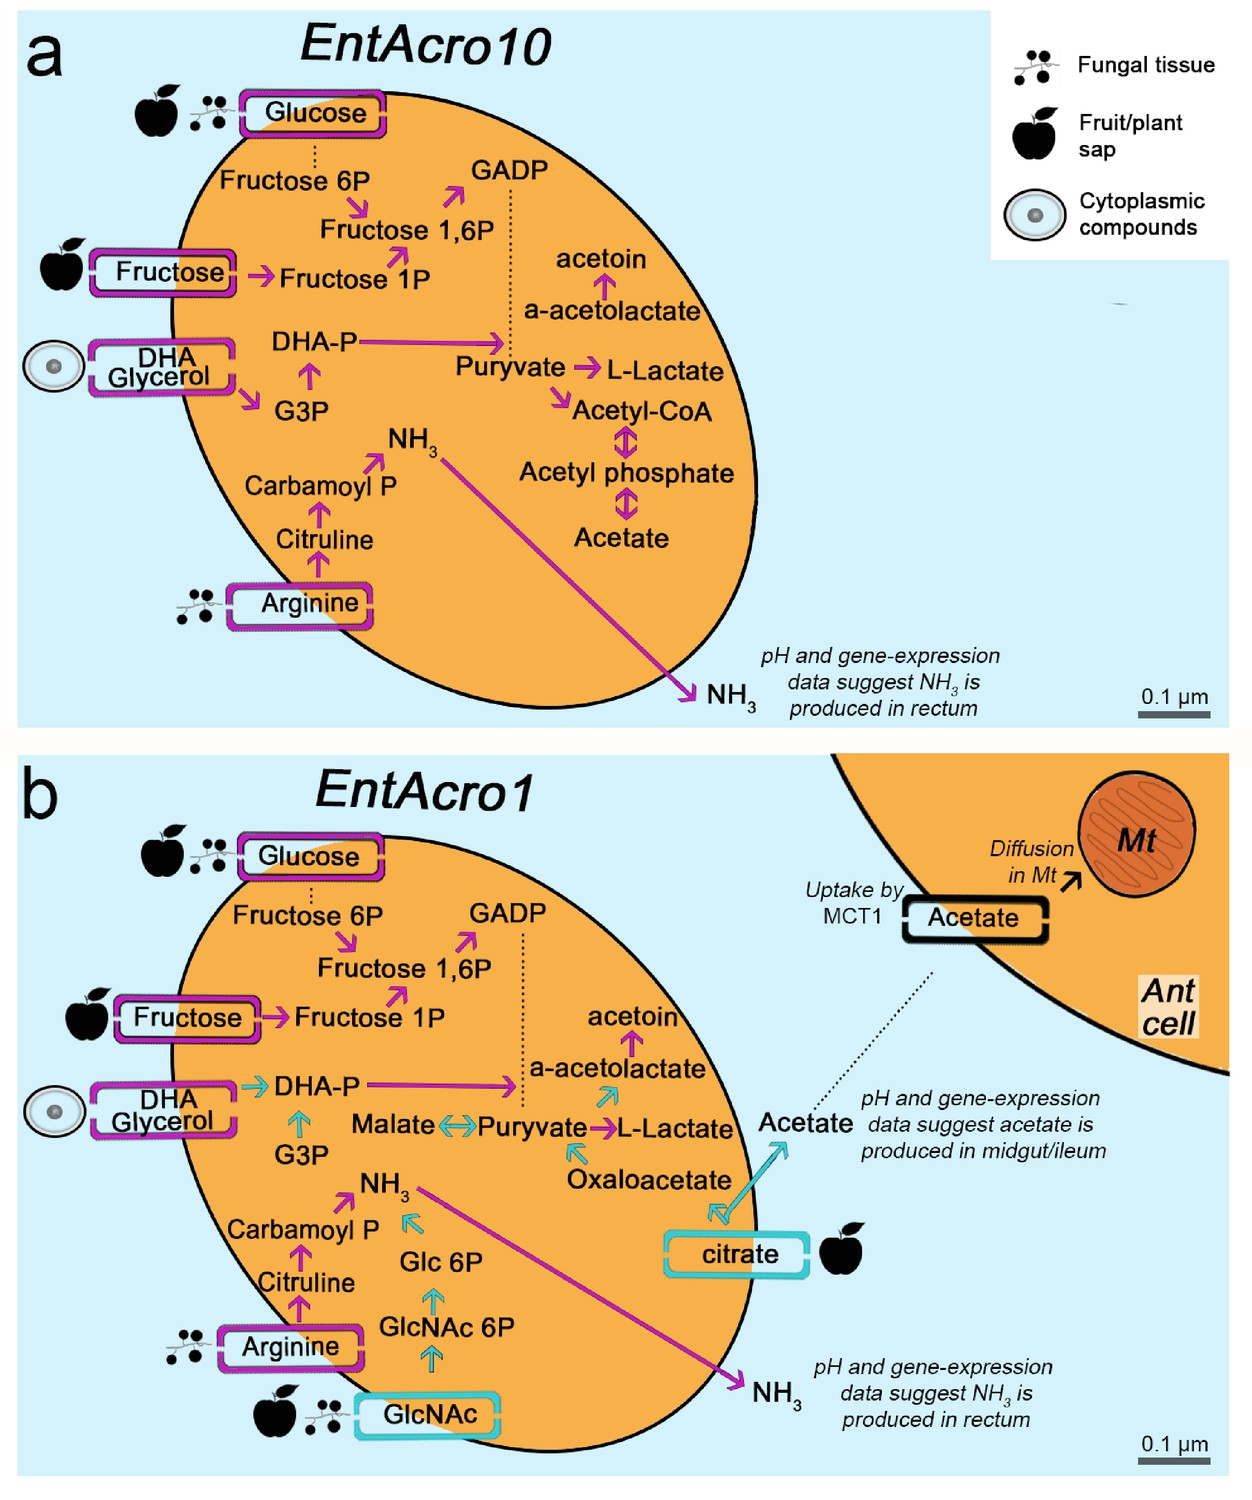
Morphological and metabolic characteristics of the EntAcro10 and EntAcro1 symbionts of attine fungus-growing ants.
(a) Schematic EntAcro10 cell with pink arrows representing KEGG pathway reconstructions based on intact genes coding for proteins metabolizing specific compounds and pink rectangles crossing the plasma membrane representing predicted transporter genes that import metabolites from the ant gut lumen where fungal biomass and imbibed fluids are digested (cf symbols next to the transporter rectangles). GlcNAc is present in fungal tissues (Pérez and Ribas, 2013) or plant material that may have been decomposed by the fungal cultivar, citrate and glucose/fructose are present in fruit juice and possibly plant sap that ants drink (Liu et al., 2012; Medlicott and Thompson, 1985), arginine is mainly provided by the ingested fungal tissues or juices from leaves and fruits (Nygaard et al., 2016; De Fine Licht et al., 2014; Nygaard et al., 2011; Winter et al., 2015), and glycerol is commonly available in the cytoplasm of eukaryote cells (Grubmüller et al., 2014; Joseph et al., 2008; Monniot et al., 2012; Sun et al., 2003). Dotted lines between metabolic products represent intermediate genes and other metabolic products not shown. Arginine metabolism produces NH3, which will be excreted and help the bacteria survive the acidic conditions (Figure 4—figure supplement 1) to end up in the fecal droplets used to manure the ants fungus-garden. The bacterial cell shape and the estimated size (scale bars) were obtained using TEM data from a previous study (Sapountzis et al., 2015). (b) Schematic representation of the EntAcro1 cell with the functional KEGG pathway reconstructions and predicted transporters inferred from the EntAcro1 genome that are identical to EntAcro10 in panel ‘a’ as pink arrows. Unique additional pathways and transporters only found in EntAcro1 are drawn in green, and include the anaerobic citrate fermentation pathway, which produces acetate that can be taken up by ant cells, and the GlcNAc pathway that results in byproducts that can enter glycolysis in the bacterial cells.
Figure 2—figure supplement 1

Citrate utilization genes in Mollicutes.
(A) Schematic representation of the citrate catabolism operon in EntAcro1A, E. melaleucae, S. culicicola and S. eriocheiris. The combination of citrate utilization genes was only found in these four strains, that is, 2.3% of the 177 genomes examined). Arrows are proportional to the sizes (bp) of the genes, and the orientation of genes is captured by the arrowheads. Green-colored arrows refer to genes involved in citrate catabolism and gray arrows to genes that are unrelated to this pathway. Connecting lines between operons of different strains indicate gene rearrangements (only between S. eriocheiris associated with fly hosts and the remaining strains). All genes are presented with their common names as identified by RAST annotation: citS: citrate transporter (peg676); citC; citrate ligase (a.k.a. citrate pro 3 s lyase) (peg.671); citD, citE and citF; the three subunits of citrate lyase (alpha beta and gamma) (peg.673–675); citG: 2-(5''-triphosphoribosyl)−3'-dephosphocoenzyme-A synthase; however citG cannot be part of the potential citrate operon as it does not have the same orientation as the other genes. (B–F) Phylogenies based on amino acid alignments of the citrate utilization genes (B) peg.670, (C) peg.671, (D) peg.673, (E) peg.675 and (F) peg.676) in EntAcro1 and the top 100 hits (or fewer if there were no hits available) on NCBI (peg.674 produced no hits). For each hit we present the bacterial strain it originates from (italics) and the accession number on NCBI (regular font). Predicted Mollicutes proteins are highlighted with yellow background and EntAcro1 is written in blue. Support values are based on the Fasttree algorithm. Comparison of the GC content and the tetranucleotide frequencies of the citrate utilization genes (peg. 671, peg.673– 676) as well as upstream and downstream genes revealed no differences (with the exception of citS) suggesting that the citrate transporter genes that we analyzed are not part of a genomic island introduced by a recent Horizontal Transfer event.
Figure 2—figure supplement 2
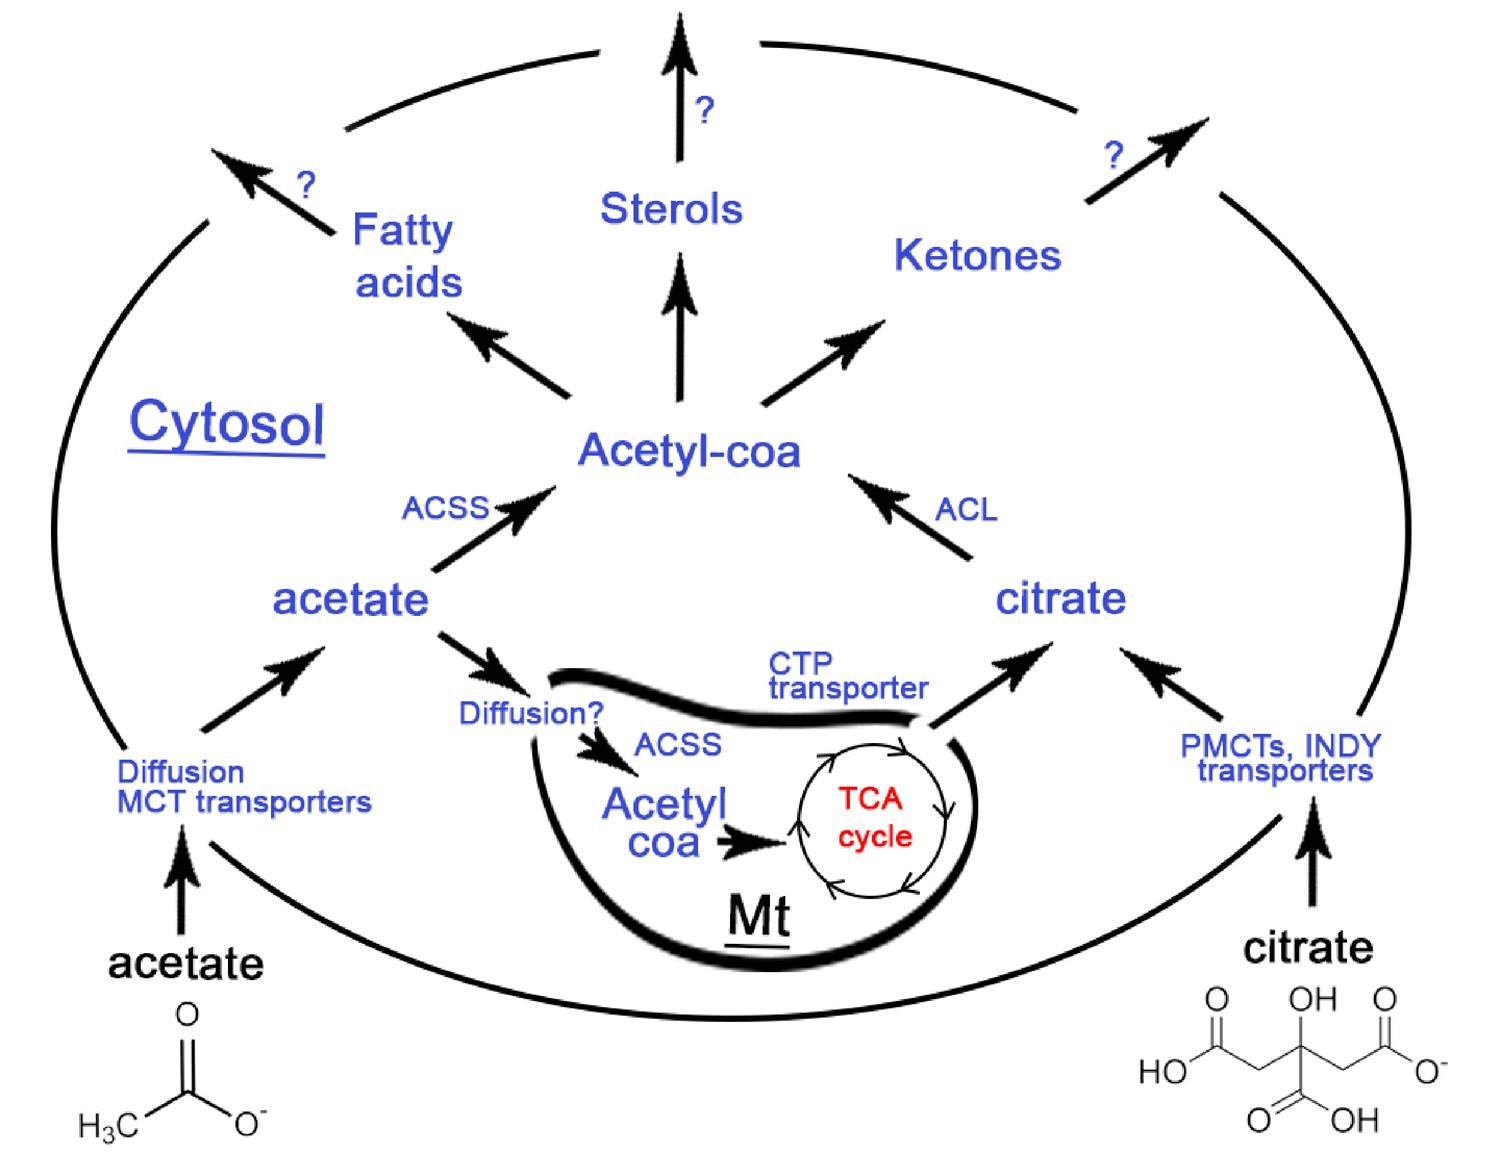
Synopsis of the fate of extracellular acetate (on the left) and citrate (on the right) when they enter a eukaryotic cell, based on the available literature.
The black outer circle represents the cell membrane with blue text referring to enzymes and black text referring to processes mediating the import or conversion of metabolites. A mitochondrion (Mt) is shown inside the cell with red text referring to the TCA cycle generating energy in the form of ATP. Import of citrate requires PMCT transporters and homologues of these proteins have been found in Drosophila (INDY), while another type of citrate tranporter (CTP) mediates the export of citrate from mitochondria to the eukaryote cytosol (cytoplasm). Acetate import in cells can proceed either by diffusion or be mediated by Monocarboxylate Transporters (MCTs) (Kirat and Kato, 2006; Moschen et al., 2012) mostly documented for MCT1. Once imported in eukaryote cells, ATP Citrate Lyase (ACLY) in the cytosol can convert citrate to cytosolic acetyl-coa which can be used for the production of fatty acids, sterols (steroid alcohols) and ketones (Pietrocola et al., 2015; Fatland et al., 2002; Sun et al., 2010a; Sun et al., 2010b). In the presence of abundant nutrients, citrate is known to be exported from the mitochondria to the cytoplasm to produce cytosolic acetyl-coa (Vysochan et al., 2017). Similar to citrate, also acetate imported in the cytoplasm of eukaryote cells can be converted to cytosolic acetyl-coa using acetyl synthase (ACSS) and then cytosolic acetyl-coa, mediating a similar production of fatty acids, sterols and ketones (Pietrocola et al., 2015). However, in contrast to citrate, acetate - once being part of the cytoplasm - can also enter the mitochondria through an as yet unknown mechanism, possibly just by diffusion (Cybulski and Fisher, 1977) where it can be converted to acetyl-coa by acetyl synthase (ACSS, aka AceCS), an enzyme produced both in the cytosol and the mitochondria (Fujino et al., 2001). Mitochondrial acetyl-coa can then enter the TCA cycle and produce energy (ATP) directly (Pietrocola et al., 2015; Fujino et al., 2001). In Acromyrmex ants, several Monocarboxylate transporters (MCTs), an ACSS, an ACLY and an INDY plasma citrate transporter are known to be encoded by the ant genome (Nygaard et al., 2011). The expression in workers of MCTs, ACLY and ACSS has been verified, but INDY expression remains unknown. In termites, as much as 100% of the insects’ energy demands are covered by fermented acetate produced by the gut microbiome (Odelson and Breznak, 1983) suggested to be mediated by an active ACSS (O'Brien and Breznak, 1984).
Figure 2—figure supplement 3
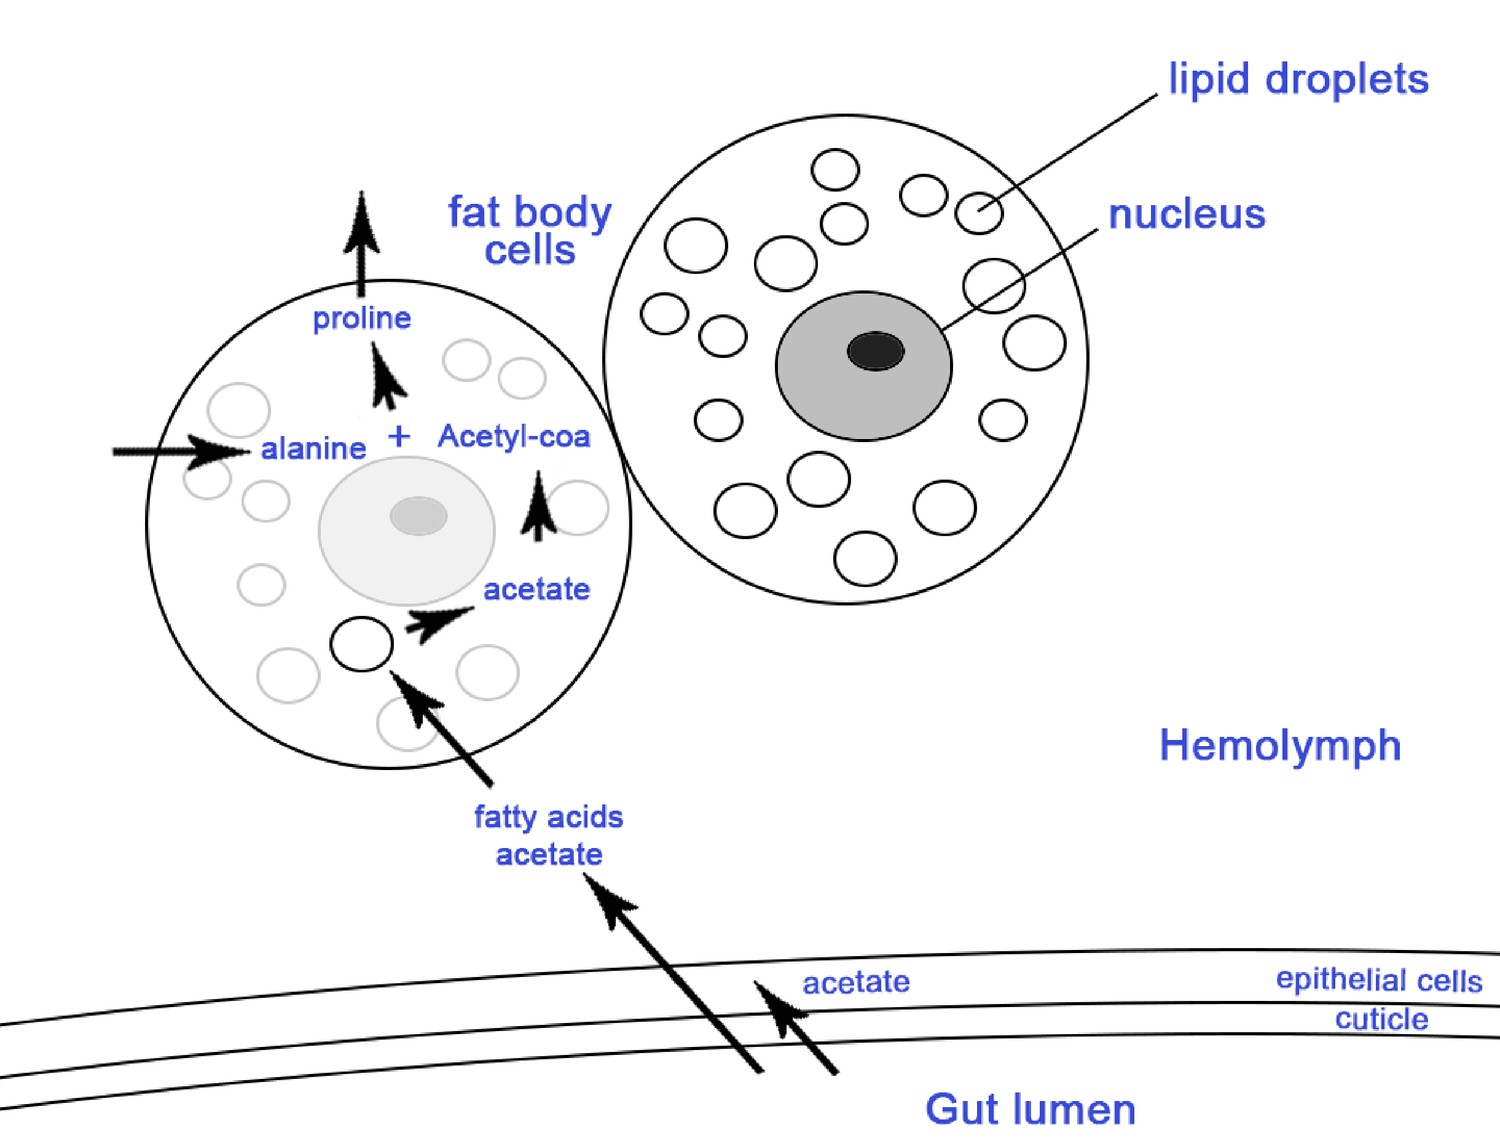
Schematic representation of two ant fat body cells and the process of storing acetate in the lipids of the fat body cells.
Arrows show metabolic processes where metabolites from the gut pass to the fat bodies for storage to be used in periods of nutritional stress when they are converted to high energy nutrients such as proline and triglycerol which are released in the hemolymph (reviewed in (Arrese and Soulages, 2010)). Considering that the midgut and ileum are sites that are both colonized by the EntAcro1 and where acetate is most likely produced (Figure 4—figure supplement 1), and that previous work has shown that epithelial cells are lining the gut and the surrounding fat body cells (Wigglesworth, 1972), it seems likely that gut epithelial cells and fat body cells absorb the acetate produced by EntAcro1.
Figure 3 with 1 supplement
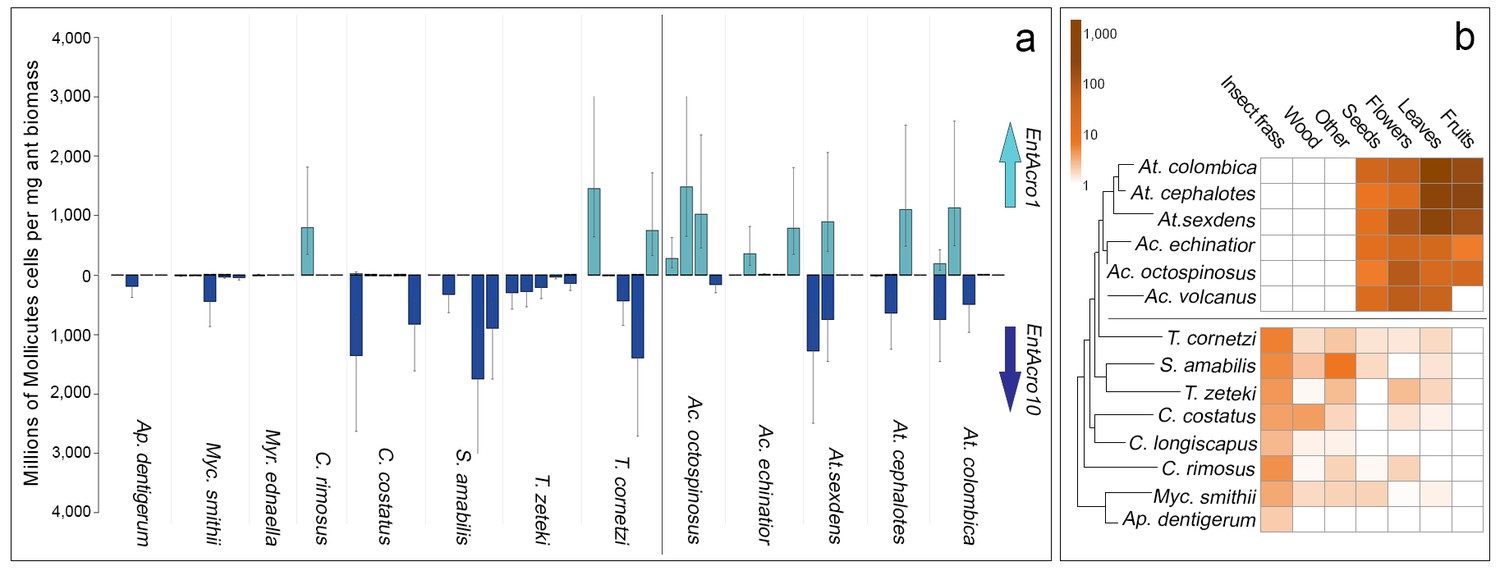
Absolute abundances of EntAcro1 and EntAcro10 and foraging substrate preferences across thirteen species of Panamanian fungus-growing ants spanning the entire attine ant phylogenetic tree.
(a) Millions of Mollicutes cells per mg of ant worker biomass (means ± 95% CI based on two technical replicates) across colonies for EntAcro1 (light blue upward arrow) and EntAcro10 (dark blue downward arrow). The vertical line between Ac. octospinosus and T. cornetzi separates the leaf-cutting ants (right) from the non-leafcutting ants (left). (b) Foraging substrate preferences among Panamanian attine ant species presented as mean frequency heat-maps of substrate categories collected per hour for five leaf-cutting ant species (Kooij et al., 2014a) and seven non-leaf-cutting ant species (this study). The tree has been modified from (Branstetter et al., 2017; Schultz and Brady, 2008) and the horizontal line separates the leaf-cutting ants (top) which forage mostly on fresh plant material, from the more basal attine ants (bottom) which forage mostly on detritus based material (Figure 3—figure supplement 1).
-
Figure 3—source data 1
QPCR data for the absolute quantification of EntAcro strains in fungus-growing ants.
From left to right: the names of samples and ant species, and the sampling characteristics and qPCR Ct values generated.
- https://doi.org/10.7554/eLife.39209.014
-
Figure 3—source data 2
Merged ant foraging data used for our analyses of data originating from Sapountzis et al. (2015) and the present study.
From left to right: the colony, the ant species, the foraging substrate, and the normalized counts of each piece of substrate recorded.
- https://doi.org/10.7554/eLife.39209.015
Figure 3—figure supplement 1

Principal Components Analysis (PCA) capturing the covariances between attine ant species (colored dots) and foraging substrate preferences (colored arrows) across the Panamanian attine ant hosts of EntAcro1 and EntAcro10 endosymbionts (data from Figure 3B, Figure 3—source data 2).
The seven foraging substrate preference categories (leaves, insect frass, flowers, seeds, wood, fruits, other) are presented either in shades of green (for ants collecting mainly fresh plant-material) or shades of yellow/red/brown (for ants collecting mainly dried plant material or animal-waste), roughly representing changes in foraging from the base to the crown in the attine ant tree (Figure 3B). The plotted datapoints are averages of proportional foraging substrate prevalences across ant colony samples (n) (see Materials and methods). The best segregating foraging substrate preferences were leaves (mostly acquired by Atta and Acromyrmex leaf-cutting ants), flowers (mostly acquired by Acromyrmex leaf-cutting ants, but also observed for Trachymyrmex and Sericomyrmex species in more open habitats in Gamboa; J.J. Boomsma, pers. obs.), and insect frass (mostly acquired by the lower attine ants). Analyses with a (zero-inflated) negative binomial regression model (see Materials and methods) showed that leaf-cutting ants, the almost exclusive carriers of EntAcro1 bacteria, forage significantly more on fresh plant material (leaves, seeds and flowers; Tukey's post hoc, z = 3.97, p=0.005, z = 3.38, p=0.045 and z = 3.71, p=0.015, respectively), while the non-leaf-cutting ants, which only have EntAcro10 (particularly S. amabilis and T. zeteki), forage significantly more on insect frass, dry wood and ‘other’ substrates (Tukey's post hoc, z = −5.93, p<0.001, z = −4.84, p<0.001 and z = −5.24, p<0.001, respectively).
Figure 4 with 1 supplement
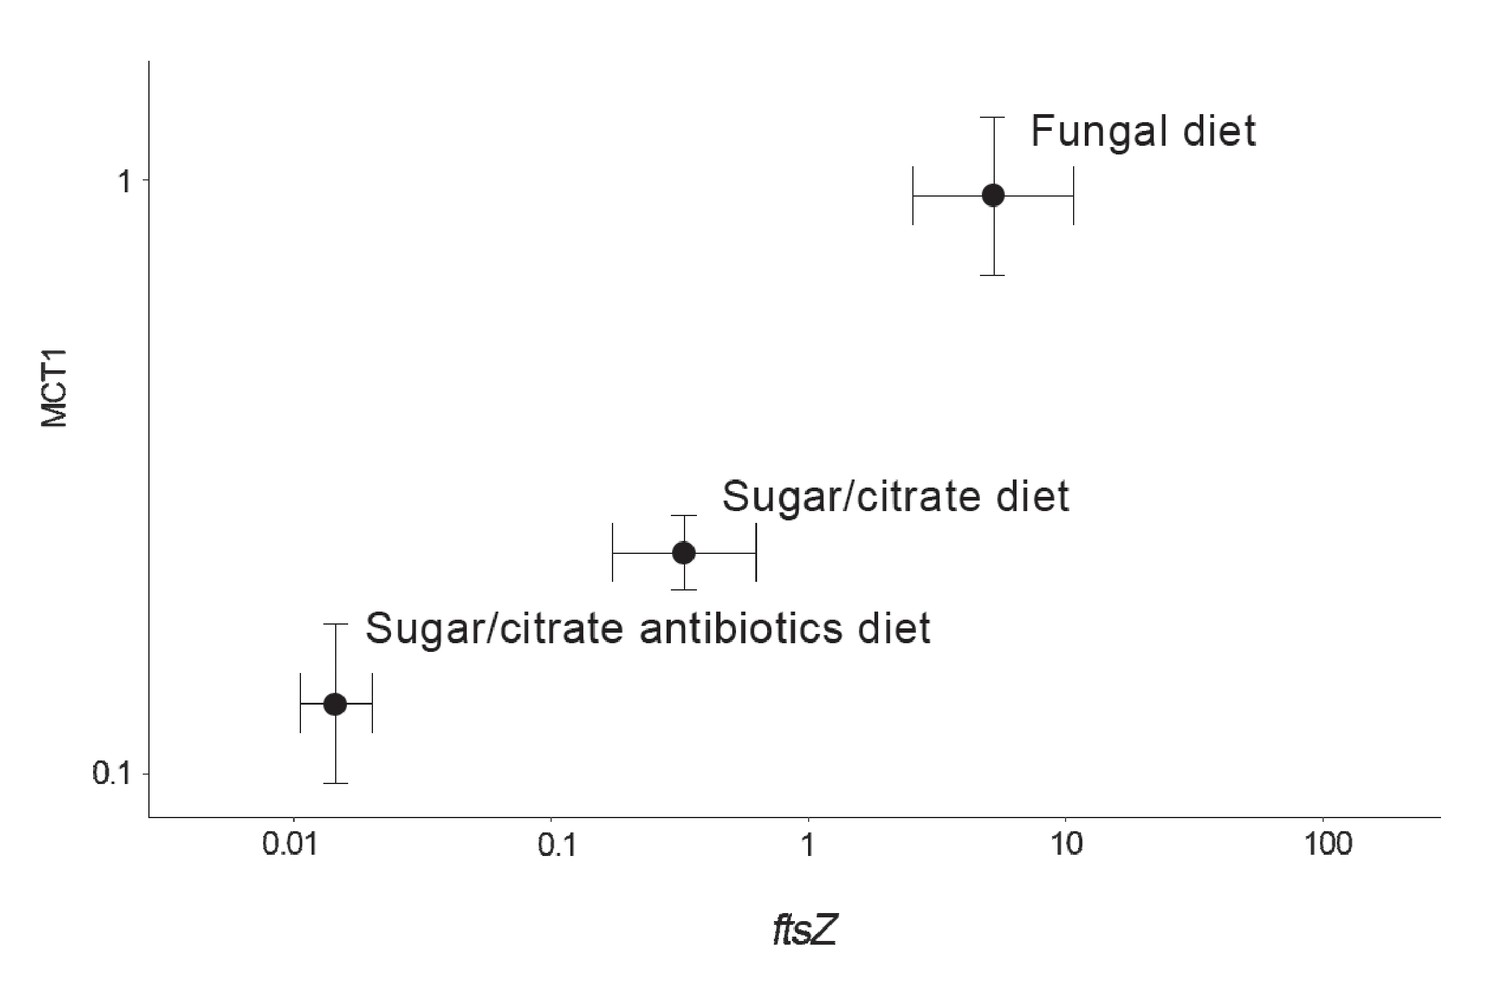
Correlation between the abundance of the EntAcro1 symbiont (expression of the EntAcro1 housekeeping gene ftsZ) and the activity of the predicted plasma-membrane Monocarboxylate Transporter-1 gene (MCT1) in the midgut and fat body tissues of Ac. echinatior workers.
Both axes are logarithmic and express numbers of transcripts normalized relative to the expression of the housekeeping ant gene rpl7). Control ants were provided with their natural fungal diet, while manipulated nestmates were kept for seven days without a fungus garden but with access to a glucose/citrate solution with or without antibiotics. Values are means (±SEs) of 20 pooled workers replicated twice (technical replicates) across four colonies. The correlation between the two transcript abundances was significant, with the first component of a PCA analysis explaining 91% of the variation. A non-parametric Spearman correlation analysis produced a similarly significant result (ρ = 0.57, p<0.001), but correlation tests between ftsZ transcripts and the expression of the other MCT-like genes present in the ant genome did not produce significant correlations (Supplementary file 6).
-
Figure 4—source data 1
Expression data for the monocarboxylate transporter genes examined in our study.
From left to right: the Ct values generated for the ten MCT- like genes using qPCR, the EntAcro-ftsZ and the RPL7 normalization genes, the sample names, the ant colony and the diet treatment the samples originated from.
- https://doi.org/10.7554/eLife.39209.019
Figure 4—figure supplement 1
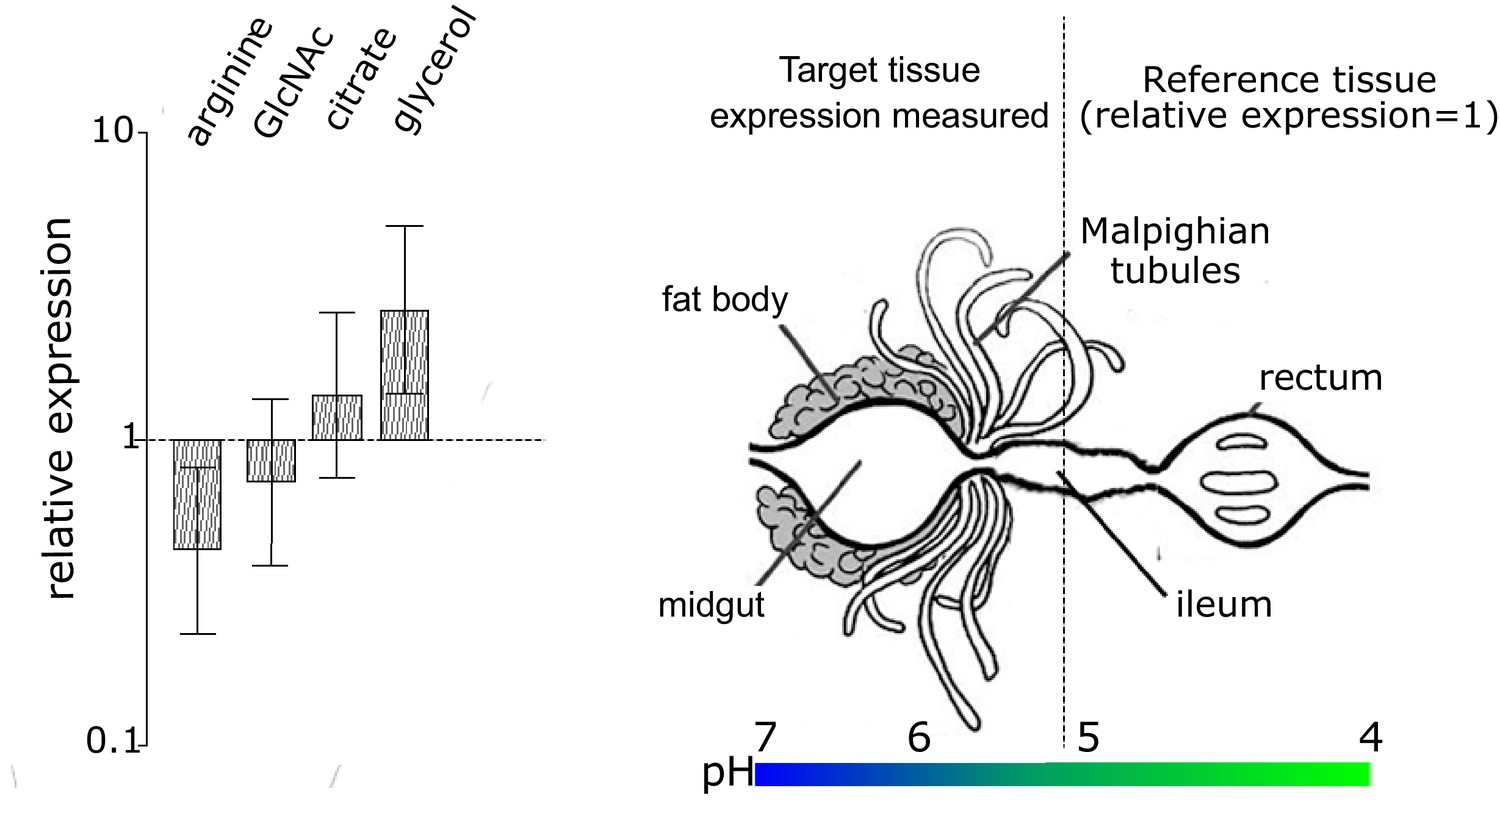
Differential expression and importance of the four substrate utilization transporter genes of EntAcro1 that we analyzed.
Expression was measured in the midgut and fat body compartment of Ac. echinatior relative to the hindgut, so we obtained log ratios for arginine, GlcNAc, citrate and glycerol transporters after dividing their deltadelta Ct values by the deltadelta Ct values of the ftsZ gene; see Materials and methods for each ant sample (presented with 95% confidence intervals across replicate samples based on the Pfaffl method; averages of two technical replicates across four colonies). These four transporters were selected because they mediate the catabolism of substrates that are known to be abundant in the gut lumen of fungus-growing ants (Figure 2). The fat body/midgut and hindgut compartments were examined because they have been identified as the major sites where EntAcro1 colonizes leaf-cutting ant tissues (Sapountzis et al., 2015). The heatmap bar below the schematic representation of the ant compartments illustrates the pH gradient across the entire ant gut system and its associated organs (Erthal et al., 2004). Although the overall levels of relative bacterial gene expression were not significantly different across compartments (fat body/midgut versus hindgut)(F = 0.041, d.f. = 1, p=0.8403) or the four examined genes separately (F = 2.606, d.f. = 3, p=0.068), the interaction term between the gene identities and the tissue types was significant (F = 3.908, d.f. = 3, p=0.017). Posthoc tests using planned contrasts showed that the arginine transporter was more highly expressed in EntAcro1 cells in the hindgut lumen (planned contrasts: z = 2.09, p=0.044), while the glycerol/DHA transporter was more highly expressed in EntAcro1 cells of the fat body/midgut compartment (planned contrasts: z = −2.45, p=0.019). However, Bonferroni correction rendered these differences non-significant (p=0.177 for arginine and p=0.078 for glycerol). The apparent ability of EntAcro1 symbionts to catabolize different substrates across a long stretch of the alimentary tract of attine ant workers (Figure 2) is likely to contribute to the robust persistence of EntAcro1 cultures under natural variation in nutrient availability. The production of NH3 by EntAcro1 (through arginine decomposition) allows bacteria to tolerate acidic conditions, which likely allows these bacteria to survive even when pH values in the Acromyrmex rectum drop to ca. 4 (Erthal et al., 2004) and thus to continue their arginine decomposition services until they are deposited with the fecal fluid onto new fungus garden growth and die because conditions become aerobic (see text for details). Higher expression of the glpF in the fat body compartment suggests that EntAcro symbionts use glycerol/DHA (glpF can likely be used to import both glycerol and DHA (Monniot et al., 2012) but EntAcro1 can only metabolize DHA, while EntAcro10 can only metabolize glycerol). Glycerol/DHA catabolism has been suggested to aid general survival of symbiotic bacteria in eukaryote cells (Joseph et al., 2008; Sun et al., 2003). The almost equal expression of GlcNAc and citrate transporters across the pH gradient of the gut system (and its associated organs) suggests that EntAcro1 is using these substrates in Acromyrmex ants along the midgut, ileum and hindgut lumen, where the Mollicutes are similarly abundant (Sapountzis et al., 2015).
-
Figure 4—figure supplement 1—source data 1
Expression data for the bacterial transporter genes examined in our study.
From left to right: the mean Ct values generated for the four transporter genes using qPCR, the EntAcro-ftsZ gene used for normalization, the ant colony, and the tissue the RNA material was extracted from.
- https://doi.org/10.7554/eLife.39209.018
Figure 5 with 3 supplements
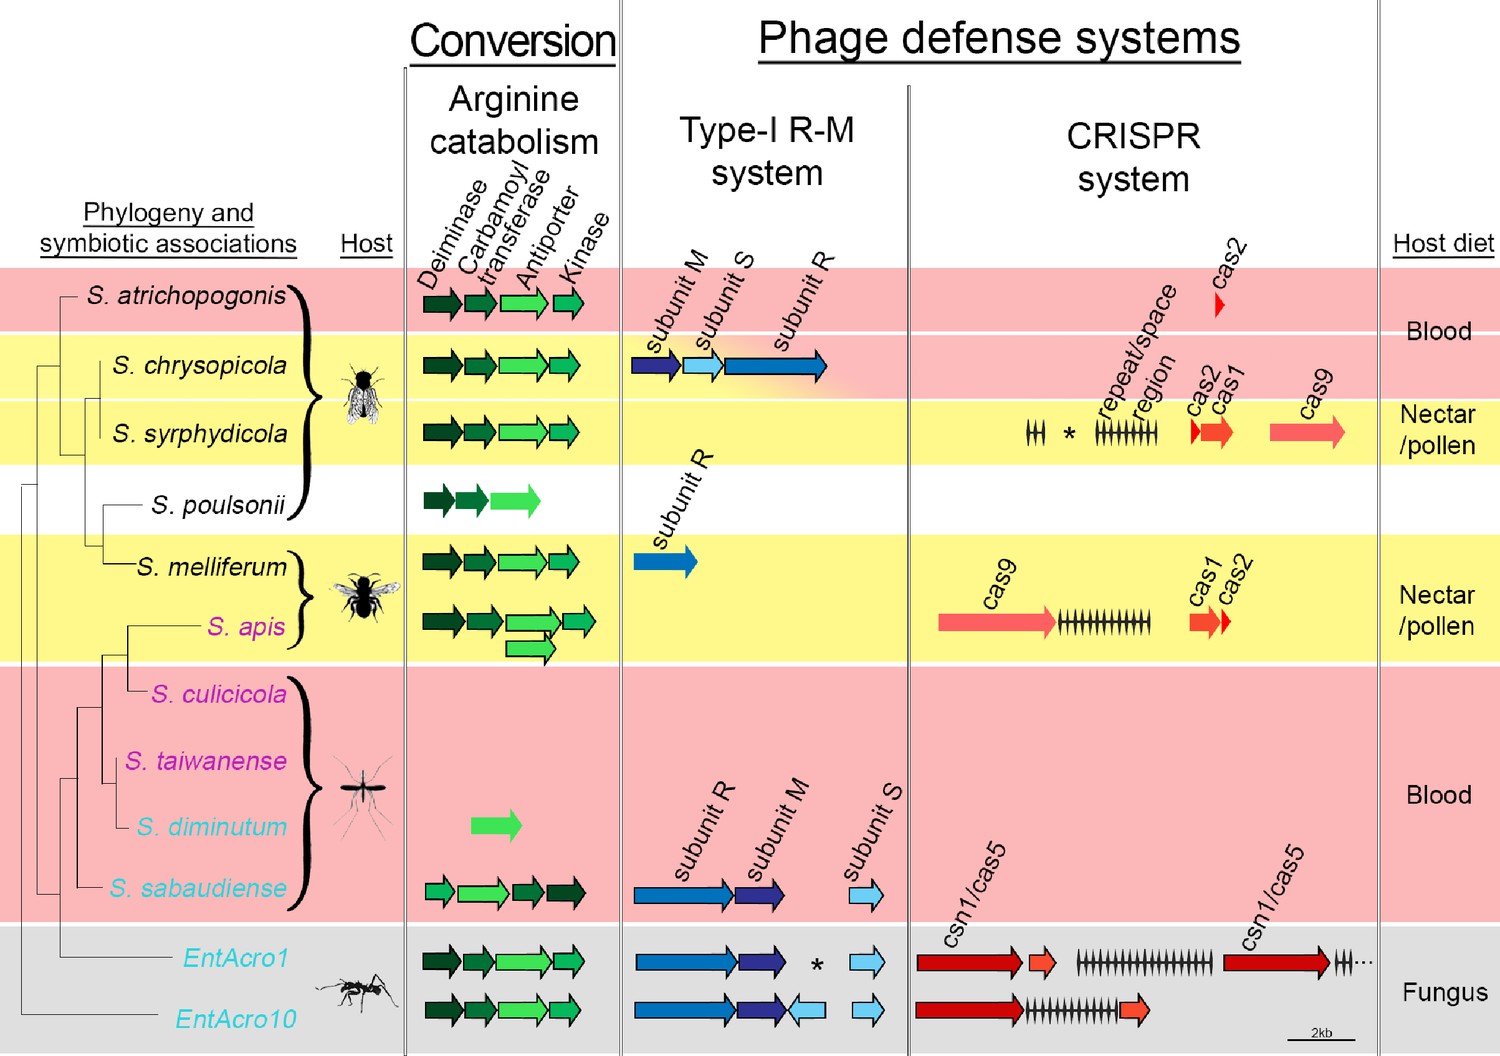
Organization of the arginine catabolism operon and two groups of bacteriophage-defense related genes (Type-I R-M and CRISPR systems) in EntAcro1 and EntAcro10 and closely related Spiroplasma symbionts of other insect hosts.
The tree on the left and the color-coded species names specify different types of association (as in Figure 1 with pink representing confirmed pathogenicity, light blue representing confirmed non-pathogenicity, and black indicating unknown but likely non-pathogenic; Supplementary file 4). Background colors highlight specialized host diets: fungus (gray), blood (red), nectar/pollen (yellow; mixed in deerflies hosting S. chrysopicola where males feed on nectar/pollen and females on blood) and unclear (white; food of Drosophila host is unknown but unlikely to be a specialized diet). Genes in each pathway have different shades of a single color and sizes of arrows and spaces between them are proportional to actual gene sizes relative to the 2 kb scale bar (bottom right). Gene orientations correspond to the direction of arrowheads and all genes are presented with their common names as identified by our RAST annotations (Supplementary file 3). Gene-arrows have a black outline when all core genes for a focal pathway are present, indicating it is functionally active. The asterisks for the Type-I R-M system in EntAcro1 and the CRISPR system in the symbiont of S. syrphydicola indicate that the gap between the two arrows is not proportional to the scale bar but much wider.
Figure 5—figure supplement 1
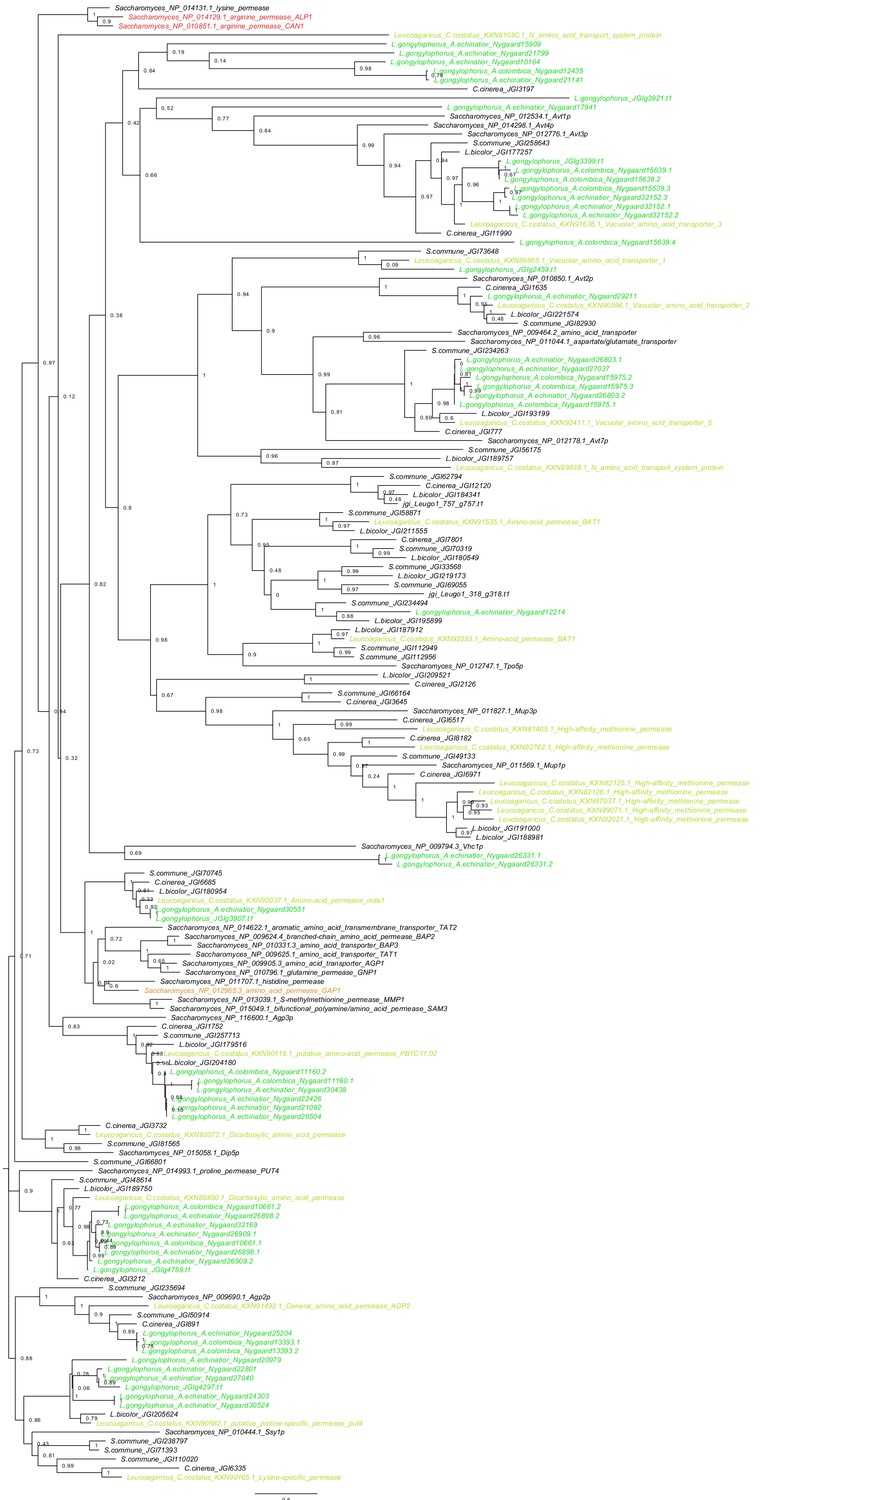
Phylogeny of all amino acid transporters in Saccharomyces, Agaricus bicolor, Coprinopsis cinerea, Schizophyllum commune and the Leucogaricus symbionts of Atta, Acromyrmex and C. costatus.
Green and blue branches are Leucogaricus transporters, black are transporters documented for other multicellular basidiomycetes and unicellular Saccharomyces. Although Leucoagaricus fungal cultivars have a gltA gene that mediates the accumulation of environmental ammonium (Aylward et al., 2013; Macheda et al., 1999), their genomes appear to lack genes encoding the specialized Alp1 and Can1 proteins (red), which normally import arginine into fungal cells. This deficiency may have been instrumental in establishing metabolic complementarity between Mollicutes symbionts and the fungal cultivar, because the EntAcro-symbionts would catabolize excess arginine derived from the ants’ fungal food and possibly also from ingested plant sap as arginine may function as nitrogen-storage molecule in plants (Winter et al., 2015). This would imply that the ants gradually increase the gut-lumen ratio of NH3 to arginine from the midgut to the hindgut to ultimately release any excess nitrogen in a readily available form when they manure their fungus gardens. This hypothesis is somewhat challenged by the fact that closely related free-living basidiomycete fungi (Agaricus bicolor, Coprinopsis cinerea, Schizophyllum commune) also lack the genes encoding the specialized Alp1 and Can1 proteins, so this deficiency is not directly associated with life as a domesticated crop. It also appears possible that basidiomycete hyphae can import arginine, shown in a study of Agaricus bicolor (Kersten et al., 1999) that suggested the generic Gap1 protein (orange) can be used as alternative transporter. However, even if Leucoagaricus, and other fungi of the same clade, can utilize arginine, this would only happen if preferred nitrogen sources such as glutamine and ammonia (Ahmad et al., 1990; Abril and Bucher, 2004) are absent which does not seem very likely to happen, because an earlier study showed that the fecal droplets contain a mixture of allantoin, ammonia and most aminoacids (Martin and Martin, 1970).
Figure 5—figure supplement 2

KEGG metabolic reconstructions based on the intact genes present in the Acromyrmex, Solenopsis, Apis mellifera and Anopheles gambiae genomes, together constituting the urea cycle.
The gray arrow shows the absent gene (in all four insect genomes) and the purple arrows connect genes that other insect genomes have intact but are lacking in the attine ants. Black arrows connect genes that are present in all genomes examined. The asterisk shows that the gene encoding the enzyme that converts citruline to L-arginosuccinate is present but has been pseudogenized in attine ants. While several insects can make arginine from citrulline and aspartate, the attine ants do not have this option because they lack an arginosuccinate synthase and an arginosuccinate lyase (Nygaard et al., 2016; Nygaard et al., 2011). These two genes catalyze the reaction of aspertate and citrulline to arginosuccinate, which in turn produces arginine and fumarate. The produced arginine can then be decomposed again to citrulline and possibly re-initiate arginine biosynthesis. It is unclear whether having an arginosuccinate synthase and an arginosuccinate lyase makes a difference in overall arginine biosynthesis efficiency, because the urea cycle is incomplete in all ants. Similarly, honeybees and mosquitoes are known to synthesize arginine themselves from protein turnover, but functional data have shown that they also need to acquire this amino acid from their diets in order to have normal development and reproduction (de Groot, 1952; Vrzal et al., 2010; Uchida, 1993). However, the crucial issue for our present study is that lack of arginosuccinate synthase and lyase implies that the attine ants cannot recycle arginine because they cannot synthesize it from citrulline and aspartate like the other insects. This inability would potentially induce substantial waste of nitrogen because arginine is the most nitrogen-rich amino acid in existence. Because the fungal cultivar has a complete arginine cycle (De Fine Licht et al., 2014). It seems likely that the fungal diet provides the attine ants with not only sufficient, but also periodically too much arginine in their gut lumen and the adjacent organs, so that the benefits of recycling this excess provided an endosymbiotic niche to Mollicutes bacteria and allowed them to offer an important mutualistic function to the entire farming symbiosis.
Figure 5—figure supplement 3
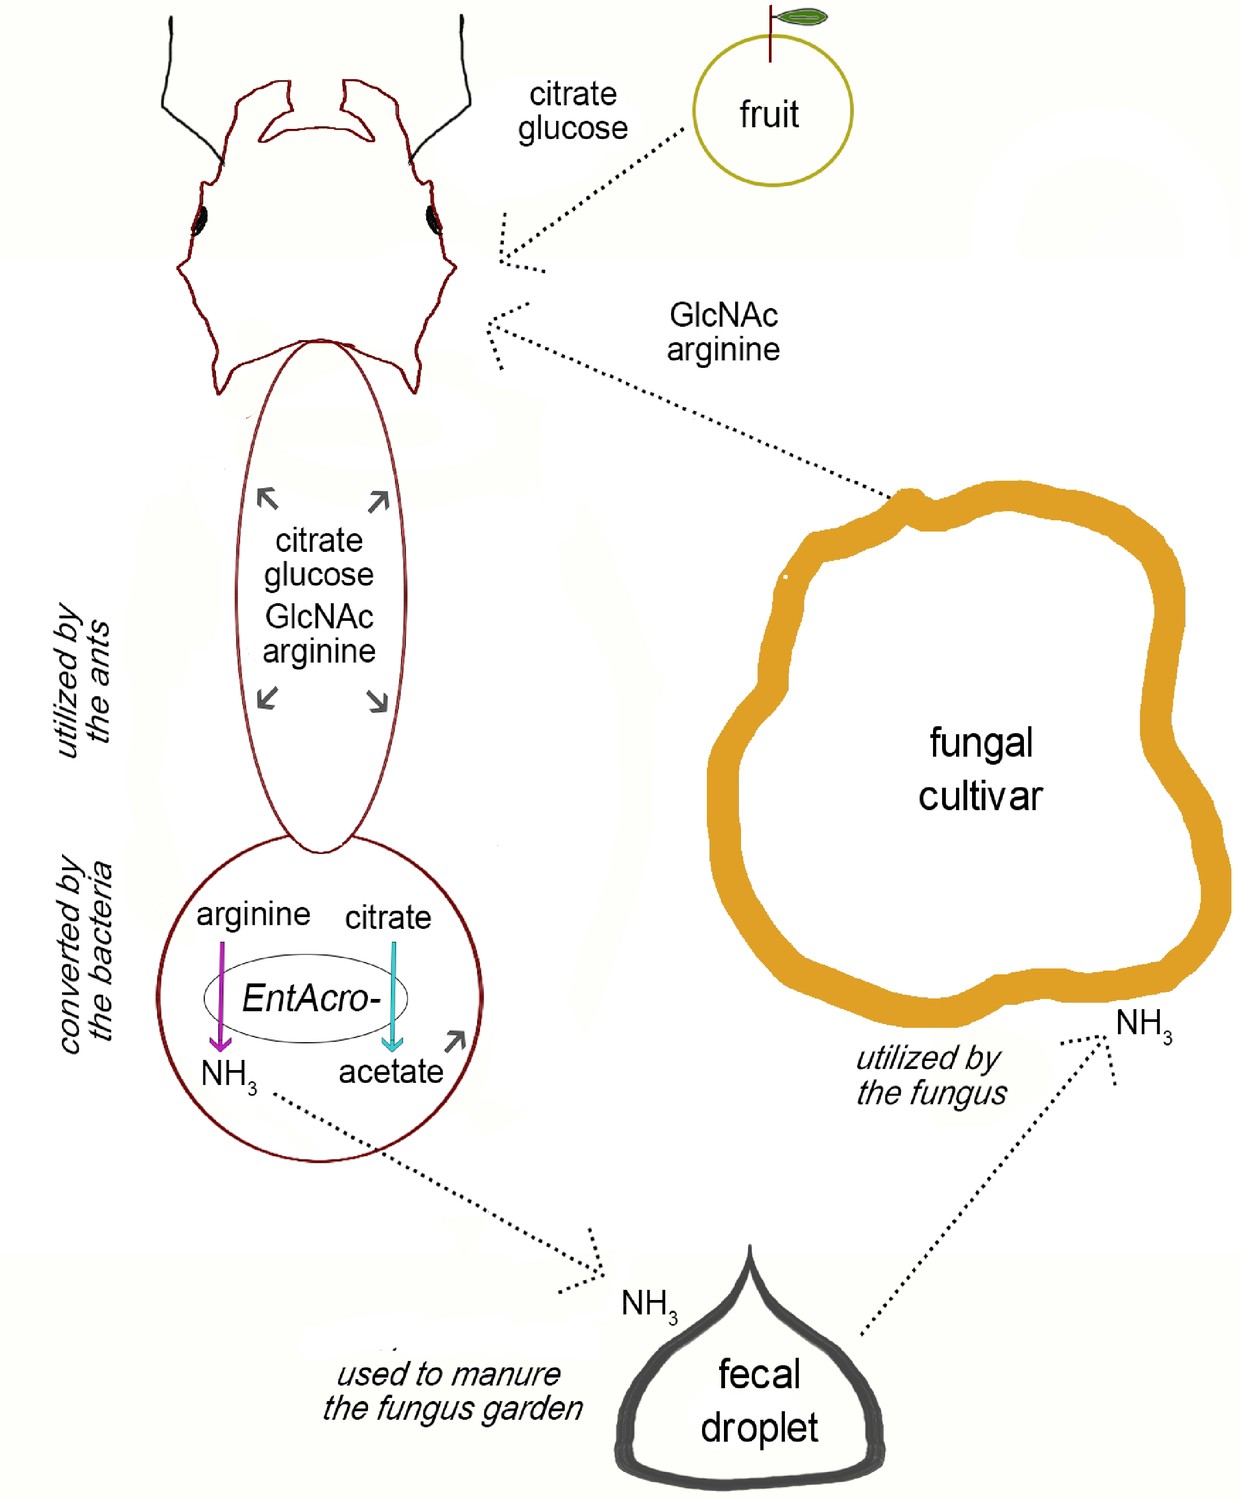
Overview of the potential metabolic complementarity, inferred by our genomic reconstruction, between fungus-growing ants, their fungal cultivar, and their EntAcro symbionts.
Dotted arrows show putative exchange of substrates among the mutualistic partners and small gray arrows inside the ant body represent compounds that can be used by the ants. Colored arrows (the same as in Figure 2) represent putative metabolic byproduct conversions by EntAcro symbionts. Text in italics highlights key processes that contribute to the suggested metabolic complementarity with respect to nutrient exchange.
Additional files
-
Supplementary file 1
Summary statistics of the metagenomic sequencing of the endosymbiotic Mollicutes EntAcro1 and EntAcro10.
Following the assembly, contigs were separated into phylogenetic bins, which are presented in each column. (A) Sequencing statistics, annotation and completeness assessment using the BUSCO orthologs. (B) Total numbers of predicted coding sequences (CDS) that gave top matches with different bacterial classes for EntAcro1. (C) Comparable data for the EntAcro10 bins. In both data sets, ‘A’ bins were the ones that contained contigs with clear similarities to Mollicutes, while ‘B’ bins mostly represented sparse contaminants, and the ‘C’ bin (only EntAcro1) contained sequences that belonged to bacteriophages of the family Microviridae (see text for details). Following the results of the BUSCO analysis, we examined the complete genome sequence of the M. florum symbiont associated with plants (Baby et al., 2013) using the same software, which gave the same numbers of genes as for EntAcro1. These results suggested that our ‘A’ bins represent proper draft genomes of single EntAcro1 and EntAcro10 strains.
- https://doi.org/10.7554/eLife.39209.024
-
Supplementary file 2
The 65 single-copy orthologs used in our phylogenetic reconstructrions as identified by Orthofinder based on 59 Mollicutes genomes, associated mainly with mammal, insect and crustacean hosts (see Materials and methods).
Genome names are presented at the top of each column with the same identifiers as in the ensembly database (http://bacteria.ensembl.org/info/website/ftp/index.html). NCBI accession numbers are given for all ortholog genes (rows) except for EntAcro1 and EntAcro10 where we used the RAST annotation identifiers.
- https://doi.org/10.7554/eLife.39209.025
-
Supplementary file 3
Differences in predicted coding sequences of the fungus-growing ant symbionts EntAcro1A and EntAcro10A and the genomes of closely related Spiroplasma strains associated with mosquito, honeybee and fly hosts that also have specialized diets.
The main table (A) shows the predicted set of genes always present in EntAcro1A while at the same time overlapping with EntAcro10A (the 39 top rows) and to a variable extent also with the twelve other Spiroplasma strains (73 bottom rows). KEGG annotation, eggNOG functional and hierarchical categories, subcategories, subsystems and roles for the predicted genes, as defined by the RAST annotation server, are presented as columns while rows show presences and absences. EntAcro1A genes were sorted first for being shared or not with EntAcro10A, then with the mosquito-associated S. sabaudiense, S. diminutum, S. culicicola, S. taiwanense, then with the bee-associated S. melliferum and S. apis, and finally with the fly-associated S. atrichopogonis, S. chrysopicola, S. syrphidicola, and S. poulsonii. Presences of genes in strains documented or believed to be pathogenic are given in pink and presences in putatively mutualistic or commensal strains are given in light blue (same colors as in Figures 1 and 5). For strains without clear literature references indicating pathogenicity (implying they are unlikely to be pathogens; Supplementary file 4) we used a dark gray font. Enriched complete pathways of EntAcro1 are highlighted with different background colors across rows, using gray and black for complete pathways that are common in bacteria and usually have housekeeping functions or are involved in homologous recombination and are thus not of primary interest. Complete pathways that were of focal interest (based on the eggNOG annotation) are marked in bright colors: shades of green for those involved in metabolism, red for those involved in information processing, and blue for those related to cellular function (same as in Figure 1—figure supplement 1). The legend directly below the table provides short descriptions for each of the highlighted pathways. The separate table (B) summarizes the gene-distributions for the pathways described in Table A, with regard to: (i) pathogenic and non-pathogenic associations of Mollicutes strains, (ii) the respective hosts strains they are associated with, and (iii) bacterial phylogeny (Figure 1).
- https://doi.org/10.7554/eLife.39209.026
-
Supplementary file 4
Symbiotic associations of the Mollicutes strains for which sequenced genomes were available for phylogenetic comparison with the focal EntAcro1 and EntAcro10 symbionts of the present study.
From left to right: the 59 Mollicutes strain IDs for which a phylogeny was constructed (Figure 1, Figure 1—figure supplement 2) using the same identifiers as in the Ensembl database (http://www.ensembl.org), their most likely symbiotic associations (based on the available literature), their hosts, and previous studies that examined their symbiotic interactions.
- https://doi.org/10.7554/eLife.39209.027
-
Supplementary file 5
Primers used in the present study.
From left to right: Primer names, the function of the gene targeted based on the RAST annotation, the target organism, the primer sequences from 5’ to 3’ and the annealing temperatures used for the qPCR.
- https://doi.org/10.7554/eLife.39209.028
-
Supplementary file 6
Correlation statistics for the association between the number of EntAcro1 cells and the expression of 10 MCT-like genes in the Ac. echinatior midgut and fat body tissues.
From left to right we present for each gene examined: The protein ID in the Uniprot database (http://www.uniprot.org/), the gene name and the gene ID based on the Ac. echinatior annotation, the predicted protein size, and the results of statistical analyses examining the correlation between expression of the bacterial ftsZ gene in midgut/fat body tissues and the expression of MCT-like genes. The significance of each correlation was first evaluated using a non-parametric Spearman correlation test (see Methods), for which we give ρ values, p values and Bonferroni corrected p values. The only significant correlation (marked in bold) was between the ftsZ and the MCT1 (F4WHWZ) transporter, for which previous functional experiments have demonstrated that it is actively involved in the import of acetate in eukaryotic cells (Kirat and Kato, 2006; Moschen et al., 2012).
- https://doi.org/10.7554/eLife.39209.029
-
Transparent reporting form
- https://doi.org/10.7554/eLife.39209.030
Download links
A two-part list of links to download the article, or parts of the article, in various formats.
Downloads (link to download the article as PDF)
Open citations (links to open the citations from this article in various online reference manager services)
Cite this article (links to download the citations from this article in formats compatible with various reference manager tools)
Reconstructing the functions of endosymbiotic Mollicutes in fungus-growing ants
eLife 7:e39209.
https://doi.org/10.7554/eLife.39209


