Systematic identification of mutations and copy number alterations associated with cancer patient prognosis
- Google, Inc., United States
- Cold Spring Harbor Laboratory, United States
Figures
Figure 1 with 7 supplements
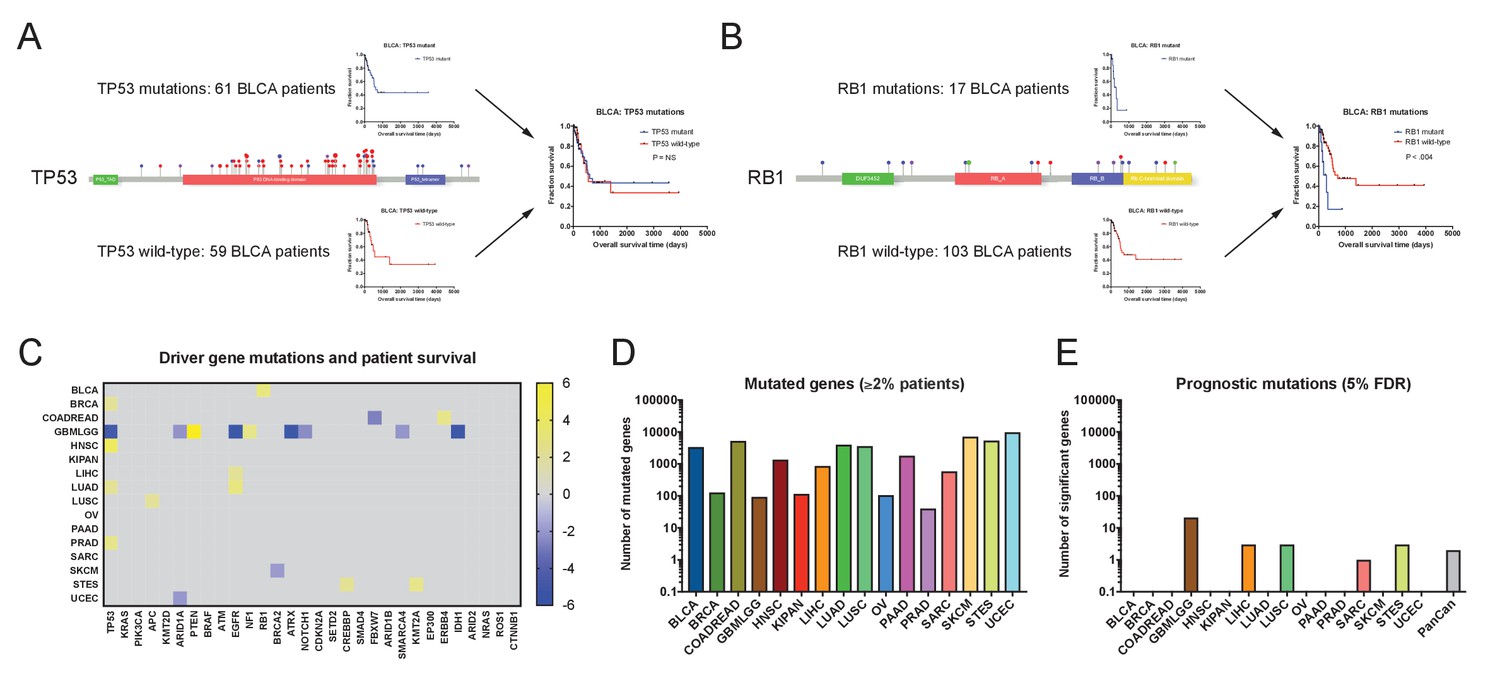
Single base-pair mutations convey limited prognostic information.
(A) Schematic of TP53 mutations and patient survival in the BLCA patient cohort. Red dots indicate missense mutations, blue dots indicate frameshift mutations, and purple dots indicate nonsense mutations. (B) Schematic of RB1 mutations and patient survival in the BLCA patient cohort. Red dots indicate missense mutations, blue dots indicate frameshift mutations, purple dots indicate nonsense mutations, and green dots indicate splice-site mutations. Note that while 17 patients harbor RB1 mutations, 19 mutations are displayed on the lollipop plot, as two patients harbor two mutations in the RB1 gene. (C) A heatmap of significant survival associations among the 30 most frequently-mutated cancer driver genes in 16 tumor types from the TCGA are displayed. Z scores were calculated by regressing survival times between patients harboring wild-type and mutant copies of a gene if a gene was mutated in ≥2% of samples per tumor type. For visualization purposes, only significant Z scores are displayed. The complete list of Z scores is presented in Supplementary file 2A. (D) The number of genes mutated in ≥2% of samples per tumor type are displayed. (E) The number of genes significantly associated with patient outcome at a false-discovery threshold of 5% in each tumor type are displayed.
Figure 1—figure supplement 1
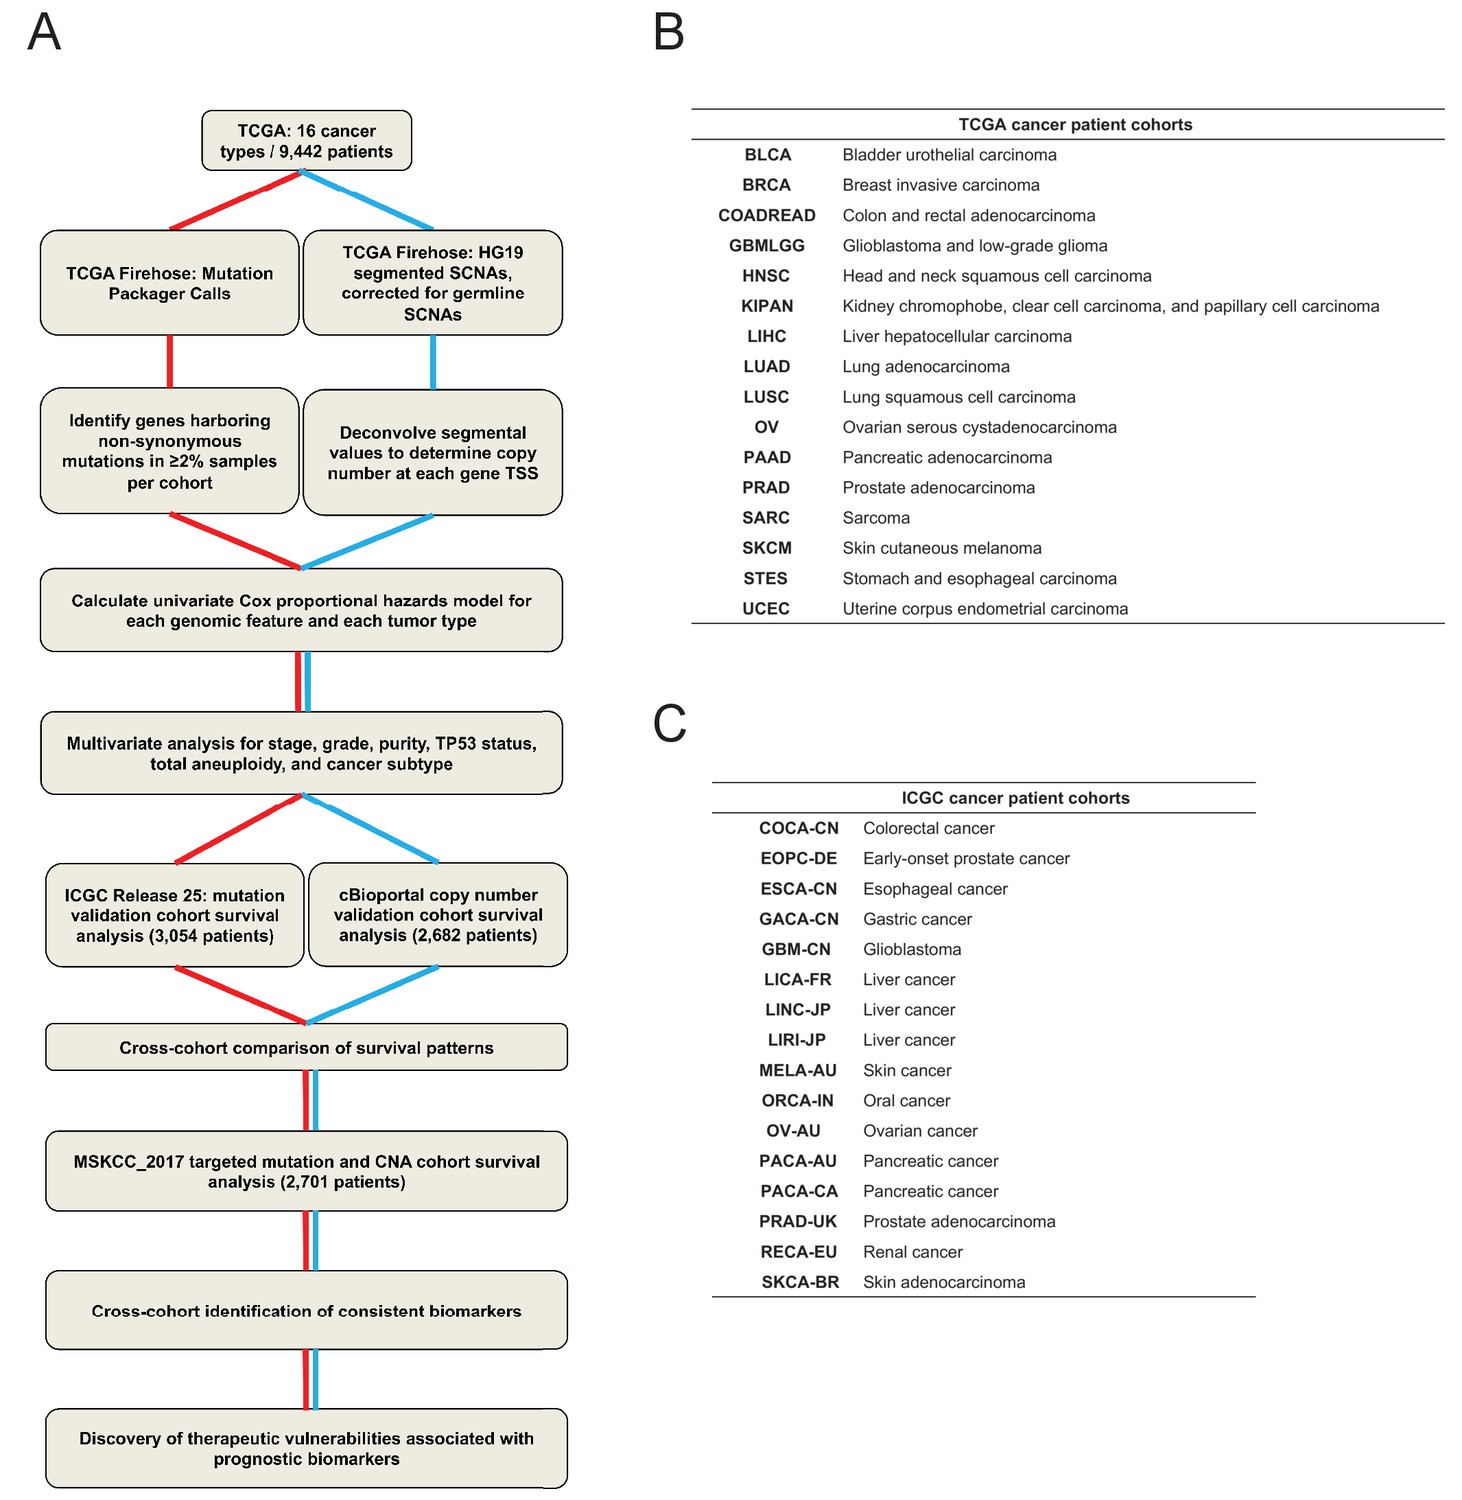
A schematic of the pan-cancer survival analysis pipeline and the datasets used.
(A) An outline of the data processing and analysis performed in this report is presented. 16 tumor types from TCGA were used as a discovery cohort. Mutation data from ICGC and copy number data from patient cohorts curated by cBioportal were used as validation cohorts. To identify high-confidence biomarkers, an additional set of patients subjected to targeted sequencing (MSKCC_2017) were included in the cross-cohort analysis. A complete list of patient cohorts and data types analyzed is included in Supplementary file 1. (B and C) The cancer types and study abbreviations used in the TCGA and ICGC datasets. More information on each cohort is included in Supplementary file 1.
Figure 1—figure supplement 2
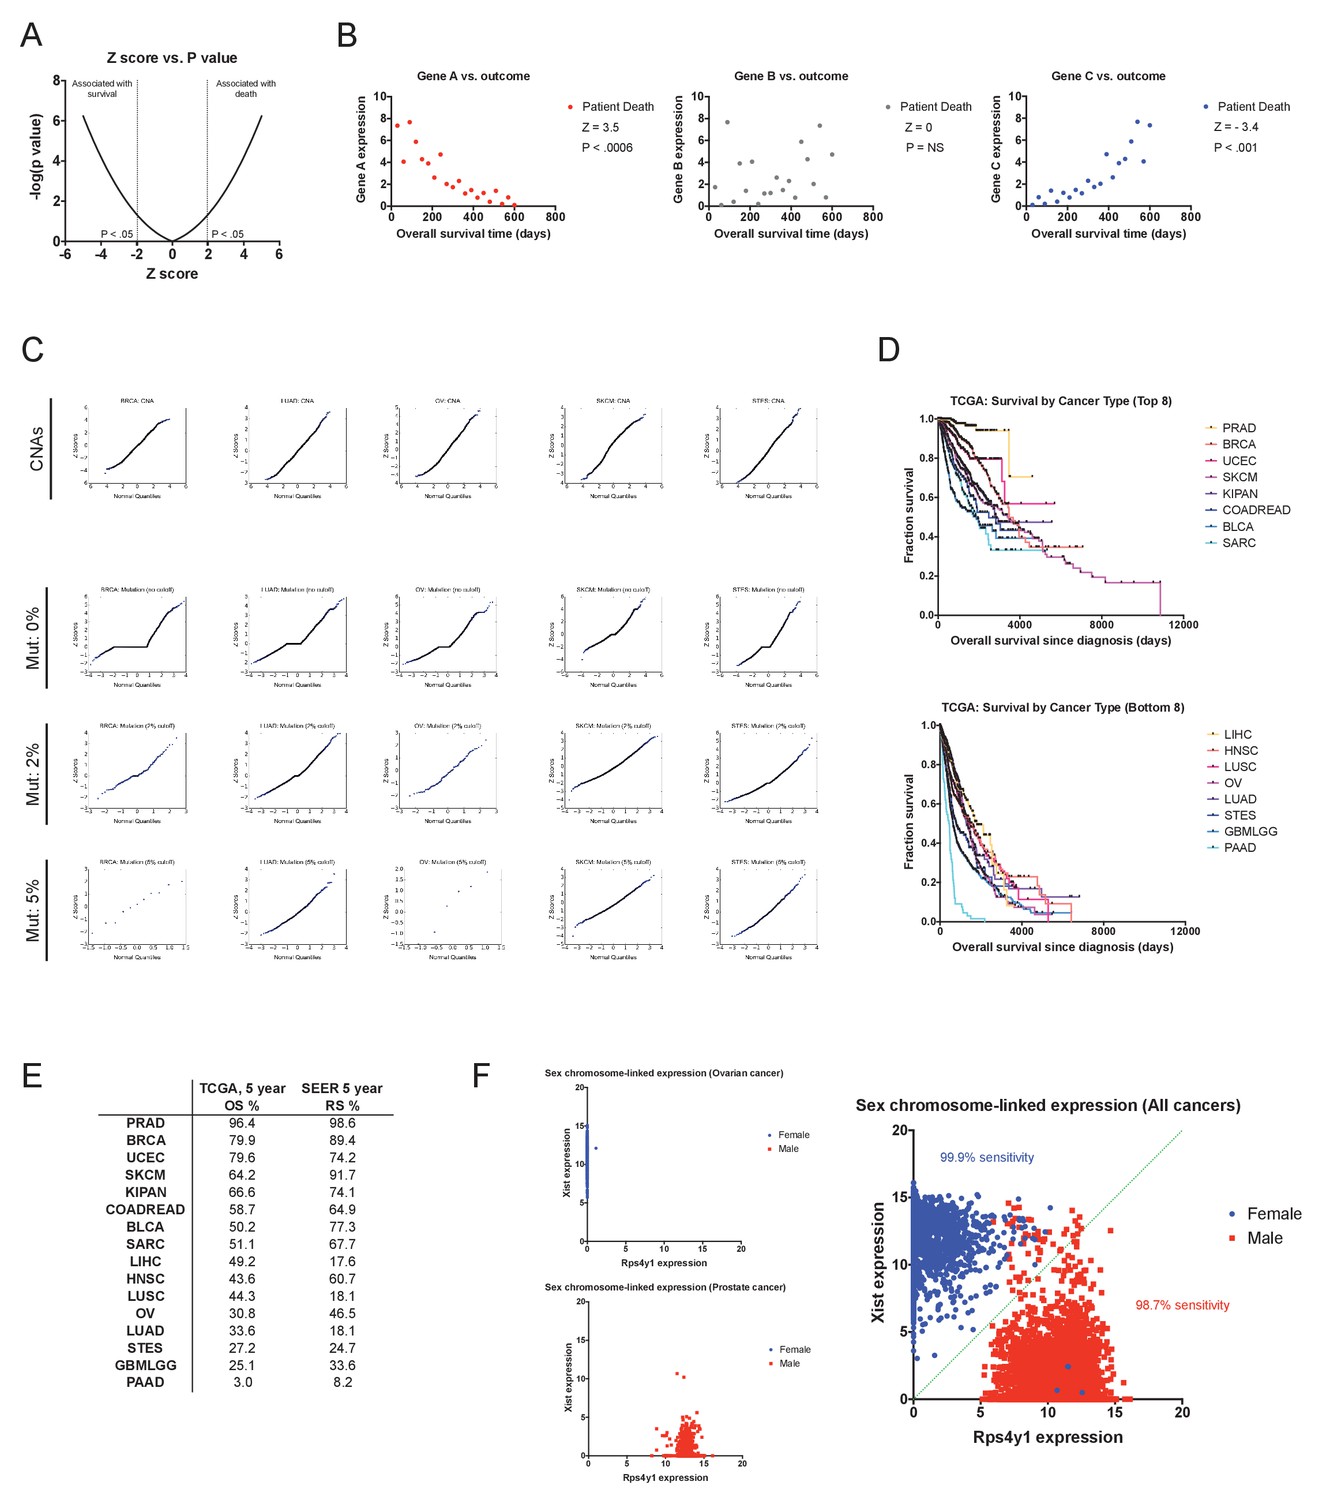
Cox proportional hazards survival analysis and the accuracy of TCGA clinical annotations.
(A) The relation between Z score and P value for −5 ≤ Z ≤ 5 is displayed. (B) Sample data for gene expression values for three hypothetical genes (A, B, and C) illustrating different Z scores. (C) Quantile-quantile plots comparing Z scores and normally-distributed sample values for CNAs and for mutations using different thresholds. Based on this analysis, only genes harboring mutations in 2% or more of the samples in a cohort were included for survival calculations (discussed in Supplemental Text 1). (D) Kaplan-Meier plots showing the survival time post-diagnosis for the eight cancers with the most favorable outcomes (top) and the eight cancer with the most dismal outcomes (bottom) in the TCGA dataset. (E) A comparison of the 5 year overall survival times from the TCGA with the 5 year relative survival times per cancer type from the Surveillance, Epidemiology, and End Results program (SEER) are displayed. (F) Scatter plots showing the expression of the X chromosome-encoded XIST transcript and the Y chromosome-encoded RPS4Y1 transcript in ovarian cancer (OV), prostate cancer (PRAD), and across all 16 tumor types are displayed. As XIST is specifically expressed in cells that contain two or more copies of the X chromosome, this two gene combination has been shown to be effective at discriminating a patient’s chromosomal sex on the basis of gene expression (Gentles et al., 2015; van den Berge and Sijen, 2017). Accordingly, in our analysis, nearly all female patients have high XIST expression and low RPS4Y1 expression, while nearly all male patients have high RPS4Y1 expression and low XIST expression.
Figure 1—figure supplement 3
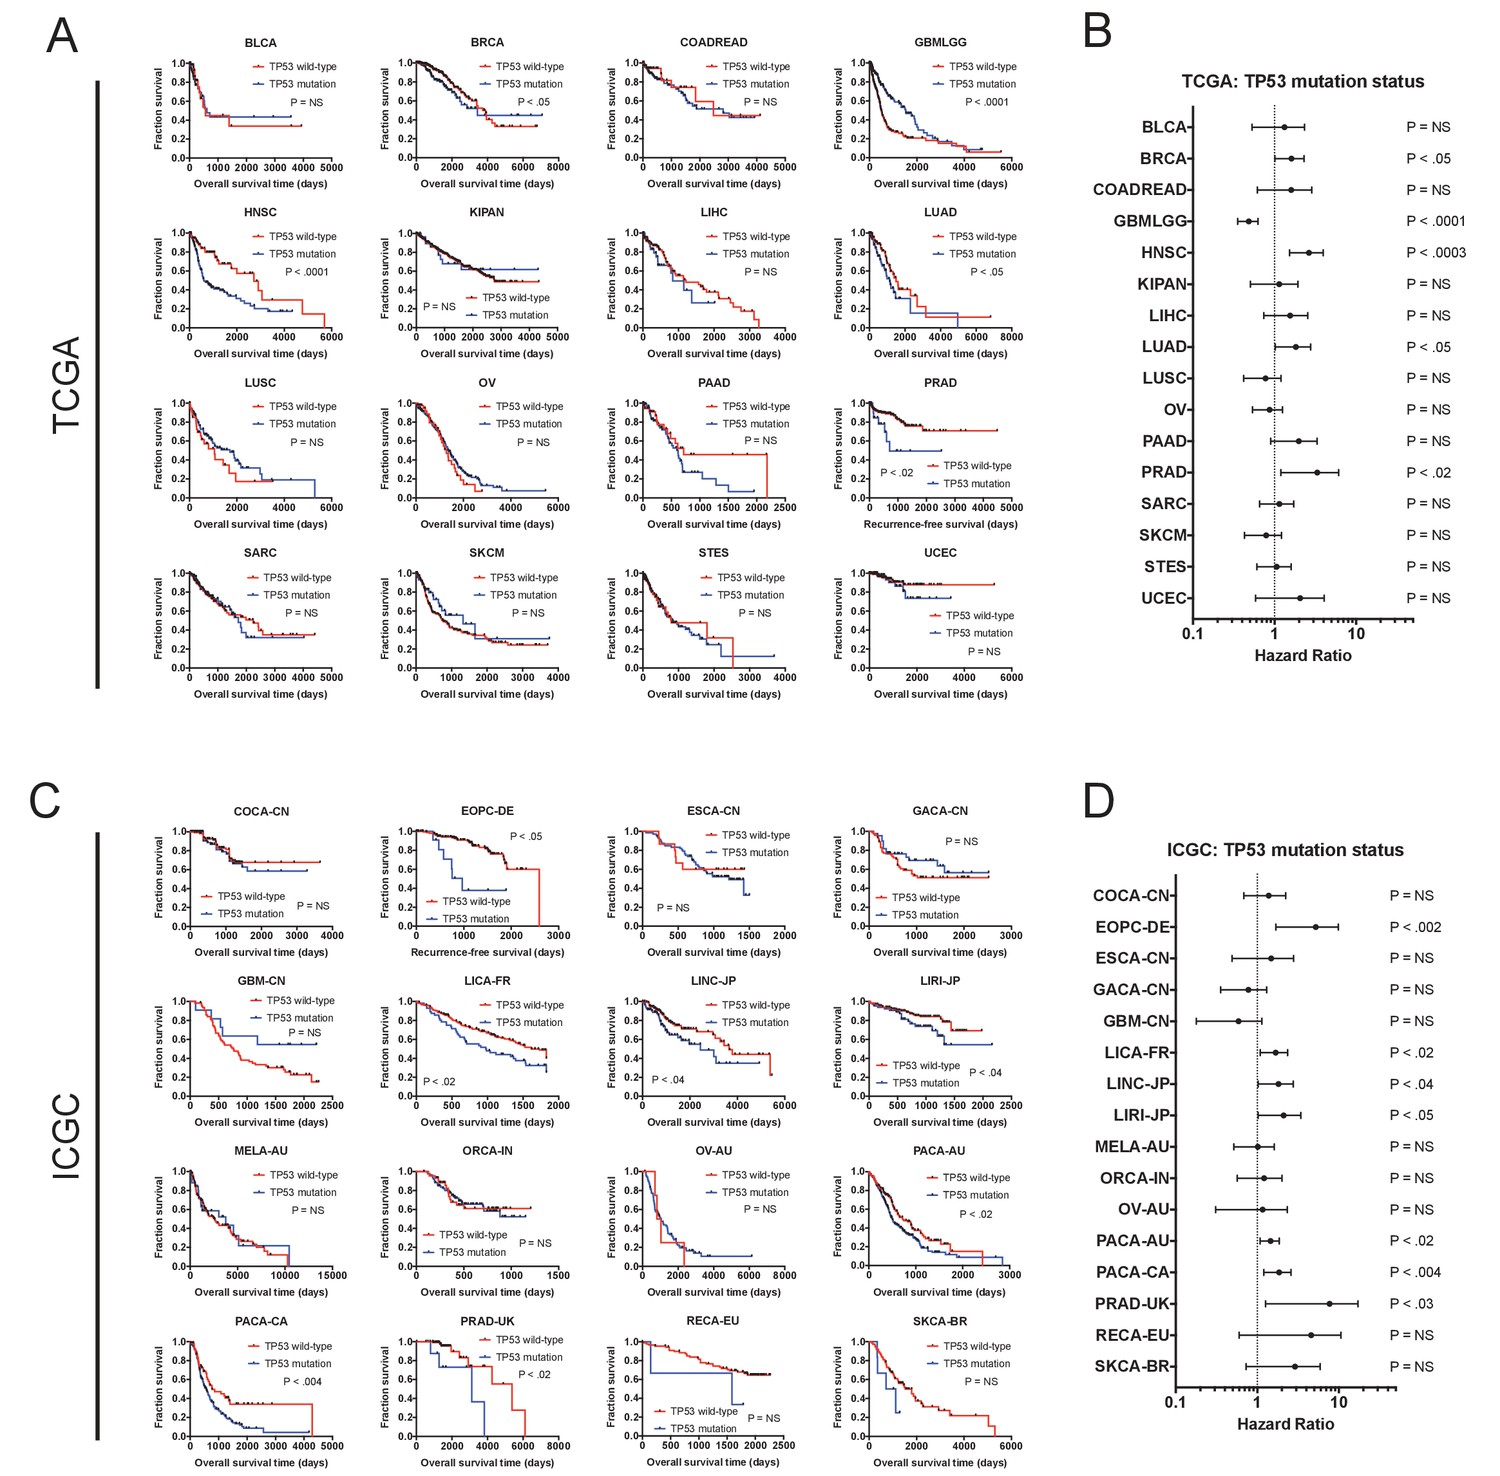
The mutation status of TP53 is associated with outcome in multiple cancer types.
(A) Kaplan-Meier plots of TP53-mutant and TP53-WT tumors in every cancer type from the TCGA dataset. TP53 is associated with outcome in five of 16 cancer types (BRCA, GBMLGG, HNSC, LUAD, and PRAD). (B) Forest plots of TP53 mutations in each TCGA cohort. Circles indicate the hazard ratio, while the bars indicate the 95% confidence internal. (C) Kaplan-Meier plots of TP53-mutant and TP53-WT tumors in every cancer type from the ICGC dataset. TP53 is associated with outcome in seven of 16 cancer types (EOPC-DE, LICA-FR, LINC-JP, LIRI-JP, PACA-AU, PACA-CA, and PRAD-UK). (D) Forest plots of TP53 mutations in each ICGC cohort. Circles indicate the hazard ratio, while the bars indicate the 95% confidence internal. Note that the p values are not identical between A and B and between C and D, as the Kaplan-Meier p values are calculated from a log-rank test, while the forest plot p values are calculated from a Cox regression.
Figure 1—figure supplement 4
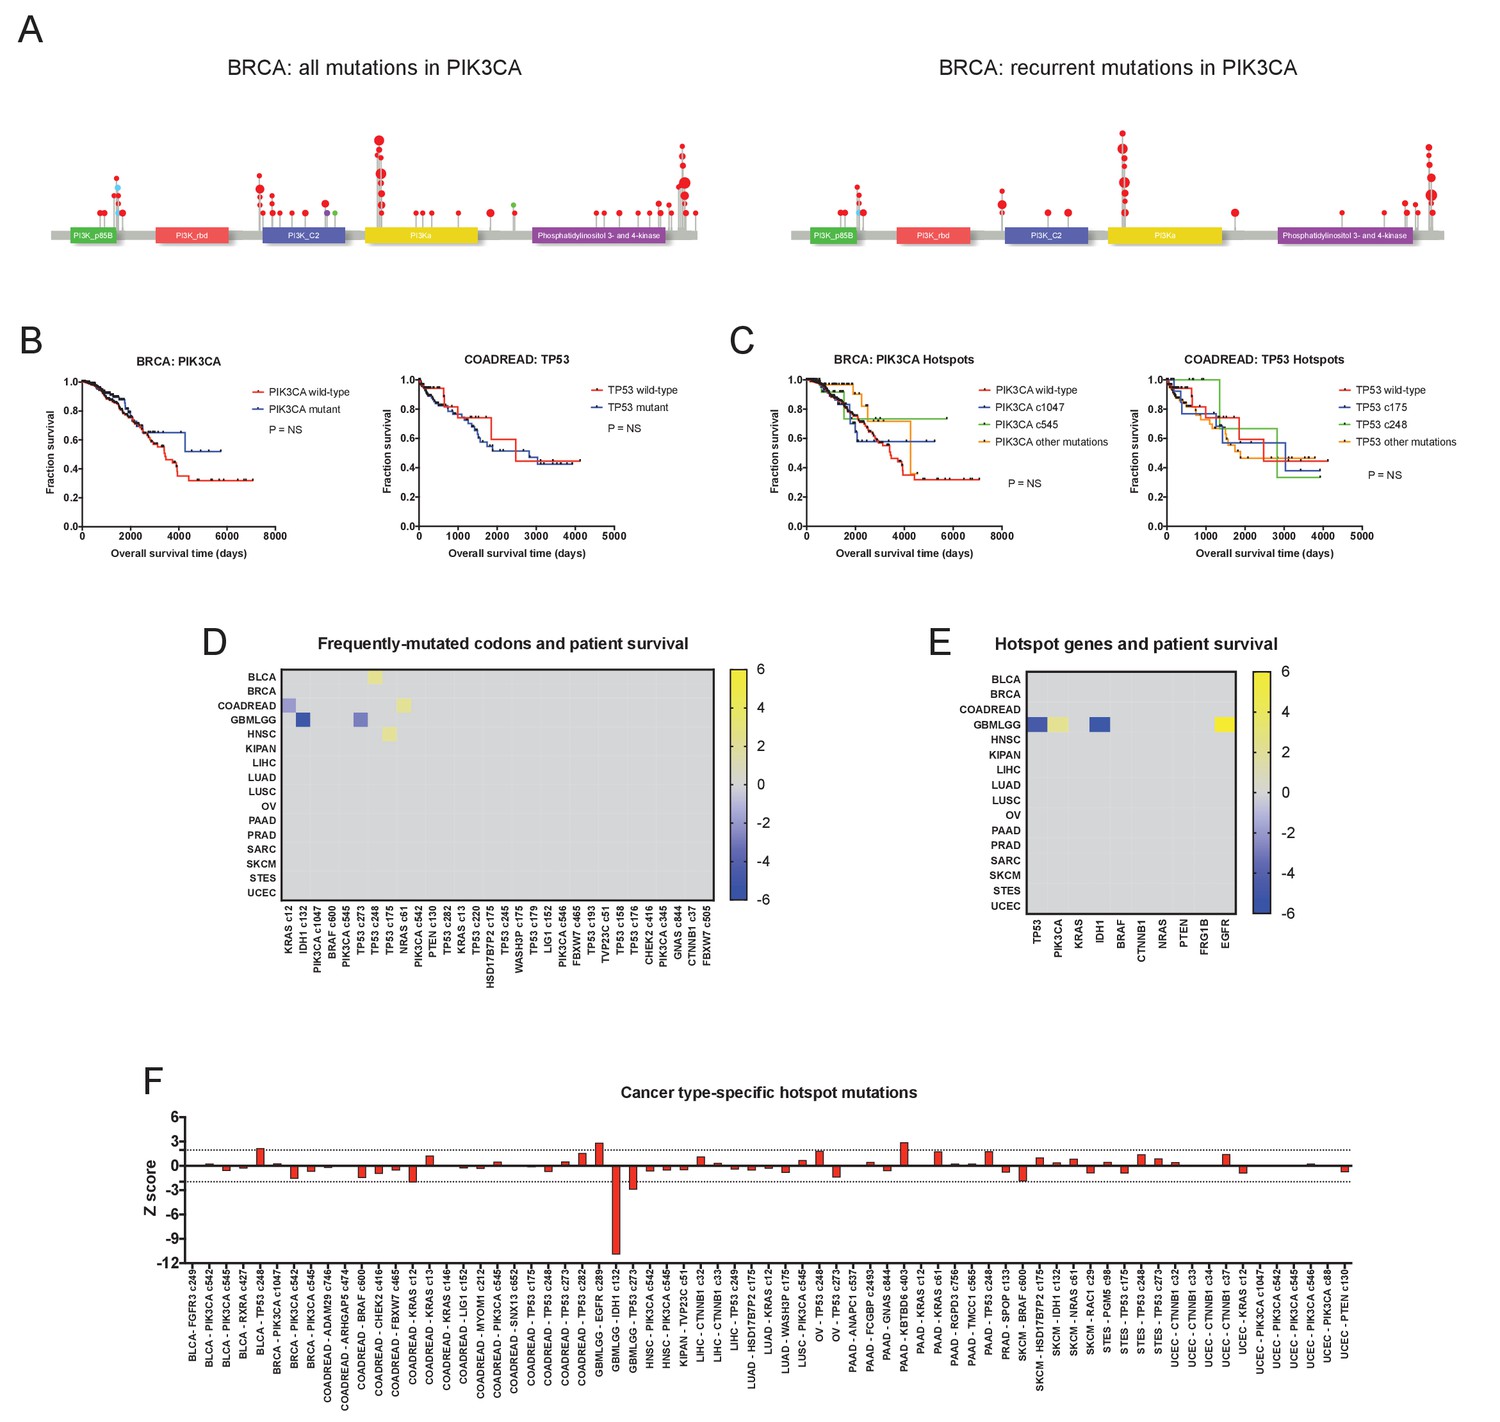
Hotspot mutations and mutations in multiple cancer driver genes are generally not associated with clinical prognosis.
(A) Lollipop plots of PIK3CA mutations in the BRCA cohort. The left plot displays all non-silent mutations in PIK3CA, while the right plot displays all mutations in ‘hotspot’ codons, for example, codons that are mutated in five or more patients in the TCGA dataset. Red dots indicate missense mutations, blue dots indicate frameshift mutations, and purple dots indicate nonsense mutations. (B) Kaplan-Meier curves comparing BRCA patients with any mutation in PIK3CA vs. those with no mutations in PIK3CA (left), and COADREAD patients with any mutations in TP53 vs. those with no mutations in TP53 (right). (C) Kaplan-Meier curves comparing BRCA patients with various ‘hotspot’ mutations in PIK3CA vs. those with no ‘hotspot’ mutations in PIK3CA (left), and COADREAD patients with ‘hotspot’ mutations in TP53 vs. those with no ‘hotspot’ mutations in TP53 (right). (D) A heatmap of significant survival associations among the 30 most frequently-mutated codons across 16 tumor types from the TCGA are displayed. Z scores were calculated by regressing survival times between patients harboring a mutation in a specific codon against patients who did not harbor a mutation at that particular codon, if a codon was mutated in ≥2% of samples per tumor type. For visualization purposes, only significant Z scores are displayed. (E) All codons mutated in ≥5 patients (‘hotspot’ mutations) were pooled together, and the ten genes harboring the most ‘hotspot’ mutations were determined. Z scores were calculated comparing patients that harbor any ‘hotspot’ mutation in a specified gene and patients that do not have any ‘hotspot’ mutations in that gene. A heatmap displays significant survival associations for the ten genes with the most ‘hotspot’ mutations. (F) Codons that were mutated in ≥4% of patients in each cancer type were identified, and then Z scores were calculated comparing patients who harbored these recurrent mutations vs. those who did not.
Figure 1—figure supplement 5
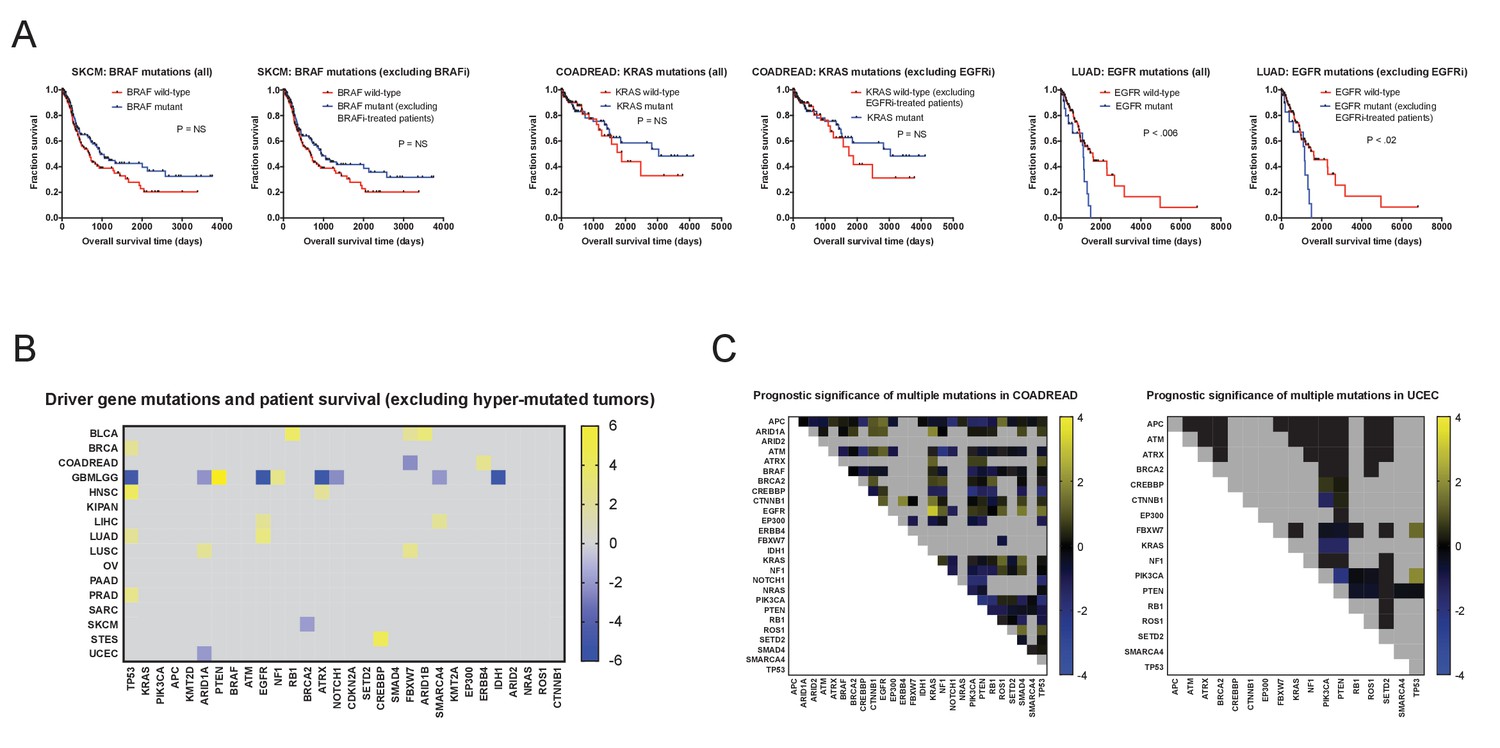
Excluding patients with hypermutated tumors or those who were treated with targeted therapies fails to reveal mutations significantly associated with outcome.
(A) Excluding patients treated with targeted therapies fails to significantly alter mutation Z scores. The most common targeted therapies in the TCGA cohort were BRAF inhibitors (used to treat BRAF-mutant melanomas) and EGFR inhibitors (used to treat EGFR-mutant lung cancers or KRAS-wild-type colorectal cancers). However, due to the time-frame of sample collection, which allowed >10 year of patient follow-up, only a small subset of patients are recorded as receiving these therapies. Excluding all patients who received these therapies did not significantly affect the resultant survival curves. (B) A heatmap of significant associations between mutations and patient outcome in the TCGA when hyper-mutated tumors (Bailey et al., 2018) are excluded. For visualization purposes, only significant Z scores are displayed. The complete list of Z scores is presented in Supplementary file 2C. (C) Heatmaps of double-mutation combinations in COADREAD and UCEC are plotted. Among 30 frequently-mutated cancer driver genes, 26 are mutated in ≥2% of COADREAD patients and are not individually correlated with prognosis, while 17 are mutated in ≥2% of UCEC patients and not individually correlated with prognosis. Z scores were calculated by comparing survival times of patients harboring a non-silent mutation in two different cancer driver genes vs. patients that did not harbor a non-silent mutation in those two genes. The blue and yellow color bars indicate Z scores.
Figure 1—figure supplement 6
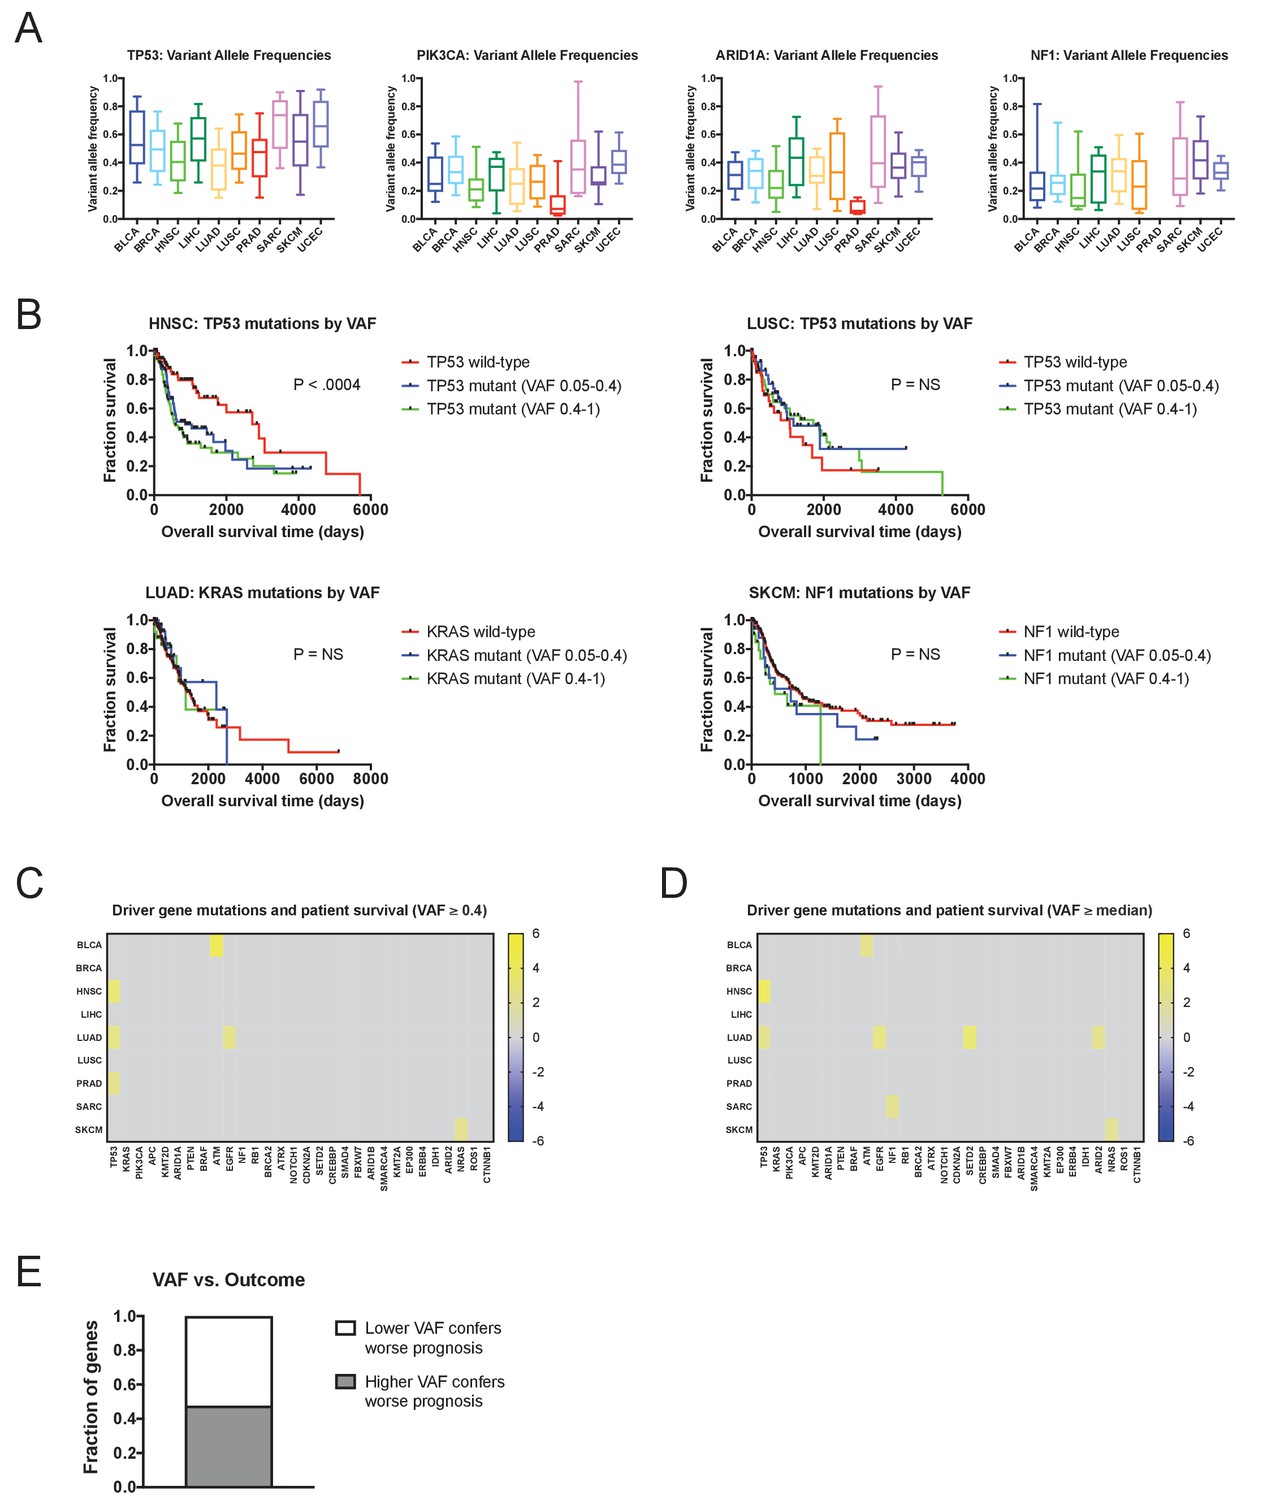
Mutations with high variant allele frequencies are no more prognostic than mutations with low variant allele frequencies.
(A) The variant allele frequencies were calculated for all genes in 10 TCGA cohorts. Box plots of the VAFs of four common cancer drivers (TP53, PIK3CA, ARID1A, and NF1) are displayed. Boxes represent the second and third VAF quartiles, while error bars indicate the 10th and 90th percentiles. (B) Kaplan-Meier curves of patient outcomes versus mutation VAF. TP53 mutations are associated with outcome in HNSC, and this relationship is true for both high-prevalence (VAF ≥0.4) and low-prevalence (VAF <0.4) mutations (top left plot). Similarly, no significant prognostic information is conferred by TP53 mutations in LUSC, KRAS mutations in LUAD, or NF1 mutations in SKCM, regardless of the prevalence of the mutation. (C) A heatmap of significant survival associations among the 30 most frequently-mutated cancer driver genes in 16 tumor types from the TCGA are displayed. Z scores were calculated by regressing survival times between patients harboring wild-type and mutant copies of a gene if a gene was mutated in ≥2% of samples per tumor type. However, a gene was only considered ‘mutated’ for this analysis if its VAF was ≥0.4. For visualization purposes, only significant Z scores are displayed. (D) A heatmap of significant survival associations among the 30 most frequently-mutated cancer driver genes in 16 tumor types from the TCGA are displayed. Z scores were calculated by regressing survival times between patients harboring wild-type and mutant copies of a gene if a gene was mutated in ≥2% of samples per tumor type. For this Z score analysis, only mutations with VAFs greater than or equal to the median VAF for a particular gene in a particular cancer type were included. For visualization purposes, only significant Z scores are displayed. (E) We compared the Z scores that resulted from regressing only above-median VAFs and the Z scores that resulted from regressing only below-median VAFs, for the 30 cancer driver genes. In 62 instances, higher Z scores resulted from only considering above-median VAFs, while in 68 instances, higher Z scores resulted from only considering below-median VAFs.
Figure 1—figure supplement 7
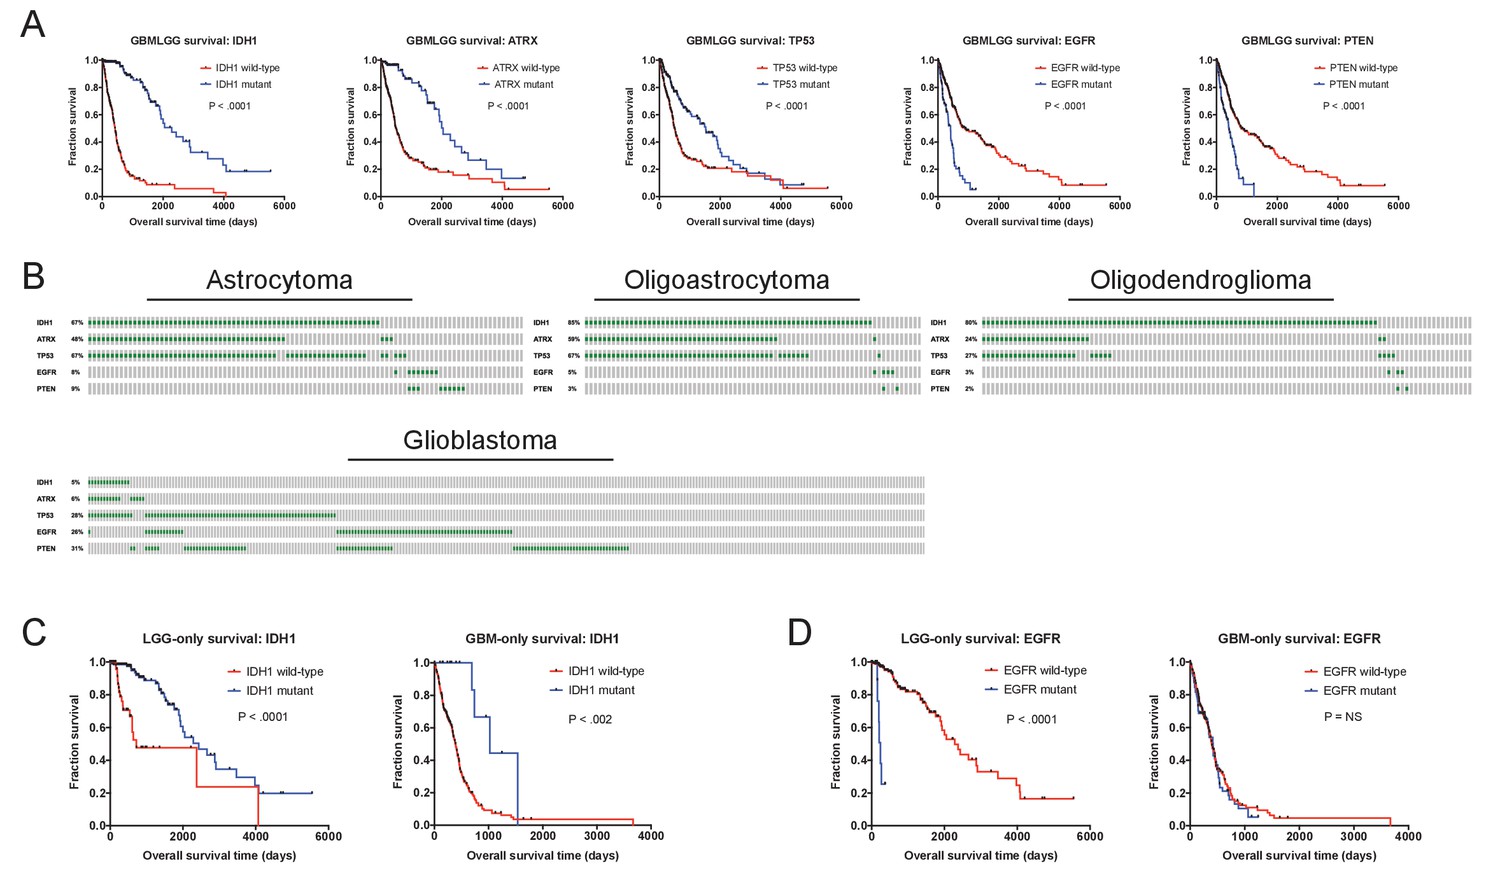
Prognostic mutations in glioma.
(A) Kaplan-Meier curves of the five genes with the strongest survival associations in GBMLGG (ATRX, EGFR, IDH1, TP53, and PTEN) are displayed. (B) Mutation patterns according to glioma subtype are displayed. Gray boxes correspond to patients with a particular glioma subtype, while green dashes indicate the presence of a mutant copy of the specified gene. (C) Kaplan-Meier curves of IDH1 mutations in either LGG or GBM cohorts, analyzed separately. IDH1 mutations are observed in both tumor cohorts and are associated with survival in both tumor cohorts. (D) Kaplan-Meier curves of EGFR mutations in either LGG or GBM cohorts, analyzed separately. EGFR mutations are observed in both tumor cohorts but are prognostic only in low-grade gliomas. The complete list of Z scores is presented in Supplementary file 2D.
Figure 2 with 4 supplements
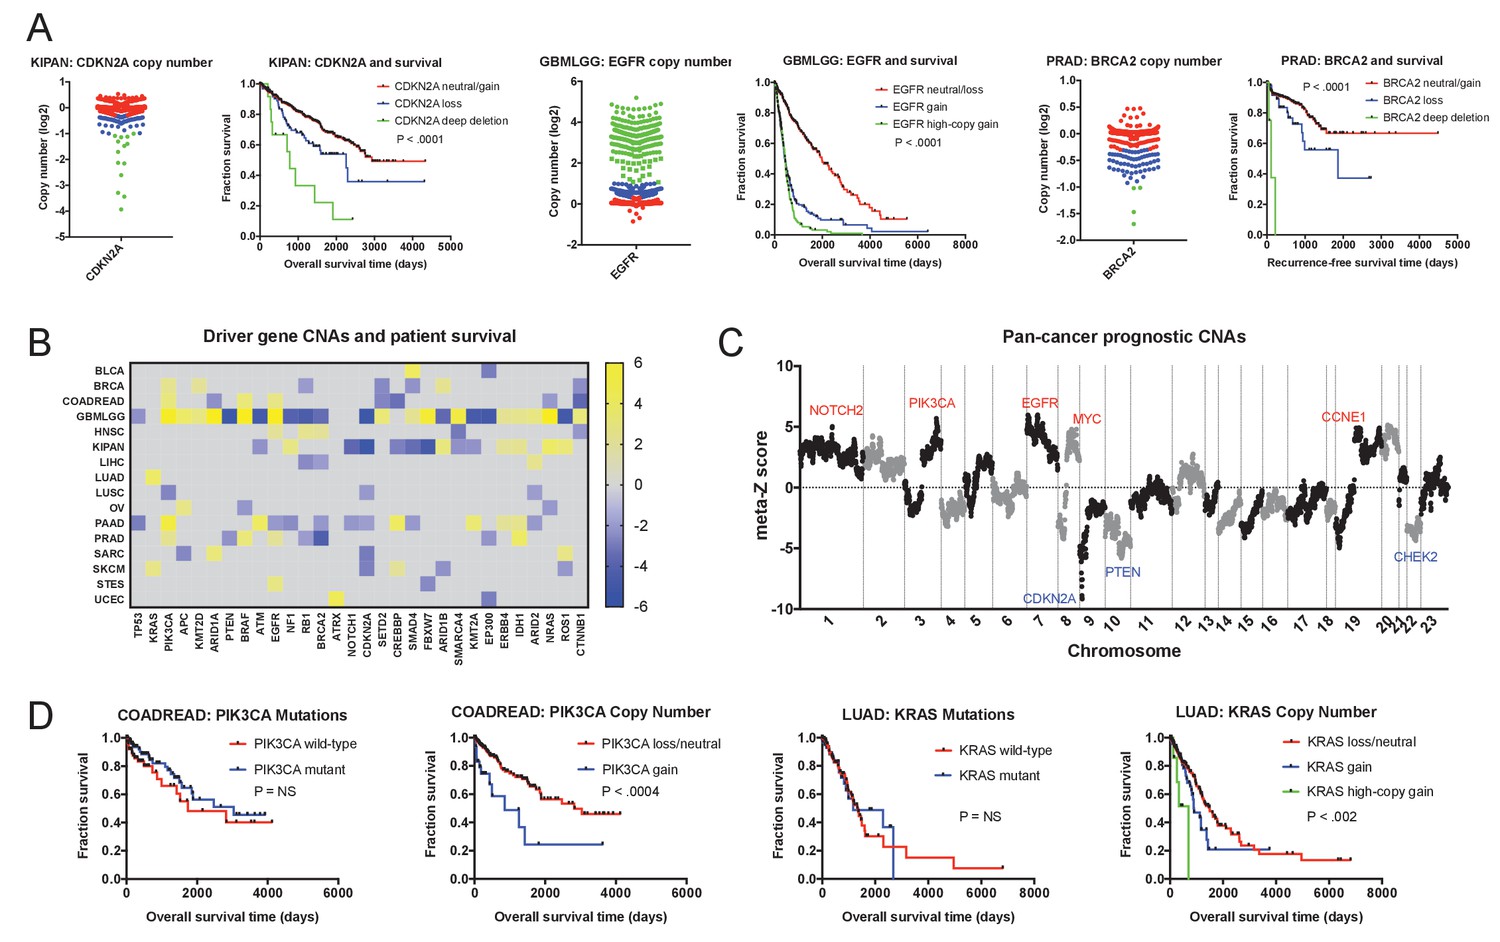
Oncogene and tumor suppressor CNAs drive cancer patient mortality.
(A) Examples of driver gene CNAs associated with patient outcome. The copy number of CDKN2A, EGFR, and BRCA2 in the indicated patient cohorts are displayed, as well as Kaplan-Meier curves of patient survival according to gene copy number. Amplifications and deletions correspond to CNAs > |0.3|, while deep-deletions and high-copy gains correspond to CNAs > |1|. (B) A heatmap of significant survival associations among the 30 most frequently-mutated cancer driver genes in 16 tumor types from the TCGA are displayed. Z scores were calculated by regressing gene copy number against patient outcome within each tumor type. The complete list of Z scores is presented in Supplementary file 3A. (C) Z scores from 16 cancer types from the TCGA were combined using Stouffer’s method, and then the resulting meta-Z scores were plotted against the chromosomal location. Genes were binned by average Z score into groups of 5 for visualization. Gene names indicate candidate driver genes found within survival-associated peaks and valleys. (D) Kaplan-Meier curves are plotted for two oncogenes, PIK3CA (left) and KRAS (right), comparing the prognostic relevance of mutations in those genes versus copy number alterations in these genes. Amplifications correspond to CNAs > 0.3, while high-copy gains correspond to CNAs > 1.
Figure 2—figure supplement 1
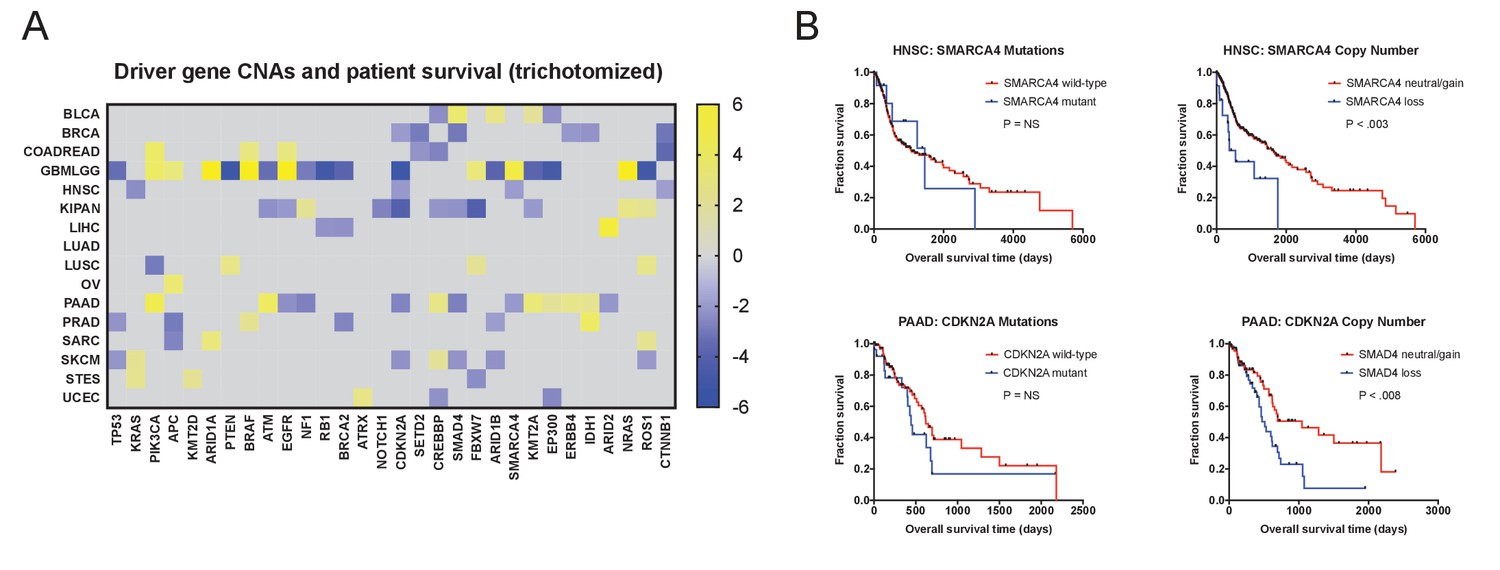
Discretized copy number values still hold significant prognostic power.
(A) A heatmap of significant survival associations among the 30 most frequently-mutated cancer driver genes in 16 tumor types from the TCGA are displayed. Z scores were calculated by regressing gene copy number, trichotomized into ‘deletions’ (<−0.3), ‘amplifications’ (>0.3), and ‘copy-neutral’ (≥−0.3 and ≤0.3), against patient outcome within each tumor type. (B) Kaplan-Meier curves are plotted for two tumor suppressors, SMARCA4 (top) and CDKN2A. (bottom), comparing the prognostic relevance of mutations in those genes versus copy number alterations in these genes. Deletions correspond to CNAs < −0.3.
Figure 2—figure supplement 2
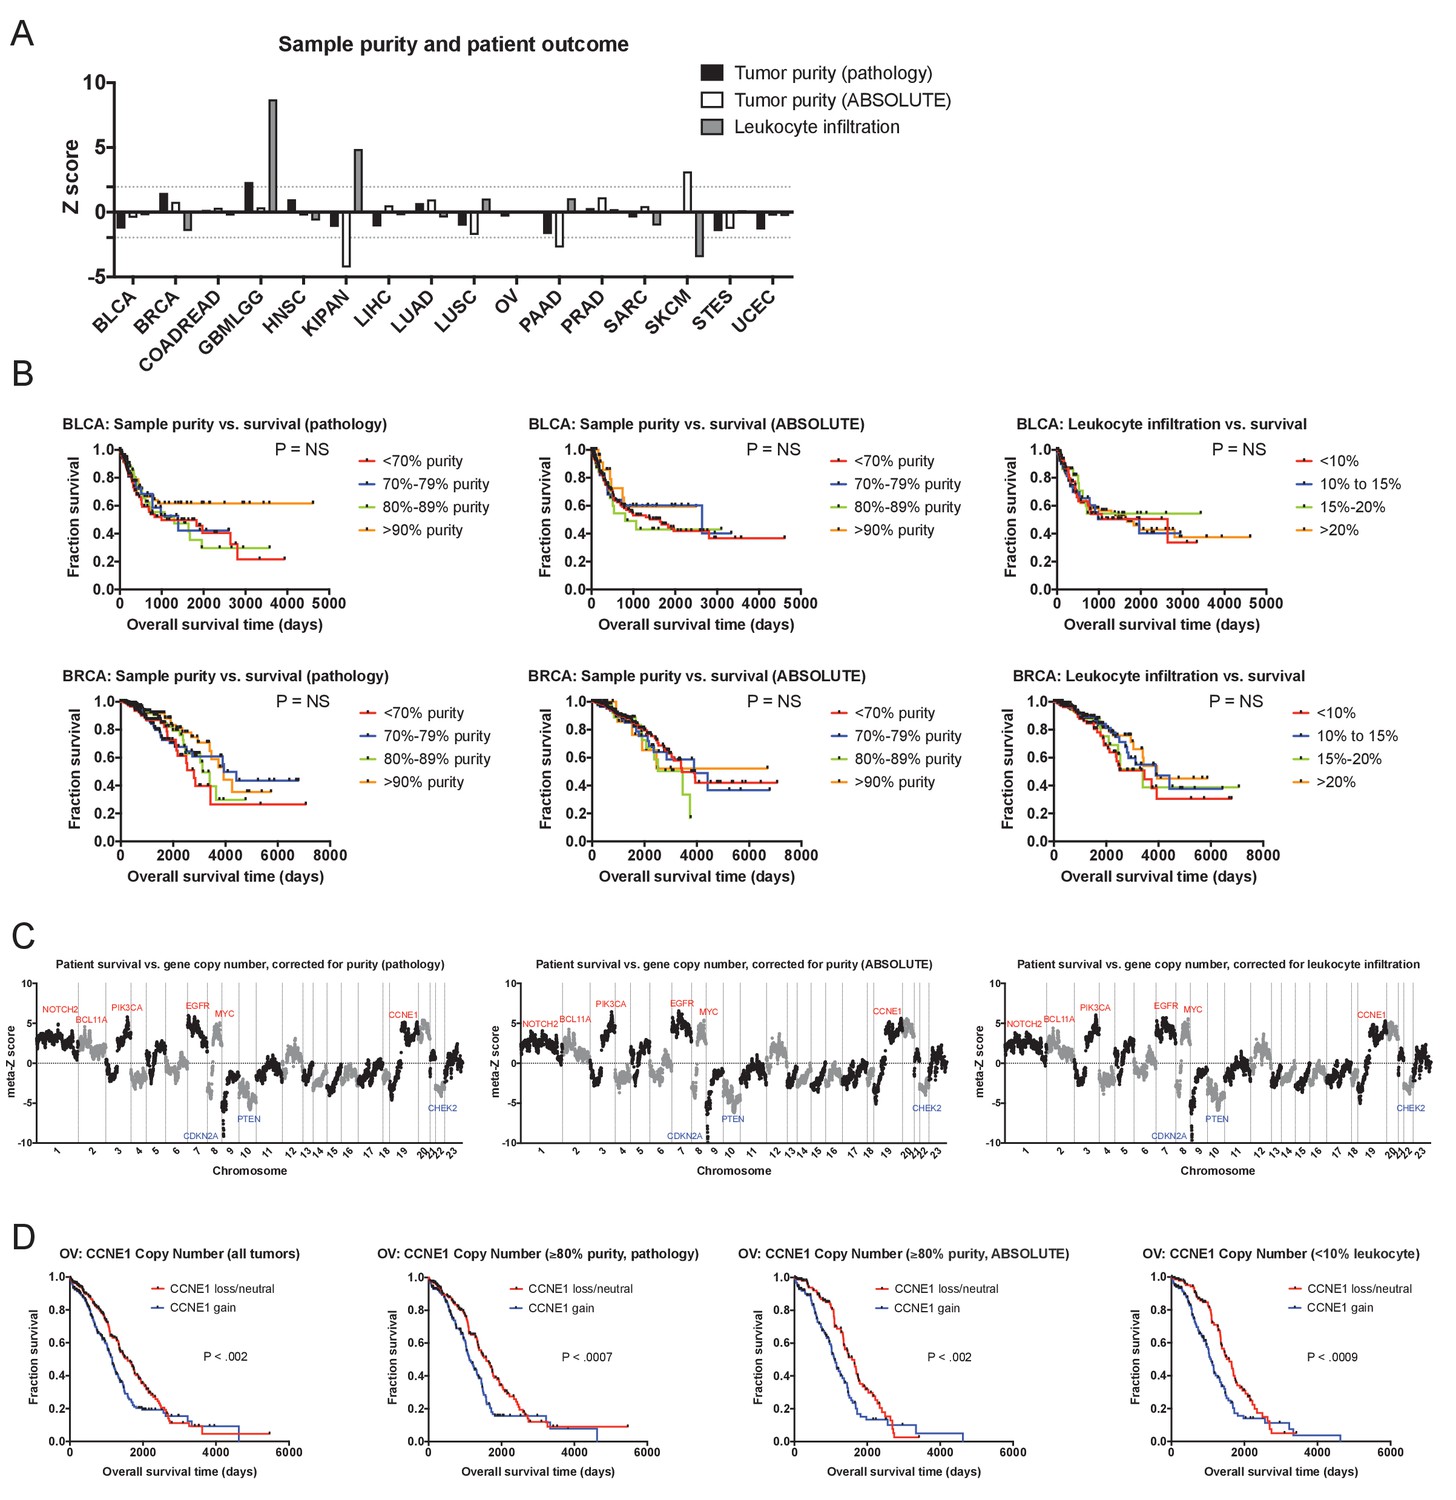
The prognostic value of cancer CNAs is independent of tumor sample purity.
(A) A bar graph showing Z scores obtained by regressing sample purity, as measured by IHC, against patient survival. Dotted lines indicate Z scores of 1.96 and −1.96, corresponding to a P value < 0.05. (B) Representative Kaplan-Meier plots of patient survival in BRCA and UCEC, split based on the purity of the analyzed sample. (C) Z scores from multivariate models including copy number and tumor purity from the 16 cancer types from the TCGA were combined using Stouffer’s method, and then the resulting meta-Z scores were plotted against the chromosomal location. Genes were binned by average Z score into groups of 5 for visualization. (D) CNAs remain prognostic even in pure tumor samples. The survival of OV patients according to CCNE1 copy number is plotted, using data from either all patients (left) or only patients with tumor samples with ≥85% purity. The complete list of Z scores is presented in Supplementary file 3C-E.
Figure 2—figure supplement 3

CNAs remain prognostic after correcting for tumor stage and grade.
(A) Z scores were calculated for multivariate Cox proportional hazards models including both gene copy number and tumor stage or grade. Density plots display the correlation between Z scores generated from univariate models and these bivariate models. Complete Z scores are listed in Supplementary file 4. (B) The fraction of features identified in univariate models that remain significant in the stage-adjusted and grade-adjust models are displayed. Note that grade information was available for only eight TCGA cohorts. (C) Kaplan-Meier plots demonstrating the stage-independent prognostic impact of ACTL9 deletions in HNSC. (D) Kaplan-Meier plots demonstrating the stage-independent prognostic impact of ZNF546 amplifications in OV. Amplifications and deletions correspond to CNAs > |0.3|. (E) Kaplan-Meier plots demonstrating the stage-dependent prognostic impact of TP53 mutations in HNSC and PRAD. TP53 mutations are associated with outcome only in late-stage HNSC and early-stage PRAD.
Figure 2—figure supplement 4
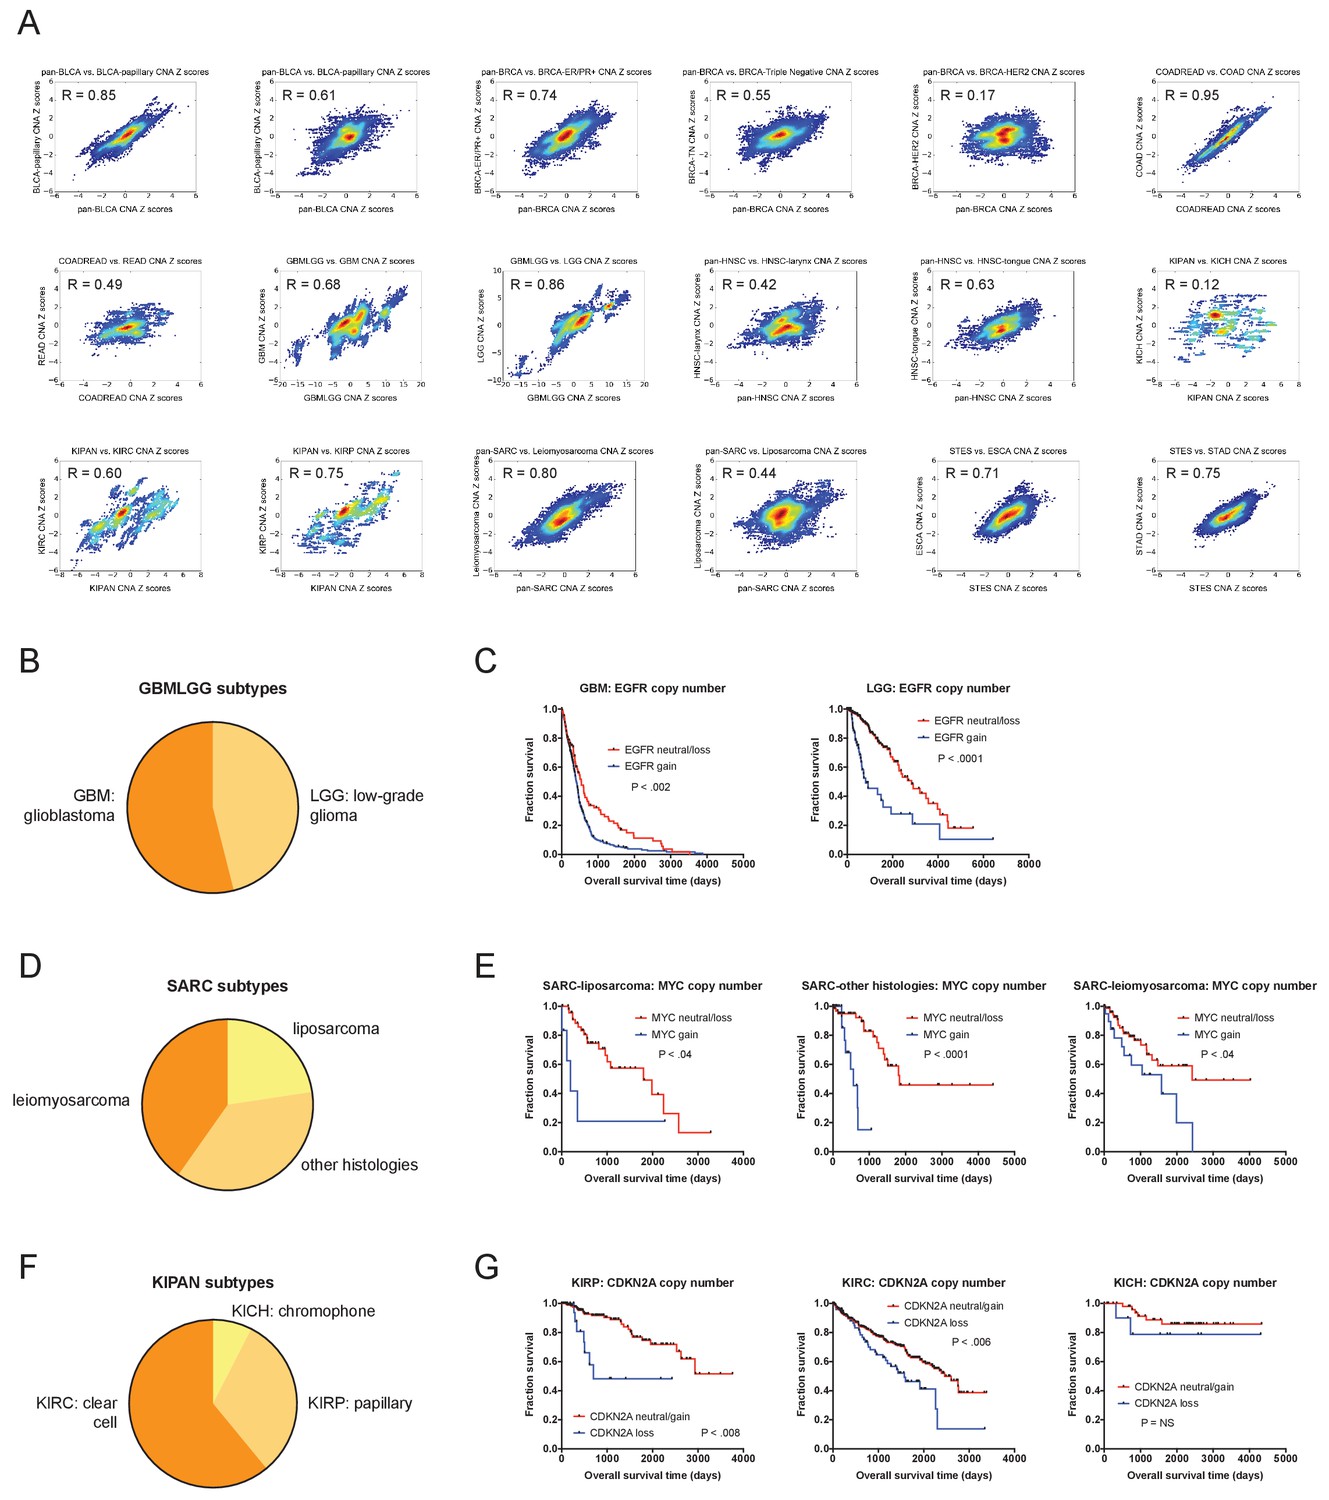
CNAs remain prognostic after correcting for tumor subtype.
(A) The prognostic value of gene-level CNAs within 18 different cancer subtypes present within the TCGA were analyzed. Density plots display the correlations between Z scores obtained from univariate analysis analyzing the parental tumor cohort and univariate analysis of the indicated tumor subtype. Complete results are listed in Supplementary file 4G. (B) The percentages of GBM and LGG tumors within the GBMLGG cohort are displayed. (C) Kaplan-Meier curves of EGFR amplifications in the GBM and LGG cohorts are displayed. (D) The percentages of de-differentiated liposarcomas, leiomyosarcomas, and sarcomas with other histologies within the SARC cohort are displayed. (E) Kaplan-Meier curves of MYC amplifications in the liposarcoma, leiomyosarcoma, and sarcomas with other histologies cohorts are displayed. (F) The percentages of clear cell carcinomas, papillary carcinomas, and chromophobe carcinomas within the KIPAN cohort are displayed. (G) Kaplan-Meier curves of CDKN2A deletions in the clear cell, papillary, and chromophobe cohorts are displayed. Amplifications and deletions correspond to CNAs > |0.3|.
Figure 3 with 3 supplements
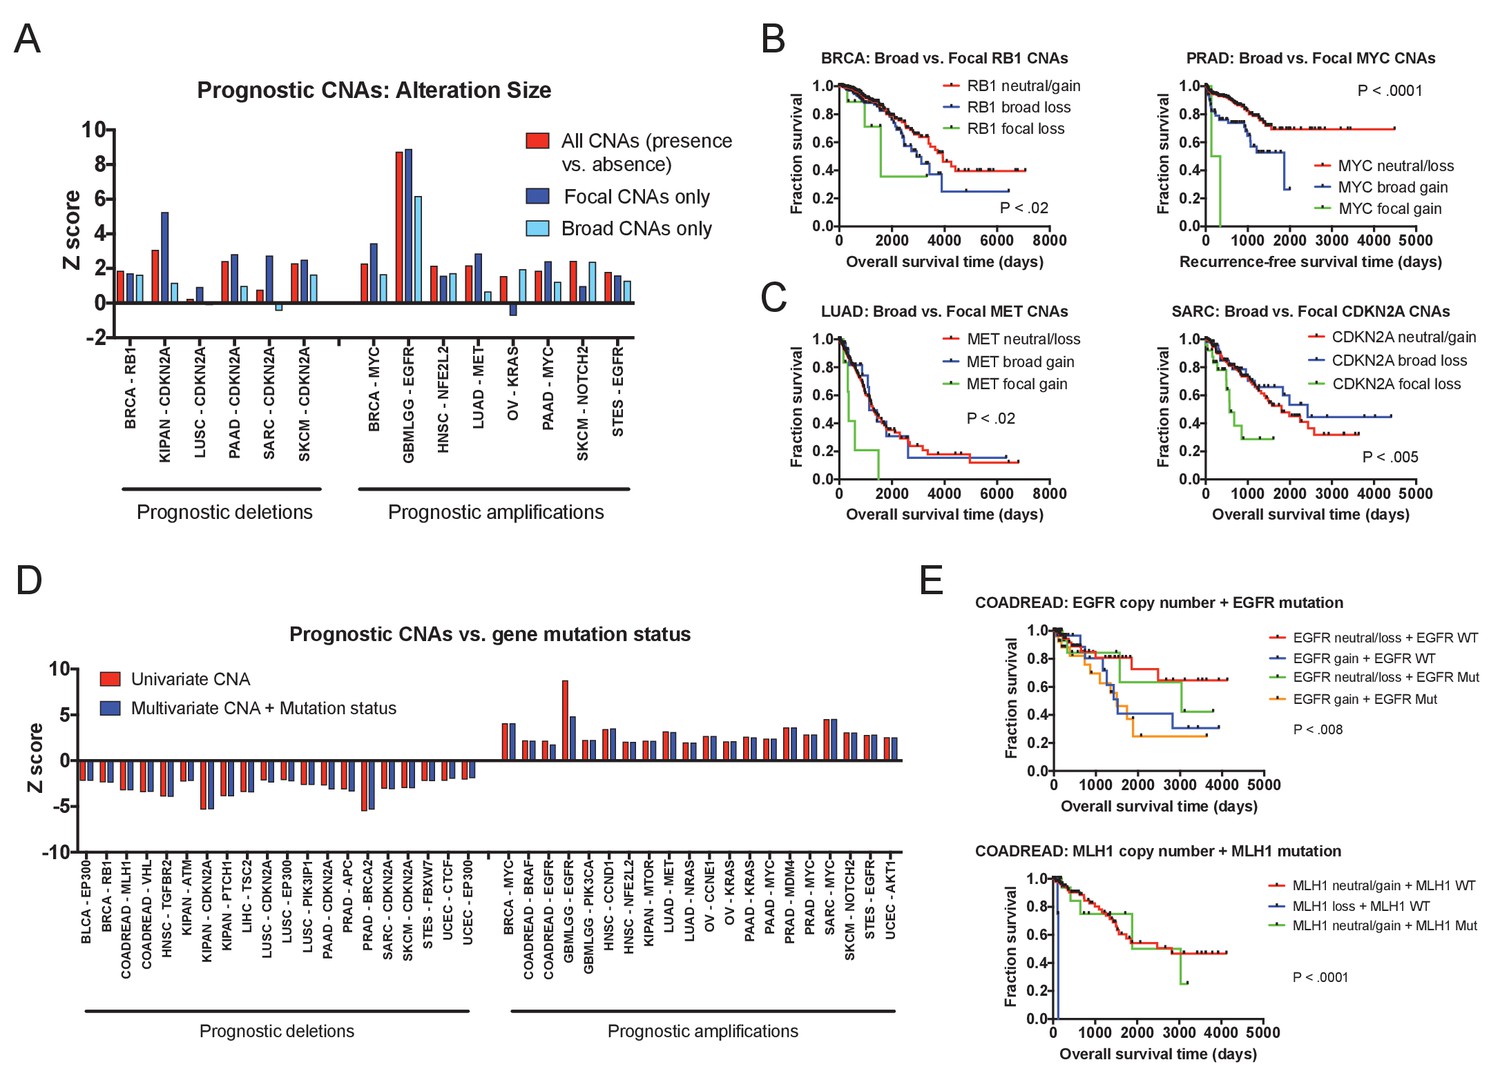
Effects of amplicon size and gene mutation status on prognostic CNAs.
(A) 20 prognostic amplifications and 20 prognostic deletions were selected for further analysis (see also Figure 3—figure supplement 2). Of those 40, 14 had at least five patients who had focal CNAs (≤3 Mb) and at least five patients who had broad CNAs (>3 Mb). Univariate Cox proportional hazards models were constructed comparing the presence or absence of any CNA at the indicated locus, or comparing the presence or absence of a CNA of a particular size. (B and C) Kaplan-Meier curves are plotted at four prognostic loci comparing tumors with focal CNAs (≤3 Mb), tumors with broad CNAs (>3 Mb), and tumors that lack CNAs at that locus. Amplifications and deletions correspond to CNAs > |0.3|. (D) Multivariate Cox proportional hazards models were constructed including both the copy number of the indicated gene as well as the mutational status of that gene. Z scores for either the univariate models (CNAs alone) or the multivariate models (CNAs + mutation status) are displayed. (E) Kaplan-Meier curves comparing gene mutation status and gene copy number for EGFR and MLH1 alterations in colorectal cancer. EGFR amplification and MLH1 deletion are associated with poor prognosis, regardless of whether the tumor harbors an EGFR or MLH1 mutation. In the bottom graph, note that no tumors harbored both MLH1 deletions and mutations.
Figure 3—figure supplement 1
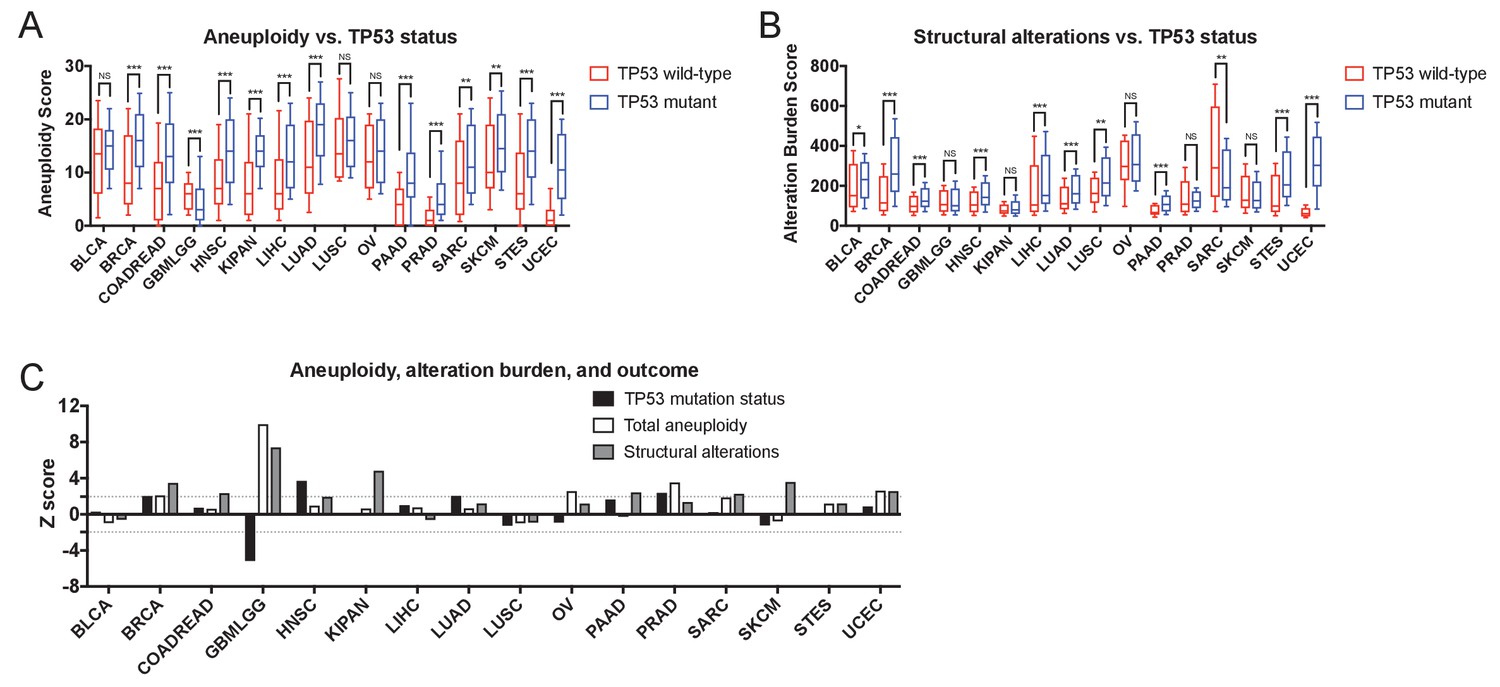
Gene-level CNAs, TP53 status, total tumor aneuploidy, and total alteration burden.
(A) The total number of arm-length aneuploidies per sample is plotted for TP53-wildtype and TP53-mutant tumors from each TCGA cohort. Boxes represent the second and third quartiles, while error bars indicate the 10th and 90th percentiles. *, p < 0.05; **, p < 0.005; ***, p < 0.0005 (Mann-Whitney U test). (B) The total structural alteration burden in each sample is plotted for TP53-wildtype and TP53-mutant tumors from each TCGA cohort. Boxes represent the second and third quartiles, while error bars indicate the 10th and 90th percentiles. *, p < 0.05; **, p < 0.005; ***, p < 0.0005 (Mann-Whitney U test). (C) Z scores from univariate Cox proportional hazards models are plotted for total tumor aneuploidy, total alteration burden, and TP53 mutation status.
Figure 3—figure supplement 2
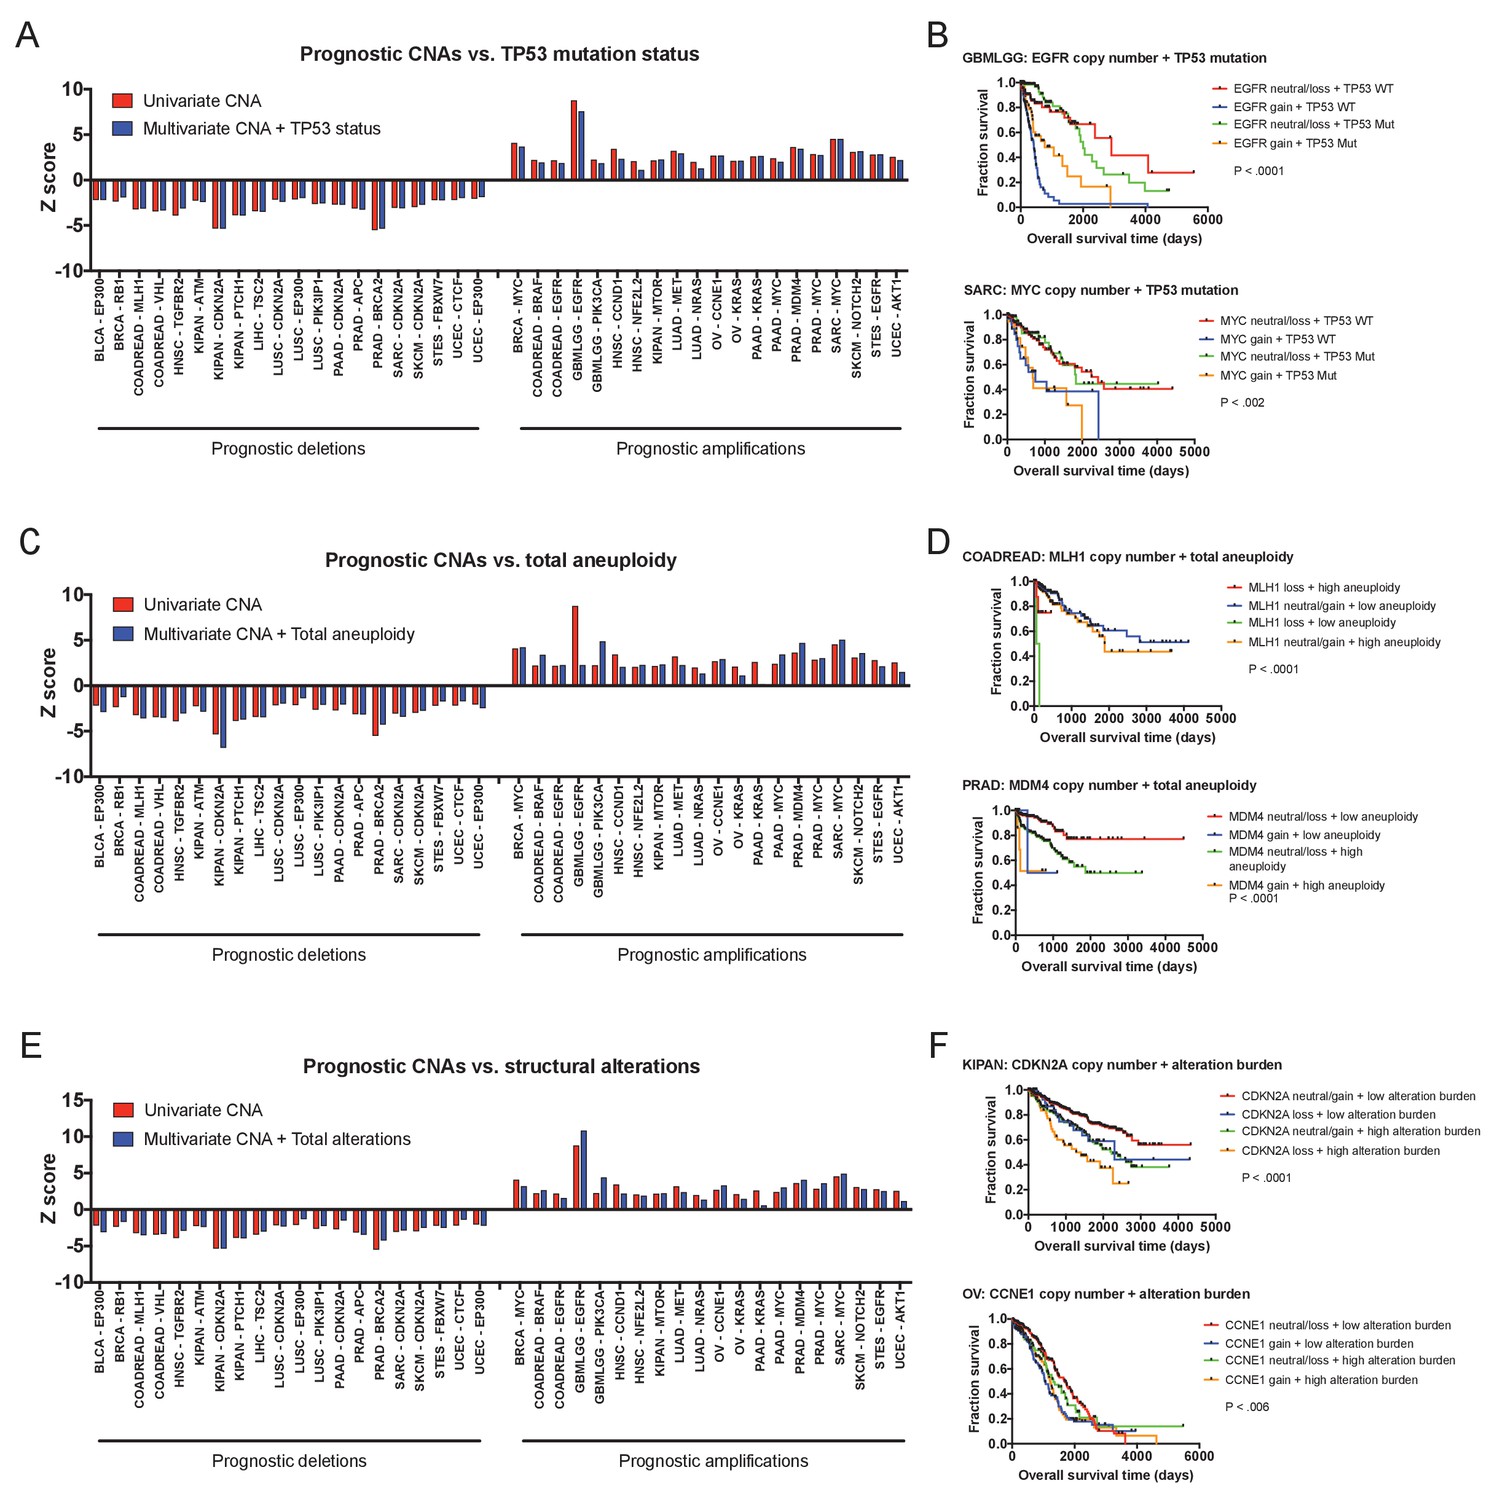
Multivariate analysis of prognostic CNAs.
(A) 20 prognostic deletions and 20 prognostic amplifications were selected for further study. Multivariate Cox proportional hazards models were constructed including both the copy number of the indicated gene as well as the mutational status of TP53. Z scores for either the univariate models (CNAs alone) or the multivariate models (CNAs + TP53 status) are displayed. (B) Kaplan-Meier curves comparing copy number and TP53 status of the indicated genes. Amplifications in Kaplan-Meier plots correspond to CNAs > 0.3. (C) Multivariate Cox proportional hazards models were constructed including both the copy number of the indicated gene as well as the total tumor aneuploidy. Z scores for either the univariate models (CNAs alone) or the multivariate models (CNAs + total aneuploidy) are displayed. (D) Kaplan-Meier curves comparing gene copy number and total tumor aneuploidy. ‘Low’ and ‘high’ aneuploidy samples were determined based on the average level of aneuploidy in each cohort. Amplifications and deletions correspond to CNAs > |0.3|. (E) Multivariate Cox proportional hazards models were constructed including both the copy number of the indicated gene as well as the total structural alteration burden. Z scores for either the univariate models (CNAs alone) or the multivariate models (CNAs + total alteration burden) are displayed. (F) Kaplan-Meier curves comparing gene copy number and alteration burden. ‘Low’ and ‘high’ alteration burden was determined based on the average number of structural alterations in each cohort. Amplifications and deletions correspond to CNAs > |0.3|.
Figure 3—figure supplement 3
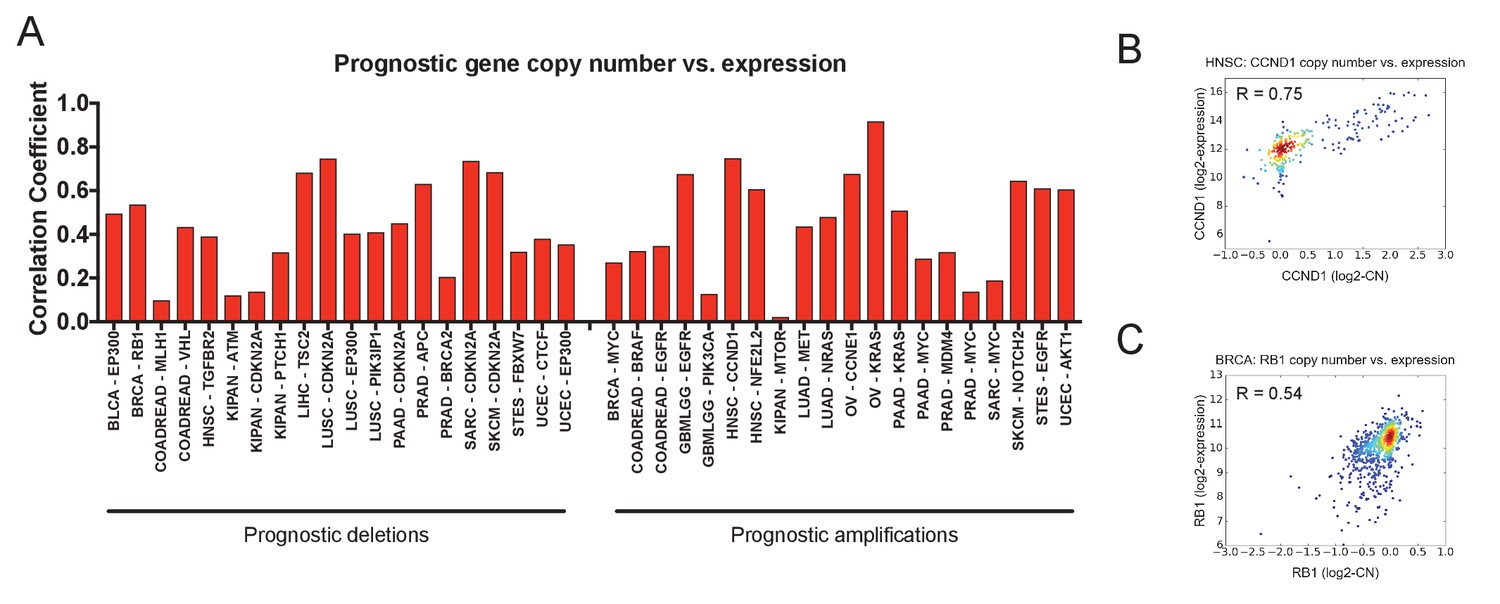
Prognostic CNAs alter the expression of the gene that they encompass.
(A) The Pearson correlation coefficients between gene copy number and gene expression at 40 prognostic loci are displayed. (B) A scatter plot showing the correspondence between CCND1 copy number and expression in the HNSC cohort. (C) A scatter plot showing the correspondence between RB1 copy number and expression in the BRCA cohort.
Figure 4
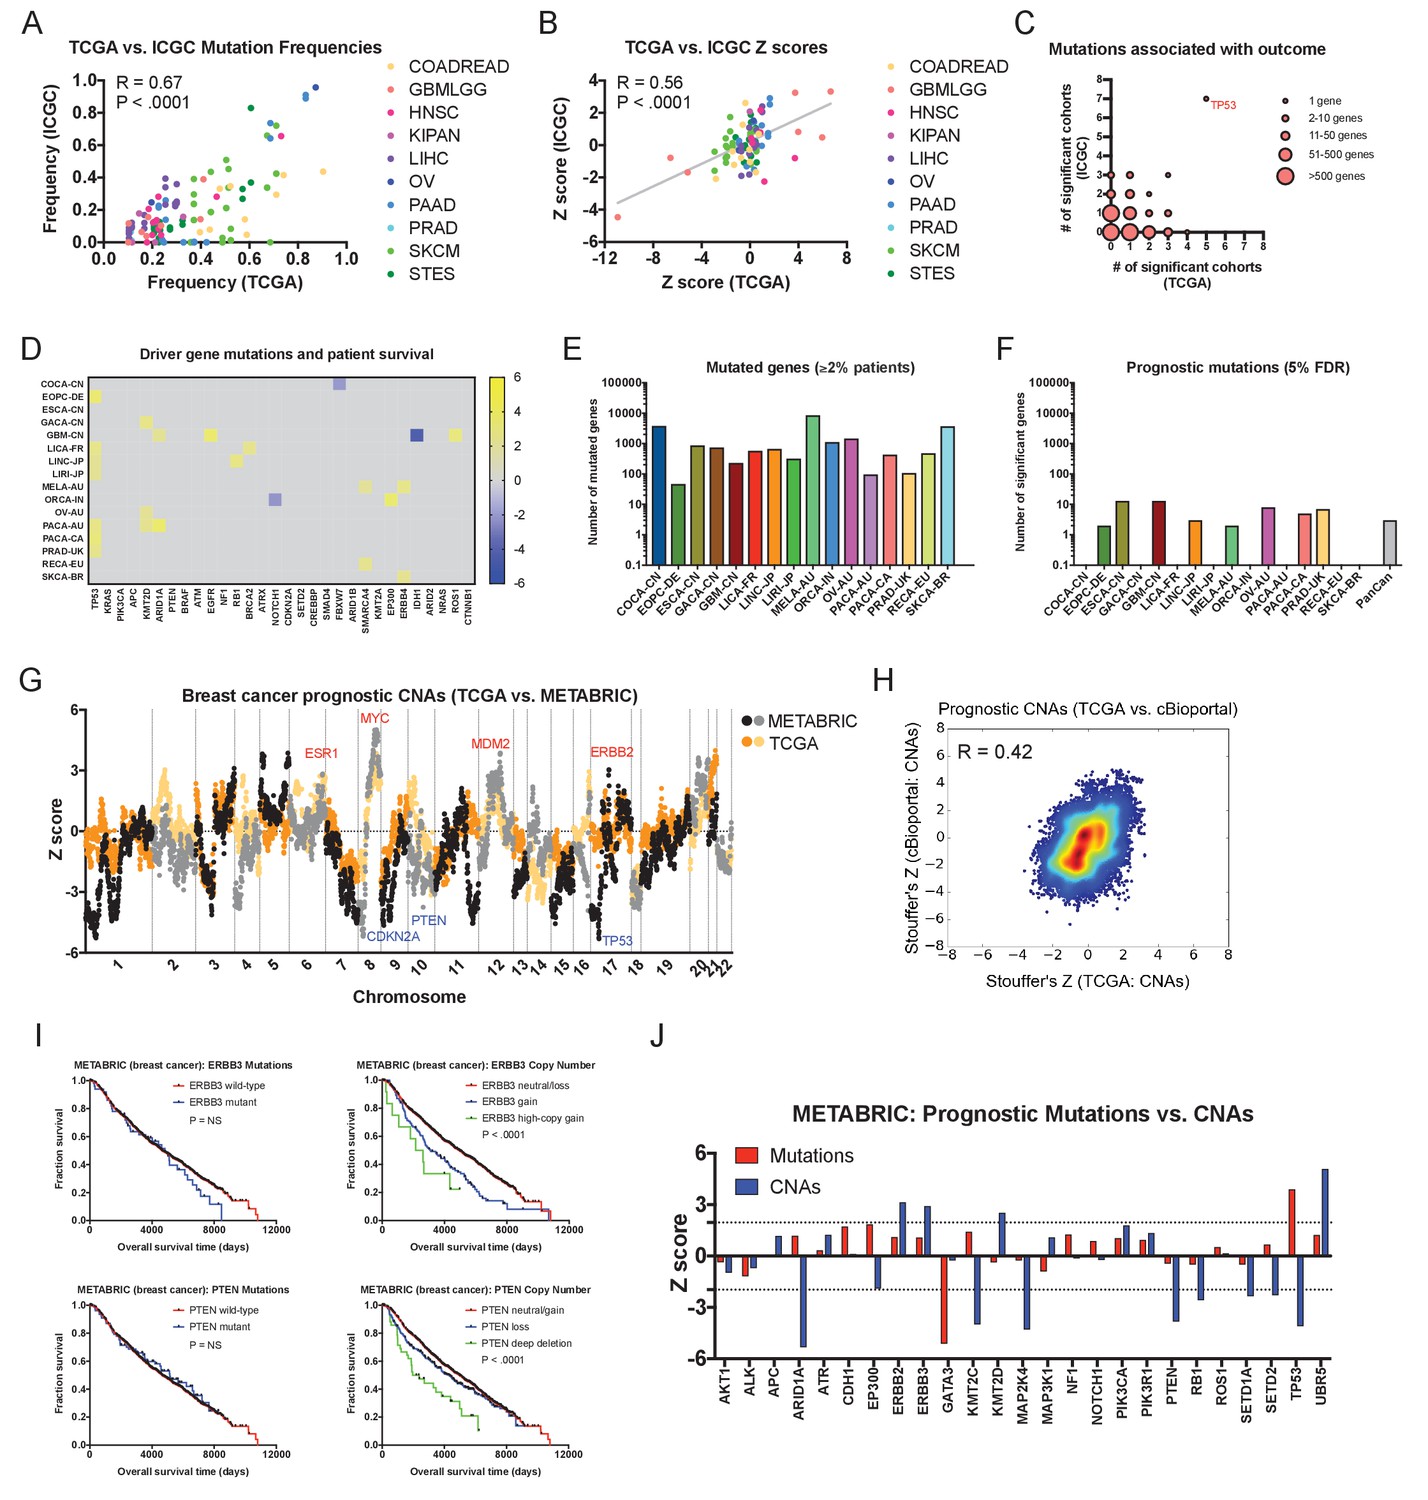
Driver gene copy number, but not driver gene mutations, are associated with survival in independent patient cohorts.
(A) Genes mutated in ≥10% of patients in each tumor type in the TCGA were identified, and then compared to the mutation frequency of these genes in the corresponding ICGC cohort or cohorts. The complete list of Z scores is presented in Supplementary file 6A. (B) Z scores of the 10 most frequently-mutated genes per cancer type in the ICGC were identified and then plotted against the Z scores of the same gene from the corresponding TCGA cohort or cohorts. (C) Significant Z scores (>1.96 or<−1.96) were counted per gene, and then the number of significant cohorts from the TCGA and the ICGC are plotted. While the vast majority of frequently-mutated genes are significant in zero or one cancer type, TP53 mutation status is associated with prognosis in 12 of 32 total patient cohorts. (D) A heatmap of significant survival associations among the 30 most frequently-mutated cancer driver genes in 16 patient cohorts from the ICGC are displayed. Z scores were calculated by regressing survival times between patients harboring wild-type and mutant copies of a gene if a gene was mutated in ≥2% of samples per tumor type. For visualization purposes, only significant Z scores are displayed. The complete list of Z scores is presented in Supplementary file 6A. (E) The number of genes mutated in ≥2% of samples per tumor type are displayed. (F) The number of genes significantly associated with patient outcome at a false-discovery threshold of 5% in each tumor type are displayed. (G) Z scores for the copy number of each gene from the TCGA BRCA cohort and the cBioportal METABRIC cohort are plotted against one another. The complete list of Z scores is presented in Supplementary file 6C. (H) Meta-Z scores from datasets curated by cBioportal are plotted against meta-Z scores from the corresponding four cancer types from TCGA (BLCA, BRCA, LIHC, and LUAD). The complete list of Z scores is presented in Supplementary file 6C. (I) Kaplan-Meier curves comparing mutations and CNAs in ERBB3 and PTEN in the cBioportal METABRIC cohort. (J) A bar graph of Z scores for mutations and CNAs in 25 driver genes in the cBioportal METABRIC cohort. While mutations in only two genes are associated with prognosis, CNAs in 12 of these same genes are associated with prognosis.
Figure 5 with 2 supplements
Robust prognostic biomarkers associated with drug sensitivity in cancer cell lines.
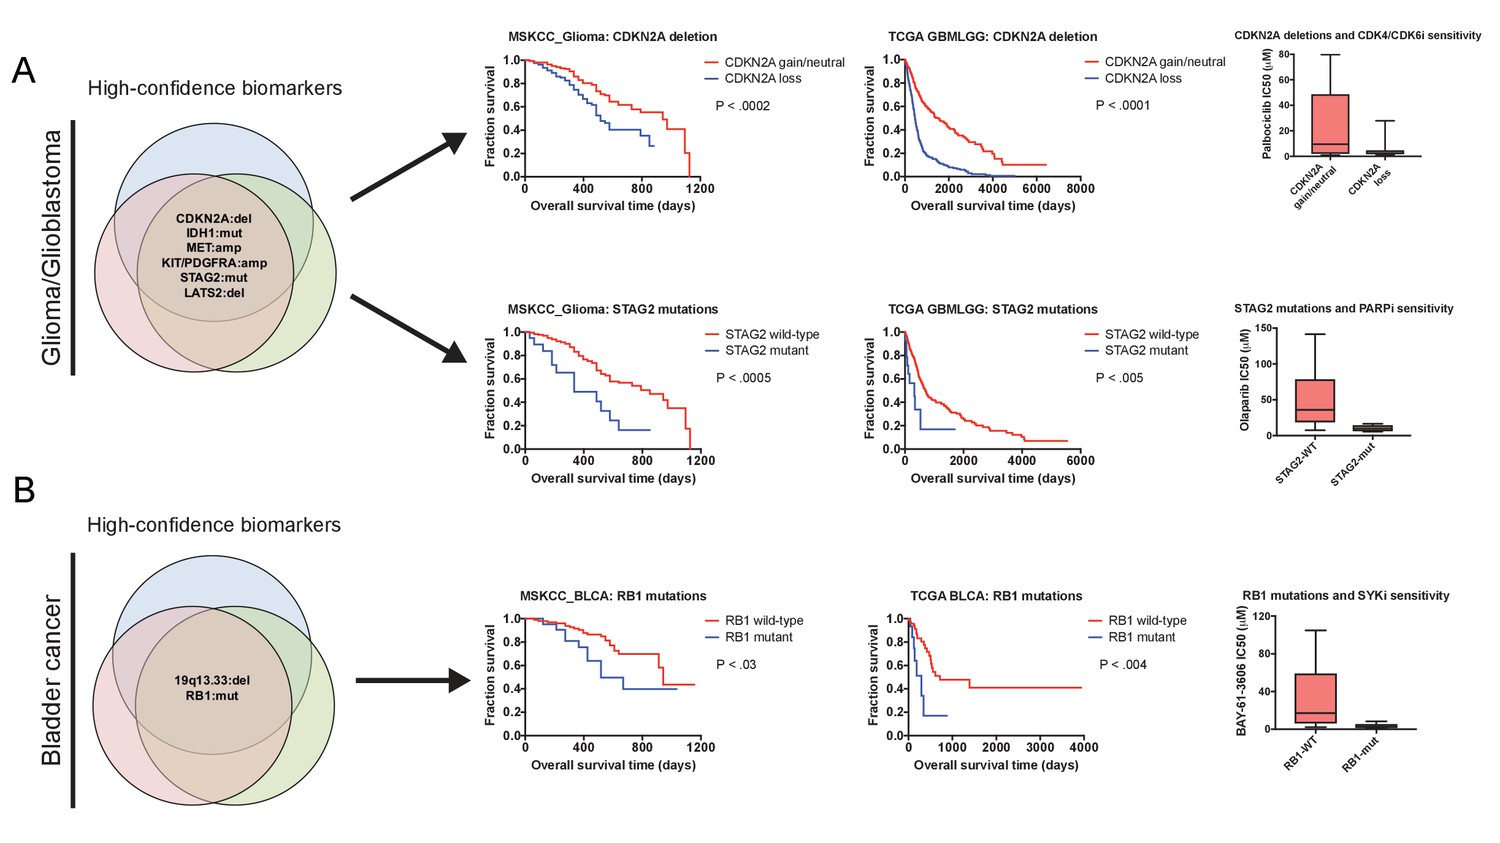
(A) Mutations and CNAs associated with patient outcome in multiple cohorts of glioma/glioblastoma are displayed. Mutations in STAG2 are associated with sensitivity to the PARP inhibitor olaparib, while CDKN2A deletions are associated with sensitivity to the CDK4/6 inhibitor palbociclib in glioma cell lines (Iorio et al., 2016). (B) Mutations and CNAs associated with patient outcome in multiple cohorts of bladder cancer are displayed. Mutations in RB1 are associated with sensitivity to the SYK inhibitor BAY-61–3606 in bladder cancer cell lines (Iorio et al., 2016). The complete list of high-confidence biomarkers and potential vulnerabilities are listed in Supplementary file 8.
Figure 5—figure supplement 1
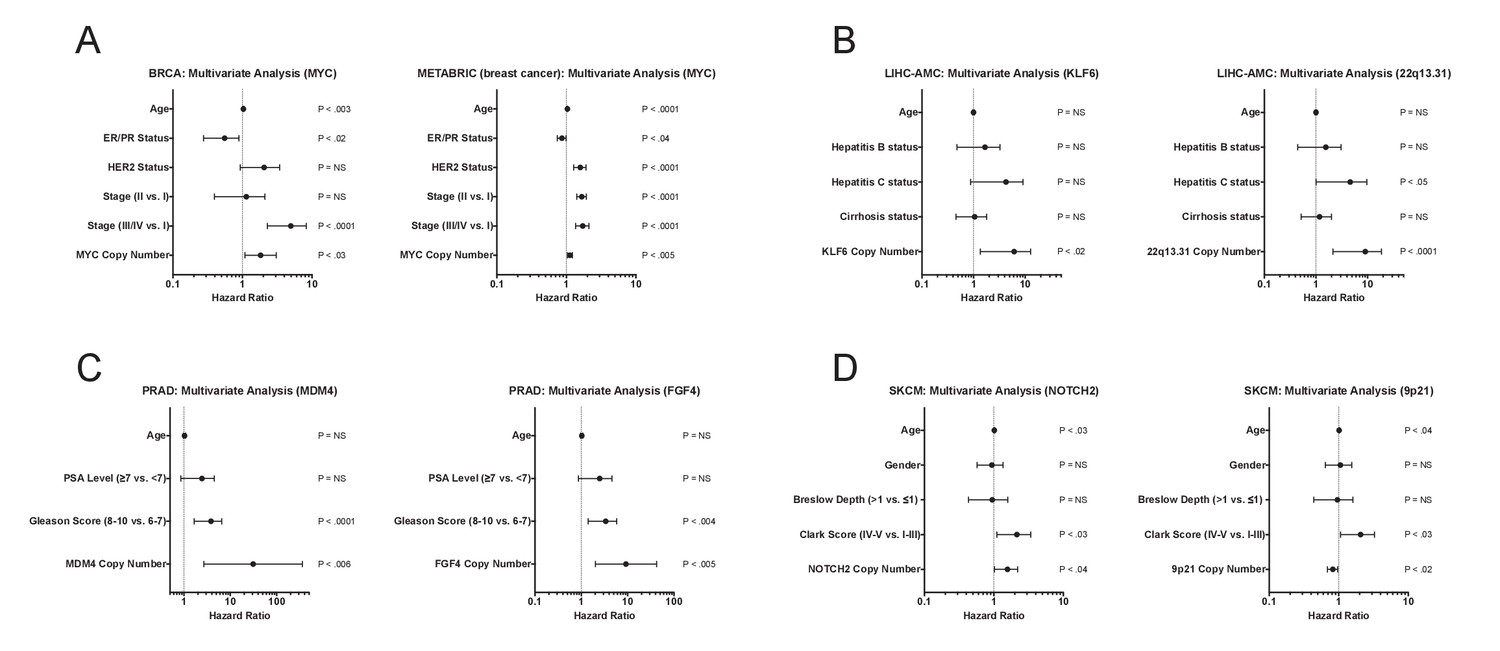
Multivariate analysis of high-confidence biomarkers with standard clinical criteria.
(A–D) Forest plots of the indicated CNAs in different cohorts in multivariate Cox models that include commonly-measured clinical variables. Circles indicate the hazard ratio, while the bars indicate the 95% confidence internal.
Figure 5—figure supplement 2
Robust prognostic biomarkers associated with drug sensitivity in cancer cell lines.
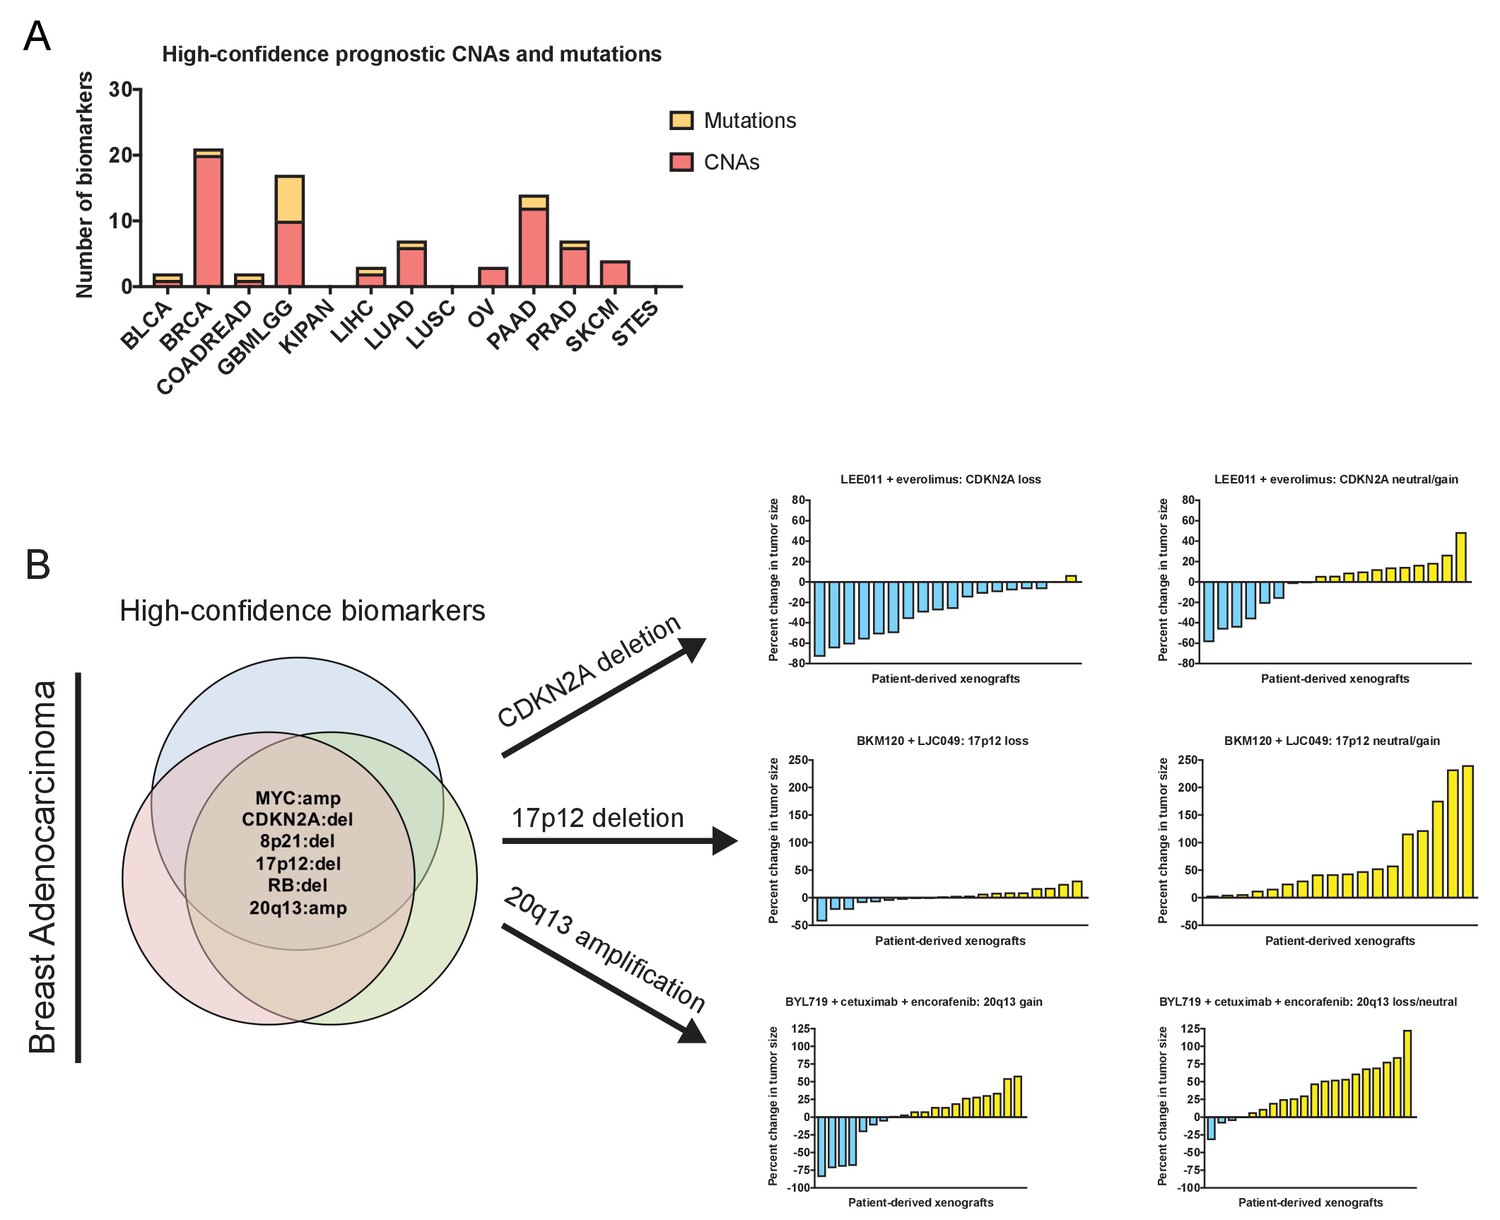
(A) The number of high-confidence genetic biomarkers identified in each of the indicated tumor types is displayed. The complete list of biomarkers is presented in Supplementary file 8. (B) Mutations and CNAs associated with clinical outcome in multiple breast cancer patient cohorts are displayed. Waterfall plots display the percent change in PDX volume among PDXs that harbor CDKN2A deletions, 17p12 deletions, or Chr20q13 amplifications treated with the indicated agents (Gao et al., 2015a). LEE011 is a CDK4/CDK6 inhibitor, everolimus is an mTOR inhibitor, BKM120 is a pan-PI3K inhibitor, LJC049 is a TNKS inhibitor, BYL719 is a PI3KCA inhibitor, cetuximab is an EGFR inhibitor, and encorafenib is a BRAF inhibitor. The complete list of biomarkers is presented in Supplementary file 8.
Additional files
-
Supplementary file 1
Cancer survival cohorts analyzed in this study.
- https://doi.org/10.7554/eLife.39217.024
-
Supplementary file 2
Cox proportional hazards modeling of mutations in the TCGA.
- https://doi.org/10.7554/eLife.39217.025
-
Supplementary file 3
Cox proportional hazards modeling of CNAs in the TCGA.
- https://doi.org/10.7554/eLife.39217.026
-
Supplementary file 4
Cox proportional hazards modeling in the TCGA adjusted for stage, grade, or subtype.
- https://doi.org/10.7554/eLife.39217.027
-
Supplementary file 5
Cox proportional hazards modeling adjusted for TP53 status or total aneuploidy.
- https://doi.org/10.7554/eLife.39217.028
-
Supplementary file 6
Cox proportional hazards modeling of cancer cohorts from the ICGC or curated by cBioportal.
- https://doi.org/10.7554/eLife.39217.029
-
Supplementary file 7
Cox proportional hazards modeling of the MSKCC_2017 cohorts.
- https://doi.org/10.7554/eLife.39217.030
-
Supplementary file 8
High-confidence biomarkers and their associated therapeutic sensitivities.
- https://doi.org/10.7554/eLife.39217.031
-
Transparent reporting form
- https://doi.org/10.7554/eLife.39217.032
Download links
A two-part list of links to download the article, or parts of the article, in various formats.
Downloads (link to download the article as PDF)
Open citations (links to open the citations from this article in various online reference manager services)
Cite this article (links to download the citations from this article in formats compatible with various reference manager tools)
Systematic identification of mutations and copy number alterations associated with cancer patient prognosis
eLife 7:e39217.
https://doi.org/10.7554/eLife.39217


