The role of APETALA1 in petal number robustness
- Max Planck Institute for Plant Breeding Research, Germany
- University of Oxford, United Kingdom
Figures
Figure 1 with 2 supplements
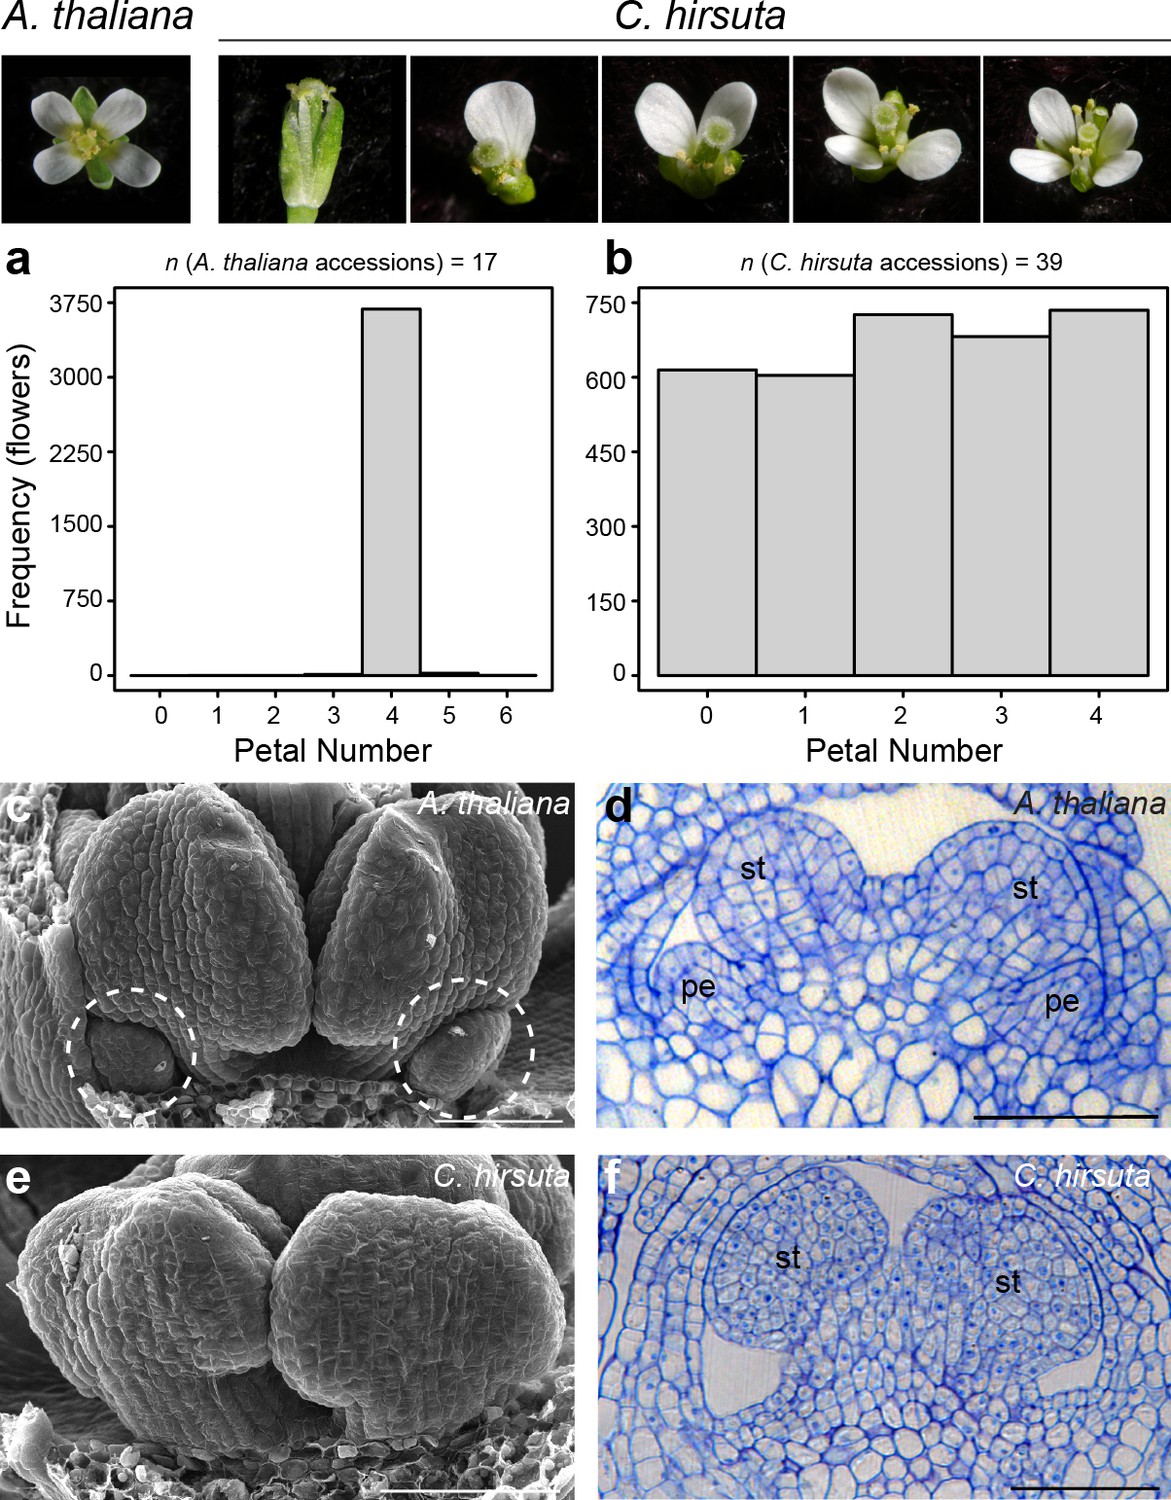
Petal number is robust in A. thaliana and variable in C. hirsuta.
Four-petalled A. thaliana flower compared with C. hirsuta flowers containing 0, 1, 2, 3 or 4 petals. (a, b) Histograms showing petal number on the x-axis and frequency of flowers of the y-axis for (a) 17 A. thaliana accessions (n = 3725 flowers from 149 plants) and (b) 39 C. hirsuta accessions (n = 3362 flowers from 143 plants). (c, e) Scanning electron micrographs of stage eight flowers with covering sepals dissected away to show medial stamen primordia and small petal primordia (dashed circles) present in A. thaliana (c) and absent in C. hirsuta (e). (d, f) Longitudinal sections of stage eight flowers showing small petal primordia present in A. thaliana (d) and absent in C. hirsuta (f). Abbreviations: pe, petal; st, stamen. Scale bars: 20 µm (c–f).
Figure 1—figure supplement 1
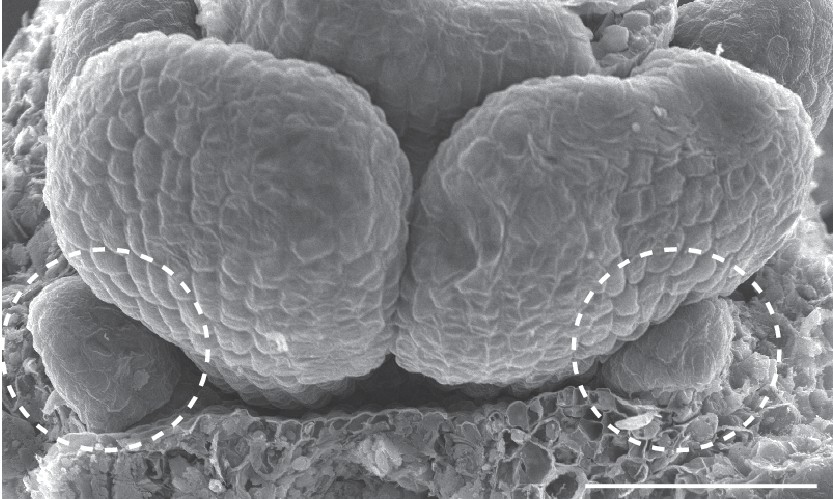
Scanning electron micrograph of a C. hirsuta stage eight flower.
Covering sepals are dissected away to show two small petal primordia (dashed circles) at the base of medial stamens. Scale bar: 20 µm.
Figure 1—figure supplement 2

Petal position in C. hirsuta flowers (n = 144 flowers, flower numbers 1 – 25).
https://doi.org/10.7554/eLife.39399.005
Figure 2 with 3 supplements
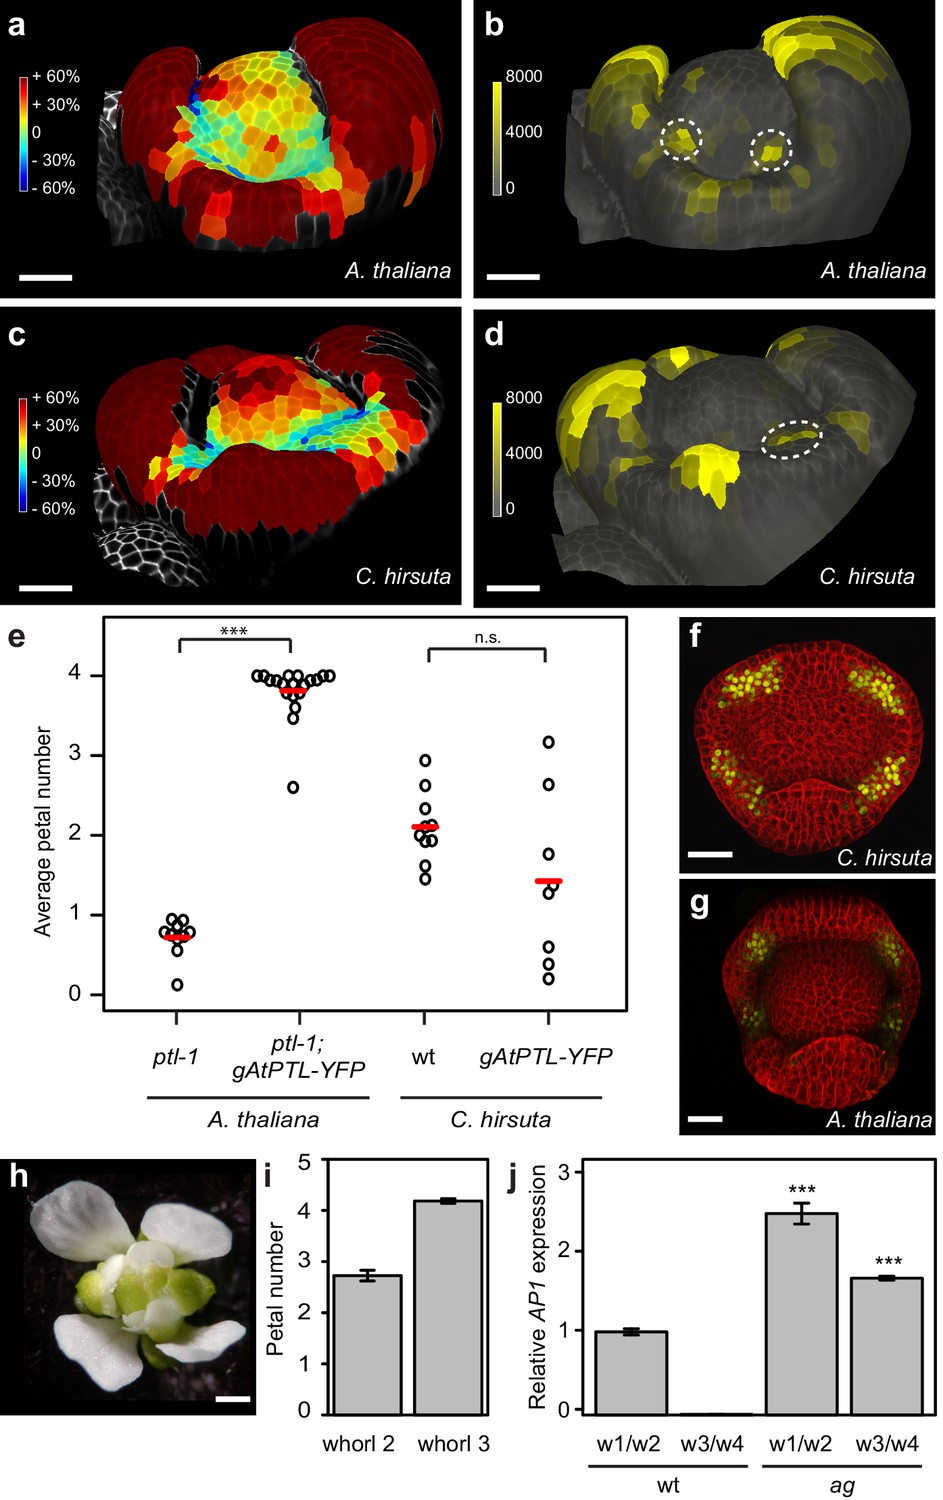
Auxin activity maxima fail to form in whorl two of C. hirsuta floral meristems.
(a–d) Heat maps of change in relative cell area of floral primordia over 24 hr of growth (a, c) and surface projections of DR5::VENUS expression (b, d) in A. thaliana (a, b) and C. hirsuta (c, d). Colour bars: percentage increase (warm colours) and decrease (cool colours) of cell area (a, c) and signal intensity (yellow) in arbitrary units (b, d). Dashed circles indicate expression maxima that correspond to initiating petals. Floral primordia are shown in side view facing a lateral sepal. (e) Beeswarm plot of average petal number in A. thaliana ptl-1 (n = 149 flowers, 10 plants) and ptl-1; AtPTL::AtPTL:YFP (n = 266 flowers, 19 independent insertion lines), and C. hirsuta Ox (n = 145 flowers, 10 plants) and AtPTL::AtPTL:YFP (n = 110 flowers, eight independent insertion lines). Red lines indicate means. (f, g) CLSM projections showing AtPTL::AtPTL:YFP expression (yellow) in the regions between sepals in stage 3–4 flowers of C. hirsuta (f) and A. thaliana (g). (h) C. hirsuta ag flower. (i) Barplot of mean petal number in whorls 2 and 3 of C. hirsuta ag flowers (n = 136 flowers, four plants). Note that mean stamen number is distributed between 4 – 5 in C. hirsuta, reflecting variation in lateral stamen number (Hay et al., 2014), and third whorl petals show similar variation in ag. (j) Relative expression of C. hirsuta AP1 in floral organs pooled from whorls 1, 2 (w1/w2) and whorls 3, 4 (w3/w4), in Ox compared to ag flowers, determined by quantitative RT-PCR and reported as means of three biological replicates (Student’s t-test: p<0.001). Error bars represent s.e.m. Scale bars: 20 μm (a–d, f–g), 0.5 mm (h).
Figure 2—figure supplement 1
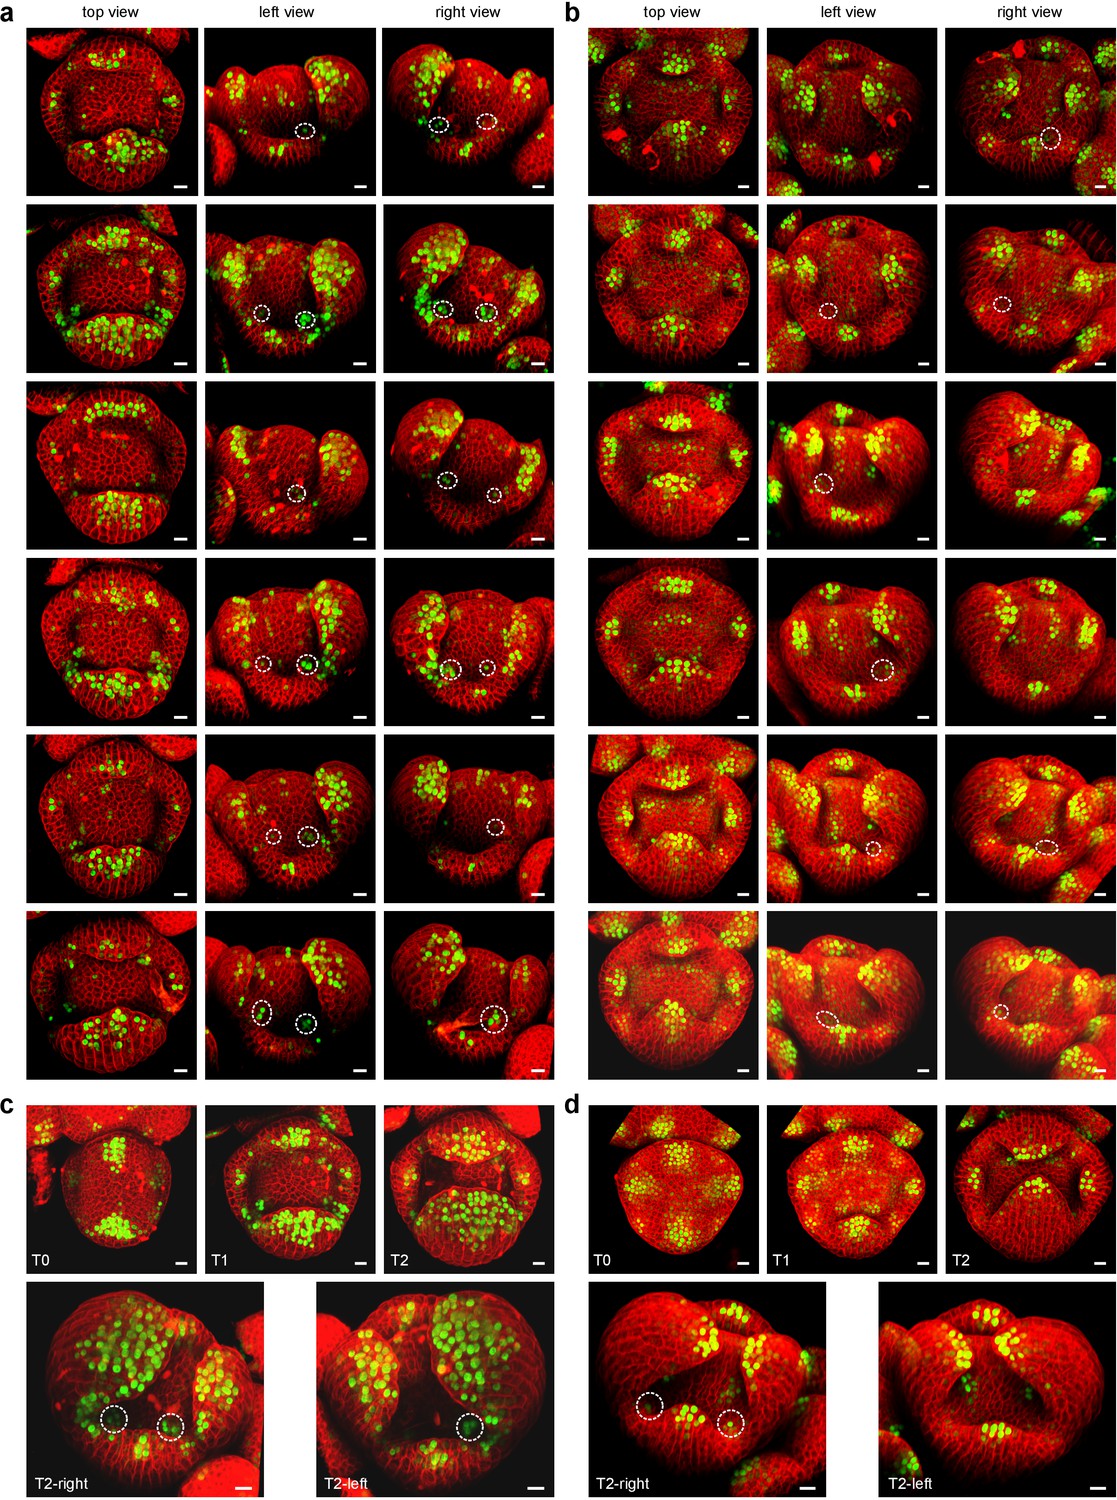
CLSM time-lapse series of DR5::VENUS in A. thaliana and DR5v2::VENUS in C. hirsuta flowers.
(a–b) Six stage-5 A. thaliana flowers expressing DR5::VENUS (green, (a) and C. hirsuta flowers expressing DR5v2::VENUS (green, (b) with cells outlined by propidium iodide (PI) staining (red). Top view and left and right side views are shown for each sample to allow DR5 expression peaks to be observed on the flanks of the floral meristem where petals will initiate. Peaks located between sepals but in the sepal whorl rather than on the floral meristem are not scored here. In the A. thaliana samples, 83% of petal initiation sites show a DR5 peak, which quantifies the reliability of DR5 as a marker of petal initiation. In the C. hirsuta samples, 36% of petal initiation sites on the floral meristem show a DR5 peak. Although DR5v2::VENUS is a more sensitive reporter than DR5::VENUS, allowing weak auxin responses to be visualized (Liao et al., 2015), the DR5 peaks in C. hirsuta are generally less intense and harder to detect than in A. thaliana. (c–d) Dynamics of DR5::VENUS expression in a growing A. thaliana flower (c) and DR5v2::VENUS expression in a growing C. hirsuta flower (d) from stage 4 to stage 6. The time points are separated by 24 hr of growth. Side views of the T2 time points show visible DR5 peaks on the floral meristem that are maintained through to stage 6. These DR5 peaks are weaker in C. hirsuta than in A. thaliana flowers.
Figure 2—figure supplement 2

Representative flowers.
(a) A. thaliana ptl-1 and (b) ptl-1; AtPTL::AtPTL:YFP, and (c) C. hirsuta AtPTL::AtPTL:YFP. Scale bar: 0.5 mm.
Figure 2—figure supplement 3
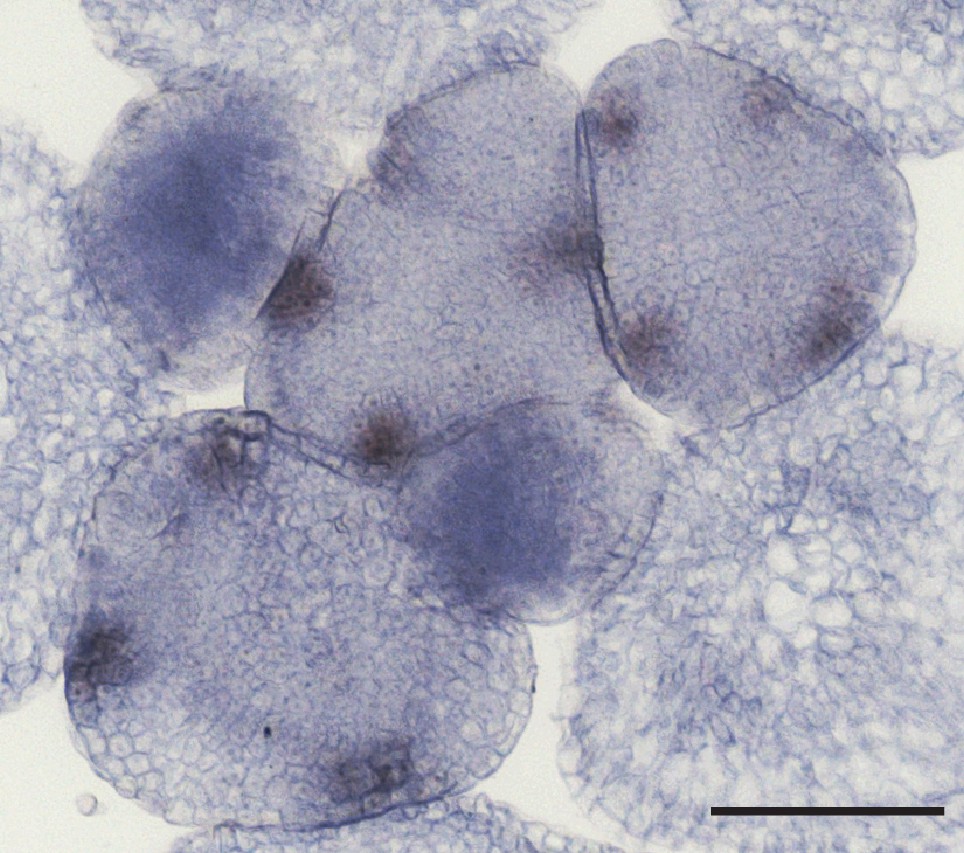
In situ hybridization of C. hirsuta PTL.
Flowers, observed in transverse section through an inflorescence meristem, consistently showed four spots of PTL expression between sepals. Scale bar: 100 µm.
Figure 3
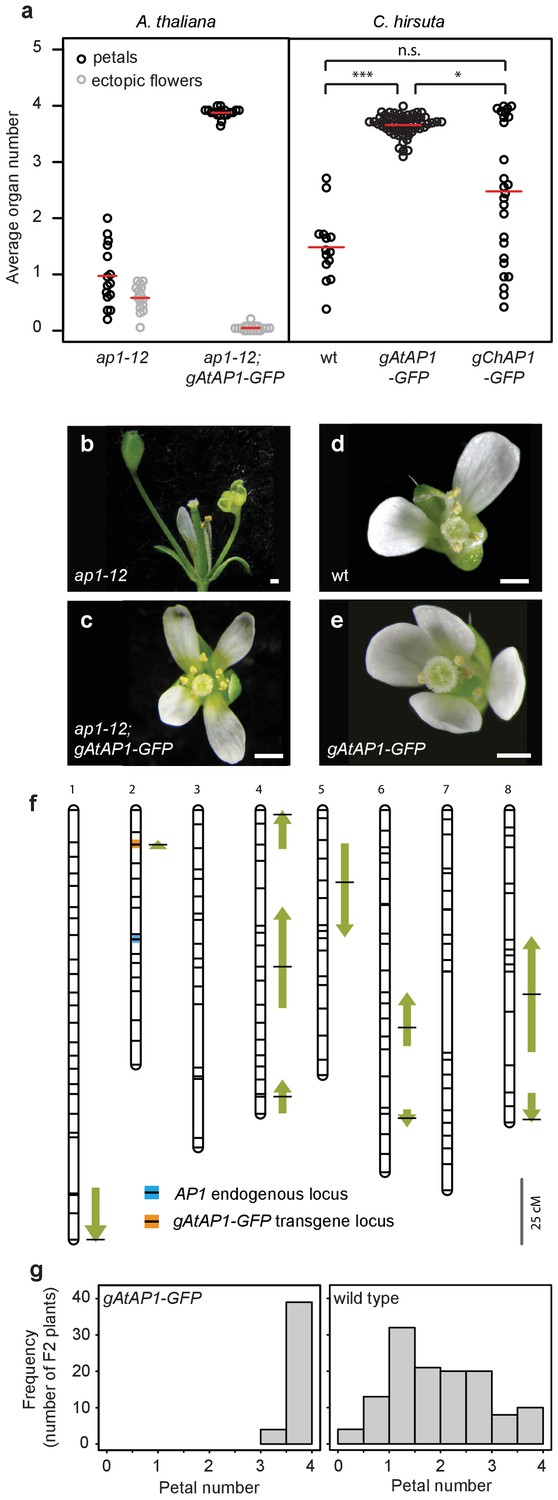
A. thaliana AP1 confers robust petal number in C. hirsuta and masks natural variation.
(a) Beeswarm plot of average petal number (black) and average number of ectopic flowers (grey) in A. thaliana ap1-12 (n = 375 flowers, 15 plants) and ap1-12; gAtAP1-GFP (AtAP1::AtAP1:GFP; n = 472 flowers, 19 plants, two independent insertion lines), and average petal number (black) in C. hirsuta wild-type (wt; n = 331 flowers, 14 plants), gAtAP1-GFP (n = 1286 flowers, 57 plants, five independent insertion lines) and gChAP1-GFP (ChAP1::ChAP1:GFP) (n = 628 flowers, 26 plants, two independent insertion lines). Red lines indicate means. Differences between C. hirsuta genotypes assessed by pairwise Mann-Whitney U test with Bonferroni correction: ***p=2.4e-08; *p=0.015; n.s. p=0.07. (b–e) Representative flowers of A. thaliana ap1-12 (b), ap1-12; gAtAP1-GFP (c), and C. hirsuta wild type (d), gAtAP1-GFP (e). Scale bars: 0.5 mm. (f) QTL for average petal number detected in the C. hirsuta Ox gAtAP1-GFP × Nz F2 mapping population are shown as arrows on the 8 chromosomes of the genetic map. Positions with the most significant effects are indicated by horizontal black lines and the length of the arrows is scaled to the 2(Log(p)) interval for each QTL. Arrow direction indicates whether the Ox allele for each QTL increases (upward pointing) or decreases (downward pointing) petal number. Positions of the AP1 endogenous locus (blue line) and the gAtAP1-GFP transgene (orange line) are indicated on the genetic map. Scale bar: 25 cM. (g) Distribution of average petal number in plants of the Ox × Nz F2 population that segregate homozygous for the gAtAP1-GFP transgene (left histogram) or without the transgene (right histogram).
Figure 4 with 7 supplements
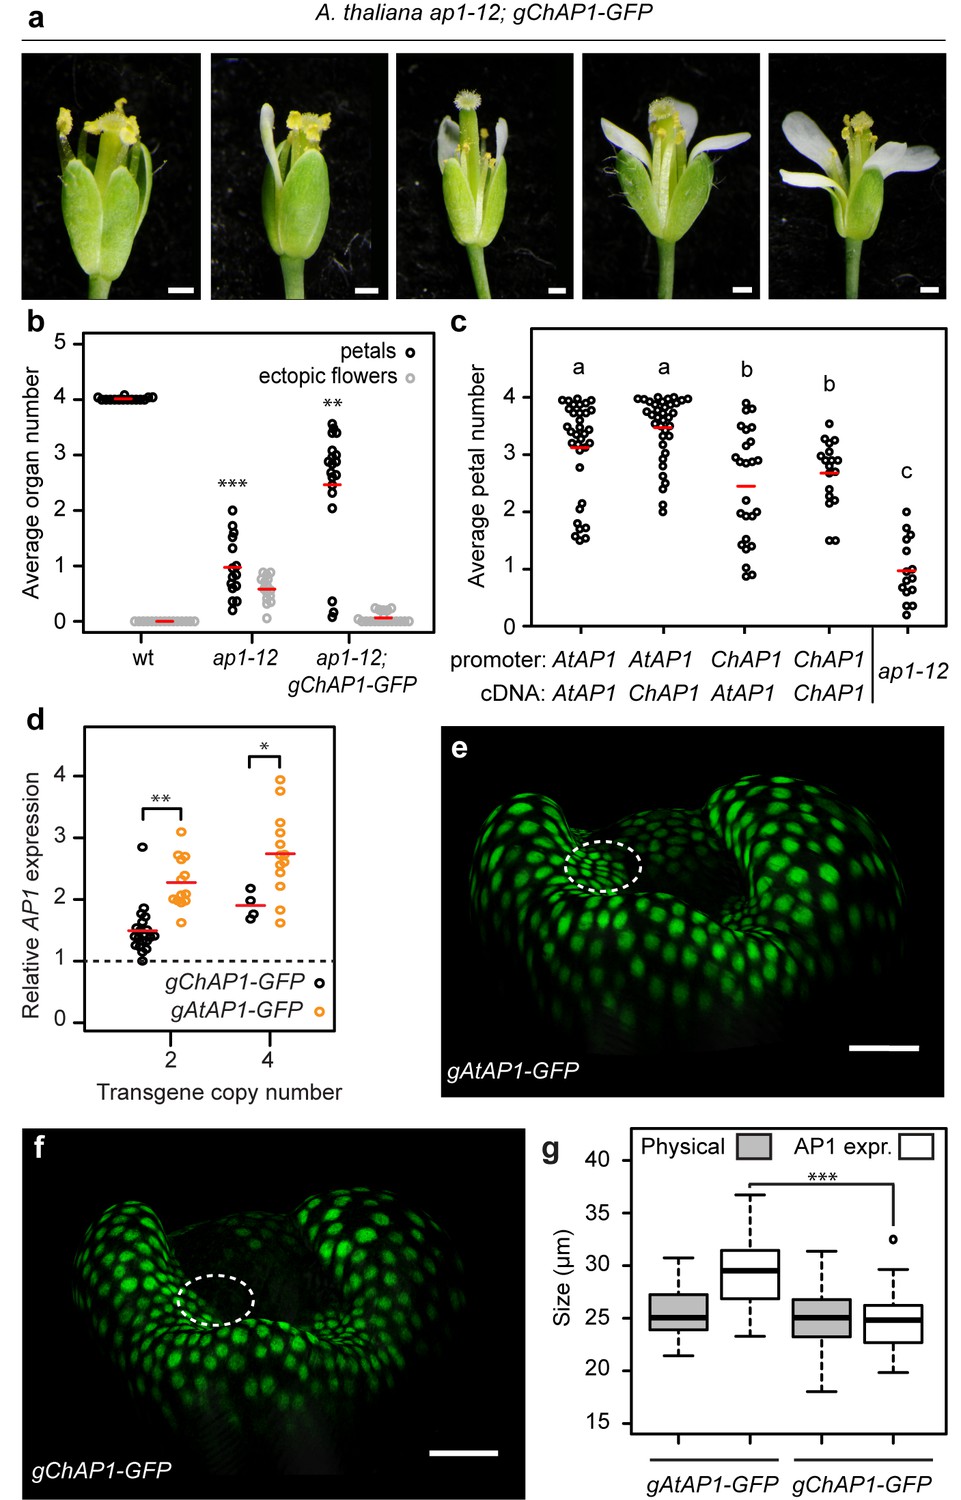
AP1 divergence contributes to species-specific petal number.
(a) A. thaliana flowers of ap1-12; gChAP1-GFP (ChAP1::ChAP1:GFP) genotype. (b) Beeswarm plot of average petal number (black) and average number of ectopic flowers (grey) in A. thaliana wild-type (n = 369 flowers, 15 plants), ap1-12 (n = 375 flowers, 15 plants) and ap1-12; gChAP1-GFP (n = 598 flowers, 25 plants, two independent insertion lines). Red lines indicate means. Levene’s test showed that the variance in petal number differed between wild-type and ap1-12 (***p=5.588e-05) and wild-type and ap1-12; gChAP1-GFP (**p=0.005823), but not between ap1-12 and ap1-−12; gChAP1-GFP (p=0.282). (c) Beeswarm plot of average petal number in A. thaliana ap1-12 plants either untransformed or transformed with chimeric AP1 constructs comprising the promoter sequences from either AtAP1 (A. thaliana) or ChAP1 (C. hirsuta) and the cDNA sequences from either AtAP1 or ChAP1. A two-way ANOVA test on ranked data showed a significant effect of promoter sequence on petal number (p=9.45e-08) but no effect of coding sequence (p=0.103) and no interaction effect between the promoter and coding sequences (p=0.258). Post-hoc Tukey's HSD tests showed that AP1 constructs containing the A. thaliana promoter had significantly higher petal number than those containing the C. hirsuta promoter, and all transgenic genotypes had higher petal number than ap1-12 at 0.05 level of significance. ap1-12: n = 375 flowers, 15 plants; ap1-12; pAtAP1::AtAP1: n = 1454 flowers, 37 plants, 10 independent insertion lines; ap1-12; pAtAP1::ChAP1: n = 1414 flowers, 36 plants, nine independent insertion lines; ap1-12; pChAP1::AtAP1: n = 986 flowers, 25 plants, five independent insertion lines; ap1-12; pChAP1::ChAP1: n = 717 flowers, 18 plants, five independent insertion lines. (d) Beeswarm plot of relative AP1 expression levels in inflorescences of C. hirsuta transgenic lines of gChAP1-GFP (black) and gAtAP1-GFP (orange) with 2 or four transgene copies. AP1 expression is quantified by qRT-PCR in three biological replicates of each sample and expressed relative to AP1 expression in wild-type inflorescences (dashed line). Relative AP1 expression is higher for gAtAP1-GFP lines, both for two (Student’s t-test, p<0.01) and four (p<0.05) transgene copies. n = 26 plants from six independent insertion lines for gAtAP1-GFP; n = 24 plants from five independent insertion lines for gChAP1-GFP. (e–f) Surface projections showing nuclear expression (green) of gAtAP1-GFP (d) and gChAP1-GFP (e) in stage 4 C. hirsuta flowers viewed from the lateral sepal. The dashed circle indicates the petal initiation domain on the floral meristem. (g) Boxplot of the size of inter-sepal regions (Physical) and the extent of AP1 expression along these transects into whorl 2 (AP1 expr) in C. hirsuta stage four floral meristems of gAtAP1-GFP and gChAP1-GFP. Size of the AP1 expression domain differs significantly between genotypes (Wilcoxon test, p<0.001; n = 7 samples each genotype) but physical size does not (p=0.44). Box and whiskers: quartiles, circles: outliers, black lines: median. Scale bars: 0.5 mm (a), 20 µm (e, f).
Figure 4—figure supplement 1

Quantification of ectopic flowers produced by chimeric AP1 constructs complementing A. thaliana ap1-12.
Beeswarm plot shows the average number of ectopic flowers in ap1-12 plants either untransformed or transformed with chimeric AP1 constructs comprising the promoter sequences from either A. thaliana (AtAP1) or C. hirsuta (ChAP1) and the cDNA sequences from either A. thaliana (AtAP1) or C. hirsuta (ChAP1). A two-way ANOVA test on ranked data showed no significant effect of the promoter sequence (p=0.0665), the coding sequence (p=0.97), and no interaction effect between promoter and coding sequence (p=0.0956) on ectopic flowers number. ap1-12: n = 375 flowers, 15 plants; ap1-12; pAtAP1::AtAP1: n = 1454 flowers, 37 plants, 10 independent insertion lines; ap1-12; pAtAP1::ChAP1: n = 1414 flowers, 36 plants, nine independent insertion lines; ap1-12; pChAP1::AtAP1: n = 986 flowers, 25 plants, five independent insertion lines; ap1-12; pChAP1::ChAP1: n = 717 flowers, 18 plants, five independent insertion lines.
Figure 4—figure supplement 2

Example of a time-lapse series for AtAP1::AtAP1:GFP and ChAP1::ChAP1:GFP flowers in C. hirsuta.
Samples were imaged every 24 hr from stage 3 to stage 5–6. The rate of growth and the size of the flower vary between samples and do not characterize a particular genotype. Scale bar: 20 µm.
Figure 4—figure supplement 3
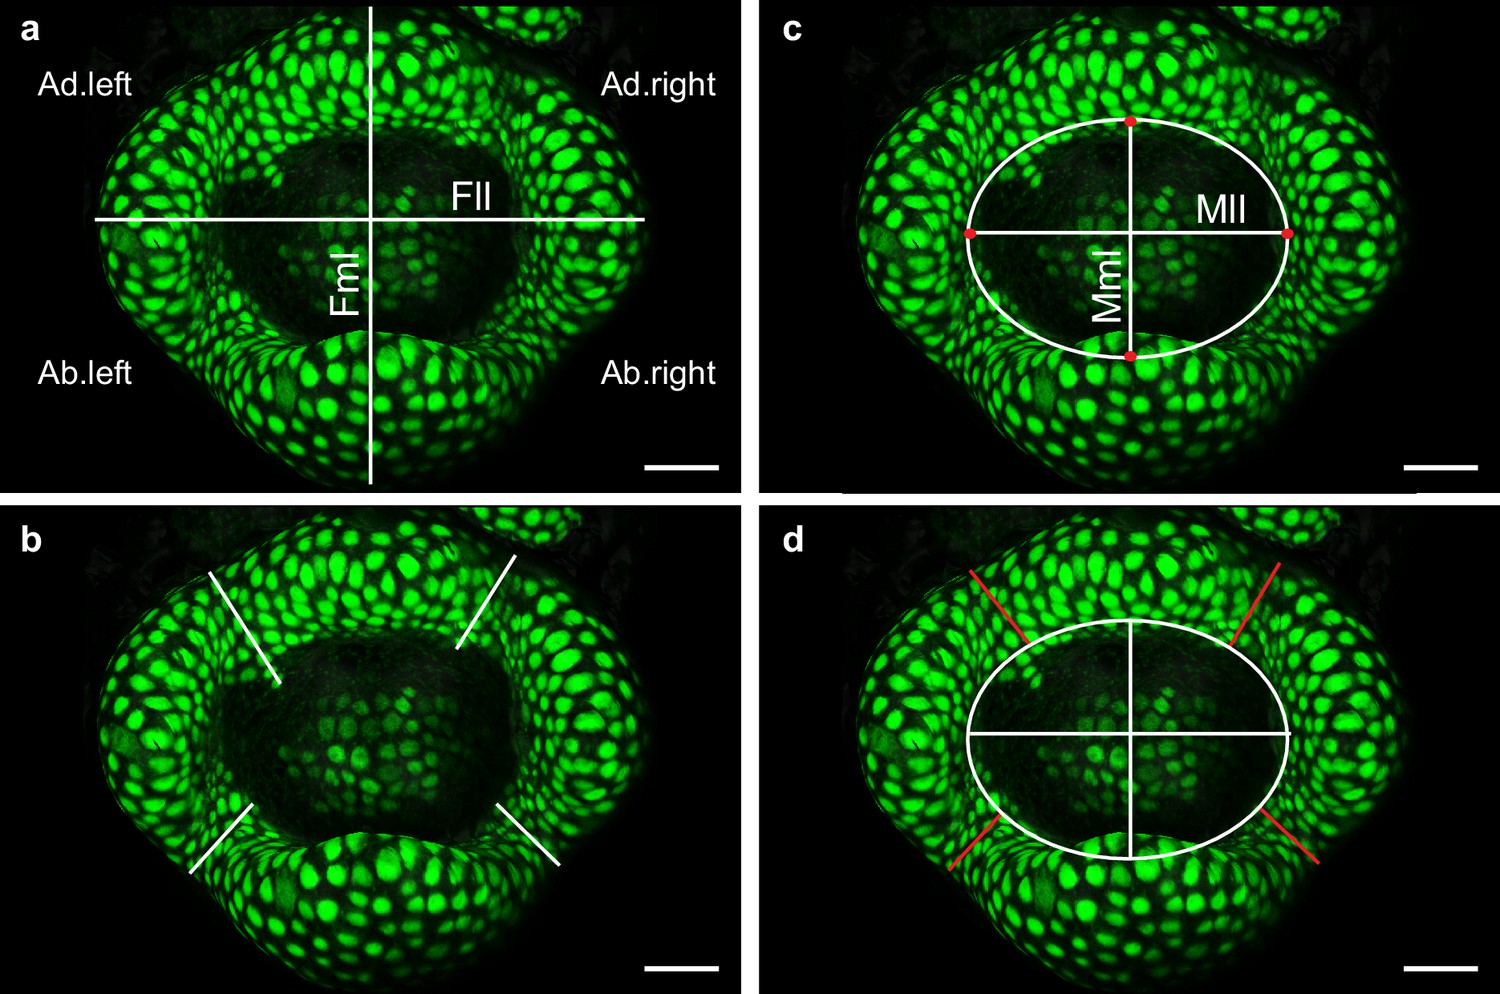
Quantitative image analysis of C. hirsuta stage-4 flower meristems expressing AtAP1::AtAP1:GFP.
(a) After surface extraction and projection of the epidermal signal in MorphoGraphX (see Materials and methods), a snapshot of the flower meristem was taken from a top view. The flower lateral length (Fll) and flower median length (Fml) were defined as the longest planar distance from one side of the flower to the other, in lateral and median orientations respectively. (b) The AP1 expression boundary size was measured as the shortest distance from the outside of the meristem to the most internal nucleus expressing GFP in the petal initiation domain. (c) The boundary between the sepals and the floral meristem was a precise landmark represented here by red dots. The lines between the red dots define the meristem lateral length (Mll) and meristem median length (Mml). The extremities of these lines were connected by an ellipse, whose area defined the meristem size as measured in Figure 4f. (d) The physical boundary size (red lines) was measured as the shortest distance from the outside of the meristem to the ellipse. Ad. left: adaxial left boundary; Ab. left: abaxial left boundary; Ad.right: adaxial right boundary; Ab.right: abaxial right boundary. Scale bar: 20 µm.
Figure 4—figure supplement 4
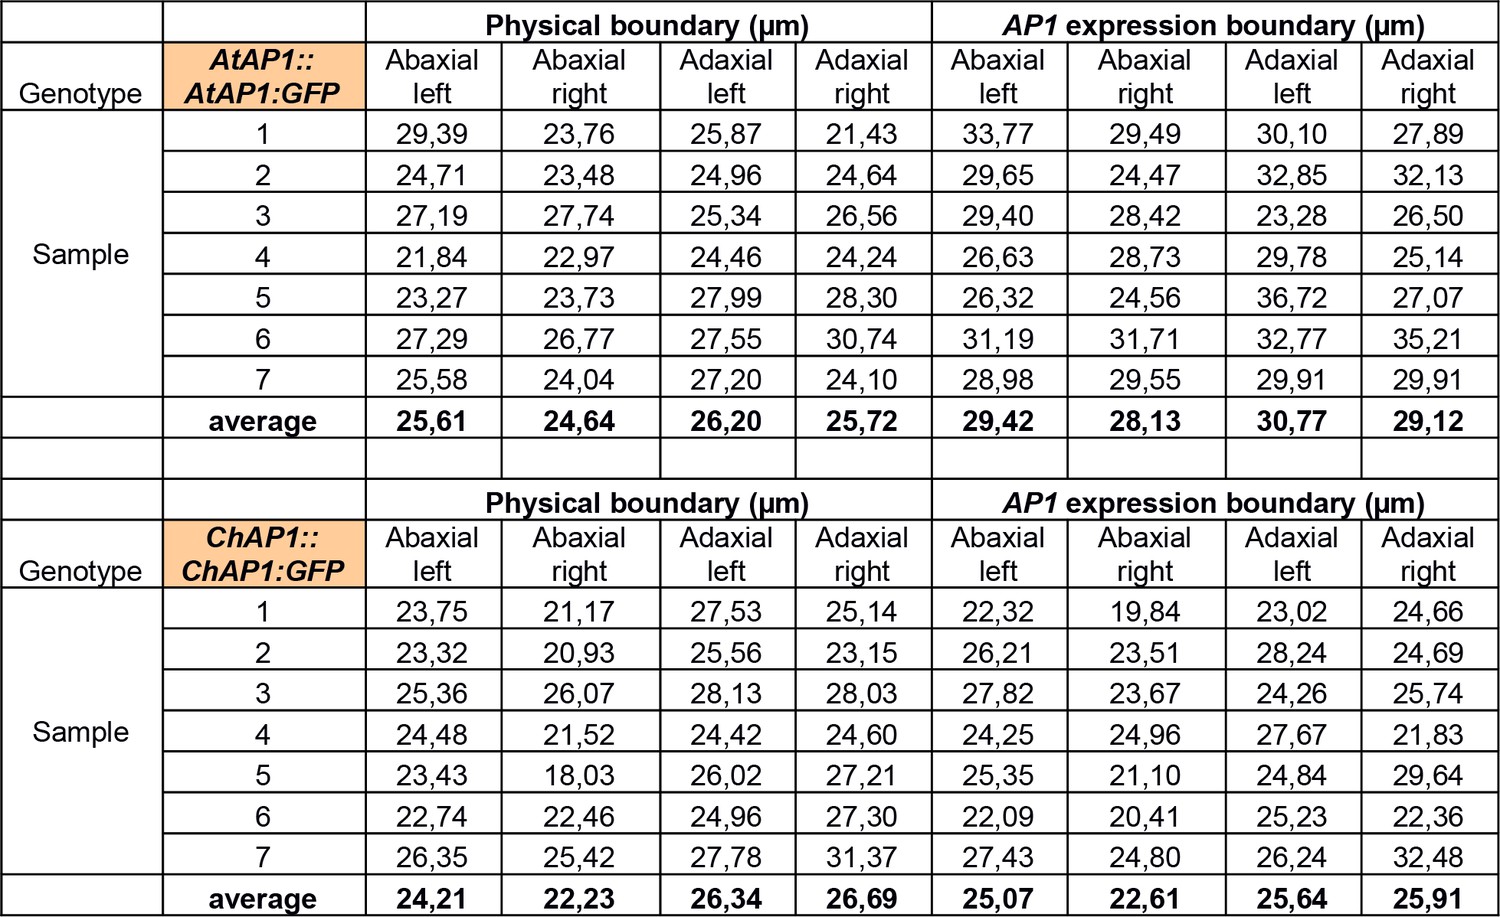
Measurements of the physical boundary size and the AP1 expression boundary size (as defined in Figure 4—figure supplement 3) in 7 samples of AtAP1::AtAP1:GFP and ChAP1::ChAP1:GFP stage-4 flowers in C. hirsuta.
https://doi.org/10.7554/eLife.39399.016
Figure 4—figure supplement 5
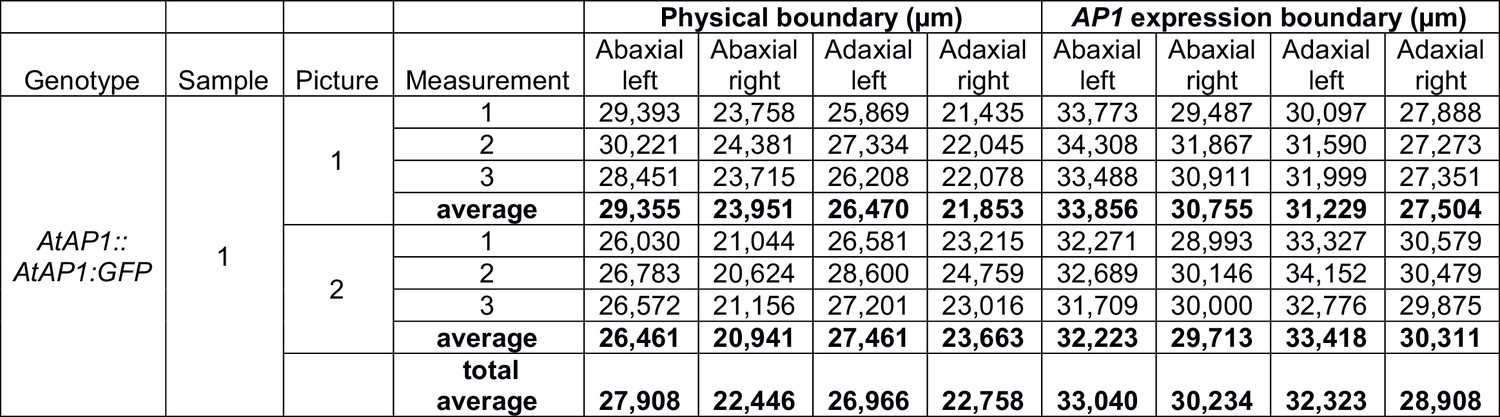
Variability of measurements of the physical boundary size and the AP1 expression boundary size, as defined in Figure 4—figure supplement 3.
Measurements were performed three times on two pictures of the same sample of AtAP1::AtAP1:GFP C. hirsuta stage-4 flower to estimate reproducibility. Error was calculated to be 0.47 µm (i.e. 1.7% of the average boundary size) when measuring the same picture three times, and 2.05 µm (i.e. 7.5% of the average boundary size) when measuring two different pictures from the same sample.
Figure 4—figure supplement 6
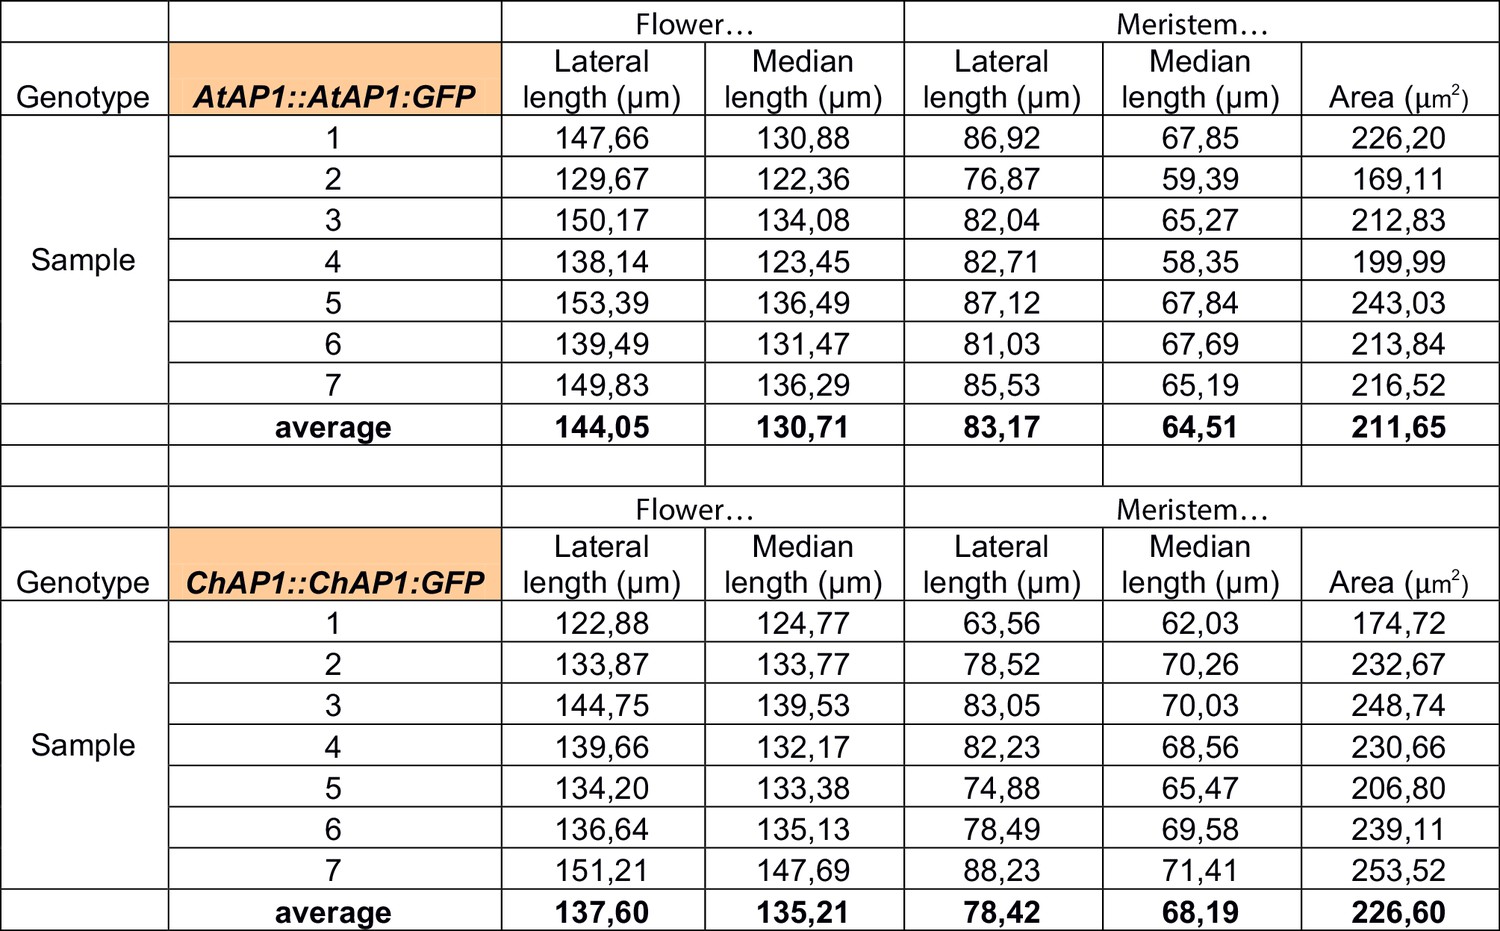
Measurements of the lateral and median lengths of the flower and of the meristem, and the meristem area (as defined in Figure 4—figure supplement 3) in 7 samples of AtAP1::AtAP1:GFP and ChAP1::ChAP1:GFP stage-4 flowers in C. hirsuta.
https://doi.org/10.7554/eLife.39399.018
Figure 4—figure supplement 7

CLSM projections of C. hirsuta (a) and A. thaliana (b) stage four flowers co-expressing gAtAP1-GFP (green) and gChAP1-RFP (red).
Arrows point to enrichment of ChAP1-RFP in the regions between sepals. Scale bars: 20 µm.
Figure 5 with 2 supplements
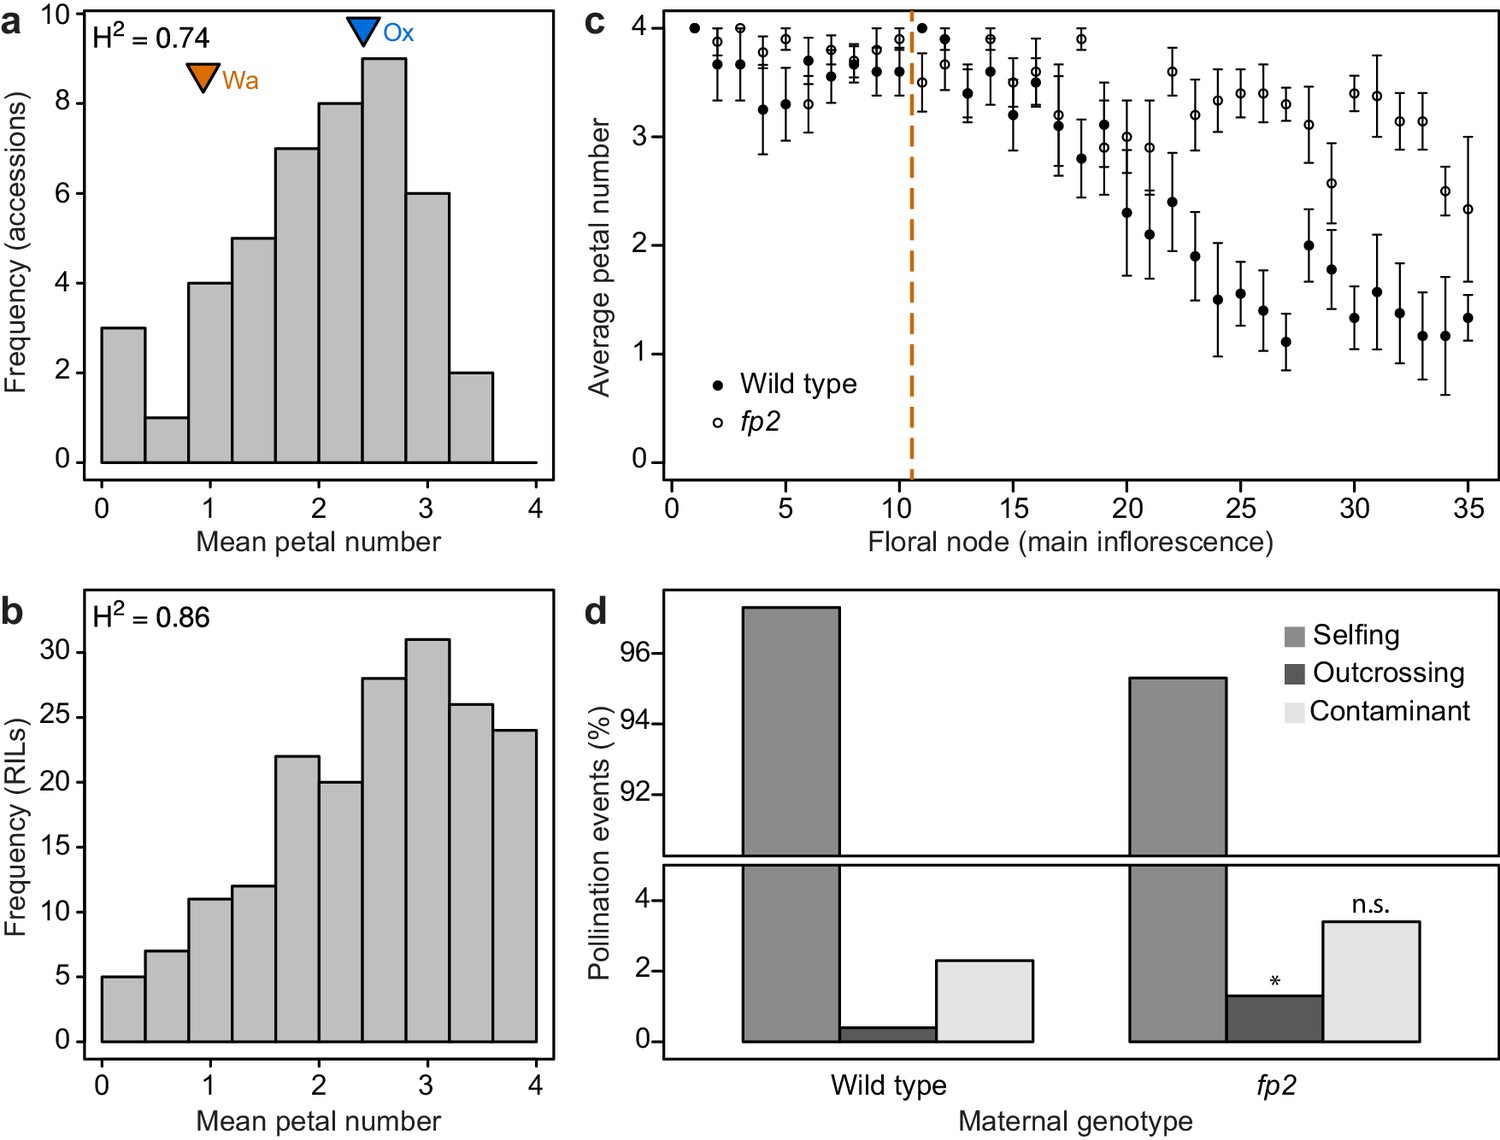
Petal number distributions differ between natural and experimental populations of C. hirsuta and outcrossing frequency associates with petal number.
(a–b) Distributions of C. hirsuta petal number in 45 natural accessions (a) and a population of RILs derived from Ox and Wa accessions (b, reproduced from (Pieper et al., 2016)). Mean petal number of Ox and Wa are indicated in (a). (c) Average petal number (±s.e.m.) at every floral node in homozygous wild-type and fp2 plants (genotyped at SNP:2:2905982) in field conditions (n = 10 plants from each genotype). Flowers 1–10 were removed from every plant (indicated by dashed line) since petal number in these flowers did not differ significantly between genotypes (p>0.05, Mann-Whitney U test). Seeds produced from remaining flowers on the main inflorescence were harvested. (d) Progeny of 10 wild-type and 10 fp2 mothers were genotyped at SNP:2:2905982 to determine their paternity (n = 1703 wild-type and 1610 fp2 seedlings). Pollination events were considered as selfing when the genotype of the progeny corresponded to the maternal genotype; outcrossing when the genotype of the progeny was heterozygous; and contaminant when the genotype of the progeny corresponded to the other parental genotype. These were likely seed contaminants from the outside of collection bags. Rates of outcrossing were significantly different between genotypes, p<0.05, whereas rates of contaminations were not p>0.05 (Chi-square test with Yates’ continuity correction). Moreover, outcrossing and contaminations per parent plant were not correlated (r2 = 0.025), suggesting that they are independent events.
Figure 5—figure supplement 1

Measurement of fitness traits in wild-type (Ox) and AtAP1::AtAP1:GFP plants.
40 plants of each genotype were grown in standard growth conditions. Average petal number was measured for all flowers of 20 plants, and average seed weight and number of seeds per plant were measured on the 20 remaining plants. Fitness traits were not significantly different between genotypes (Student’s t-test, p>0.05), whereas petal number was (Mann-Whitney U test, p<0.001).
Figure 5—figure supplement 2
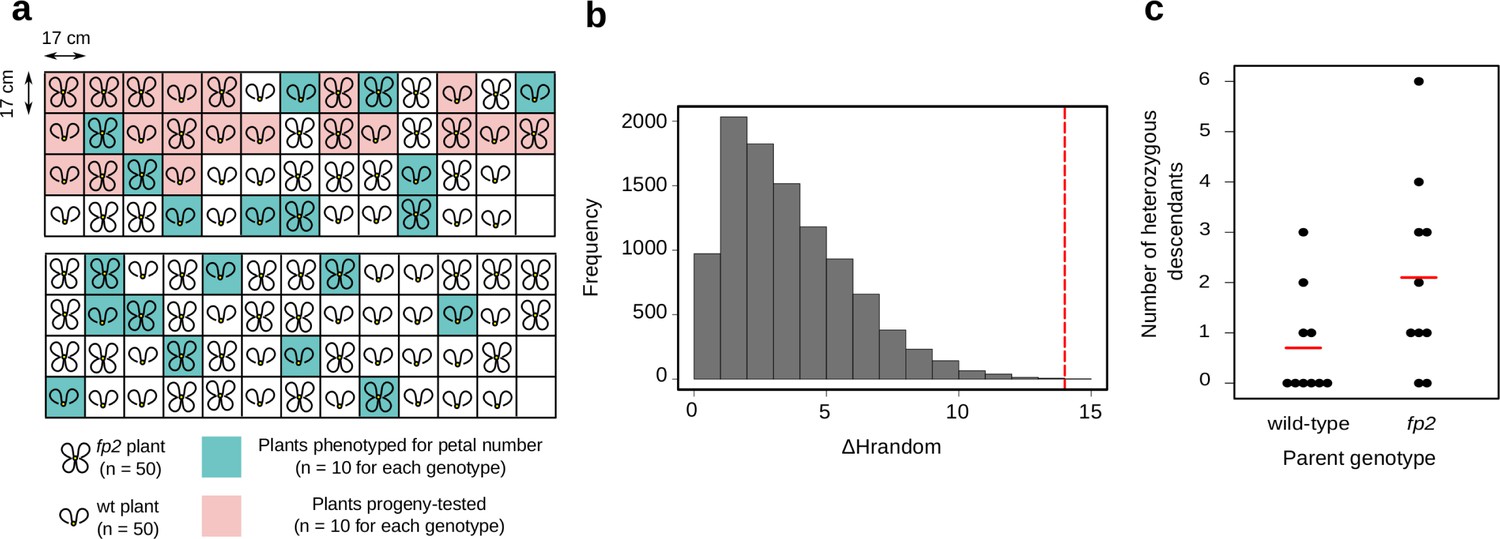
Field experiment to paternity-test progeny of C. hirsuta wild-type and four petals2 (fp2) genotypes.
(a) Experimental design: two plots were designed, each containing 25 plants of each genotype in a random layout. Each plant was genotyped for SNP:2:2905982 (position 2,905,982 on chromosome 2), which is linked to the high petal number phenotype of fp2. Wild-type plants were homozygous for the G allele while fp2 plants were homozygous for the A allele at this SNP. The plants were separated by 17 cm in every direction to prevent adjacent plants from touching. Ten plants of each genotype were phenotyped for petal number along the main inflorescence. (b) Monte-Carlo permutation test shows that the difference in heterozygote offspring (ΔHrandom) between wild-type and fp2 mothers is greater than expected from random assignment of the data to two groups. The observed ΔHrandom (14 heterozygote offspring, red dashed line) differs significantly from the distribution of ΔHrandom from 10000 permutations of the data (p=3e-04). (c) Number of heterozygote offspring per mother plant of wild-type and fp2 genotypes. The increased rate of heterozygosity in fp2 offspring is not due to a single parent but rather reflects a general property of this genotype.
Figure 6

Cartoons depicting the proposed role of AP1 in phenotypic buffering and canalization.
(a) Non-linear relationship between AP1 expression and petal number (black line). The range of AtAP1 expression (orange) is within a zone of high phenotypic robustness, while the range of ChAP1 expression (brown) is outside of this robust zone, such that petal number is sensitive to perturbations. (b) Left: decanalization of petal number in C. hirsuta from an invariant phenotype of four petals, typified by A. thaliana. AP1 divergence (orange arrow) allowed phenotypic expression of QTL (blue arrows) in the C. hirsuta genome to quantitatively affect petal number. Right: cartoons of Waddington’s landscape depicting petal number as a canalized phenotype in A. thaliana (ball rolls down path of least resistance shaped by canals in the landscape); this landscape is underpinned by a genetic network including AP1 (orange rope) and QTL (blue ropes). Decanalization of petal number in C. hirsuta involved regulatory changes in AP1 (cut orange rope) that relaxed its epistasis over QTL that cause petal number to vary (deformations in the landscape). Based on (Waddington, 1957; Paaby and Rockman, 2014).
Author response image 1
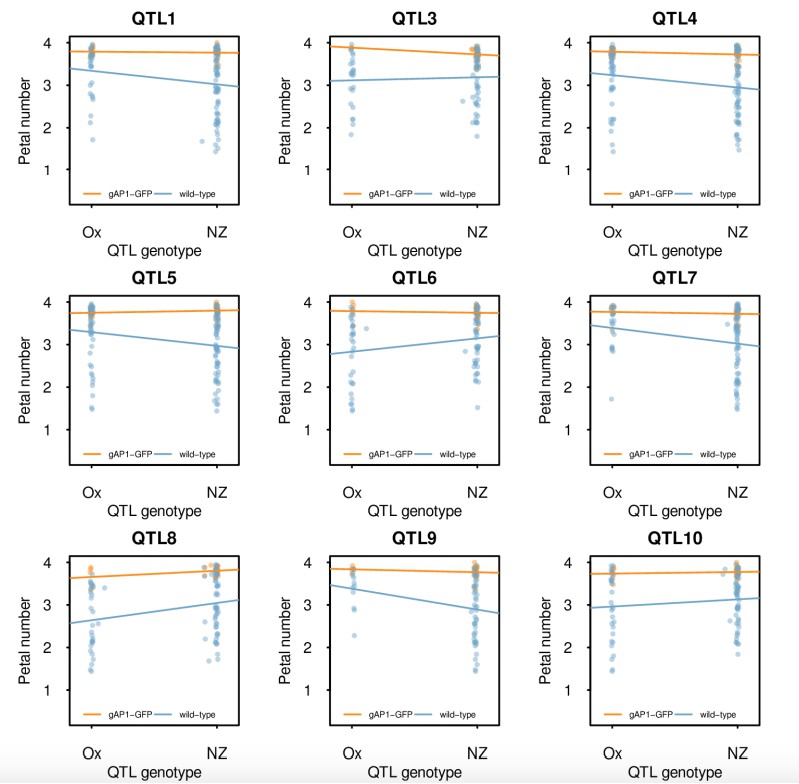
Single marker analysis of petal number QTL in the Ox gAtAP1-GFP × Nz F2 mapping population conditional on the presence of gAtAP1-GFP.
Petal number was regressed on the genotype predictors from the detected QTL in plants with (orange) and without (blue) the gAtAP1-GFP transgene. Heterozygotes were excluded to avoid confounding by dominance effects in this analysis. The points show the petal numbers of the individual F2 plants and the lines the fitted linear model. Note that the regression coefficients are different depending on the presence of gAtAP1-GFP and that these tend to be larger in its absence, in agreement with epistasis.
Author response image 2
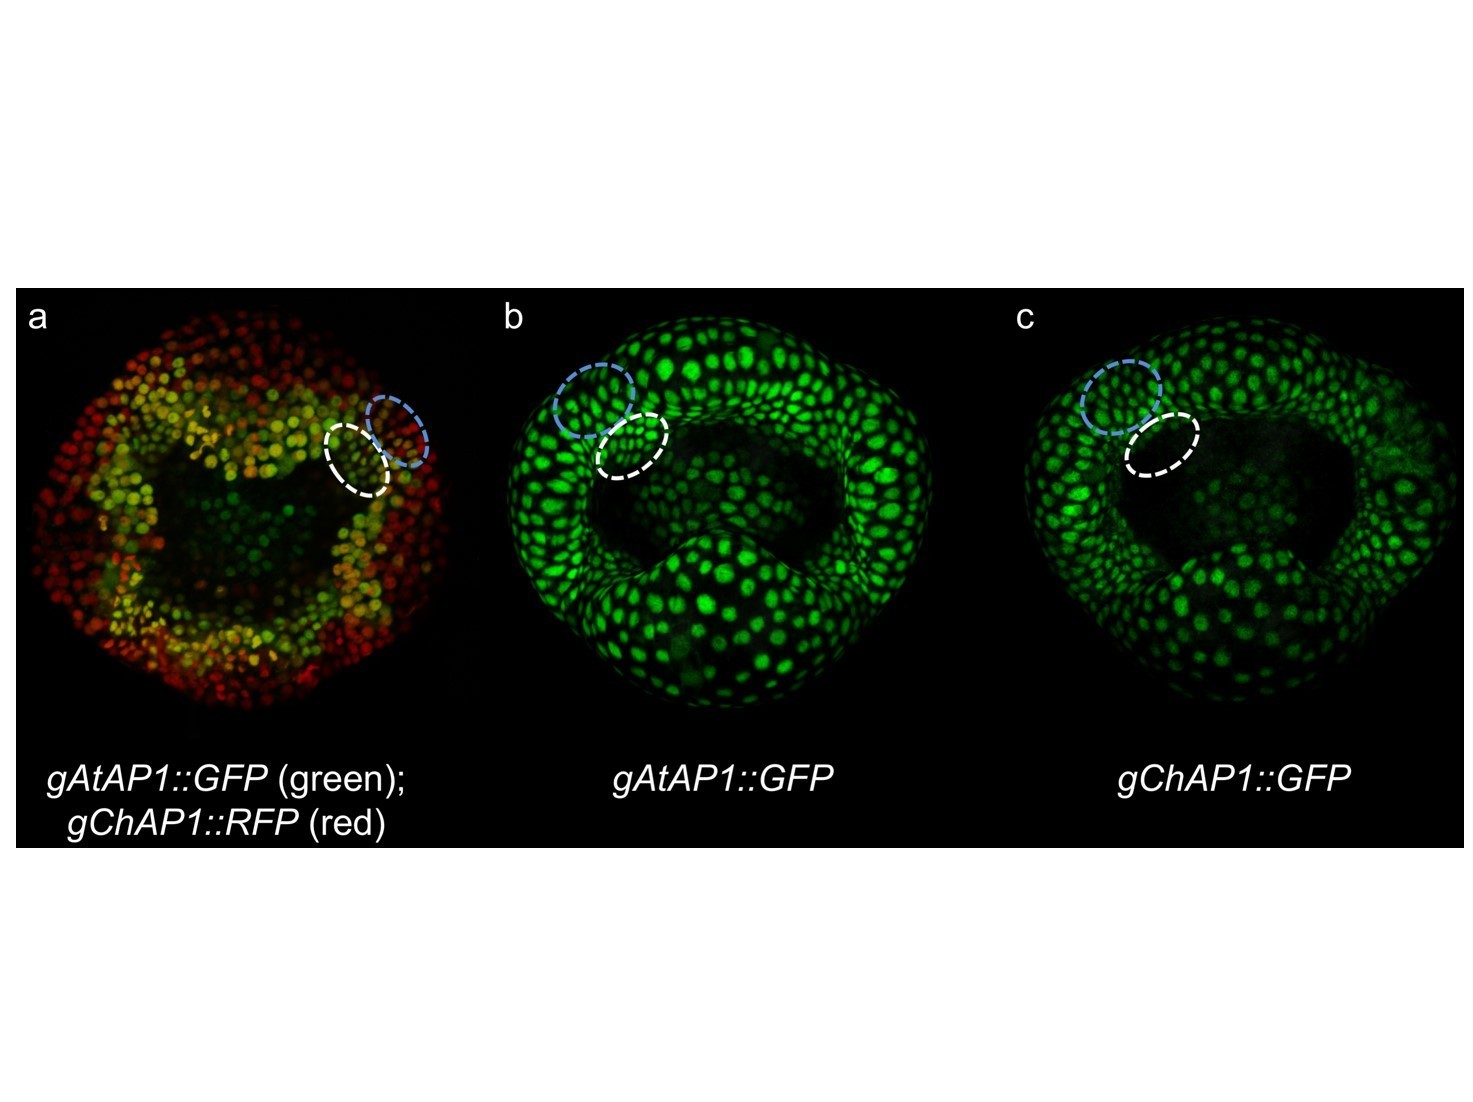
Author response image ChAP1 vs AtAP1 expression in C. hirsuta stage 4 flowers.
Transgenic lines expressing gAtAP1-GFP and gChAP1-RFP (a), gAtAP1-GFP (b) and gChAP1-GFP (c). A quantitative difference between gAtAP1-GFP and gChAP1-RFP can be observed by the predominantly red signal, indicating higher gChAP1 expression, in the region between sepals (marked by blue dashed line in panel a). This quantitative difference can’t be observed by comparing single marker lines (marked by blue dashed lines in panels b and c). A qualitative difference between gAtAP1-GFP and gChAP1-RFP can be observed by the predominantly green signal, indicating higher gAtAP1 expression, in petal initiation sites on the floral meristem (marked by white dashed line in panel a). This qualitative difference can also be observed by comparing single marker lines (marked by white dashed lines in panels b and c).
Tables
Table 1
A. thaliana AP1 masks the effects of C. hirsuta petal number QTL
https://doi.org/10.7554/eLife.39399.011| QTL | Chromosome | Position | QTL effects | |||
|---|---|---|---|---|---|---|
| (cM) | Wild-type plants | gAtAP1 homozygous plants | ||||
| additive | dominance | additive | dominance | |||
| Q1 | 1 | 147.8 | −0.18 | 0.28 | - | - |
| Q2 (gAtAP1) | 2 | 11.9 | n.a. | n.a. | n.a. | n.a. |
| Q3 | 4 | 1.6 | - | 0.32 | - | - |
| Q4 | 4 | 53.9 | −0.19 | - | - | - |
| Q5 | 4 | 98.6 | −0.33 | - | - | - |
| Q6 | 5 | 25.7 | 0.28 | - | - | - |
| Q7 | 6 | 74.8 | −0.28 | - | - | - |
| Q8 | 6 | 116.6 | 0.82 | - | - | - |
| Q9 | 8 | 63.5 | −0.27 | - | - | - |
| Q10 | 8 | 105.6 | 0.38 | - | - | - |
-
n.a. – not available because the effects of all other QTL were determined conditional on zygosity at this QTL. '– '– No significant effect.
Key resources table
| Reagent type (species) or resource | Designation | Source or reference | Identifiers | Additional information |
|---|---|---|---|---|
| Gene (Cardamine hirsuta) | AP1 | Gan et al. (2016) | CARHR062020 | |
| Gene (C. hirsuta) | PTL | Gan et al. (2016) | CARHR209620 | |
| Gene (C. hirsuta) | AG | Gan et al. (2016) | CARHR225900 | |
| Gene (C. hirsuta) | Clathrin/AP2M | Gan et al. (2016) | CARHR174880 | |
| Biological sample (C. hirsuta) | Ox | Hay and Tsiantis (2006) | herbarium specimen voucher Hay 1 (OXF) | |
| Biological sample (Arabidopsis thaliana) | Col-0 | CS60000 | ||
| Genetic reagent (A.thaliana) | pDR5rev::3XVENUS-N7 | Heisler et al., 2005 | ||
| Genetic reagent (C. hirsuta) | pDR5rev::3XVENUS-N7 | Barkoulas et al., 2008 | ||
| Genetic reagent (C. hirsuta) | DR5-v2::3xVenus | Liao et al., 2015 | ||
| Genetic reagent (A.thaliana) | ap1-12 | N6232 | ||
| Genetic reagent (A.thaliana) | ptl-1 | N276 | ||
| Genetic reagent (C. hirsuta) | ag-1 | this paper | EMS mutant | |
| Genetic reagent (C. hirsuta) | fp2 | Pieper et al. (2016) | ||
| Genetic reagent (A.thaliana) | AtPTL::AtPTL:YFP | this paper | 2.9 kb genomic sequence of PTL | |
| Genetic reagent (A.thaliana) | AtPTL::AtPTL:YFP; ptl-1 | this paper | 2.9 kb genomic sequence of PTL | |
| Genetic reagent (C. hirsuta) | AtPTL::AtPTL:YFP | this paper | 2.9 kb genomic sequence of PTL | |
| Genetic reagent (A.thaliana) | AtAP1::AtAP1:GFP | Urbanus et al., 2009 | ||
| Genetic reagent (C. hirsuta) | AtAP1::AtAP1:GFP | Urbanus et al., 2009 | ||
| Genetic reagent (C. hirsuta) | ChAP1::ChAP1:GFP | Monniaux et al., 2017 | ||
| Genetic reagent (A. thaliana) | ChAP1::ChAP1:GFP; ap1-12 | Monniaux et al., 2017 | ||
| Genetic reagent (A. thaliana) | AtAP1::AtAP1:GFP; ap1-12 | Urbanus et al., 2009 | ||
| Genetic reagent (A. thaliana) | ChAP1::ChAP1:RFP; AtAP1::AtAP1:GFP | this paper | 6.6 kb genomic sequence of AP1 | |
| Genetic reagent (C. hirsuta) | ChAP1::ChAP1:RFP; AtAP1::AtAP1:GFP | this paper | 6.6 kb genomic sequence of AP1 | |
| Genetic reagent (A. thaliana) | pAtAP1::AtAP1; ap1-12 | this paper | 2.9 kb promoter sequence of AP1 driving AP1 cDNA | |
| Genetic reagent (A. thaliana) | pAtAP1::ChAP1; ap1-12 | this paper | 2.9 kb promoter sequence of AP1 driving AP1 cDNA | |
| Genetic reagent (A. thaliana) | pChAP1::ChAP1; ap1-12 | this paper | 2.9 kb promoter sequence of AP1 driving AP1 cDNA | |
| Genetic reagent (A. thaliana) | pChAP1::AtAP1; ap1-12 | this paper | 2.9 kb promoter sequence of AP1 driving AP1 cDNA | |
| Genetic reagent (C. hirsuta) | Ox gAtAP1-GFP × Nz F2 | this paper | 312 individuals used for QTL analysis | |
| Software | MorphoGraphX | Barbier de Reuille et al., 2015 |
Additional files
-
Transparent reporting form
- https://doi.org/10.7554/eLife.39399.024
Download links
A two-part list of links to download the article, or parts of the article, in various formats.
Downloads (link to download the article as PDF)
Open citations (links to open the citations from this article in various online reference manager services)
Cite this article (links to download the citations from this article in formats compatible with various reference manager tools)
The role of APETALA1 in petal number robustness
eLife 7:e39399.
https://doi.org/10.7554/eLife.39399


