Mitochondrial biogenesis is transcriptionally repressed in lysosomal lipid storage diseases
- University Medical Center Goettingen, Germany
- International Max-Planck Research School in Neuroscience, Germany
- Friedrich-Alexander University Erlangen-Nürnberg (FAU), Germany
- University of Helsinki, Biomedicum Helsinki, Finland
Figures
Figure 1 with 2 supplements
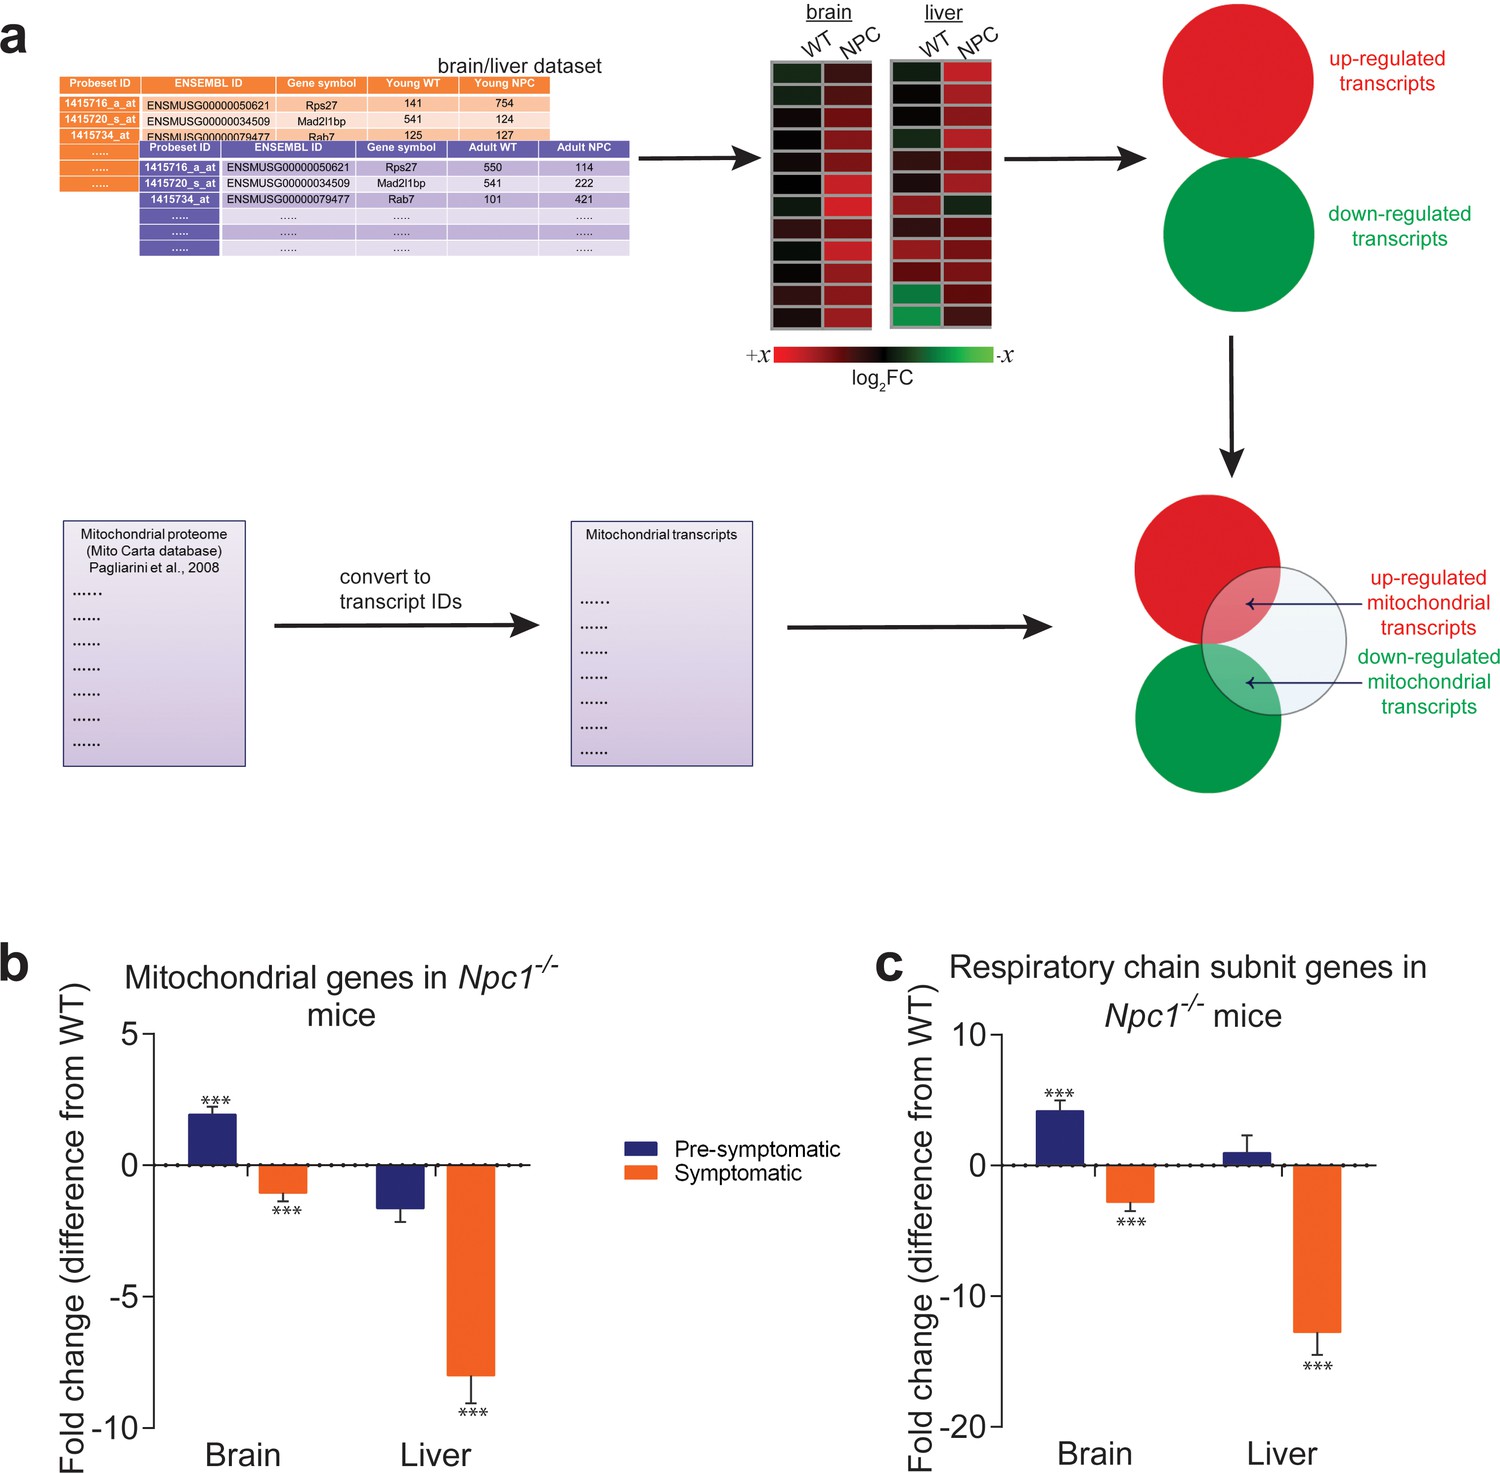
Mitochondrial genes are down-regulated in brain and liver of symptomatic NPC1 KO mice.
(a) Schematic representation of the in silico approach. The list of mitochondria-related genes was built by converting the MitoCarta proteome inventory into a transcript list. This was then crossed with the differentially-expressed gene list of brain and liver in symptomatic and asymptomatic NPC1 KO (n = 11; brain, n = 6; liver) versus WT (n = 5; brain, n = 6; liver) mice. (b–c) Decreased expression of genes encoding ~1000 mitochondrial proteins (panel b) and ~100 respiratory chain subunits (panel c) in brain and liver of NPC1 KO mice. The plots (b–c) represent the variation in gene expression comparing the fold change between the average expression in NPC1 KO over NPC1 WT. Error bars denote standard error of the mean (s.e.m.). This variation is represented as the difference from average WT expression (e.g., a 20% increase in the mutant mice is shown as 20%, while −25% denotes a 25% decrease). Statistical analyses using t-test with Bonferroni correction, adjusted p-values ***p<0.001.
Figure 1—figure supplement 1
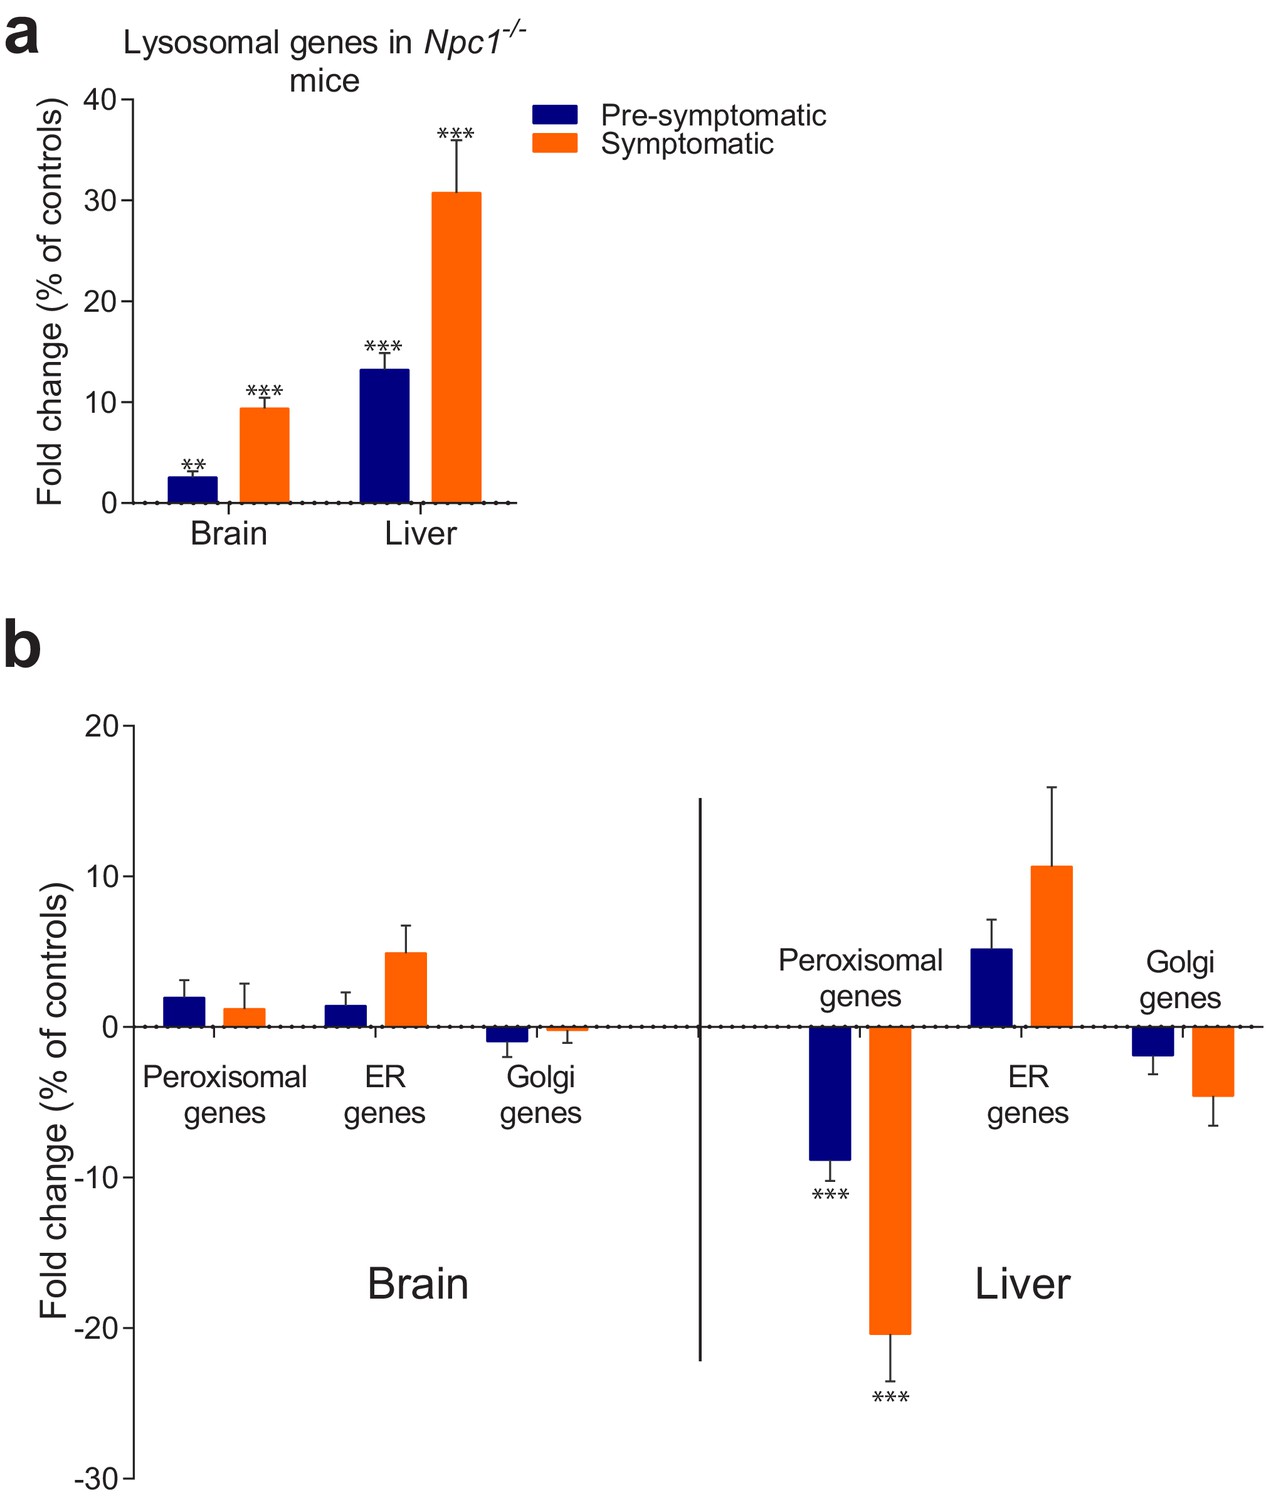
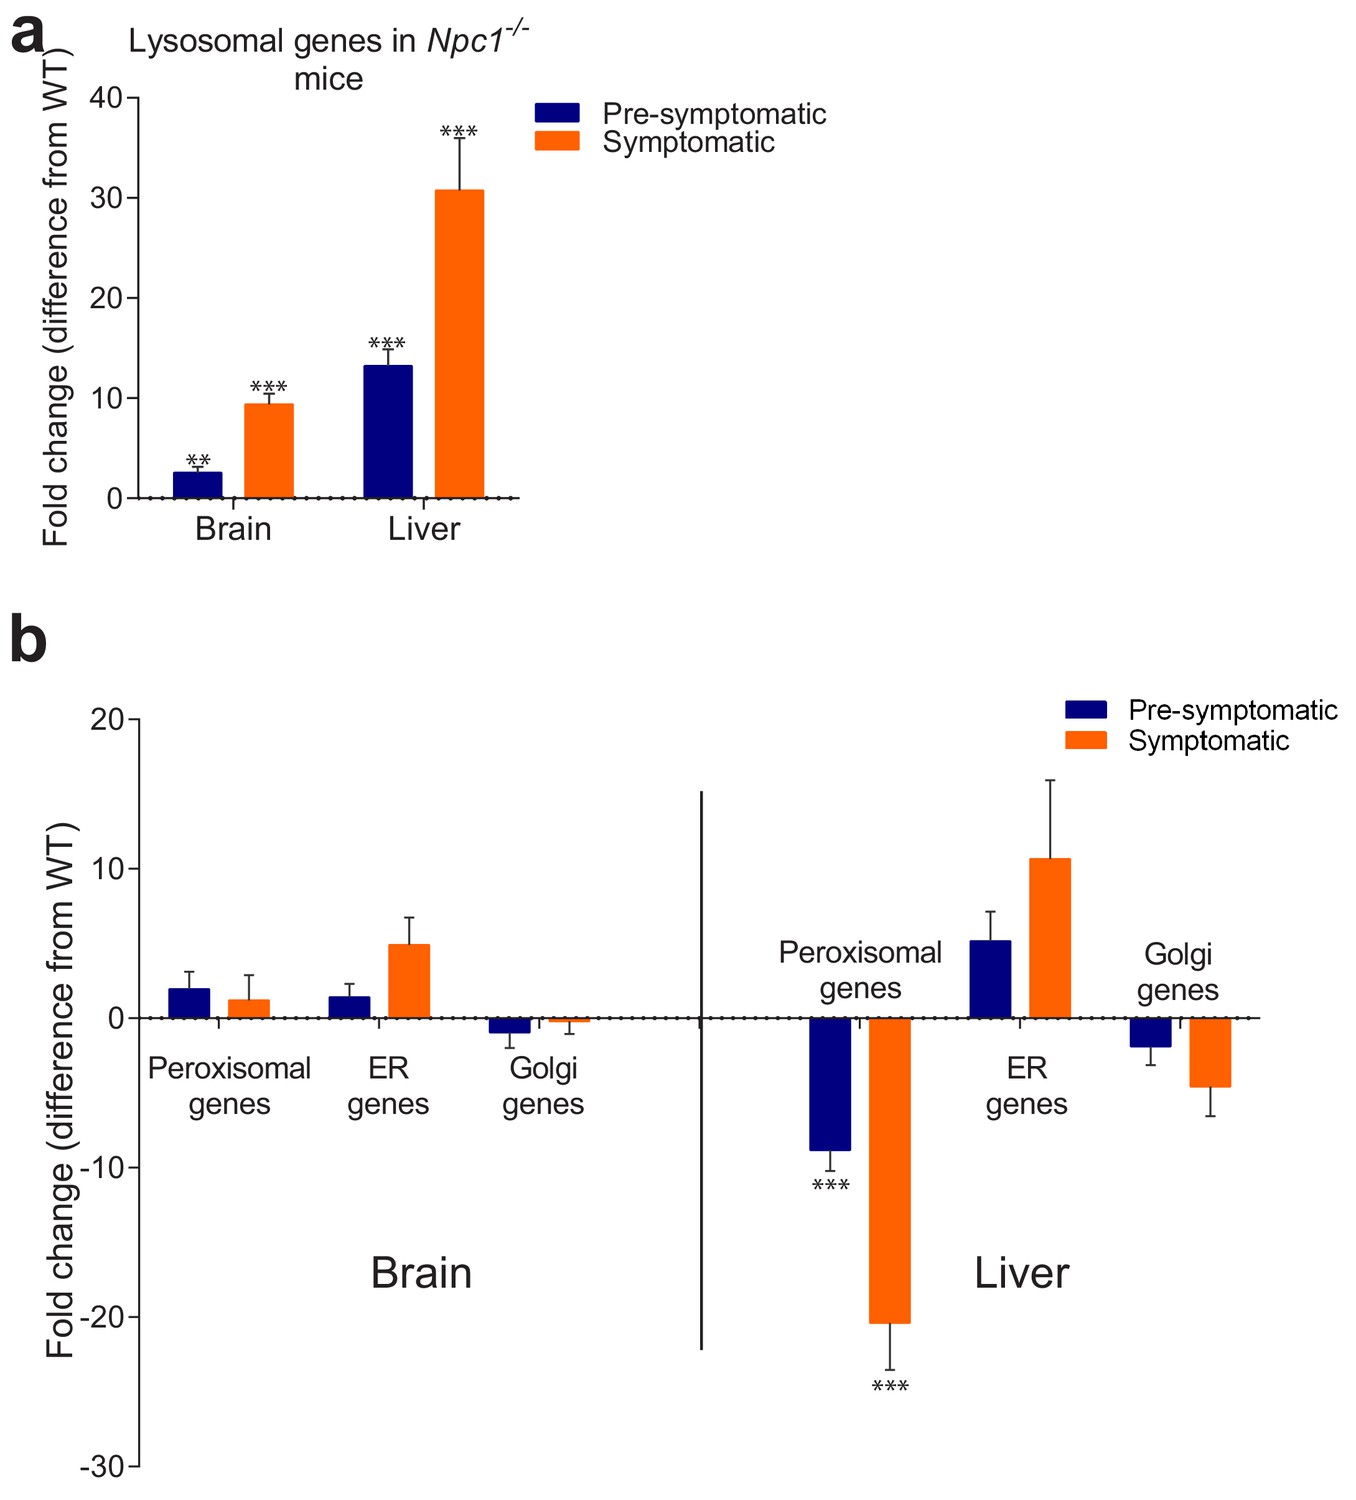
Behaviour of organelle-specific gene lists in NPC1 KO tissues.
(a) The average expression of 435 lysosomal genes was higher both in brain and liver of NPC1 KO, even in asymptomatic mice, and increased further upon disease onset. (b) Expression of 86 Golgi-related and 297 endoplasmic reticulum (ER)-related genes did not change significantly between NPC1 KO and WT. Expression of 254 peroxisomal genes was not affected in NPC1 KO brain, but was significantly reduced in asymptomatic NPC1 KO liver and decreased further upon disease onset. The plots represent average fold change ± s.e.m. for all genes in the organelle-specific list. T-test p-value (comparing each organelle list in NPC1 KO and WT) with Bonferroni correction, **p<0.01 ***p<0.001, n = 6 (NPC1 KO and WT liver), n = 5 (NPC1 WT brain) and n = 11 (NPC1 KO brain).
Figure 1—figure supplement 2
Disease progression changes in the expression of mitochondria-related genes in brain and liver of NPC1 KO mice.
Of the 1049 mitochondria-related genes analyzed, we determined how many of them were in the differentially-expressed gene (DEG) list of NPC1 KO mice brain and liver. The dot plots show all mitochondria-related genes, with the ones significantly changed between NPC1 KO and WT denoted in yellow. (a–b) Volcano plot depicting the fold change and significance p-value of mitochondria-related genes in pre-symptomatic (panel a) and symptomatic (panel b) NPC1 KO brain versus WT. Note the increase in differentially-regulated mitochondrial genes (yellow dots) with the onset of the symptoms. (c) Sharp increase (~4 fold) in the proportion of mitochondrial genes that are differentially-regulated in the asymptomatic and symptomatic NPC1 KO brain compared to WT. Fisher's exact test p-value ***p<0.001. (d–e) Volcano plot depicting the fold change and significance p-value of mitochondria-related genes in pre-symptomatic (panel d) and symptomatic (panel e) NPC1 KO liver versus WT. Note the increase in differentially-regulated mitochondrial genes (yellow dots), mostly in the down-regulated side, with the onset of the symptoms. (f) Sharp increase (~5 fold) in the proportion of mitochondrial genes that are differentially-regulated in the asymptomatic and symptomatic NPC1 KO liver compared to WT. Fisher's exact test p-value ***p<0.001, n = 6 (NPC1 KO and WT liver), n = 5 (NPC1 WT brain) and n = 11 (NPC1 KO brain).
Figure 2

Impaired mitochondrial biogenesis and function in mouse and cellular models of Niemann-Pick disease.
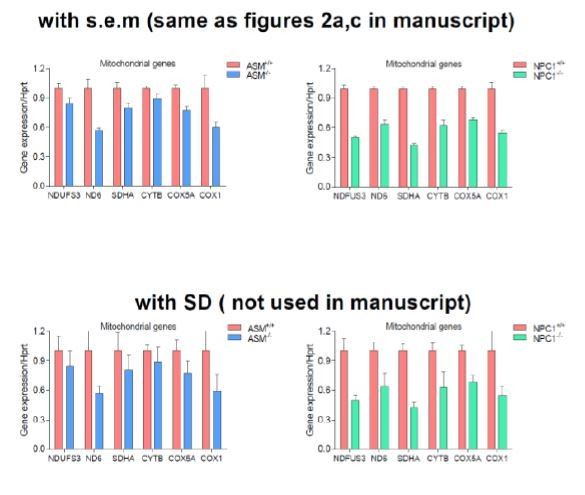
The transcript levels of several nuclear-encoded and mitochondrial DNA (mtDNA)-encoded mitochondria-related genes were measured. (a) transcript levels of mitochondria-related genes are decreased in the liver of NPC1 knockout mice (NPC1 KO), a model of Niemann-Pick type C. The plot shows mean ± s.e.m. T-test p-values ***p<0.001, n = 9 (b) transcript levels of mitochondria-related genes are decreased in the fibroblasts of a patient with compound heterozygote NPC1 mutations (GM18398 Coriell Repository). The plot shows mean ± s.e.m. T-test p-values *p<0.05 **p<0.01 ***p<0.001, n = 3 (c) transcript levels of mitochondria-related genes are decreased in the liver of acid sphingomyelinase knockout (ASM KO) mice, a model of acid sphingomyelinase deficiency. The plot shows mean ± s.e.m. T-test p-values *p<0.05 **p<0.01, n = 8. (d) transcript levels of mitochondria-related genes are decreased in fibroblasts from a patient with acid sphingomyelinase deficiency (only 5% of ASM activity left) and in the ASM-2 patient line. The plot shows mean ± s.e.m. T-test p-values *p<0.05 **p<0.01 ***p<0.001, n = 3. Further characterization of the lysosomal defects in the fibroblasts of this patient are presented in Figure 3—figure supplement 1. (e–f) mitochondrial superoxide levels, as assessed by the fluorescence intensity of the superoxide-sensitive mitochondria-targeted dye MitoSox, measured by flow cytometry, are increased in NPC fibroblasts (panel e) and in ASM-1 and ASM-2 patient fibroblasts (panel f); histogram plots are representative of three biological replicates. Quantifications denote mean ± s.e.m..T-test p-values ***p<0.001, n = 3.
Figure 3 with 4 supplements
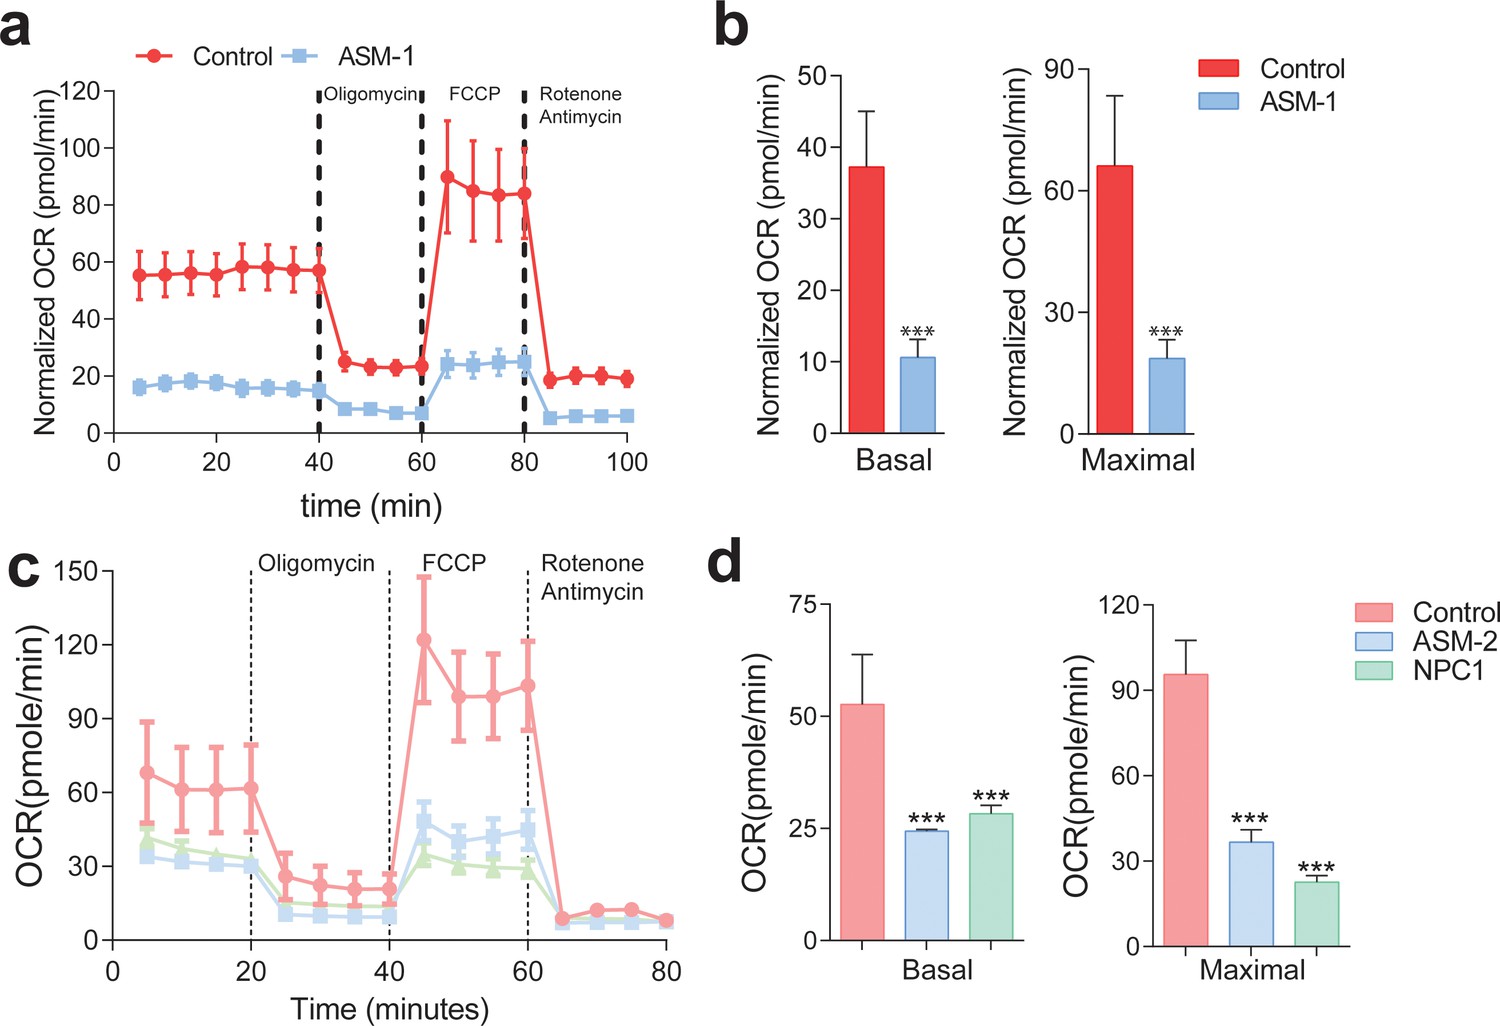
Mitochondrial function and mitochondrial mass are impaired in acid sphingomyelinase (ASM)- and NPC1-deficient patient fibroblasts.
(a,c) ASM- and NPC1-deficient fibroblasts have substantially lower O2 Consumption Rate (OCR) than controls. OCR was measured using whole cells, sequentially in basal conditions (complete medium), after oxidative phosphorylation inhibition using the ATPase inhibitor oligomycin, after uncouling the respiratory chain from oxidative phosphorylation using the uncoupler FCCP, and after inhibition of the respiratory chain using complex I inhibitor rotenone and complex III inhibitor antimycin. The measurements were made in a 96-well plate using a SeaHorse Extracellular Flux analyser. The mean ± s.e.m. of at least eight wells per cell line is plotted over time. OCR was normalized to the amount of protein in each well. (b,d) Reduced basal and maximal (uncoupled) OCR in ASM1-deficient fibroblasts quantified from the curves in (a) and in ASM2- and NPC1- deficient fibroblasts quantified from profiles in (c) and bar graphs are presented as mean ± s.e.m. T-test p-value ***p<0.001, n = 3.
Figure 3—figure supplement 1

Validation of lysosomal defects in patient fibroblasts and causal relationship of defects to mitochondrial biogenesis and function.
The ASM-1 patient cells used in this manuscript have 5% left of acid sphingomyelinase activity, and present the expected signs of lysosomal impairment, specifically (a) decreased autophagic capacity with accumulation of autophagic substrates (p62 also known as Sequestosome 1, Sqstm1) and autophagosomes, as assessed by the autophagosomal marker LC3B-II. Blots are representative of biological triplicates and adjacent plots are depicted as average ± s.e.m., n = 3. T-test p-value **p<0.01 (b) decreased lysosomal proteolytic capacity, as assessed by the rate of DQ-BSA degradation by the lysosomal proteases in whole cells normalized to protein content. Quantification represents mean ± s.e.m., n = 3 (c–e) transfection of all patient lines with the corresponding wildtype protein rescues mitochondrial respiration as assessed by increased OCRs in ASM deficient lines with cherry ASM overexpression and in NPC1 deficient line with NPC1wt overexpression. Quantifications are presented underneath each seahorse profile in panel d) as average ± s.e.m., n = 2 with eight technical replicates per condition. T.test p-value **p<0.01 and ***p<0.001. (e) Mitochondrial gene expression, as assessed by qPCR, is increased in all patient lines following overexpression of corresponding wiltype proteins. The data is presented in a heatmap for n = 3, in which red denotes increased expression in wiltype protein-overexpressing patient lines compared to white, which represents no change relative to the control values.
Figure 3—figure supplement 2
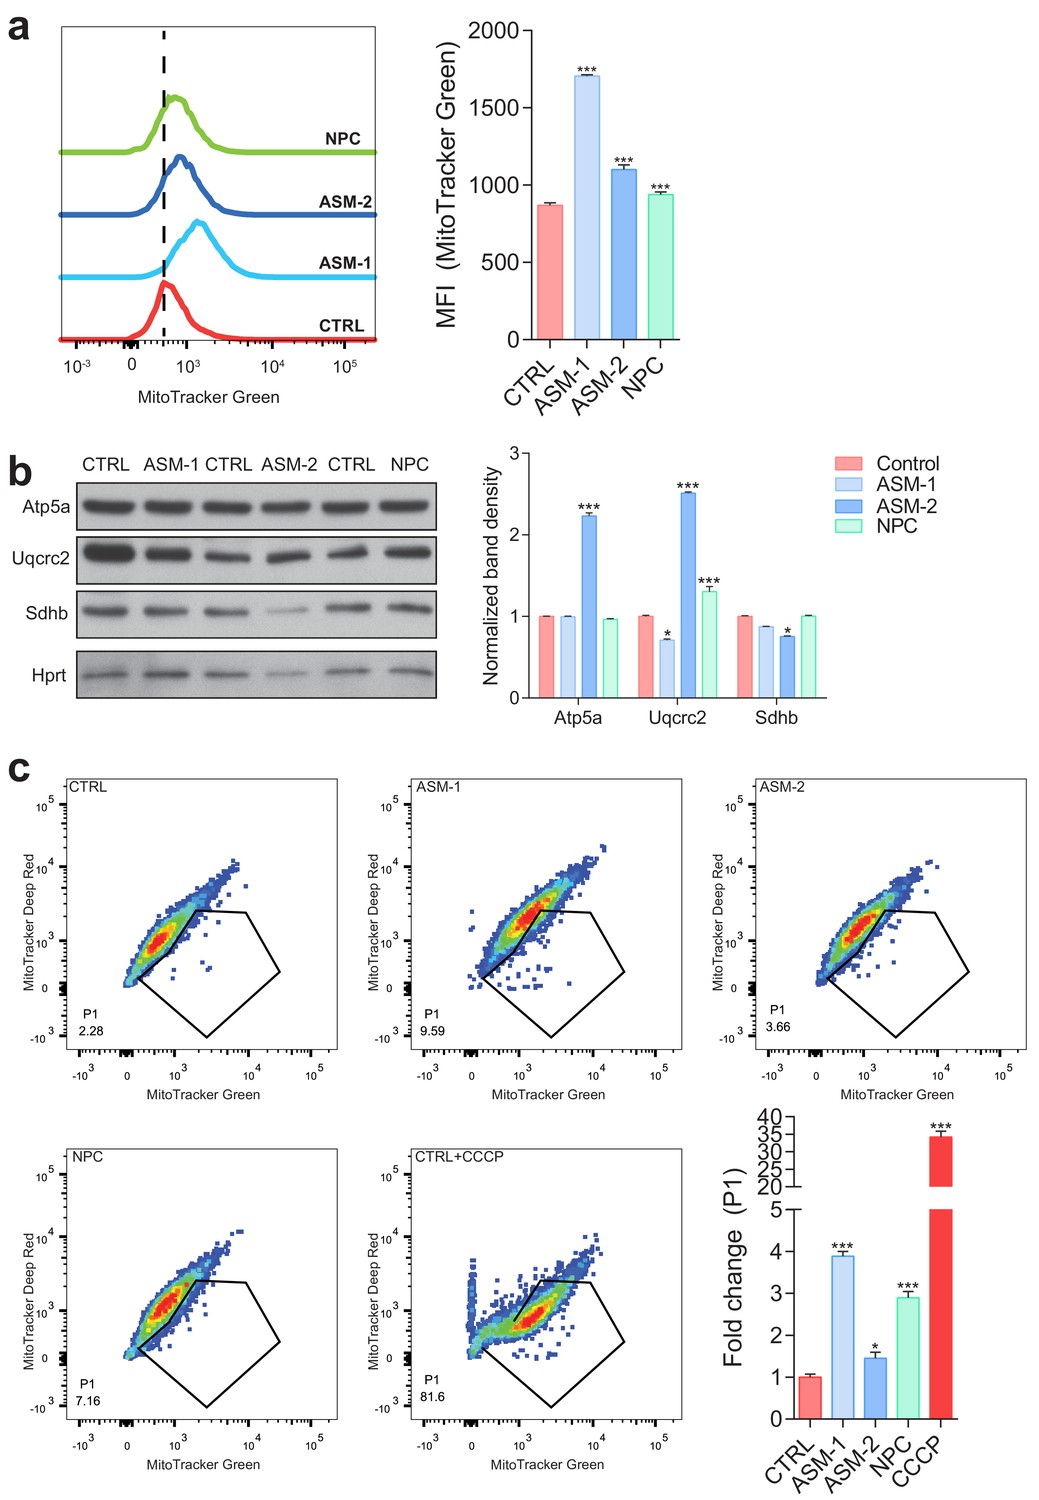
Increased content of dysfunctional mitochondria in ASM-deficient and NPC fibroblasts.
(a) Mitochondrial mass was assessed by flow cytometry with MitoTracker Green staining. Histogram plot shows a right shift in intensity of MitoTracker Green dye in ASM and NPC patient cells relative to controls. Quantifications are depicted as mean fluorescent intensity (MFI) ± s.e.m., n = 5 with two technical replicates each. (b) Mitochondrial mass as assessed by western blot of mitochondrial protmean ± s.e.m., n = 3. T-test p-value *p<0.05, ***p<0.001. (c) Co-staining of MitoTracker Green and MitoTracker Deep Red dyes in ASM and NPC deficient fibroblasts showing increased population of dysfunctional mitochondria (MitoTracker Green positive and MitoTracker Deep Red negative population (P1) by flow cytometry). Quantification depicts fold change of P1 population shown as average ± s.e.m., n = 5 with two technical replicates.
Figure 3—figure supplement 3
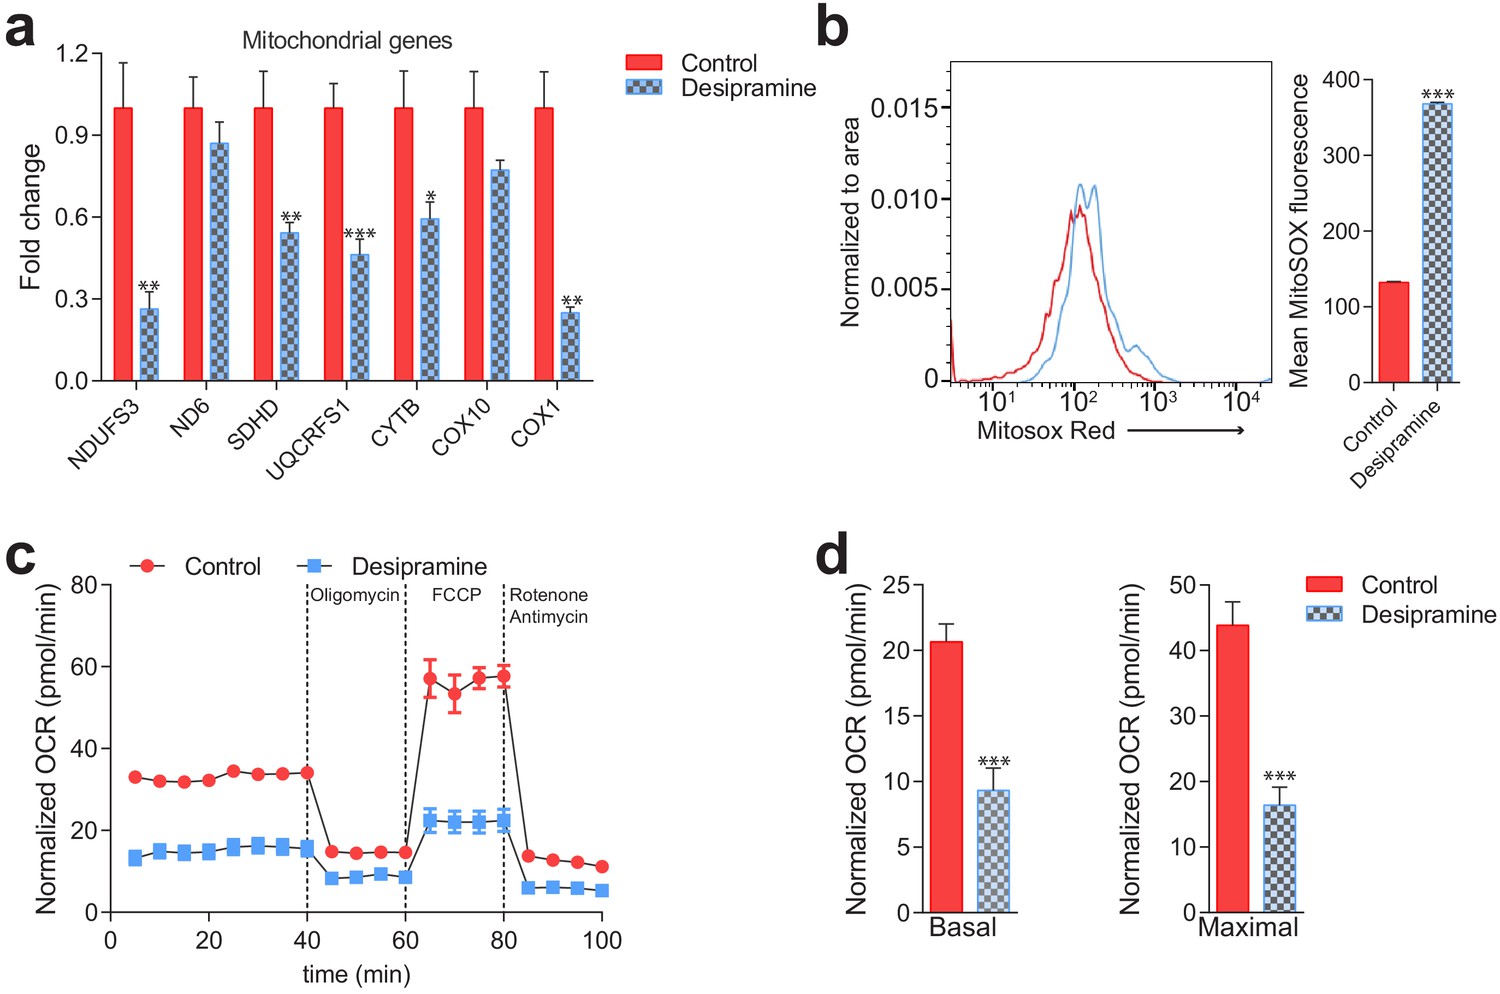
Mitochondrial deficits in control fibroblasts treated with desipramine 40 µM for 72 hr (inhibitor of acid sphingomyelinase).
(a) Transcript levels of mitochondrial genes depicted as mean ± s.e.m., n = 3. T-test p-values *p<0.05 **p<0.01 ***p<0.001. Sterile distilled water used as vehicle control. (b) Increased mitochondrial superoxide levels, as assessed by MitoSox intensity, in desipramine-treated cells measured by flow cytometry. The plot shows MFI ± s.e.m., n = 5. T-test p-values ***p<0.001 (c–d) Decreased Oxygen consumption rate (OCR) in desipramine-treated fibroblasts under the indicated conditions, quantified in panel d) as average ± s.e.m., n = 2 of at least eight technical replicates each. Sterile distilled water used as vehicle control.
Figure 3—figure supplement 4

Mitochondrial deficits in control fibroblasts treated with U18666A 10 µM for 72 hr (inhibitor of NPC1).
(a) Mitochondrial gene expression levels in U1866A treated cells shown as mean ± s.e.m., n = 3. T-test p-values *p<0.05 **p<0.01 ***p<0.001. DMSO used as vehicle control. (b) Increased mitochondrial superoxide levels, as assessed by MitoSox intensity, in U18666A-treated cells quantified as mean ± s.e.m., n = 5. T-test p-values ***p<0.001 (c–d) Decreased Oxygen consumption rate (OCR) in U18666A-treated fibroblasts under the indicated conditions, quantified in panel d) as mean ± s.e.m. n = 2, with eight technical replicates. DMSO used as vehicle control.
Figure 4 with 5 supplements
Transcription factors Etv1 and Klf2 are induced in Niemann-Pick and involved in the regulation of mitochondrial biogenesis.
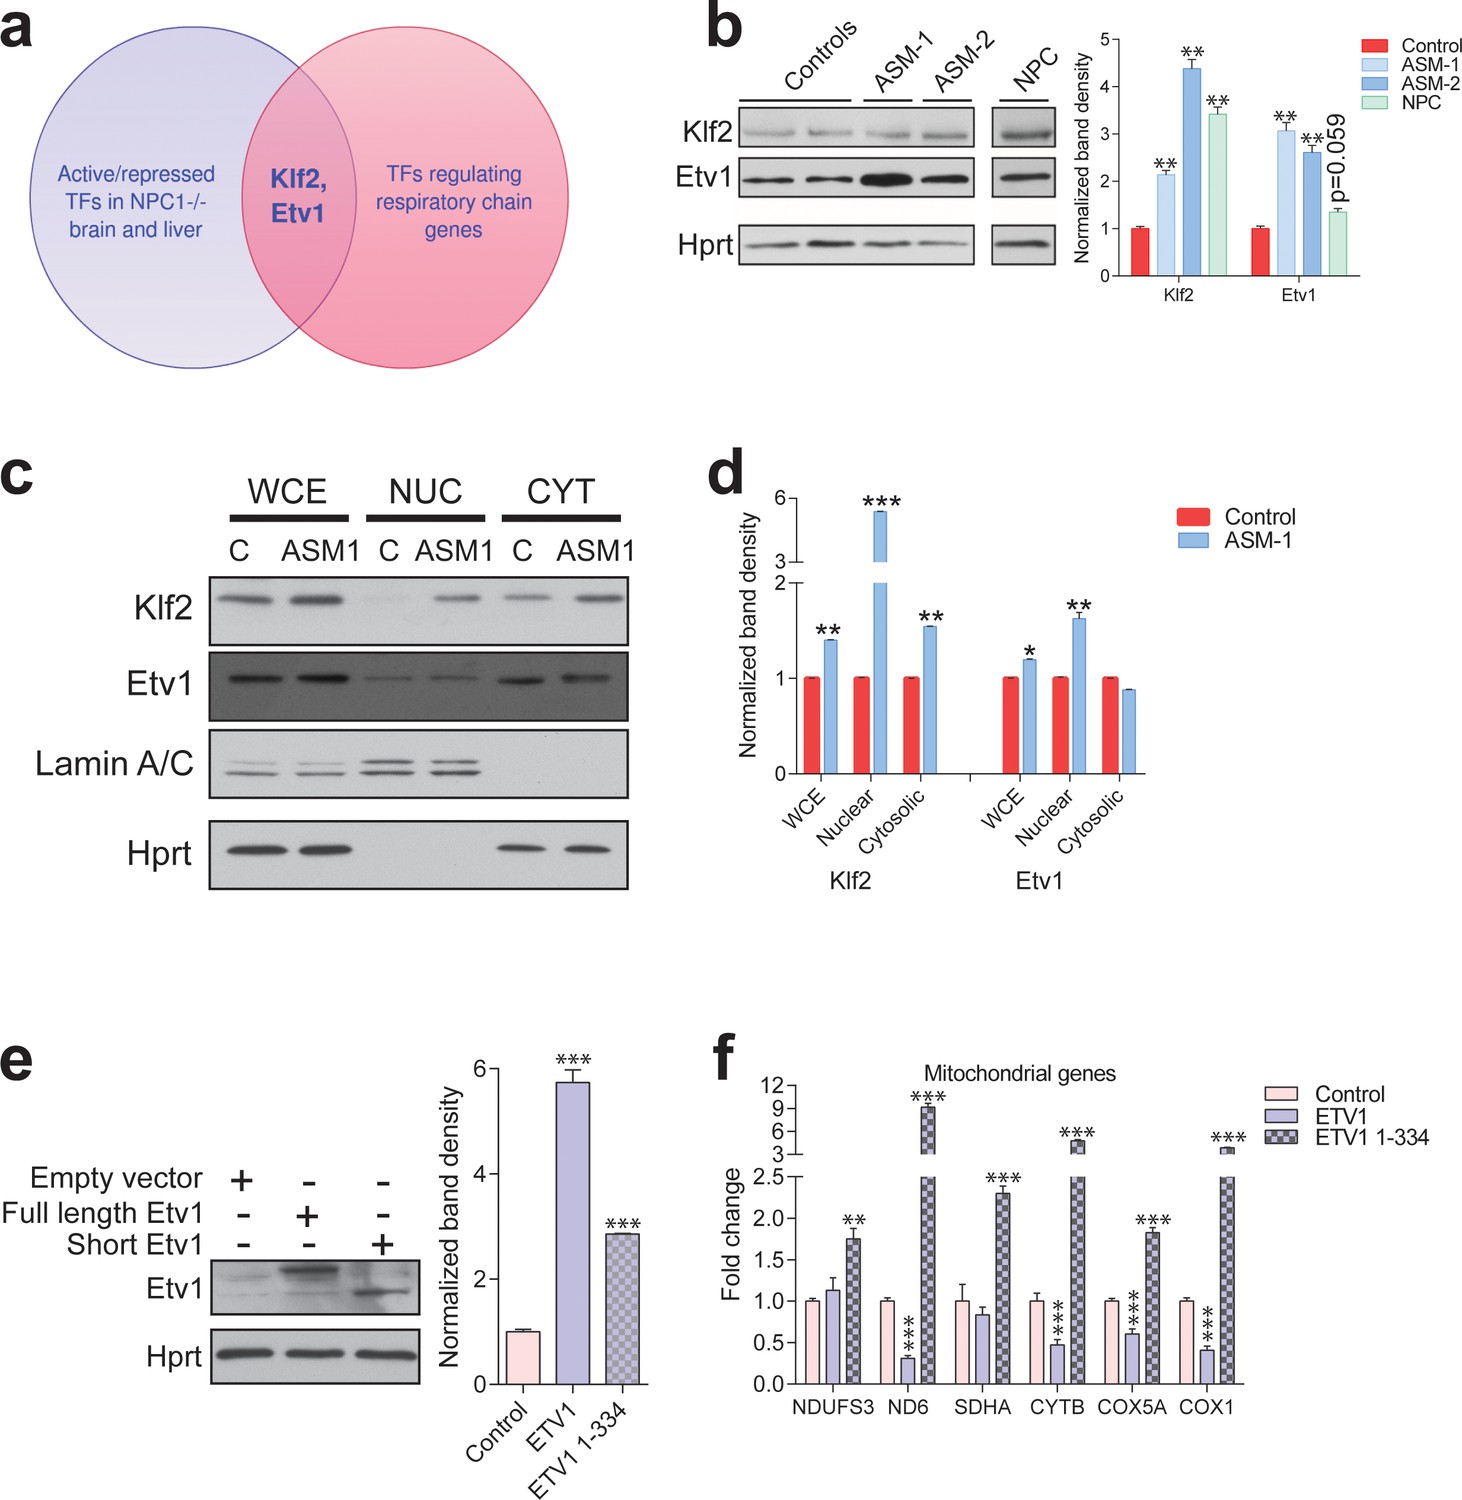
(a) Venn diagram illustrating the intersection between the list of transcription factors (TFs) that are significantly activated or repressed in tissues of Npc1-/- mice, and the list of TFs that are predicted to regulate the expression of mitochondrial respiratory chain genes, which yields KLF2 and ETV1 as hits. (b) Increased Klf2 and Etv1 protein levels in ASM-deficient and NPC fibroblasts, shown in a representative (out of three biologically independent experiments) western blot of whole cell extracts, with quantification (mean ± s.e.m., n = 3) of band densities in the adjacent plot. T-test p-values **p<0.01 (c) Increased nuclear localization of Klf2 and Etv1 in ASM-deficient fibroblasts. Blots are representative of biological triplicates with quantifications in (d) shown as mean ± s.e.m. T-test p-values *p<0.05, **p<0.01 and ***p<0.001 (e) Overexpression of ETV1WT (full length ETV1) and of ETV11-334, lacking the C-terminus which includes the DNA-binding domain. Representative western blot, quantification of band densities normalized to empty vector control from two independent experiments with two technical replicates each on the right panel (mean ± s.e.m.) (f) Overexpression of ETV1WT significantly down-regulates the transcript levels of most mitochondria-related genes, while ETV11-334, unable to bind DNA, causes an increase in transcript levels. The plots show mean ± s.e.m. T-test p-values **p<0.01 ***p<0.001, n = 2 with three technical replicates each.
Figure 4—figure supplement 1
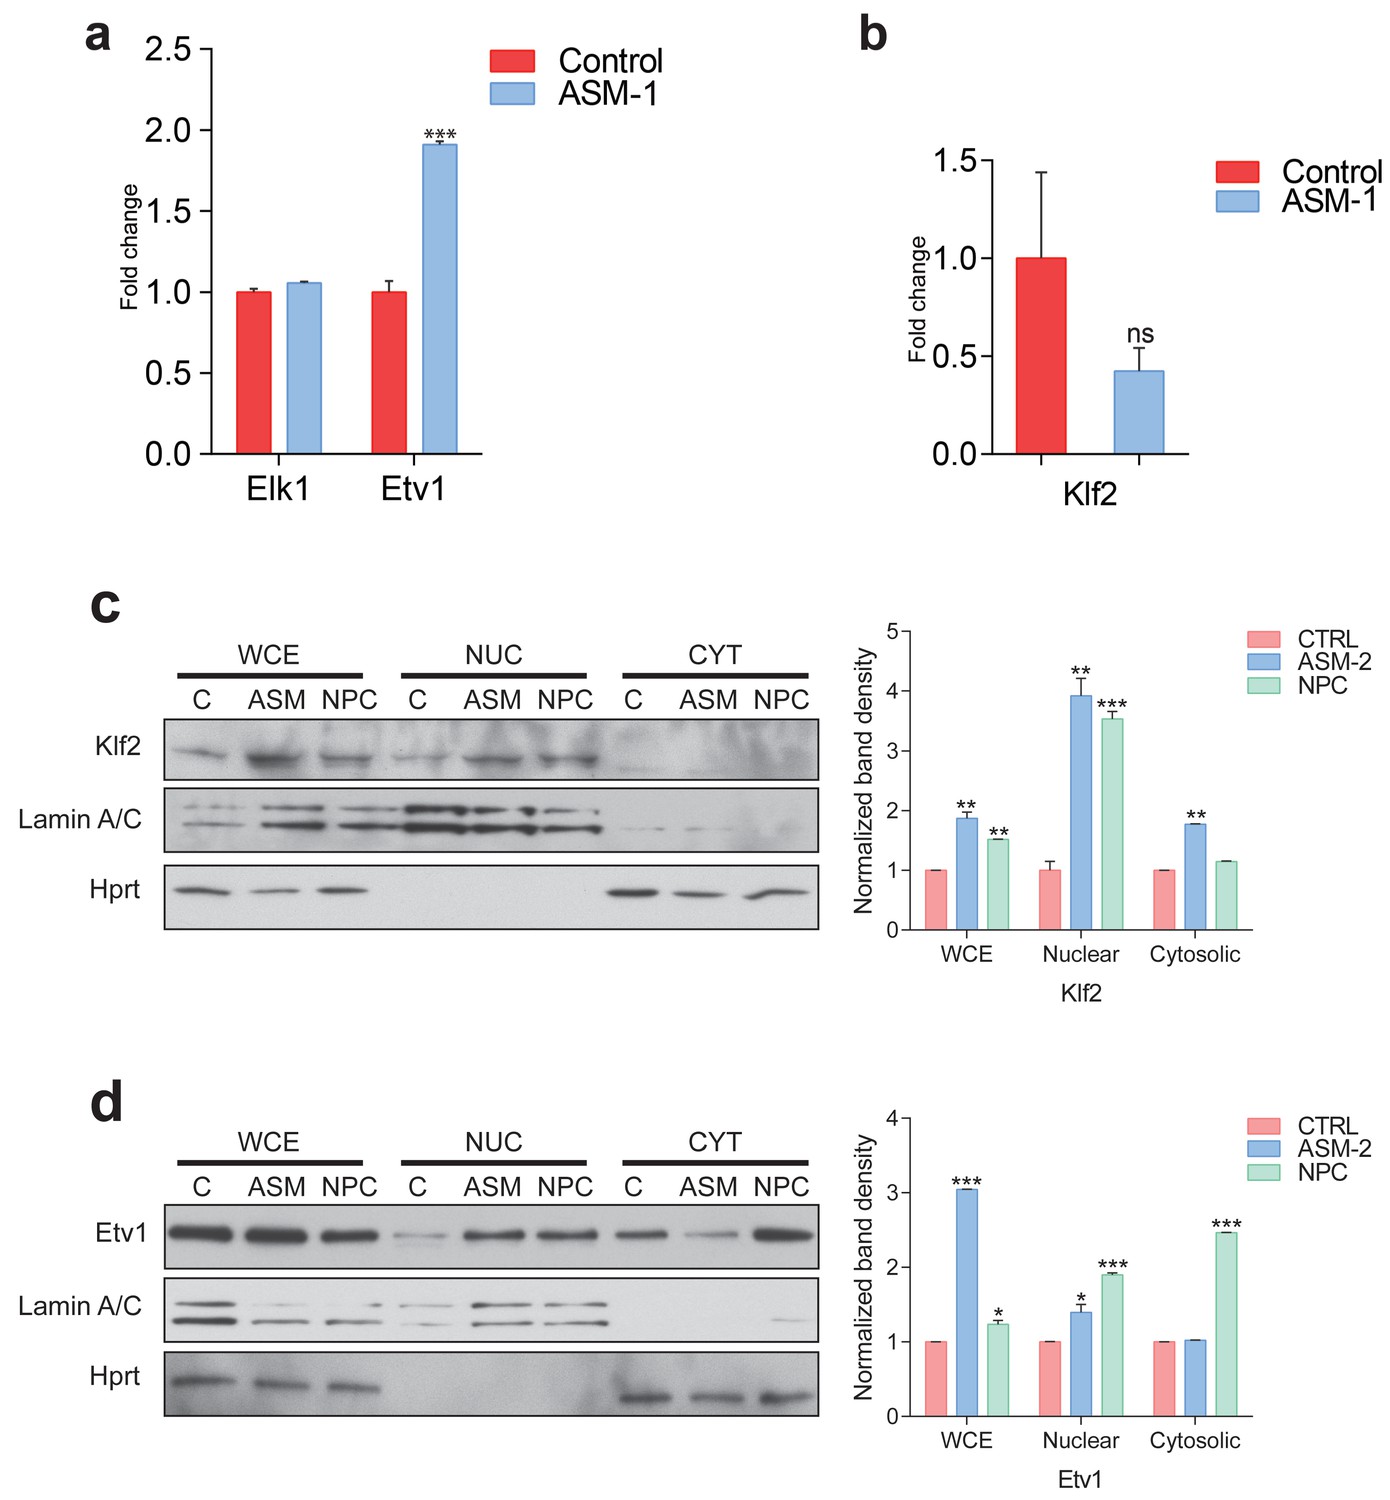
Etv1 and Klf2 levels in ASM-deficient and NPC fibroblasts.
(a) Transcript levels of ETS family members ELK1 and ETV1 in ASM-deficient fibroblasts, measured by qPCR. Plots represent mean ± s.e.m., n = 3. (b) Transcript levels of KLF2 in ASM-deficient fibroblasts, measured by qPCR and depicted as mean ± s.e.m., n = 3. T-test p-value ***p<0.001 and ns p>0.05. (c–d) Representative of blots of biological triplicates showing increased nuclear localizations of KLF2 in panel (c) and ETV1 in panel (d) in ASM-deficient fibroblasts and NPC patient fibroblast obtained from the Coriell Institute. Adjacent plots show mean ± s.e.m., n = 3.
Figure 4—figure supplement 2
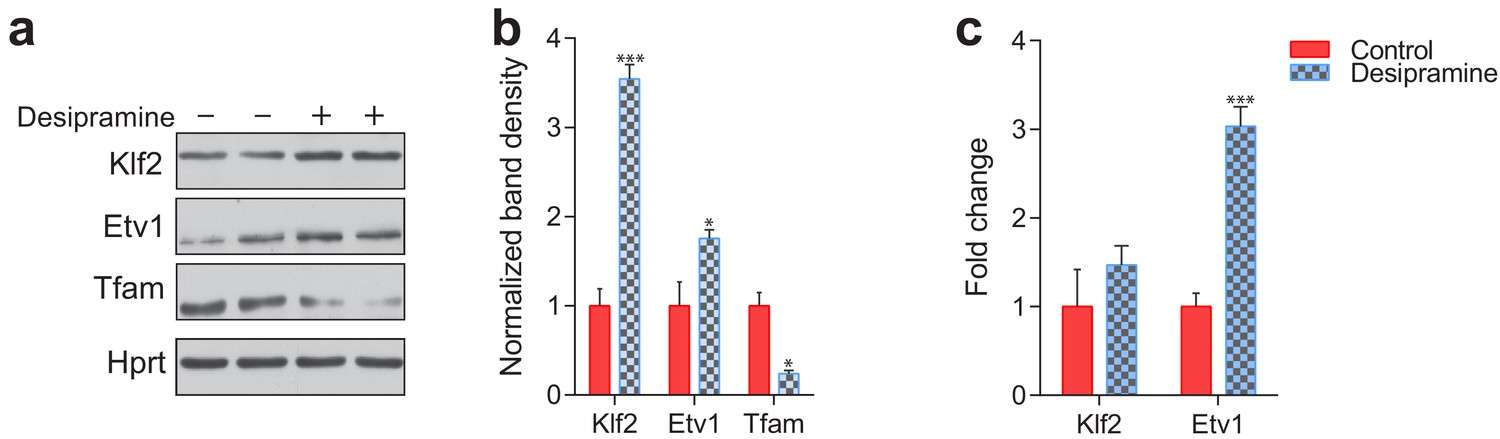
Etv1 and Klf2 levels in desipramine-treated fibroblasts.
(a) KLF2 and ETV1 protein levels are increased and mitochondrial protein TFAM is reduced in desipramine-treated fibroblasts, as assessed by western blot. (b) Quantification of the western blot shows average ± st.dev., n = 2 with technical duplicates. T-test p-value *p<0.05 ***p<0.001 (c) Transcript level of KLF2 is not changed and ETV1 is increased in desipramine-treated fibroblasts, as measured by qPCR. Quantification shows average ± s.e.m., n = 3. T-test p-value ***p<0.001, ns p>0.05.
Figure 4—figure supplement 3

Increased expression of mitochondria-related genes in the absence of KLF2.
Using a publicly-available transcriptional dataset of erythroid cells obtained from KLF2 KO (n = 4) and WT (n = 4) mice, we found that the average expression of ~1000 mitochondria-related genes is increased ~25% in KLF2 KO, while the expression of ~100 respiratory chain subunits is increased ~40% in KLF2 KO. These results support a repressive role of KLF2 on mitochondrial biogenesis. Plot shows average ± s.e.m. of logFC of all genes in the gene list. T-test with Bonferroni correction ***p<0.001.
Figure 4—figure supplement 4
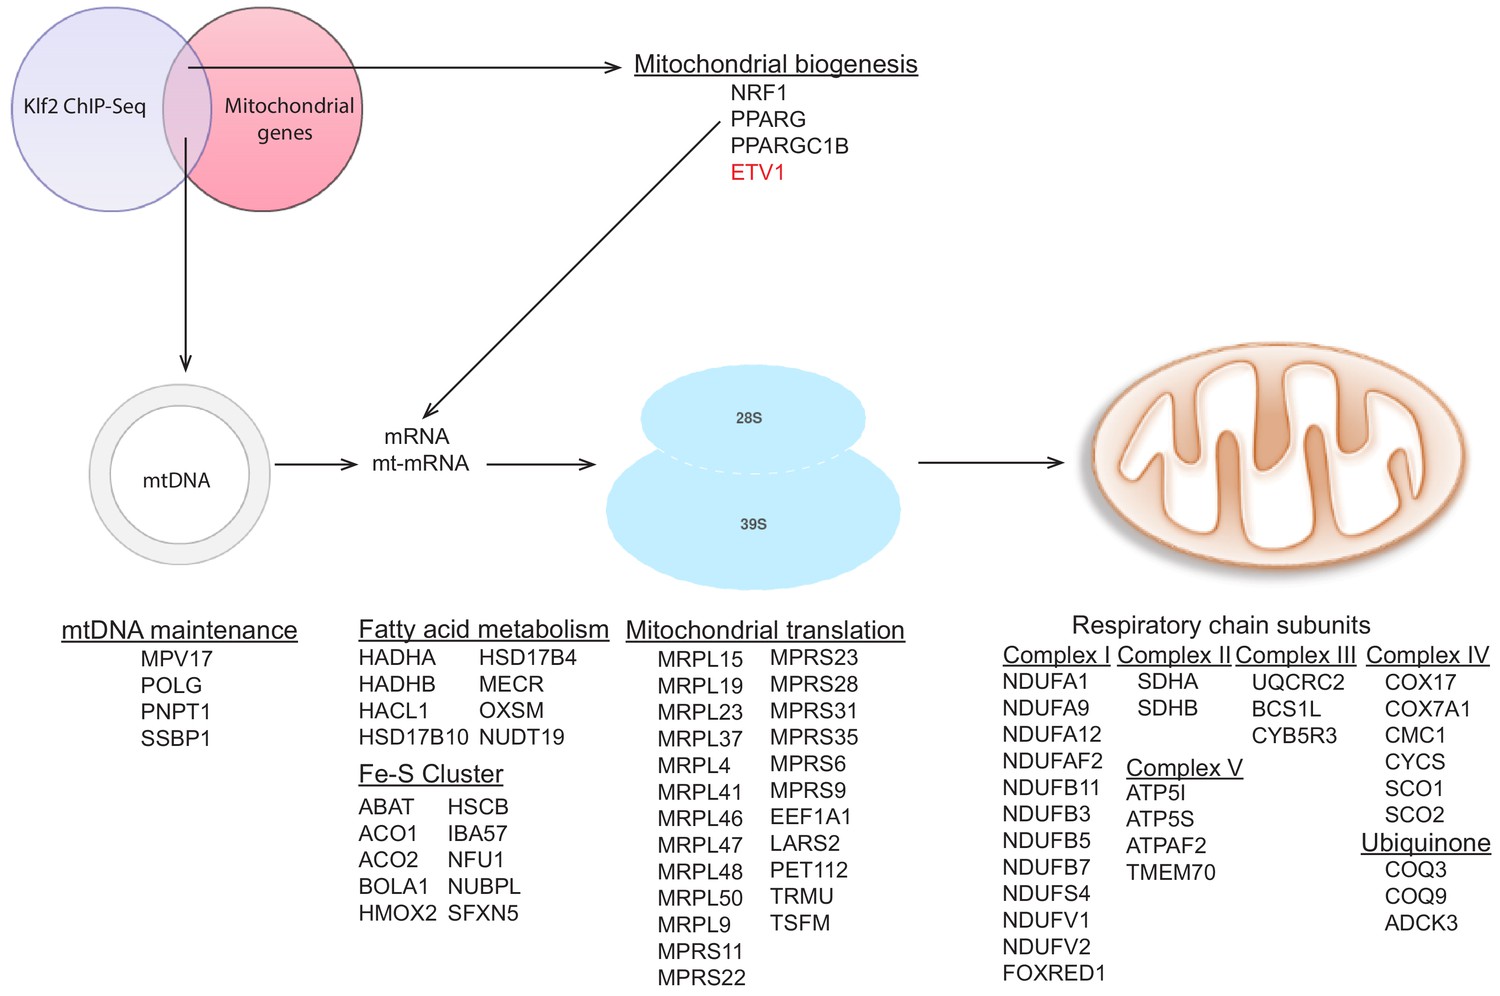
Targets of KLF2 as determined by ChIP-Seq data analysis.
Graphic representation of publicly available KLF2 ChIP-Seq data, highlighting its target genes to include several mitochondrial genes. KLF2 target genes from the ChIP-Seq data were crossed with the mitochondrial ‘gene list’ described above to obtain targets of KLF2 which encode mitochondrial proteins. We note that NRF1, PPARG and PPARGC1B are not in the ‘mitochondrial gene list’, since they do not encode bona fide mitochondrial proteins, they were found to be direct targets of KLF2. Interestingly, ETV1, which we describe in this study is also found as a KLF2 target gene. The complete list of KLF2 target genes which encode mitochondrial proteins can be found in Supplementary file 2.
Figure 4—figure supplement 5
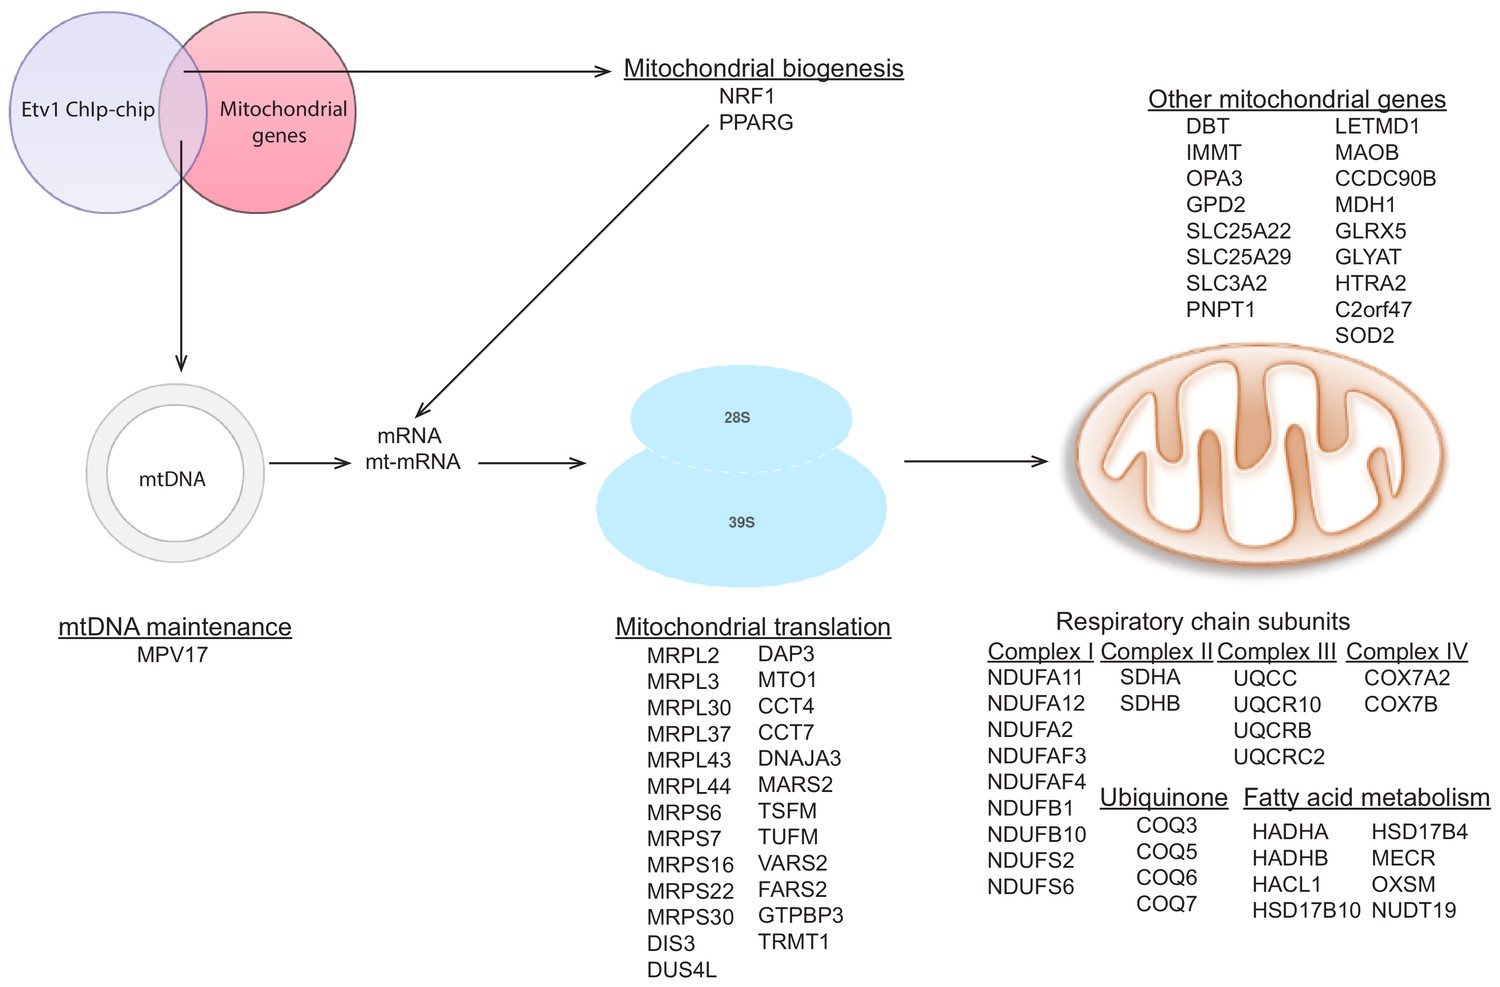
Targets of ETV1 as determined by ChIP-ChIP data analysis.
Analysis of publicly available ETV1 ChIP-ChIP dataset with the same approach described in Figure 4—figure supplement 4 above, shows several mitochondrial genes as targets of ETV1. Schematic representation of these genes also includes NRF1 and PPARG as ETV1 target genes.
Figure 5 with 1 supplement
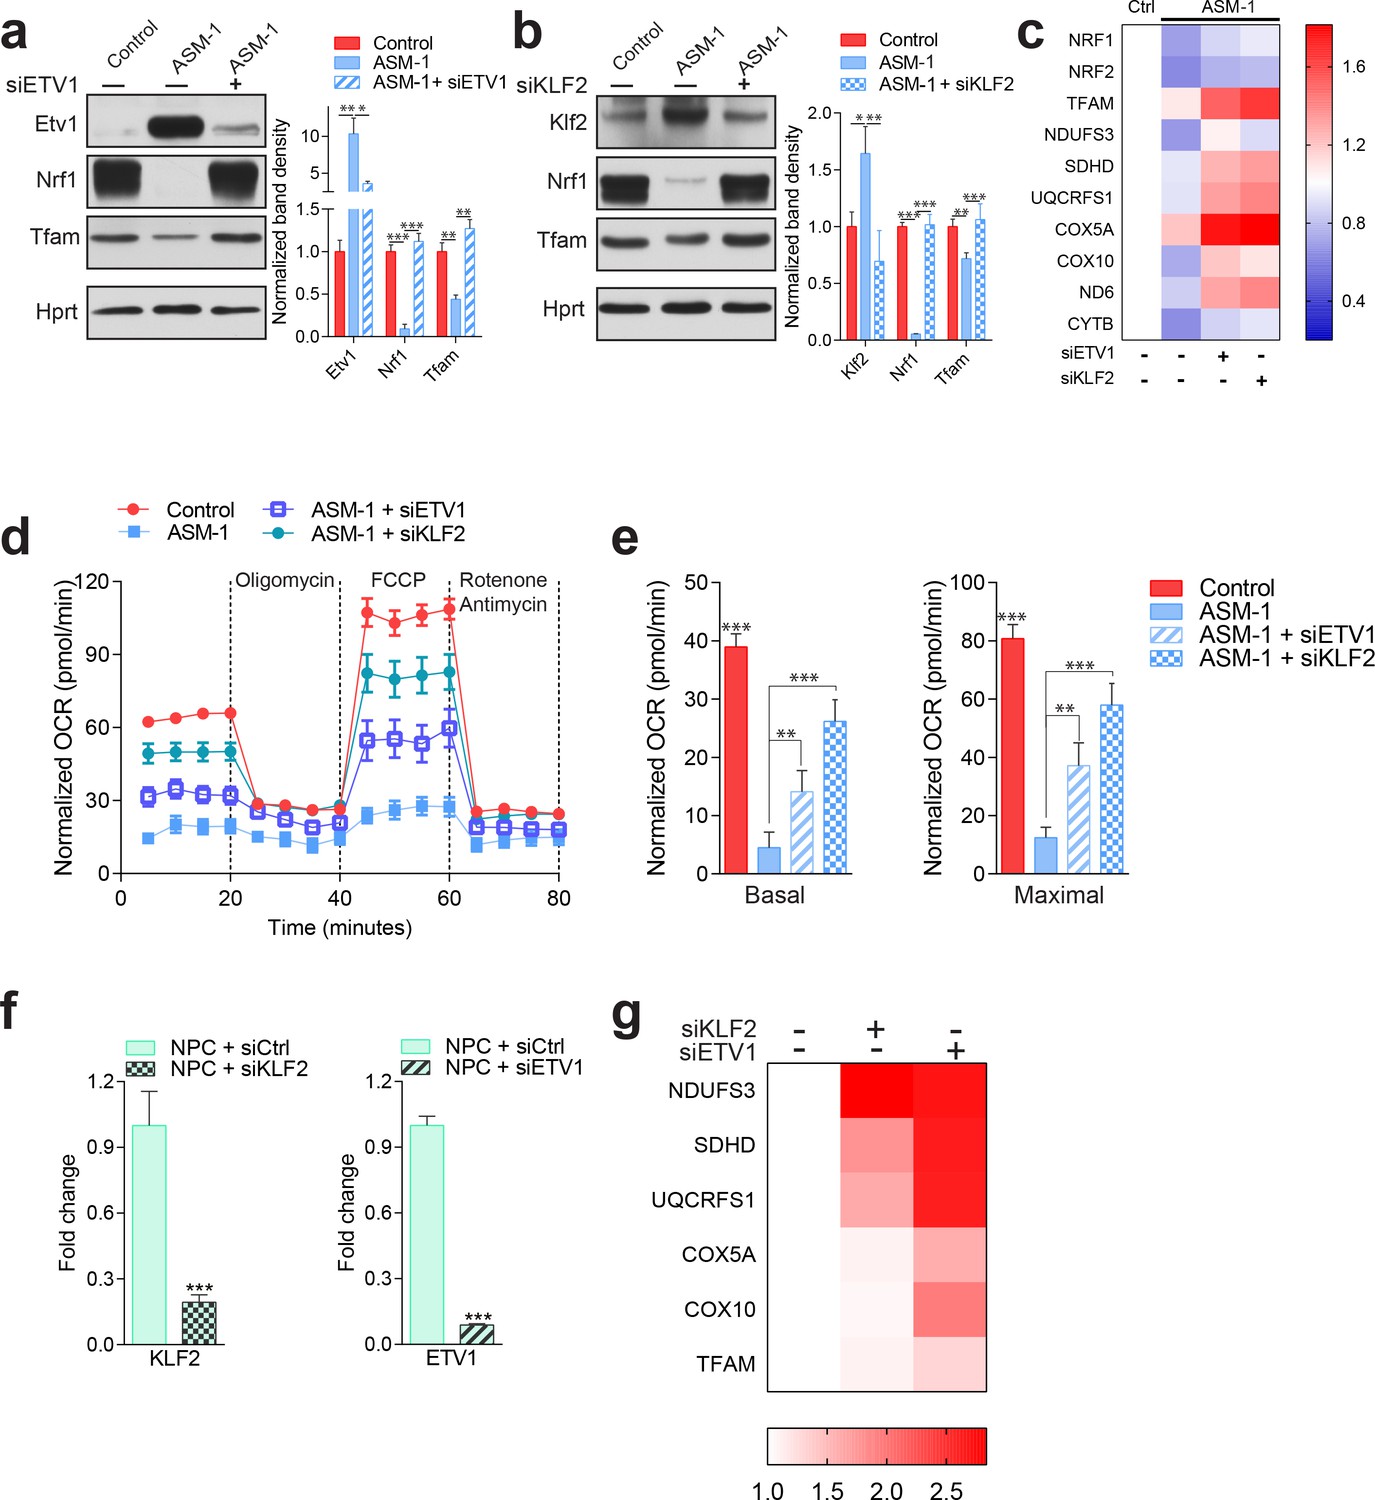
Silencing of ETV1 or KLF2 rescues mitochondrial biogenesis and function in Niemann-Pick fibroblasts.
Using siRNA-mediated silencing, we knocked-down Etv1 (a) or Klf2 (b) in ASM1-deficient fibroblasts, which brought the protein levels of mitochondrial protein TFAM, and of mitochondrial biogenesis regulator NRF1 to control levels, as shown in a representative western blot of whole cell extracts, with quantification of band densities in the adjacent plots as mean ± s.em., n = 3. Scrambled siRNA was used as control in both control and ASM-deficient cells for all experiments involving ETV1 or KLF2 silencing. T-test p-values *p<0.05, **p<0.01 ***p<0.001 (c) Silencing of ETV1 or KLF2 increases the transcript levels of mitochondrial genes, as assessed by qPCR. The data is presented in a Heatmap, in which blue denotes decrease in expression compared to the control cells (white represents no change relative to the control values) and red denotes increase. Note the mostly decreased (blue) mitochondrial genes in ASM-deficient cells and their turn to red (increased expression) when ETV1 or KLF2 are silenced (n = 3). (d–e) Silencing of either Klf2 or Etv1 partially rescues the decreased basal and maximal OCR in ASM-deficient fibroblasts as measured by real time respirometry. The plot shows the mean ± s.e.m., n = 3. T-test p-values **p<0.01 and ***p<0.001. (f) Robust silencing of KLF2 or ETV1 in NPC1-deficient cells shows accordingly, significantly decreased transcript levels of KLF2 and ETV1. Graphs represent mean ± s.e.m, n = 3 with T-test p-values ***p<0.001 (g) KLF2 or ETV1 knockdowns in NPC1-deficient cells increases the transcript levels of mitochondrial genes, which is presented as a Heatmap. Note the mostly increased (red) mitochondrial genes when KLF2 or ETV1 are silenced relative to Scrambled siRNA (white) in NPC1-deficient cells (n = 3).
Figure 5—figure supplement 1

Autophagy defects in Niemann Pick patients are independent of Klf2 and Etv1.
To assess if silencing of ETV1 or KLF2 in ASM-deficient fibroblasts had any impact on lysosomal function, we assessed the accumulation of autophagic substrates p62 (Sqstm1) and LC3BII, a marker of autophagosomes. No effect on these parameters was observed when ETV1 (panel a) or KLF2 (panel b) was silenced, as assessed by western blot. Quantification shows the mean ± s.e.m, n = 3. T-test p-value *p<0.01 ***p<0.001; non-significant (ns) p>0.05.
Figure 6

ETV1 up-regulation is dependent on KLF2 and ERK.
(a) Silencing of KLF2 in ASM-deficient fibroblasts results in reduced levels of ETV1, shown by a representative western blot of whole cell extracts, with quantification of band densities (mean ± s.e.m, n = 3) in adjacent plots. One way ANOVA p-values ***p<0.001. (b) ASM-deficient fibroblasts show increased ERK and mTORC1 activities, reduced AKT activity and unchanged AMPK activity, as shown by a representative western blot of whole cell extracts with band density quantification presented in the adjacent plot as mean ± s.e.m., n = 3. T-test p-values **p<0.01 ***p<0.001 (c) ERK inhibition by treatment with U0126 (20 µM, 16 hr) in ASM-deficient fibroblasts results in reduced ETV1 levels but does not affect KLF2, as shown by a representative western blot, with band density quantification in the adjacent plot depicted as mean ± s.e.m. for biological triplicates. T-test p-values **p<0.01 ***p<0.001.
Figure 7 with 1 supplement
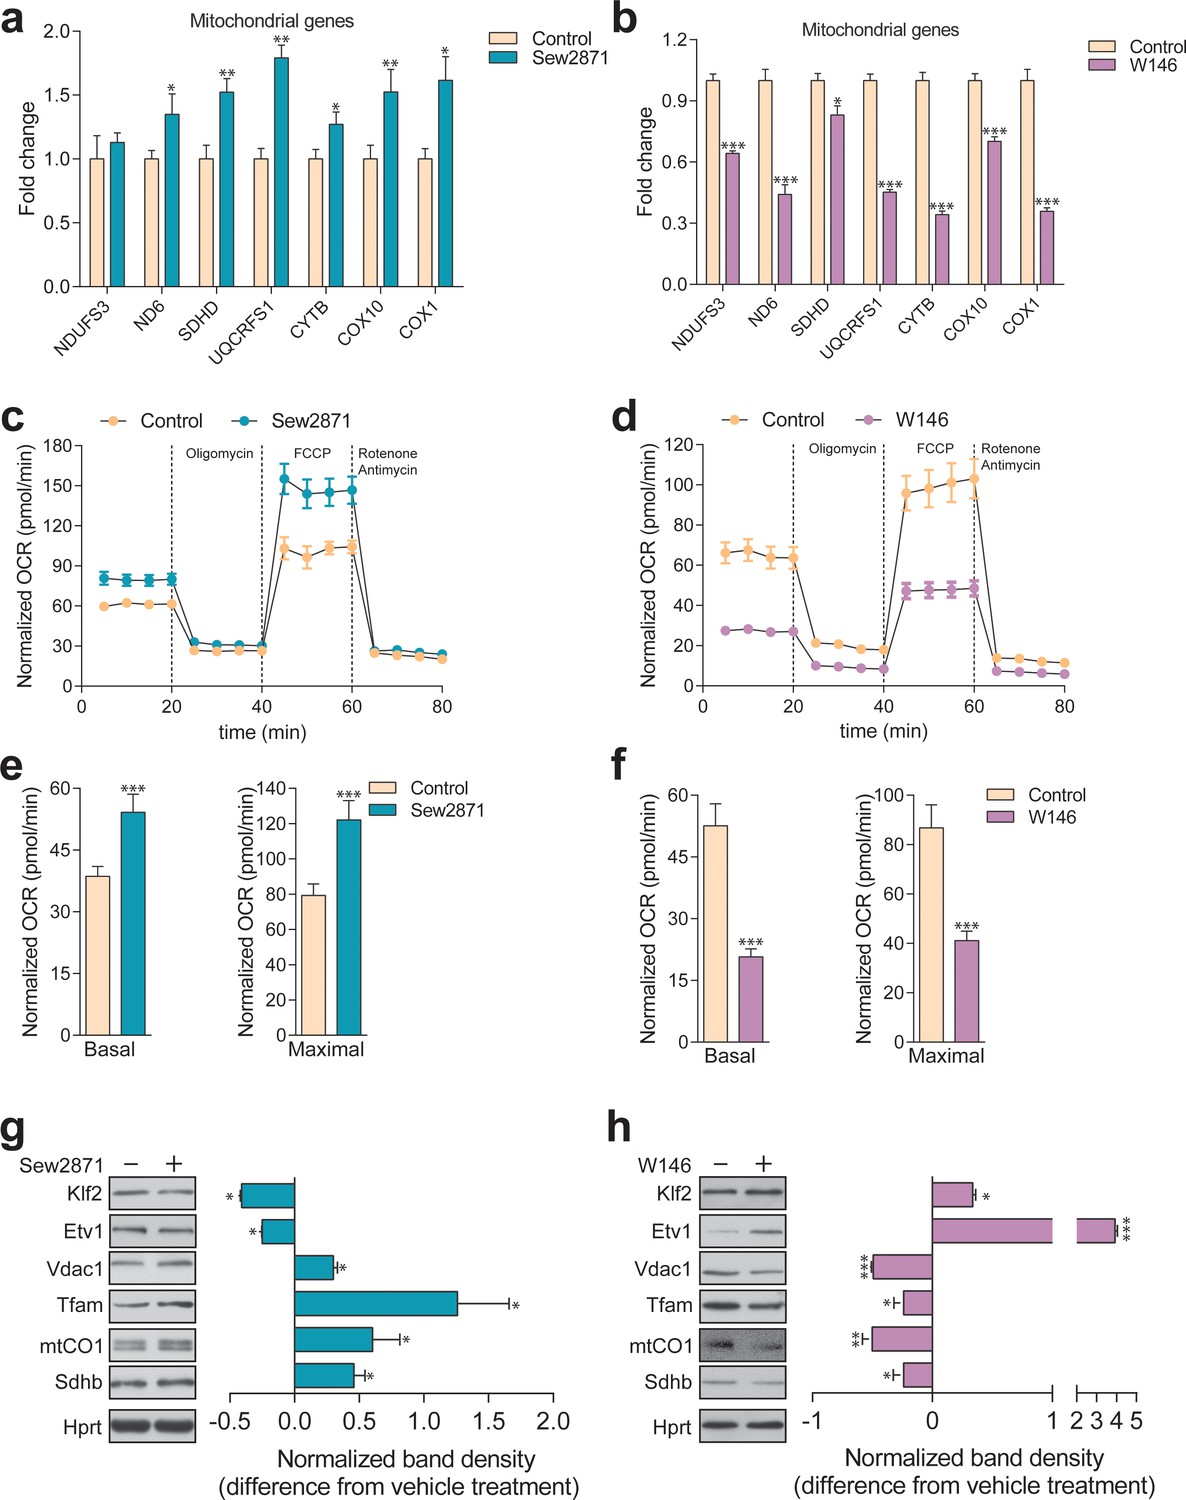
Dynamic regulation of S1PR1 activity impacts mitochondrial biogenesis and function.
(a) Transcript levels of mitochondrial-related genes increase upon activation of S1PR1 with the agonist Sew2871 (5 µM, 16 hr; DMSO as vehicle control), as measured by qPCR. Plots show mean ± s.e.m., n = 3. T-test p-values *p<0.05 and **p<0.01 (b) Transcript levels of mitochondrial-related genes decrease upon inhibition of S1PR1 with the competitive antagonist W146 (10 µM, 16 hr; methanol as vehicle control), as measured by qPCR. Plots show mean ± s.e.m., n = 3. T-test p-values **p<0.01 and ***p<0.001 (c) Increased OCR in cells treated with the S1PR1 agonist Sew2871 compared to vehicle control (DMSO), quantified in panel (e). (d) Decreased OCR in cells treated with the S1PR1 antagonist W146 compared to vehicle control (methanol), quantified in panel (f). Quantifications in e and f represent mean ± s.em., n = 3 with T-test p-values ***p<0.001. (g) Representative blots showing decreased protein levels of KLF2 and ETV1, and increased amounts of mitochondrial proteins VDAC1, TFAM, CO1 and SDHB, in cells treated with S1PR1 agonist Sew2871, assessed by western blots of whole cell extracts, using HPRT as loading control. Adjacent plot depicts the fold difference in band density relative to vehicle control (DMSO) as mean ± s.e.m., n = 2 with technical triplicates (the line on zero denotes no change relative to the controls, negative numbers show decrease in fold change, positive numbers show increased fold change). T-test p-value *p<0.05 (h) Representative blots depicting increased protein levels of KLF2 and ETV1, and decreased amounts of mitochondrial proteins VDAC1, TFAM, CO1 and SDHB, in cells treated with S1PR1 antagonist W146, assessed by western blots of whole cell extracts, using HPRT as loading control. Adjacent plot shows the difference in fold band density compared to vehicle control (methanol) and depicted as average ± s.e.m., n = 2 with technical triplicates. T-test p-value *p<0.05, **p<0.01 and ***p<0.001.
Figure 7—figure supplement 1
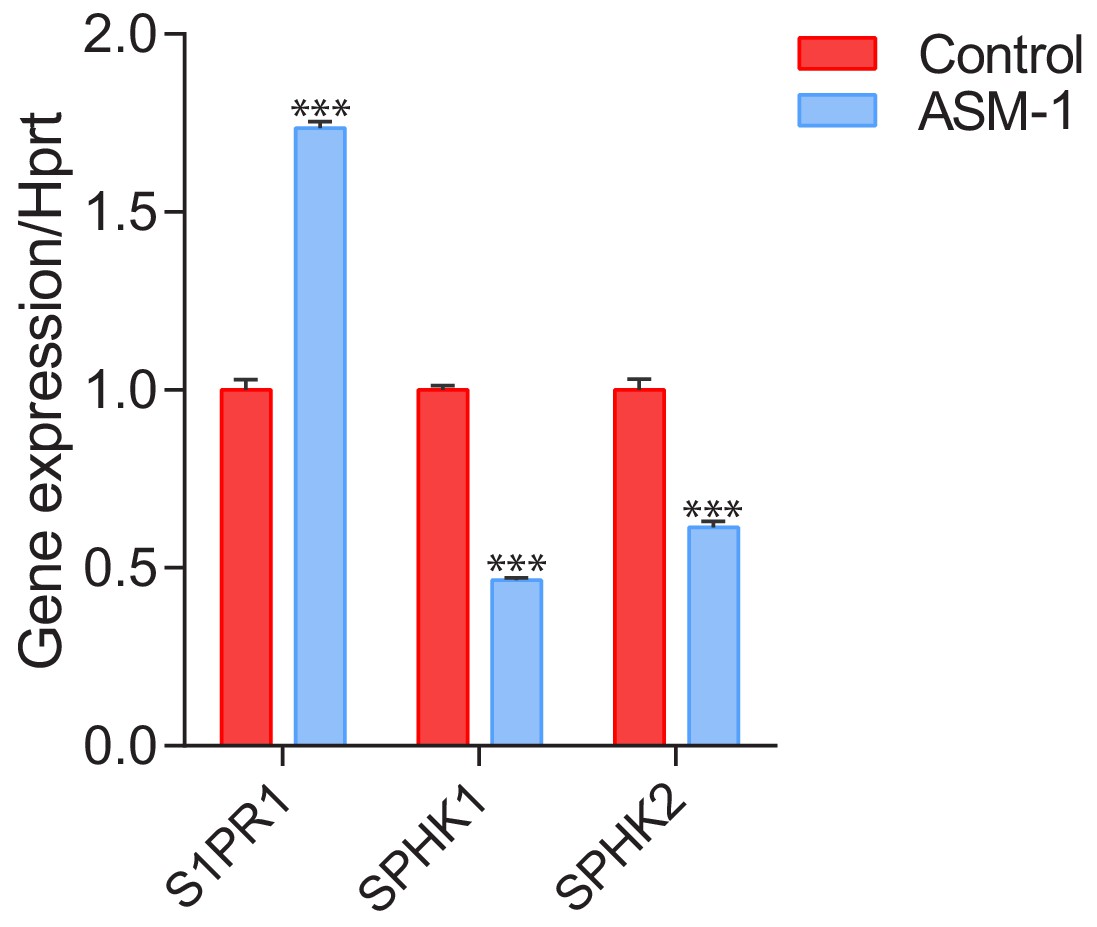
Transcript levels of sphingosine-1-phosphate receptor 1 (S1PR1) and sphingosine kinases 1 (SPHK1) and 2 (SPHK2) in ASM-deficient fibroblasts.
Transcript levels of S1PR1, SPHK1 and SPHK2 were measured by qPCR and depicted as mean ± s.e.m, n = 3. T-test p-values ***p<0.001.
Figure 8
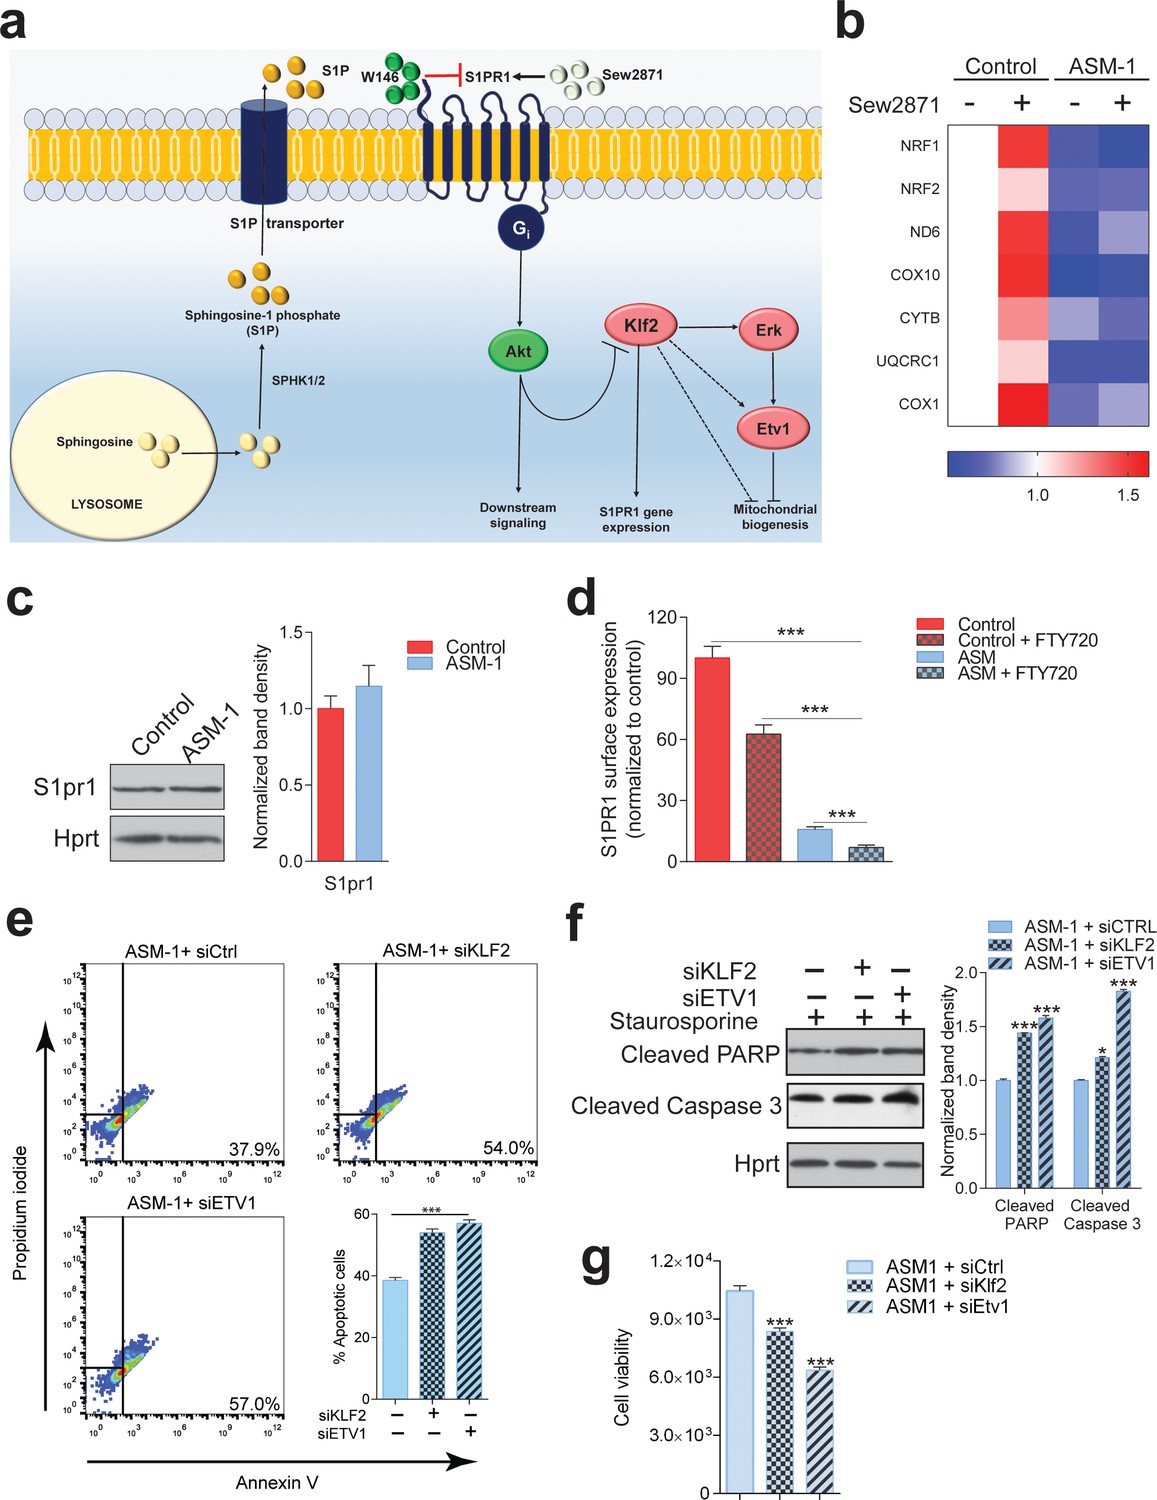
S1PR1 signaling in Niemann-Pick disease.
(a) Schematic illustration of sphingosine-1-phospate (S1P) signaling. S1P is generated from sphingosine by the kinases SPHK1 (plasma membrane) and SPHK2 (endoplasmic reticulum and mitochondria), and can be transported out of the cell. Extracellular S1P can activate several receptors (S1PR1-5). Specifically, stimulation of S1PR1 triggers Akt signaling which regulates KLF2 levels. Expression of S1PR1 is regulated by KLF2, which as shown by our data also activates ETV1. Sew2871 is an agonist of S1PR1, and W146 is an antagonist. (b) Treatment of control fibroblasts with S1PR1 agonist Sew2871 (5 µM, 16 hr) results in increased transcript levels of mitochondria-related genes in control fibroblasts, but has no effect on ASM-deficient fibroblasts. The data is presented in a Heatmap for n = 3, in which blue denotes decrease in expression compared to the control cells (white represents no change relative to the control values) and red denotes increase. Note the mostly increased (red) mitochondrial genes in control fibroblasts treated with Sew2871, while blue in ASM fibroblasts regardless of the treatment. (c) Protein levels of S1PR1 are not changed in ASM fibroblasts, as measured by western blot using whole cell extracts. Adjacent plot shows the quantification presented as mean ± s.e.m., n = 3. T-test p-value>0.05. (d) Staining of S1PR1 present at the plasma membrane, in non-permeabilized cells, measured by flow cytometry. FTY720 triggers the endocytosis if S1PR1 and was used as a negative control for surface staining. Note the barely detectable surface S1PR1 levels. Plots represent the average fraction of S1PR1 levels normalized to vehicle treated control cells and depicted as mean ± s.e.m., n = 3. T.test p-value ***p<0.001 (e) Staurosporine-treated ASM-deficient cells with KLF2 and ETV1 silencing show increased apoptotic cell population relative to control ASM-deficient cells as measured by flow cytometry with Annexin-V and Propidium iodide staining. Quantifications are depicted as mean ± s.e.m., n = 5. T-test p-value ***p<0.001. (f) Staurosporine-treated ASM-deficient fibroblasts with either silencing control, KLF2 or ETV1 knockdowns show increased protein amounts of Cleaved PARP and Cleaved Caspase three levels in cells with KLF2 or ETV1 silencing and quantifications in adjacent graphs show mean ± s.em., n = 3. T-test p-value **p<0.01 and ***p<0.001. (g) Decreased cell viability as measured by Glo Titer Assay in ASM-deficient fibroblast with either KLF2 or ETV1 silencing. Plots represent mean± s.e.m., n = 2 with six technical replicates per condition. T-test p-value, ***p<0.001.
Author response image 1
Tables
Table 1
Sources of organelle-specific proteomes.
https://doi.org/10.7554/eLife.39598.002| Dataset | Number of genes | Reference (source) |
|---|---|---|
| Mitochondria | 1049 | (Pagliarini et al., 2008) |
| Respiratory chain subunits | 108 | (Pagliarini et al., 2008) |
| Lysosomes | 435 | (Skon et al., 2013) |
| Peroxisomes | 254 | (Hollenhorst et al., 2007) |
| Endoplasmic reticulum | 297 | (Herzog et al., 2006) |
| Golgi (COP I) Vesicles | 86 | (Dugas et al., 2006) |
Table 2
Transcription factors with statistically enriched cis-elements in the promoters of genes encoding for subunits of mitochondrial respiratory chain.
https://doi.org/10.7554/eLife.39598.012| Transcription factor family | p-value (Fisher's exact test) | Transcription factors |
|---|---|---|
| SP1 | 1.52E-09 | SP1, SP4 |
| E2F | 2.79E-08 | E2F1, E2F2, E2F3, E2F4 |
| KLF | 0.000265 | KLF2, KLF6, KLF7, KLF15 |
| ETS | 0.000796 | ELK1, SPI1, ETV1 |
Additional files
-
Supplementary file 1
Results of the promoter analysis of lysosomal genes.
The transcription factor families that passed the significance threshold (Fisher exact test p<0.01) and the respective p-values are indicated.
- https://doi.org/10.7554/eLife.39598.025
-
Supplementary file 2
Mitochondrial KLF2 target genes obtained from the analysis of dataset E-MTAB-2365.
These targets represent the common genes between the complete KLF2 target list and the mitochondrial gene list.
- https://doi.org/10.7554/eLife.39598.027
-
Transparent reporting form
- https://doi.org/10.7554/eLife.39598.030
-
Supplementary file 3
List of the transcription factors predicted to be significantly activated in the liver and brain of NPC1 KO mice compared to WT.
The transcription factors and respective p-value is indicated. Transcription factors labelled in red were found to be significantly involved in both liver and brain of NPC1 KO, and thus selected for further analysis.
- https://doi.org/10.7554/eLife.39598.026
-
Supplementary file 4
qPCR primers.
- https://doi.org/10.7554/eLife.39598.028
-
Supplementary file 5
siRNA sequences.
- https://doi.org/10.7554/eLife.39598.029
Download links
A two-part list of links to download the article, or parts of the article, in various formats.
Downloads (link to download the article as PDF)
Open citations (links to open the citations from this article in various online reference manager services)
Cite this article (links to download the citations from this article in formats compatible with various reference manager tools)
Mitochondrial biogenesis is transcriptionally repressed in lysosomal lipid storage diseases
eLife 8:e39598.
https://doi.org/10.7554/eLife.39598


