Maintenance of homeostatic plasticity at the Drosophila neuromuscular synapse requires continuous IP3-directed signaling
- University of Iowa Carver College of Medicine, United States
- University of Iowa, United States
Figures
Figure 1
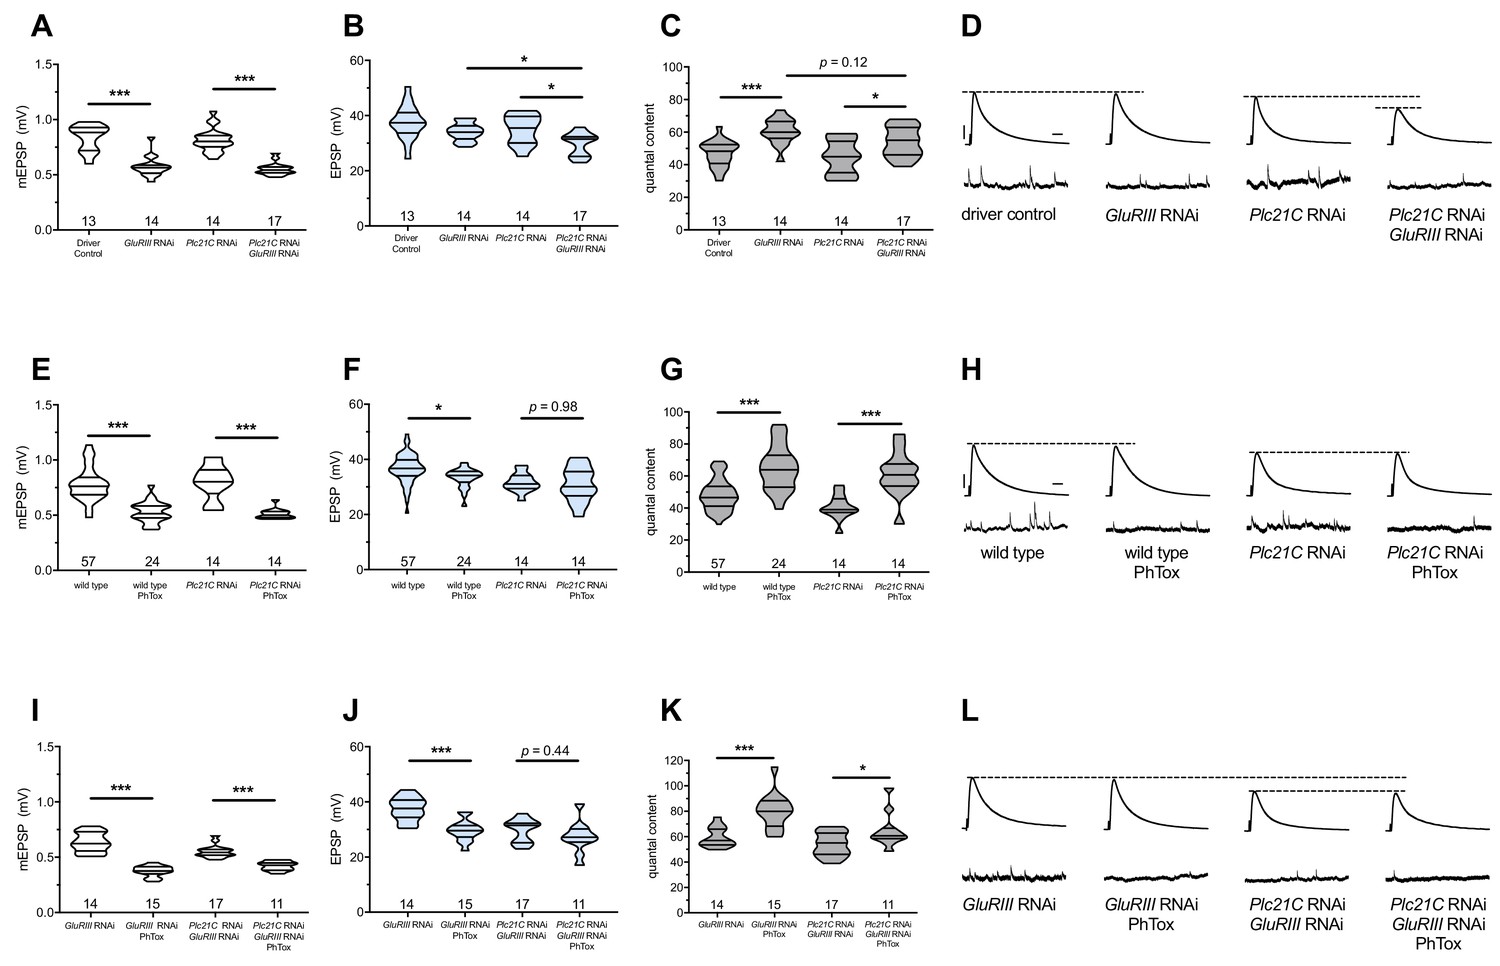
Maintenance of presynaptic homeostatic potentiation requires PLCβ, but induction does not.
(A) GluRIII knockdown induces a significant decrease in quantal size for both driver control and Plc21C knockdown genetic backgrounds. (B) EPSP amplitudes are maintained with GluRIII knockdown alone but dampened with concurrent GluRIII and Plc21C knockdown. (C) There is significant PHP (Presynaptic Homeostatic Potentiation, measured as an increase in quantal content) in response to GluRIII knockdown. (D) Representative electrophysiological traces of EPSPs (above) and mEPSPs (below). The evoked events show full PHP in the GluRIII RNAi knock down background and partial PHP with concurrent Plc21C knock down. (E) 10-min incubation with 20 μM PhTox diminishes quantal size for all conditions. (F) EPSP amplitudes after acute PhTox incubation are maintained at or near normal levels. (G) The data in (F) are because PHP is rapidly induced in wild-type and Plc21C RNAi NMJs after PhTox incubation. (H) Representative electrophysiological traces show fully intact PHP induction. (I) With dual PHP maintenance (GluRIII knockdown) and induction (PhTox application), quantal size is further decreased. (J) EPSP amplitudes after dual maintenance and induction. (K) Quantal is content further increased in by PhTox treatment in GluRIII RNAi synapses compared to untreated synapses; this expression of PHP does not require full PLCβ function. (L) Representative electrophysiological traces illustrate that even though PHP maintenance is impaired with PLCβ knockdown, PHP induction is not impaired. Violin plots have horizontal lines signifying the 0th, 25th, 50th, 75th, and 100th percentiles of the data distribution; the distribution itself is delineated by the shapes of the plots. *p<0.05, **p<0.01, ***p<0.001 by Student’s T-Test versus non-challenged genetic control or by one-way ANOVA with a Bonferroni post-hoc test in the case of comparing degree of compensation with GluRIII RNAi and Plc21C RNAi + GluRIII RNAi. Scale bars for all traces are y = 10 mV (1 mV), x = 20 ms (500 ms) for EPSPs (mEPSPs).
-
Figure 1—source data 1
Raw electrophysiology data for Figure 1.
Values include EPSP amplitude in mV, resting membrane potential (RMP) in mV, mEPSP amplitude in mV, mEPSP frequency (Hz), quantal content, and quantal content corrected for non-linear summation (NLS).
- https://doi.org/10.7554/eLife.39643.003
Figure 2
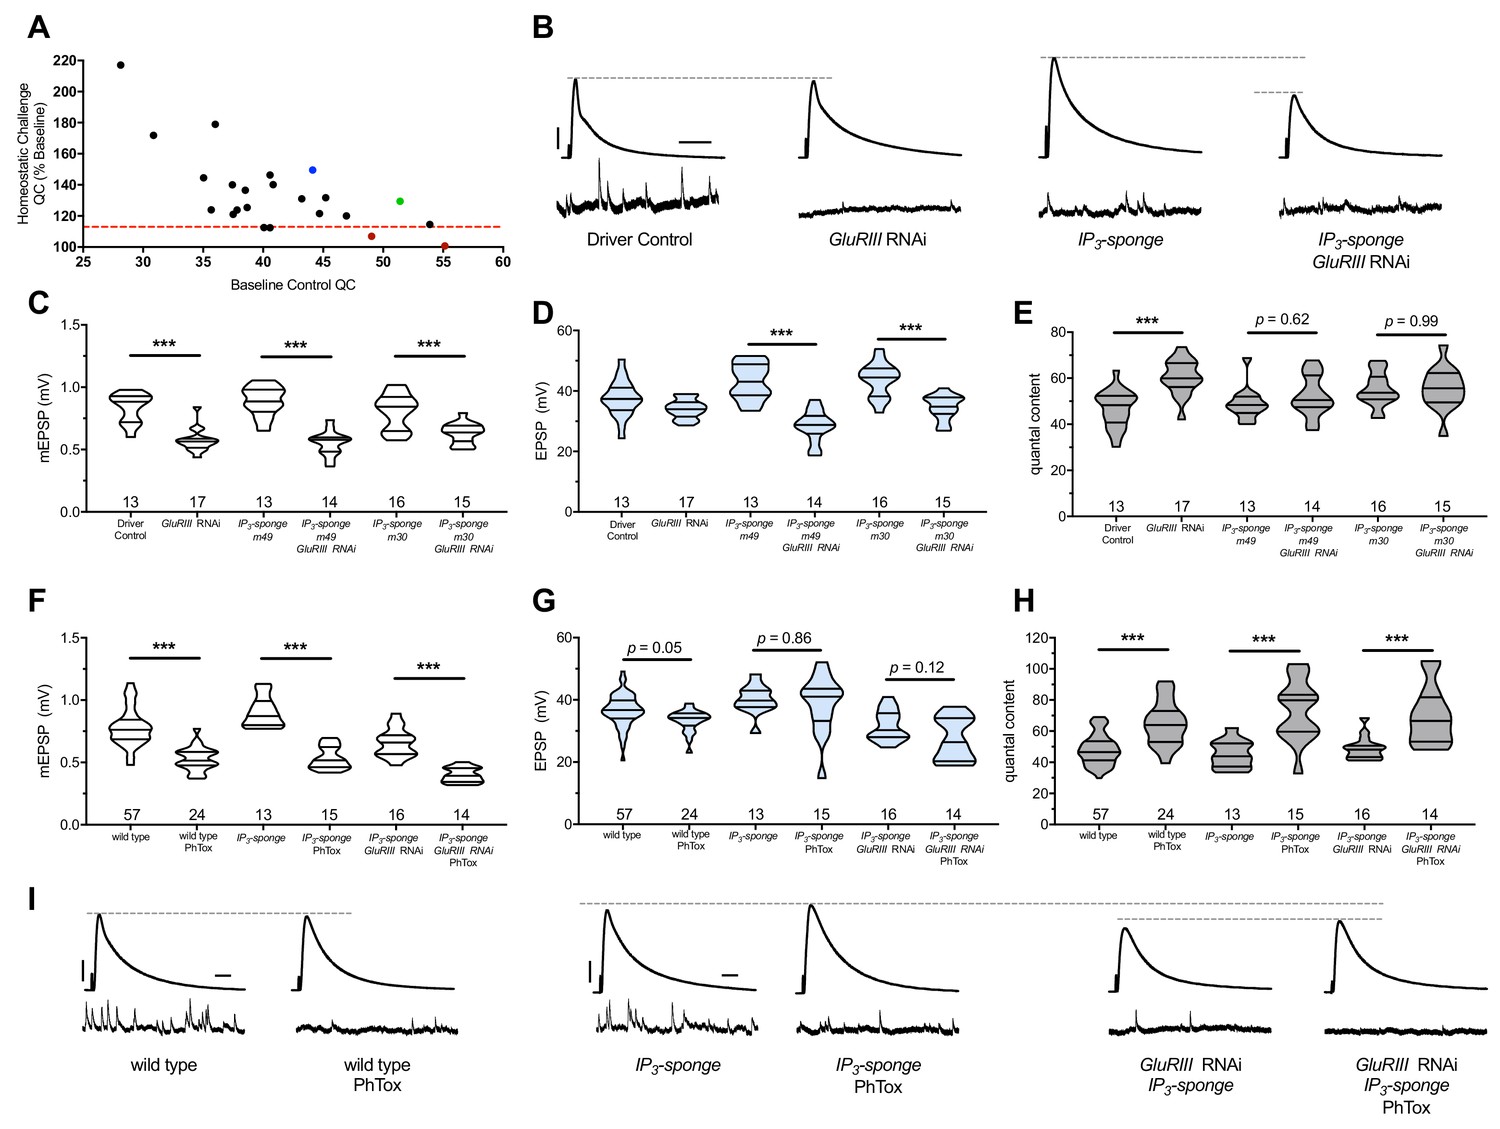
IP3 sequestration blocks PHP maintenance but not PHP induction.
(A) Screen data, plotting baseline quantal content (QC, x-axis, genetic manipulation alone) versus QC of the homeostatically challenged condition (y-axis, GluRIII RNAi or GluRIIA mutant). Blue = GluRIIA alone. Green = GluRIII RNAi alone. Red = GluRIII RNAi+UAS-IP3-sponge. Dotted line = one standard deviation below the mean QC of GluRIII RNAi. (B) Representative electrophysiological traces (EPSPs above; mEPSPs below), demonstrating diminished evoked potentials in the GluRIII RNAi +UAS-IP3-sponge (presynaptic +postsynaptic expression) condition. (C) GluRIII knockdown induces a significant decrease in quantal size for all genetic backgrounds. (D) EPSP amplitudes are maintained with GluRIII knockdown alone but significantly diminished with concurrent GluRIII knockdown and expression of either UAS-IP3-sponge line. (E) By quantal content, sustained PHP expression is abolished when UAS-IP3-sponge is expressed using concurrent pre- and postsynaptic GAL4 drivers. (F) 10-min incubation with 20 μM PhTox diminishes quantal size for all conditions. (G) EPSP amplitudes after acute PhTox incubation are maintained at or near normal levels for all conditions. (H) Failure to sustain PHP following IP3 sequestration does not preclude its rapid induction. The data in (G) are because PhTox treatment results in a compensatory increase in QC for conditions shown. (I) Representative electrophysiological traces showing full homeostatic compensation with PhTox application (as in Frank et al., 2006). (J) Representative traces of the experimental data in (F–H). Violin plots used as in Figure 1. *p<0.05, **p<0.01, ***p<0.001 by Student’s T-Test versus non-challenged genetic control. Scale bars for all traces are y = 10 mV (1 mV), x = 20 ms (500 ms) for EPSPs (mEPSPs).
-
Figure 2—source data 1
Raw electrophysiology data for UAS-IP3-sponge experiements in Figure 2.
Values as in Figure 1—source data 1.
- https://doi.org/10.7554/eLife.39643.005
Figure 3
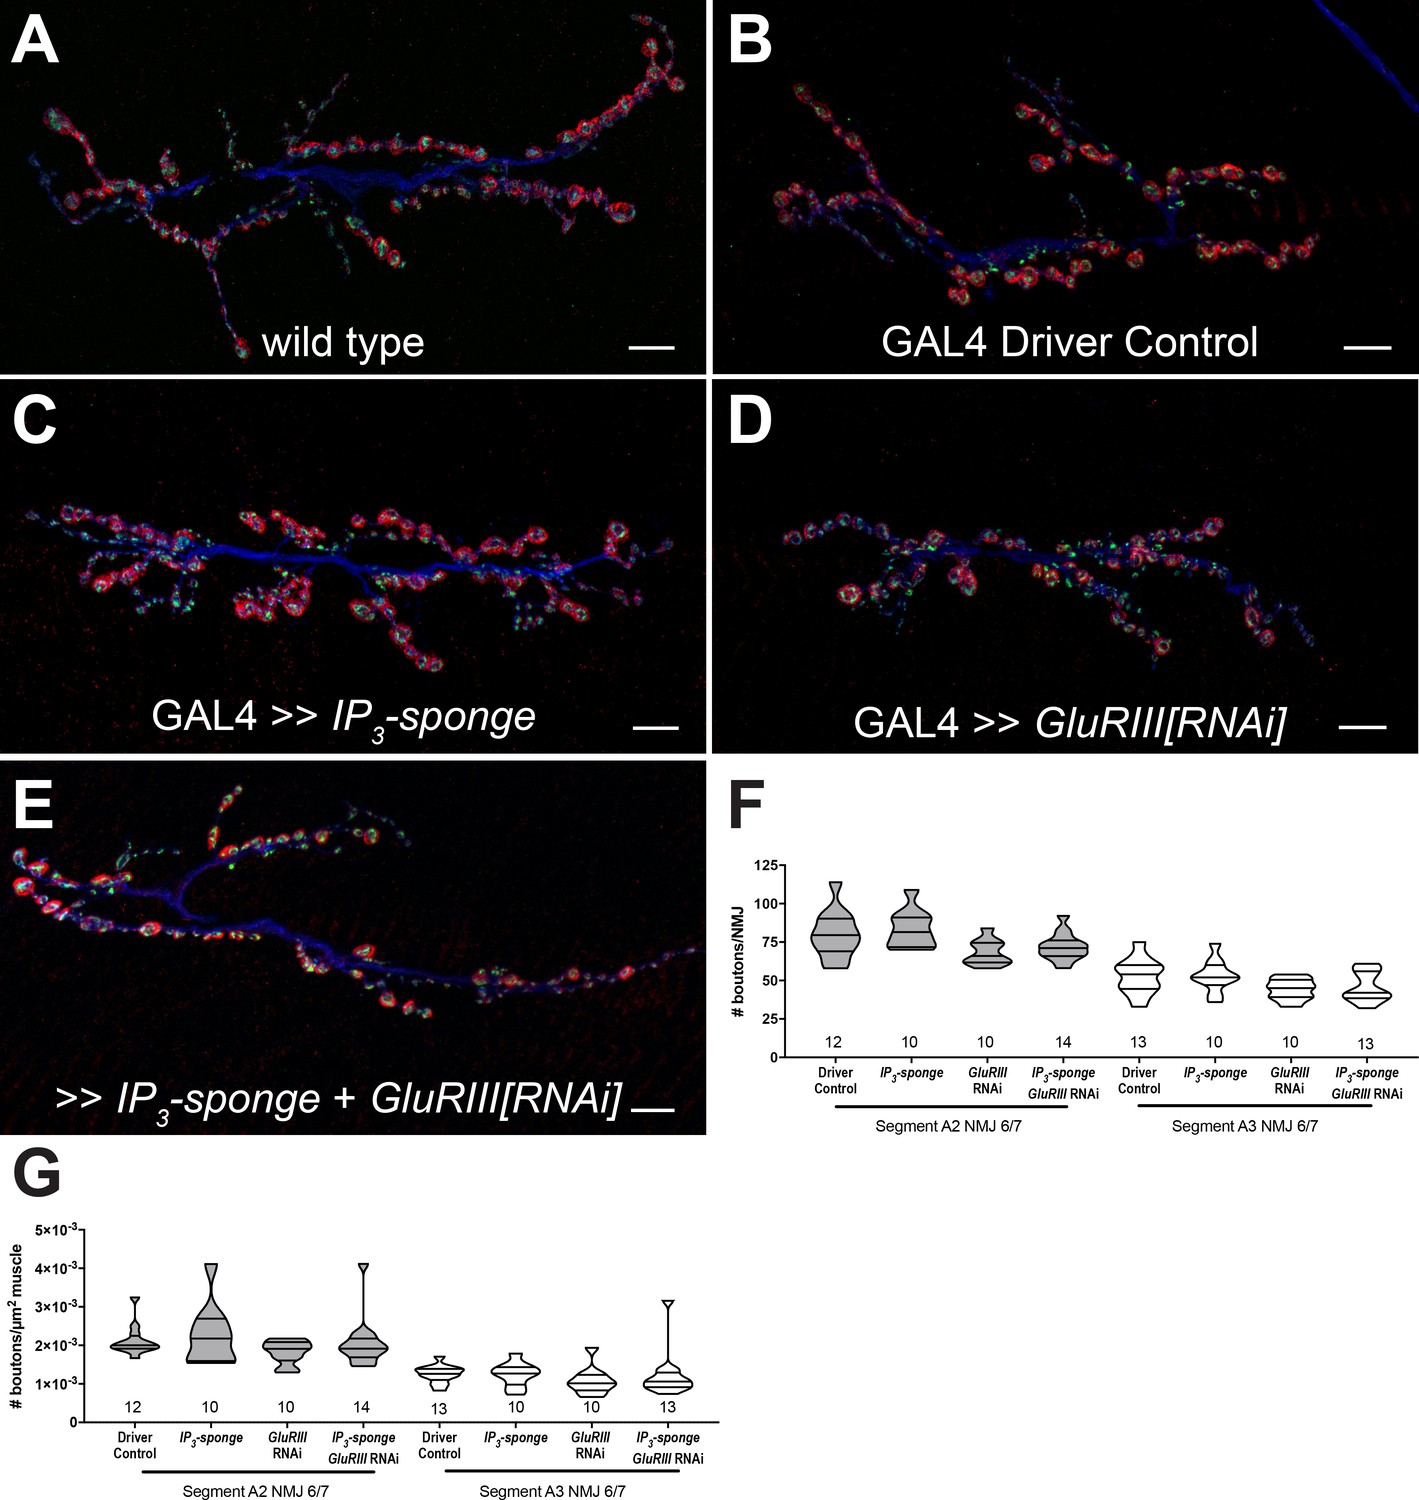
IP3 sequestration does not impair NMJ growth.
(A–E) NMJs were co-stained with anti-DLG (red) and anti-Synapsin antibodies (green) to visualize synaptic boutons, with anti-HRP (blue) to visualize presynaptic membranes. Genotypes or conditions as indicated. All scale bars, 10 μm. (F) NMJ growth was assessed by bouton counting at abdominal segments A2 and A3, muscle 6/7, based on postsynaptic DLG staining and double checked for presynaptic Synapsin. No statistically significant differences in NMJ growth versus driver control were observed for any of the experimental conditions (p>0.1 vs. control, regardless of segment). (G) Bouton counts were normalized per unit of muscle 6/7 area. No statistically significant differences versus control were observed (p>0.2 vs. control, regardless of segment). Violin plots used as in Figure 1. For both F and G, data were compared for each segment individually using the Kruskal-Wallis ANOVA test followed by Dunn’s multiple comparisons test.
-
Figure 3—source data 1
Raw synapse growth data for Figure 3.
These measures include bouton counts, muscle area (µm2), and boutons per µm2.
- https://doi.org/10.7554/eLife.39643.007
Figure 4
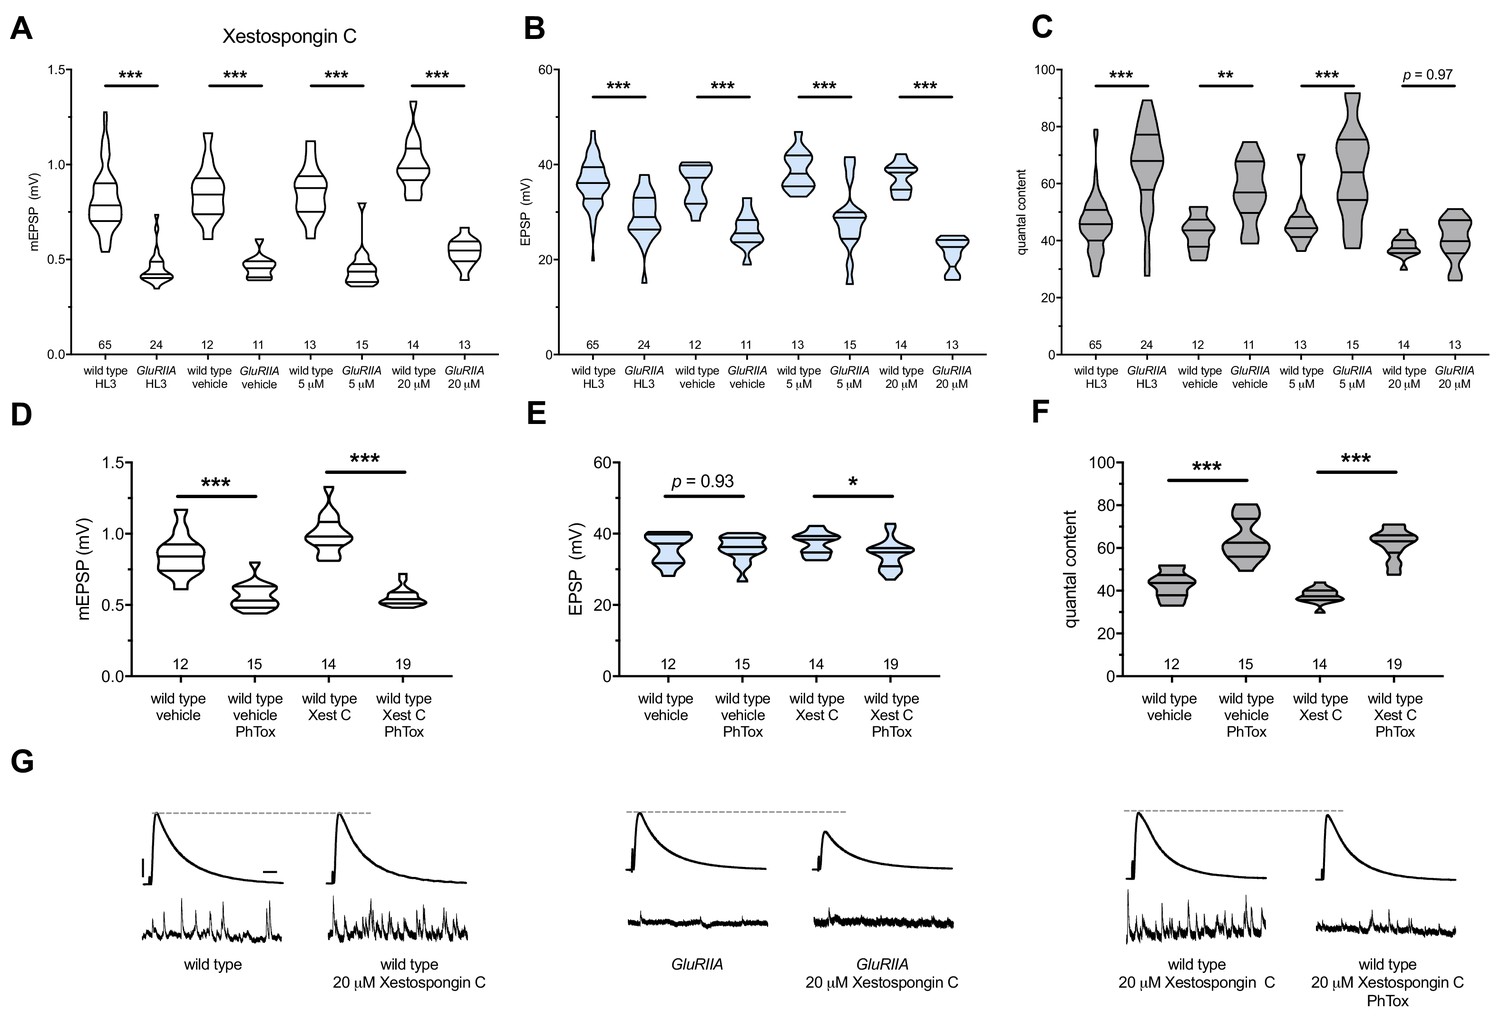
Xestospongin C blocks PHP maintenance but not PHP induction.
Xestospongin C acutely applied to NMJs to impair IP3R function. (A) The GluRIIASP16 deletion mutation diminishes quantal size for all experimental conditions. (B) EPSP amplitudes are somewhat impaired versus non-GluRIIA control in all cases but most severely impaired when GluRIIA deletion is combined with 20 µM Xestospongin C incubation. (C) By quantal content, sustained PHP expression is abolished with acute NMJ exposure to 20 µM Xestospongin C. (D) Acute incubation 20 μM PhTox diminishes quantal size for all conditions (PhTox +DMSO vehicle or PhTox +20 µM Xestospongin C). (E) EPSP amplitudes are normal or near normal for all conditions. (F) Rapid PHP induction by PhTox not blocked by 20 µM Xestospongin C. (G) Representative electrophysiological traces (EPSPs above; mEPSPs below) for 20 µM Xestospongin C (or control) conditions in (A–F). Violin plots used as in Figure 1. *p<0.05, **p<0.01, ***p<0.001 by Student’s T-Test versus non-challenged genetic control. Scale bars for all traces are y = 10 mV (1 mV), x = 20 ms (500 ms) for EPSPs (mEPSPs).
-
Figure 4—source data 1
Raw electrophysiology data for Figure 4.
Values as in Figure 1—source data 1.
- https://doi.org/10.7554/eLife.39643.009
Figure 5
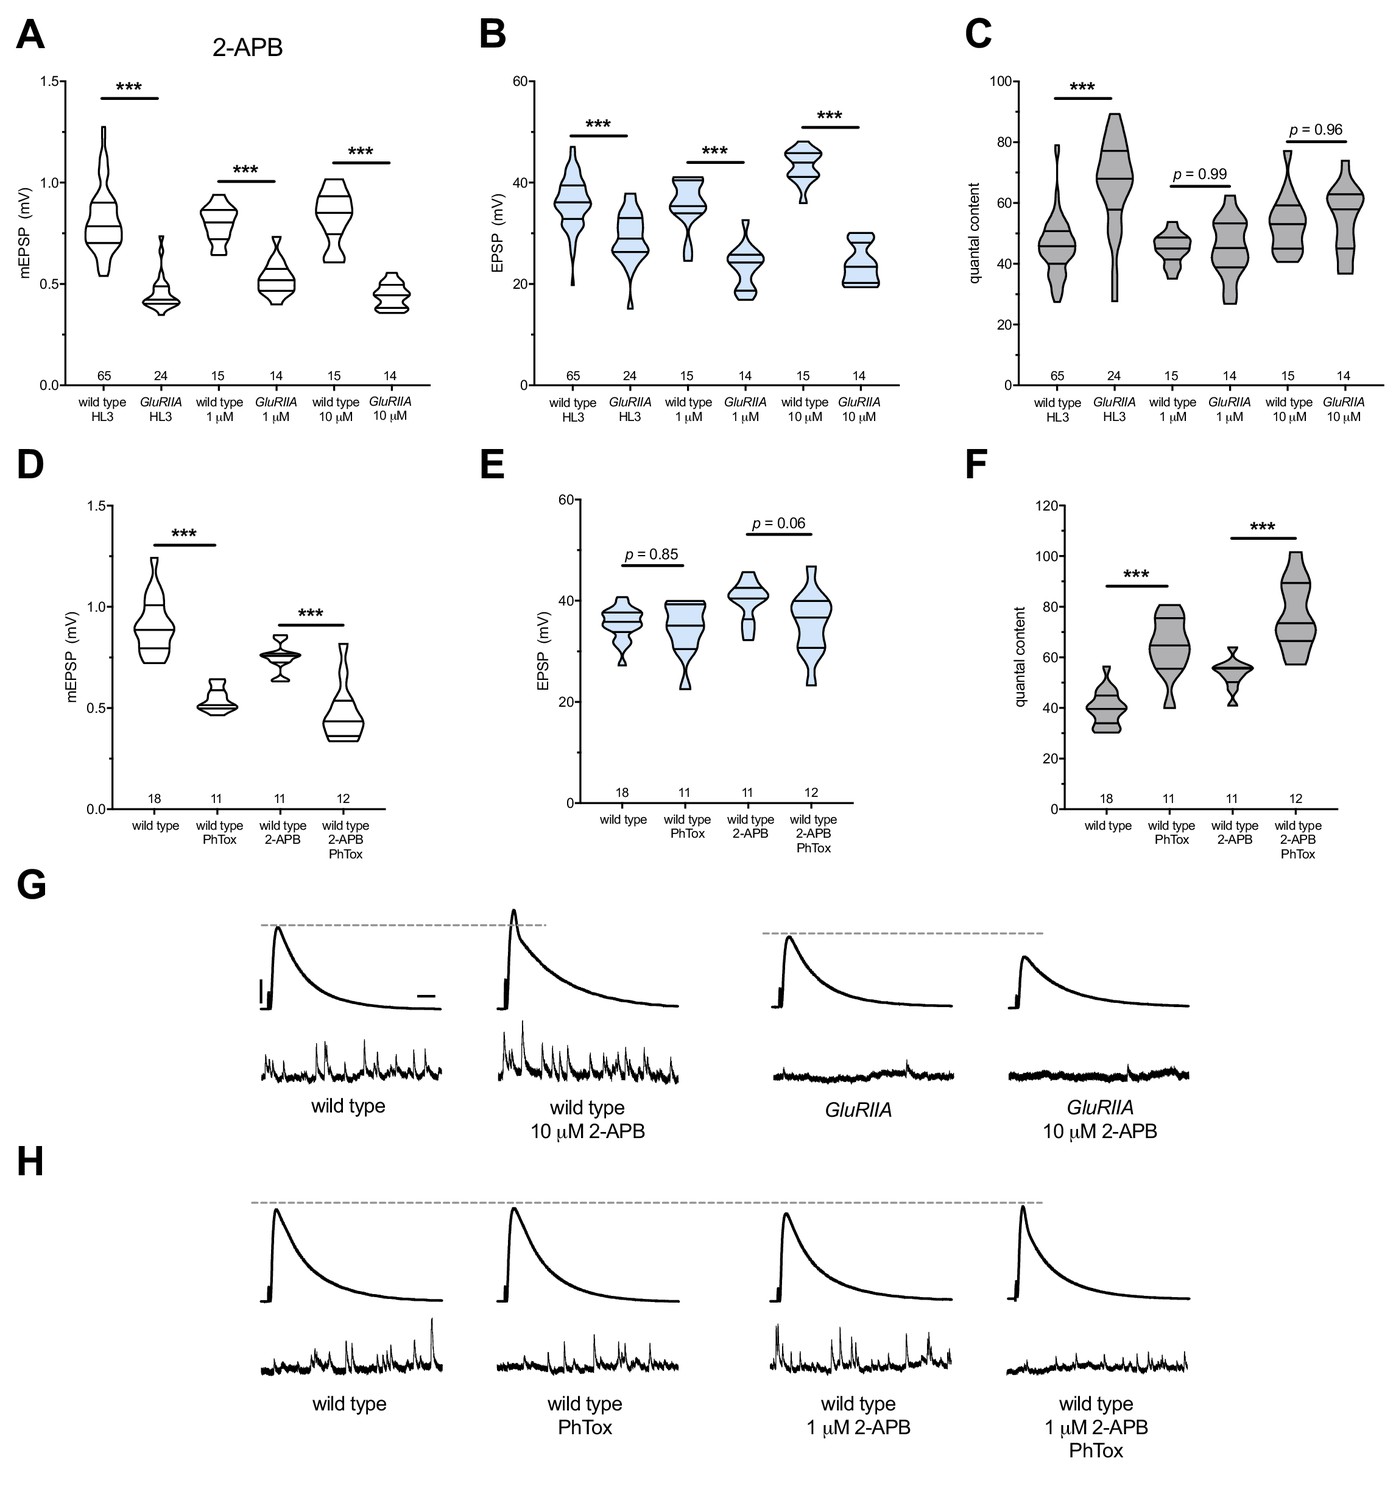
2-APB blocks PHP maintenance but not PHP induction.
2-APB acutely applied to NMJs to impair IP3R function. Wild-type and GluRIIA control data sets are replotted from Figure 4 for visual comparison. (A) The GluRIIASP16 deletion mutation diminishes quantal size for all experimental conditions. (B) EPSP amplitudes are somewhat impaired versus non-GluRIIA control in all cases but severely impaired when GluRIIA deletion is combined with either 1 µM or 10 µM 2-APB incubation. (C) By quantal content, sustained PHP expression is abolished with acute NMJ exposure to 1 µM or 10 µM 2-APB. (D) Acute incubation 20 μM PhTox diminishes quantal size for all conditions (PhTox +DMSO vehicle or PhTox +1 µM 2-APB). (E) EPSP amplitudes are normal or near normal for all conditions. (F) Rapid PHP induction by PhTox not blocked by 1 µM 2-APB. (G) Representative electrophysiological traces (EPSPs above; mEPSPs below) for 10 µM 2-APB (or control) conditions in (A-C). (H) Representative electrophysiological traces for 1 µM 2-APB (or control) conditions in (D-F). Violin plots used as in Figure 1. *p<0.05, **p<0.01, ***p<0.001 by Student’s T-Test versus non-challenged genetic control. Scale bars in (G) also apply to (H) and are y = 10 mV (1 mV), x = 20 ms (500 ms) for EPSPs (mEPSPs).
-
Figure 5—source data 1
Raw electrophysiology data for Figure 5.
Values as in Figure 1—source data 1.
- https://doi.org/10.7554/eLife.39643.011
Figure 6
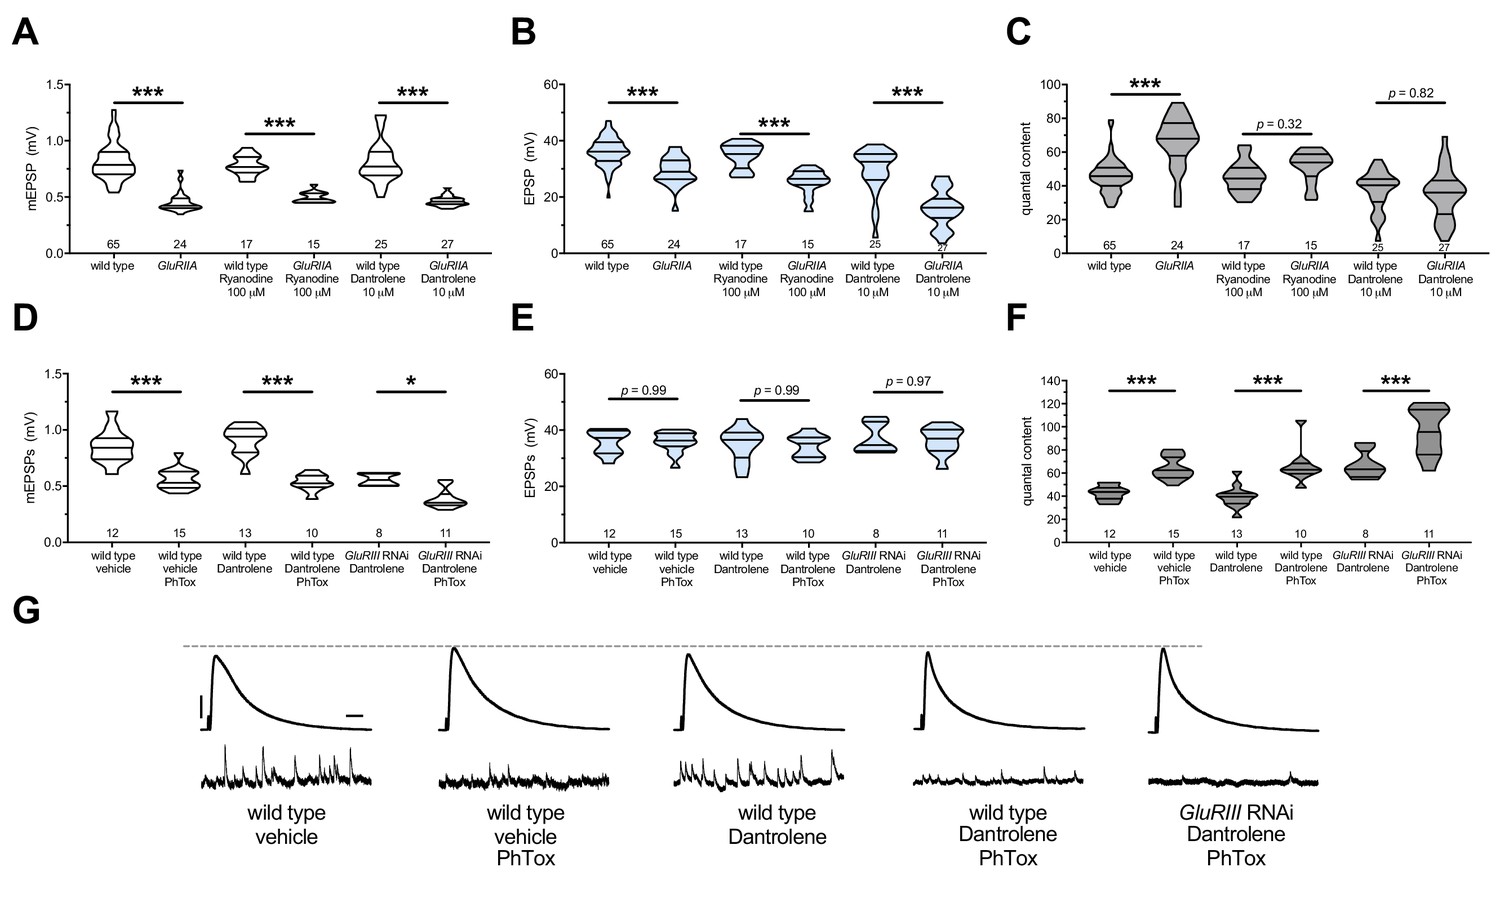
The maintenance of PHP requires continuous RyR function, but PHP induction does not.
Ryanodine or Dantrolene acutely applied to NMJs to impair RyR function. Wild-type and GluRIIA control data sets are replotted from Figures 4 and 5 for visual comparison. (A) The GluRIIASP16 deletion mutation diminishes quantal size for all experimental conditions. (B) EPSP amplitudes are somewhat impaired versus non-GluRIIA control in all cases but most severely impaired when GluRIIA deletion is combined with 10 µM Dantrolene. (C) By quantal content, sustained PHP expression is abolished with acute NMJ exposure to 100 µM Ryanodine or 10 µM Dantrolene. (D) Acute incubation 20 μM PhTox diminishes quantal size for all conditions shown. (E) EPSP amplitudes remain near genetic control levels for all conditions with PhTox application. (F) Rapid PHP induction by PhTox is intact in the presence of 10 µM Dantrolene, even when GluRIII has been knocked down throughout life. (G) Representative electrophysiological traces for the conditions in (D–F). Violin plots used as in Figure 1. Statistical comparisons are by Student’s T-Test vs. unchallenged controls. *p<0.05, **p<0.01, ***p<0.001. Scale bars for all traces are y = 10 mV (1 mV), x = 20 ms (500 ms) for EPSPs (mEPSPs).
-
Figure 6—source data 1
Raw electrophysiology data for Figure 6.
Values as in Figure 1—source data 1.
- https://doi.org/10.7554/eLife.39643.013
Figure 7
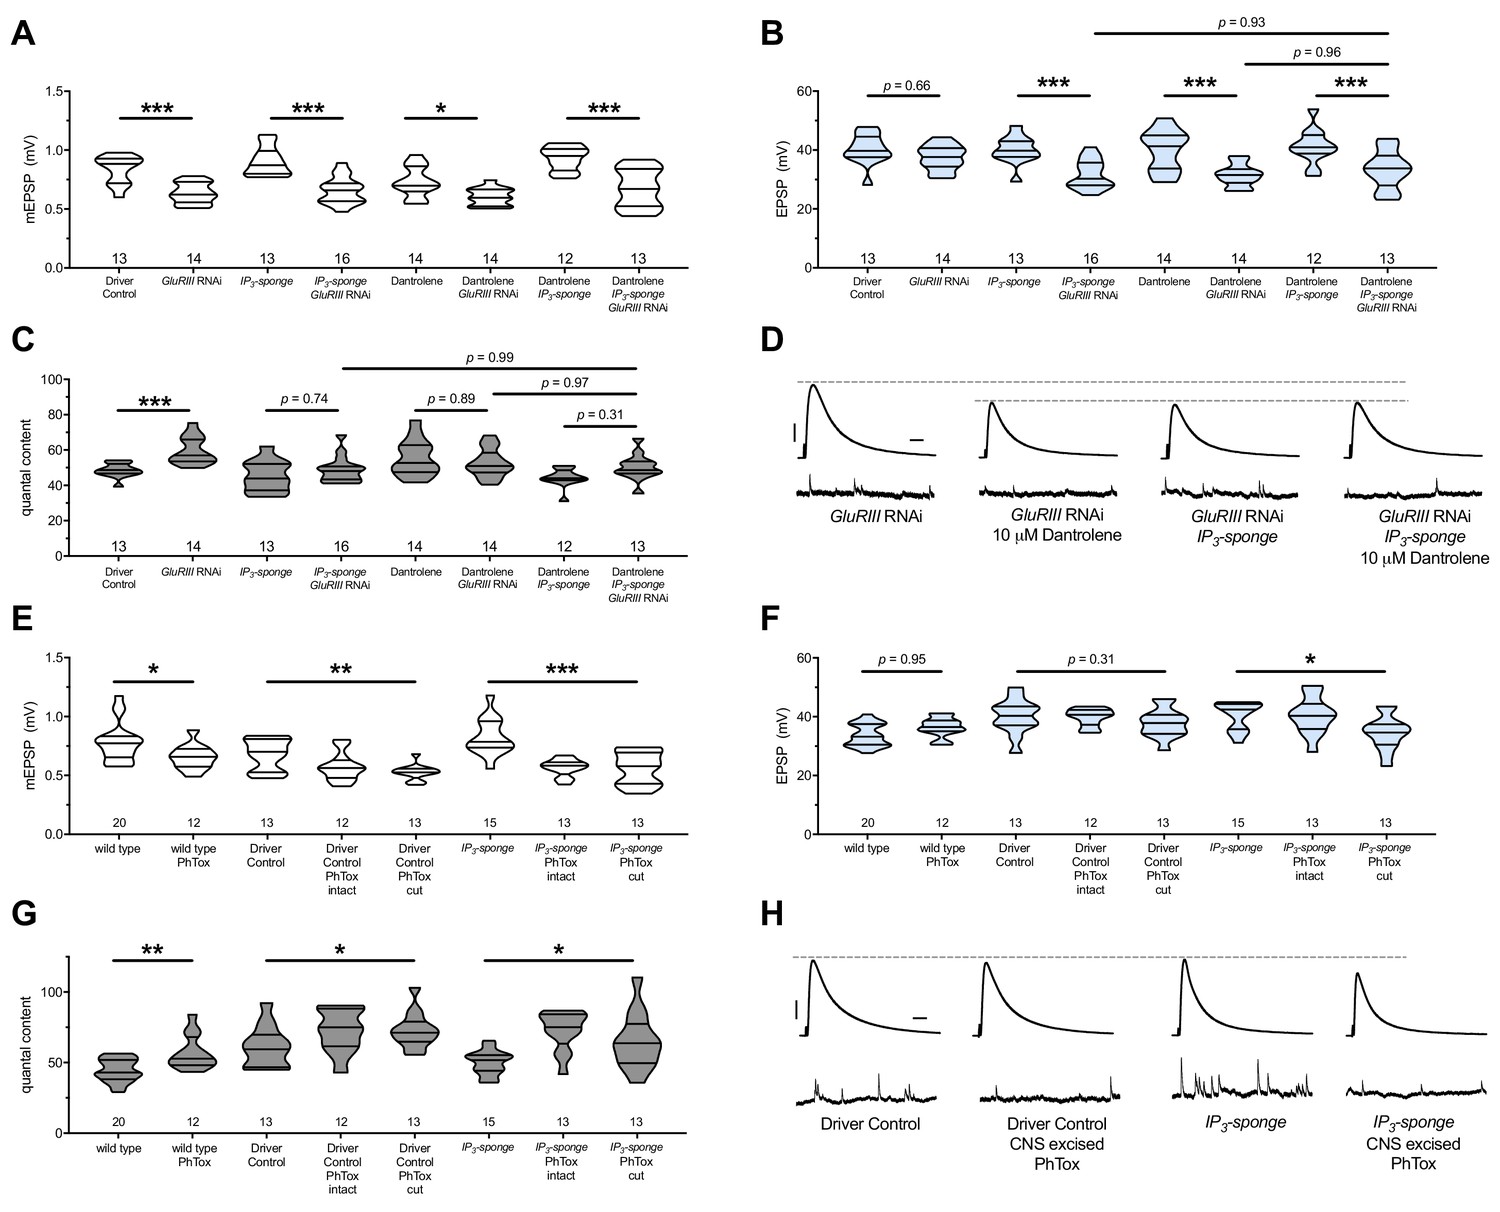
There are no additive effects of genetic IP3 signaling inhibition and pharmacological RyR inhibition.
(A) GluRIII knockdown diminishes quantal size for all experimental conditions. (B) When challenged with GluRIII knockdown, EPSP amplitudes are maintained for the GAL4 driver control background but impaired for all other experimental backgrounds. The dual manipulation of 10 µM Dantrolene +UAS-IP3-sponge is indistinguishable from the single manipulations alone. (C) By quantal content, sustained PHP expression is abolished with chronic IP3 sequestration, acute 10 µM Dantrolene application, or both. (D) Representative electrophysiological traces for the conditions in (A–C). (E) Acute incubation 20 μM PhTox diminishes quantal size for all conditions shown. (F) EPSP amplitudes remain near genetic control levels for all conditions with PhTox application. There is a slight diminishment for the condition in which UAS-IP3-sponge is expressed and PhTox application is performed only after nerve dissection. (G) Full, rapid PHP induction or partial PHP induction by PhTox is present for all conditions shown. (H) Representative electrophysiological traces for the conditions in (E–G). Violin plots used as in Figure 1. Statistical comparisons for (A–C) and for wild type vs. wild type +PhTox are by Student’s T-Test vs. unchallenged controls. Statistical comparisons across three data sets are by one-way ANOVA followed by Bonferroni post-hoc test across genotypes shown. *p<0.05, **p<0.01, ***p<0.001. Scale bars for all traces are y = 10 mV (1 mV), x = 20 ms (500 ms) for EPSPs (mEPSPs).
-
Figure 7—source data 1
Raw electrophysiology data for Figure 7.
Values as in Figure 1—source data 1.
- https://doi.org/10.7554/eLife.39643.015
Figure 8
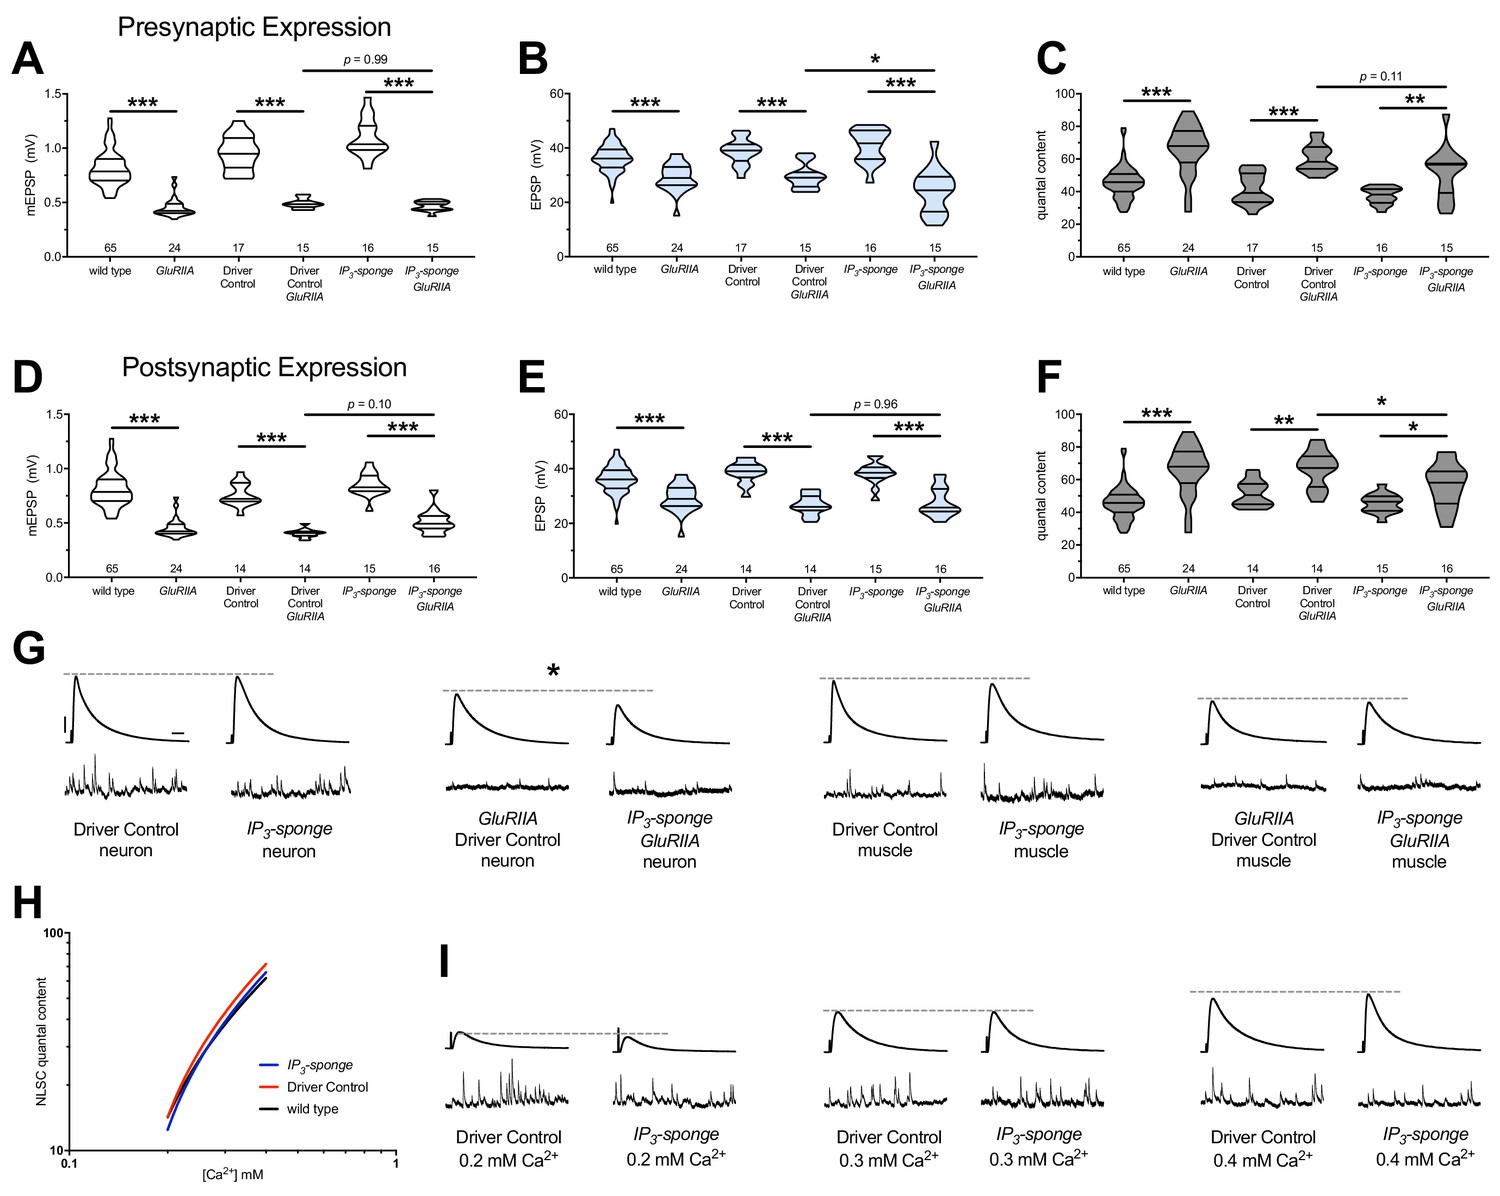
Combined pre-and postsynaptic IP3 signaling maintains PHP.
UAS-IP3-sponge transgene expression in single tissue types impairs PHP maintenance, but does not block it. IP3-sponge either in neurons (A–C) or muscle (D–F). Wild-type and GluRIIA control data sets are replotted from Figures 4–6 for visual comparison. (A) The GluRIIASP16 deletion mutation diminishes quantal size for all experimental conditions. (B) EPSP amplitudes are somewhat impaired versus non-GluRIIA control in all cases but most severely impaired when GluRIIA deletion is combined with presynaptic IP3-sponge expression. (C) By quantal content, sustained PHP is still present for all conditions shown. (D) The GluRIIASP16 deletion mutation diminishes quantal size for all experimental conditions. (E) EPSP amplitudes are somewhat impaired versus non-GluRIIA control. (F) By quantal content, sustained PHP is still present for all conditions shown. (G) Representative electrophysiological traces for conditions in (A–F). (H) UAS-IP3-sponge transgene expression does not impair calcium cooperativity of release. (I) Representative electrophysiological trances for conditions in (H). Violin plots used as in Figure 1. Statistical comparisons are by one-way ANOVA followed by Bonferroni post-hoc test across genotypes shown. *p<0.05, **p<0.01, ***p<0.001. Scale bars in (G) apply to all traces in (G) and (I) and are y = 10 mV (1 mV), x = 20 ms (500 ms) for EPSPs (mEPSPs).
-
Figure 8—source data 1
Raw electrophysiology data for Figure 8.
Values as in Figure 1—source data 1.
- https://doi.org/10.7554/eLife.39643.017
Figure 9
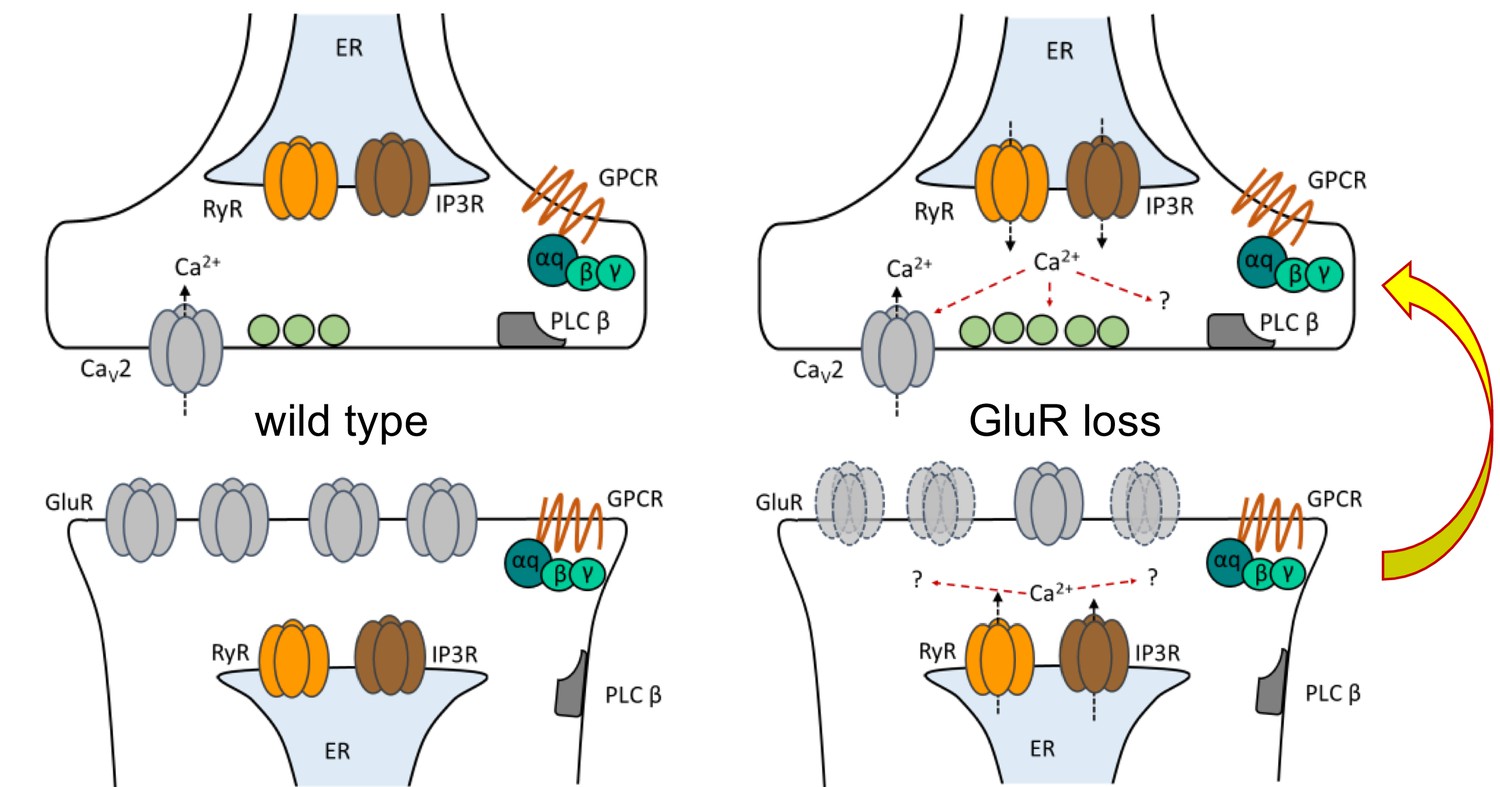
Model depicting PLCβ/IP3R/RyR signaling underling the maintenance of PHP in both muscle and neuron.
At the Drosophila NMJ, PLCβ and effectors IP3R and RyR are required for the maintenance of HSP. Left: PLCβ signaling components depicted in both muscle and neuron at the Drosophila NMJ. We detected no apparent role for PLCβ, IP3R, or RyR in baseline neurotransmission. Right: Reduced postsynaptic glutamate receptor function – either due to deletion of the GluRIIA gene or expression of UAS-GluRIII[RNAi] – drives a chronic form of PHP that is maintained throughout life. A retrograde, muscle-to-nerve signal instructs the neuron to increase the number of neurotransmitter vesicles released (quantal content). Our data support a model in which long-term maintenance of PHP requires PLCβ and its effectors in both the presynaptic neuron and postsynaptic muscle, but these factors are dispensable for the rapid induction of PHP.
Tables
Key resources table
| Reagent type (species) or resource | Designation | Source or reference | Identifiers | Additional information |
|---|---|---|---|---|
| Genetic Reagent (Drosophila melanogaster) | GluRIII[RNAi] or UAS-GluRIII[RNAi] | PMID: 25859184 | FlyBase ID:FlyBase_FBtp0110520 | UAS-pWiz transgene knocking downGluRIII gene function. This lab (CAF) is the source (Brusich et al., 2015). |
| Genetic Reagent (D. melanogaster) | Plc21C[RNAi] or UAS-Plc21C[RNAi] | Vienna Drosophila Resource Center (GD11359); PMID: 17625558 | RRID:FlyBase_FBst0456476 | UAS-RNAi transgene |
| Genetic Reagent (D. melanogaster) | Plc21C[RNAi] or UAS-Plc21C[RNAi] | Vienna Drosophila Resource Center (GD11359); PMID: 17625558 | RRID:FlyBase_FBst0456477 | UAS-RNAi transgene |
| Genetic Reagent (D. melanogaster) | UAS-IP3-sponge.m30 | PMID: 16540404 | FlyBase ID:FlyBase_FBtp0068098 | also referred to as UAS-IP3-sponge |
| Genetic Reagent (D. melanogaster) | UAS-IP3-sponge.m49 | PMID: 16540404 | FlyBase ID:FlyBase_FBtp0068099 | also referred to as UAS-IP3-sponge |
| Genetic Reagent (D. melanogaster) | GluRIIASP16 | PMID: 9427247 | RRID:BDSC_64202 | deletion allele; also referred to as GluRIIA |
| Genetic Reagent (D. melanogaster) | w1118 | PMID: 6319027 | RRID:BDSC_3605 | wild-type genetic background |
| Genetic Reagent (D. melanogaster) | elaV(C155)-Gal4 | PMID: 7917288 | RRID:BDSC_458 | also known as C155-Gal4 |
| Genetic Reagent (D. melanogaster) | Sca-Gal4 | PMID: 8893021 | FlyBase ID:FlyBase_FBtp0007534 | |
| Genetic Reagent (D. melanogaster) | BG57-Gal4 | PMID: 8893021 | FlyBase ID:FlyBase_FBti0016293 | also known as C57-Gal4 |
| Chemical Compound, Drug | Philanthotoxin-433; PhTox | Sigma-Aldrich (MilliporeSigma); Santa Cruz Biotechnology | CAS Number:(Sigma-Aldrich and Santa Cruz Biotechnology)_276684-27-6 | product P207 discontinued by Sigma-Aldrich |
| Chemical Compound, Drug | Xestospongin C | Abcam | CAS Number:Abcam_88903-69-9 | |
| Chemical Compound, Drug | 2-APB | Tocris | CAS Number:Tocris_524-95-8 | |
| Chemical Compound, Drug | Ryanodine | Tocris | CAS Number:Tocris_15662-33-6 | |
| Chemical Compound, Drug | Dantrolene | Tocris | CAS Number:Tocris_14663-23-1 | |
| Antibody | Monoclonal mouse anti-Synapsin | DSHB (3C11) | Cat#: DSHB_3C11; RRID:AB_2313867 | (1:50) |
| Antibody | Polyclonal rabbit anti-Dlg | PMID: 8893021 | (1:15,000) | |
| Antibody | Polyclonal goat anti-mouse 488 (DyLight) | Jackson ImmunoResearch | Cat #:Jackson_ 115-485-003; (no RRID) | (1:1000) discontinued; substitute with Cat# 115-485-068; RRID:AB_2338804 |
| Antibody | Polyclonal goat anti-rabbit 549 (DyLight) | Jackson ImmunoResearch | Cat#:Jackson_111-505-003; RRID:AB_2493180 | (1:2000) discontinued; substitute with Cat# 111-165-003; RRID:AB_2338000 |
| Antibody | Polyclonal goat anti-HRP (Alexa-647) | Jackson ImmunoResearch | Cat#:Jackson_123-605-021; RRID:AB_2338967 | (1:250) |
| Software, Algorithm | pClamp | Molecular Devices | RRID:SCR_011323 | |
| Software, Algorithm | MiniAnalysis Program | Synaptosoft | RRID:SCR_002184 | |
| Software, Algorithm | GraphPad Prism | GraphPad | RRID:SCR_002798 |
Additional files
-
Supplementary file 1
Summary electrophysiological data for Figure 1 (Plc21C RNAi experiments).
Genotypes and/or conditions are denoted. For GAL4 drivers, ‘Pre +Post Gal4’ denotes a genetic combination of elaV(C155)-Gal4/Y; Sca-Gal4/+; BG57-Gal4/+. Average values ± SEM are presented for each electrophysiological parameter, with n = number of NMJs recorded. Values include miniature excitatory postsynaptic potential (mEPSP) amplitude, mEPSP frequency (Freq), excitatory postsynaptic potential (EPSP) amplitude, quantal content (QC), and QC corrected for non-linear summation (NLS). *p<0.05, **p<0.01, ***p<0.001 vs. unchallenged control.
- https://doi.org/10.7554/eLife.39643.019
-
Supplementary file 2
Summary electrophysiological data for Figure 2 (screen and follow-up).
Genotypes and/or conditions are denoted. The data are split into two tables. The first table summarizes the screen data from Figure 2A. The second table summarizes the follow-up data examining the UAS-IP3-sponge reagent, including the homoeostatic block identified in the screen. Average values ± SEM are presented for each electrophysiological parameter, with n = number of NMJs recorded. Values include miniature excitatory postsynaptic potential (mEPSP) amplitude, mEPSP frequency (Freq), excitatory postsynaptic potential (EPSP) amplitude, quantal content (QC), and QC corrected for non-linear summation (NLS). *p<0.05, **p<0.01, ***p<0.001 vs. unchallenged control.
- https://doi.org/10.7554/eLife.39643.020
-
Supplementary file 3
Summary electrophysiological data for Figure 4 (Xestospongin C application).
Genotypes and/or conditions are denoted. Average values ± SEM are presented for each electrophysiological parameter, with n = number of NMJs recorded. Values include miniature excitatory postsynaptic potential (mEPSP) amplitude, mEPSP frequency (Freq), excitatory postsynaptic potential (EPSP) amplitude, quantal content (QC), and QC corrected for non-linear summation (NLS). *p<0.05, **p<0.01, ***p<0.001 vs. unchallenged control.
- https://doi.org/10.7554/eLife.39643.021
-
Supplementary file 4
Summary electrophysiological data for Figure 5 (2-APB application).
Genotypes and/or conditions are denoted. Average values ± SEM are presented for each electrophysiological parameter, with n = number of NMJs recorded. Values include miniature excitatory postsynaptic potential (mEPSP) amplitude, mEPSP frequency (Freq), excitatory postsynaptic potential (EPSP) amplitude, quantal content (QC), and QC corrected for non-linear summation (NLS). *p<0.05, **p<0.01, ***p<0.001 vs. unchallenged control.
- https://doi.org/10.7554/eLife.39643.022
-
Supplementary file 5
Summary electrophysiological data for Figure 6 (Ryanodine and Dantrolene applications).
Genotypes and/or conditions are denoted. Average values ± SEM are presented for each electrophysiological parameter, with n = number of NMJs recorded. Values include miniature excitatory postsynaptic potential (mEPSP) amplitude, mEPSP frequency (Freq), excitatory postsynaptic potential (EPSP) amplitude, quantal content (QC), and QC corrected for non-linear summation (NLS). *p<0.05, **p<0.01, ***p<0.001 vs. unchallenged control.
- https://doi.org/10.7554/eLife.39643.023
-
Supplementary file 6
Summary electrophysiological data for Figure 7 (manipulation interaction analyses).
Genotypes and/or conditions are denoted. Average values ± SEM are presented for each electrophysiological parameter, with n = number of NMJs recorded. Values include miniature excitatory postsynaptic potential (mEPSP) amplitude, mEPSP frequency (Freq), excitatory postsynaptic potential (EPSP) amplitude, quantal content (QC), and QC corrected for non-linear summation (NLS). *p<0.05, **p<0.01, ***p<0.001 vs. unchallenged control.
- https://doi.org/10.7554/eLife.39643.024
-
Supplementary file 7
Summary electrophysiological data for Figure 8 (tissue specificity analyses).
Genotypes and/or conditions are denoted. Average values ± SEM are presented for each electrophysiological parameter, with n = number of NMJs recorded. Values include miniature excitatory postsynaptic potential (mEPSP) amplitude, mEPSP frequency (Freq), excitatory postsynaptic potential (EPSP) amplitude, quantal content (QC), and QC corrected for non-linear summation (NLS). *p<0.05, **p<0.01, ***p<0.001 vs. unchallenged control.
- https://doi.org/10.7554/eLife.39643.025
-
Transparent reporting form
- https://doi.org/10.7554/eLife.39643.026
Download links
A two-part list of links to download the article, or parts of the article, in various formats.
Downloads (link to download the article as PDF)
Open citations (links to open the citations from this article in various online reference manager services)
Cite this article (links to download the citations from this article in formats compatible with various reference manager tools)
Maintenance of homeostatic plasticity at the Drosophila neuromuscular synapse requires continuous IP3-directed signaling
eLife 8:e39643.
https://doi.org/10.7554/eLife.39643


