Pericentromeric hypomethylation elicits an interferon response in an animal model of ICF syndrome
- Cornell University, United States
- Memorial Sloan Kettering Cancer Center, United States
- University of Georgia, United States
- Albert Einstein College of Medicine, United States
- Washington University in St. Louis School of Medicine, United States
Figures
Figure 1 with 4 supplements

Mutation of zbtb24 causes ICF syndrome-like phenotypes in zebrafish.
(A) Schematic of human and zebrafish Zbtb24 proteins. The BTB/POZ domain is indicated in blue and C2H2-type zinc fingers in dark grey. (B) Schematic of zebrafish zbtb24 gene. Location of TALEN target sequences are indicated in red (not to scale). Brackets indicate the region deleted by the zbtb24mk22(Δ) allele. (C) Representative images of zbtb24+/+ and zbtb24Δ/Δ zebrafish at 2 wpf. Scale bar: 1 mm. (D) Standard length measurements for zbtb24+/+ and zbtb24Δ/Δ zebrafish at 1, 2, 3 and 4 wpf (n ≥ 6 for each group). (E) Representative images of zbtb24+/+ and zbtb24Δ/Δ zebrafish at 5 months. Scale bar: 5 mm. (F) Average weight of zbtb24+/+ and zbtb24Δ/Δ zebrafish at 5 months (n = 5 for each group). (G) Representative images of facial abnormalities in zbtb24+/+ and zbtb24Δ/Δ adults at 6 months. Scale bar: 2 mm. (H) Schematic and quantification of facial abnormalities in zbtb24Δ/Δ zebrafish (n = 5 for each group). (I) Abundance of IgM, IgD and IgZ transcripts in zbtb24+/+ and zbtb24Δ/Δ zebrafish at 6 weeks post fertilization (n = 5 for each group). (J) Quantification of lymphoid cell populations in total blood isolated from zbtb24+/+ or zbtb24Δ/Δ kidney marrow from adults, measured by Forward/Side scatter flow cytometry (n = 11 for each group). (K) Kaplan-Meier curve indicating survival among groups of zbtb24+/+ and zbtb24Δ/Δ zebrafish (n = 12 for each group). All error bars indicate standard error of the mean (SEM).
Figure 1—figure supplement 1
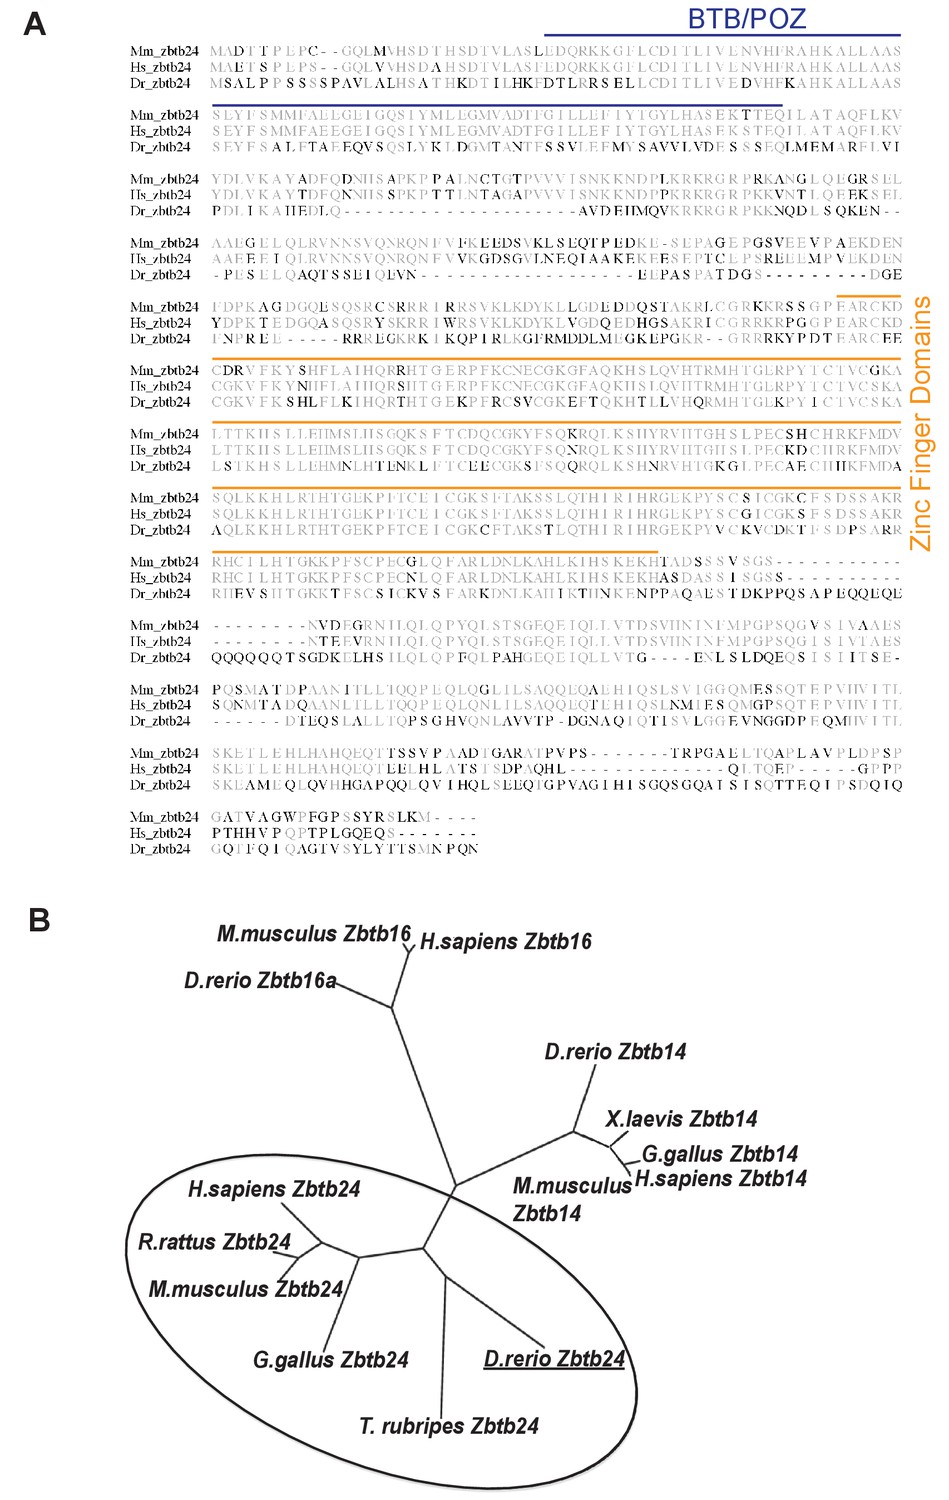
Zbtb24 conservation in vertebrate species.
https://doi.org/10.7554/eLife.39658.004
Figure 1—figure supplement 2
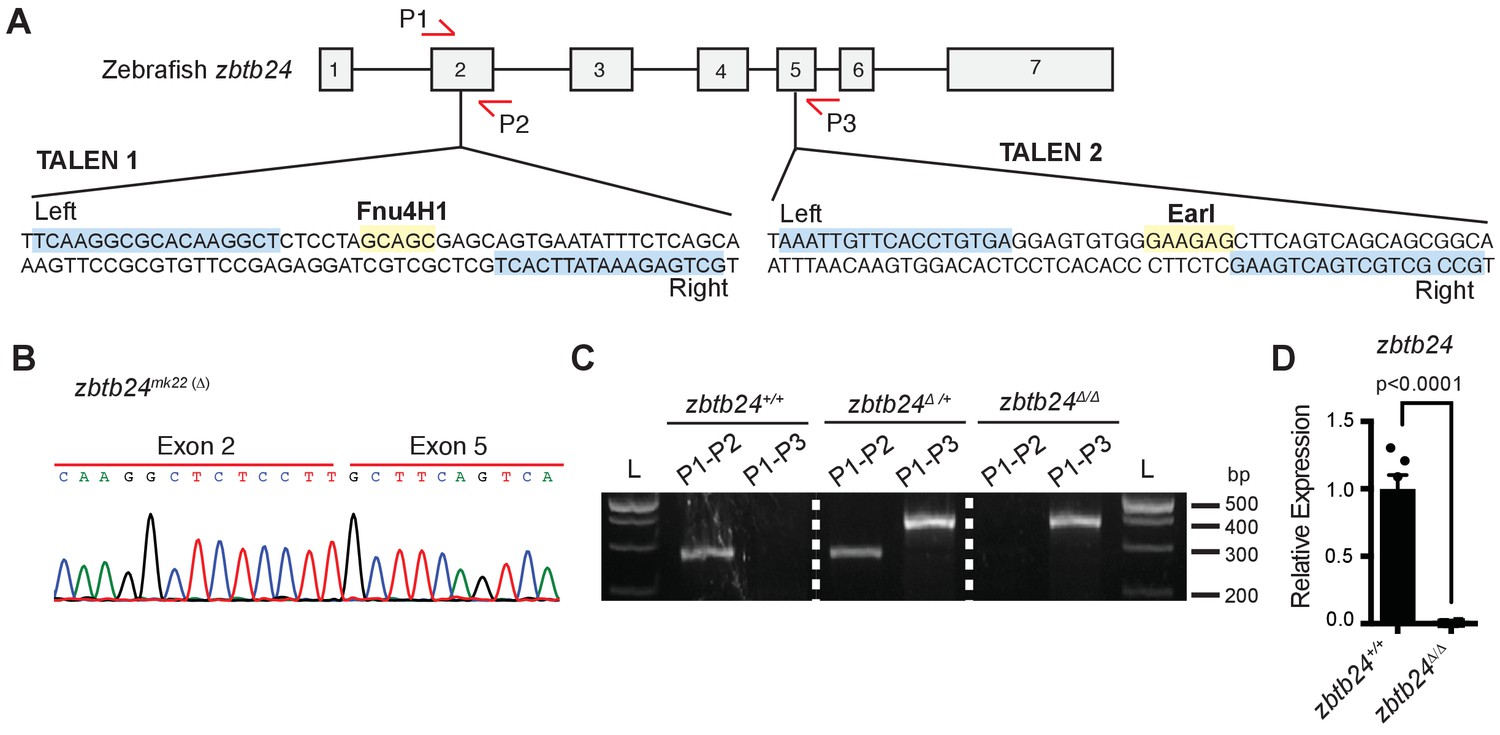
TALEN design for introducing mutations at the endogenous zbtb24 zebrafish gene.
(A) Schematic of TALEN sequences showing target sites for introducing mutations in zbtb24. P1, P2 and P3 indicate locations for genotyping primers. Sequence in blue indicate target site. Sequence in yellow indicates site of restriction enzyme digestion. (B) Sequence trace confirming generation of large deletion, zbtb24mk22(∆). (C) Representative genotyping of zbtb24mk22(∆) allele. L: Ladder. P1, P2, P3 represent primers from panel A used for amplifying product in specified lane. (D) qRT-PCR analysis of zbtb24 mRNA in zbtb24+/+ and zbtb24Δ/Δ zebrafish at 2 wpf (n = 6 for each group).
Figure 1—figure supplement 3
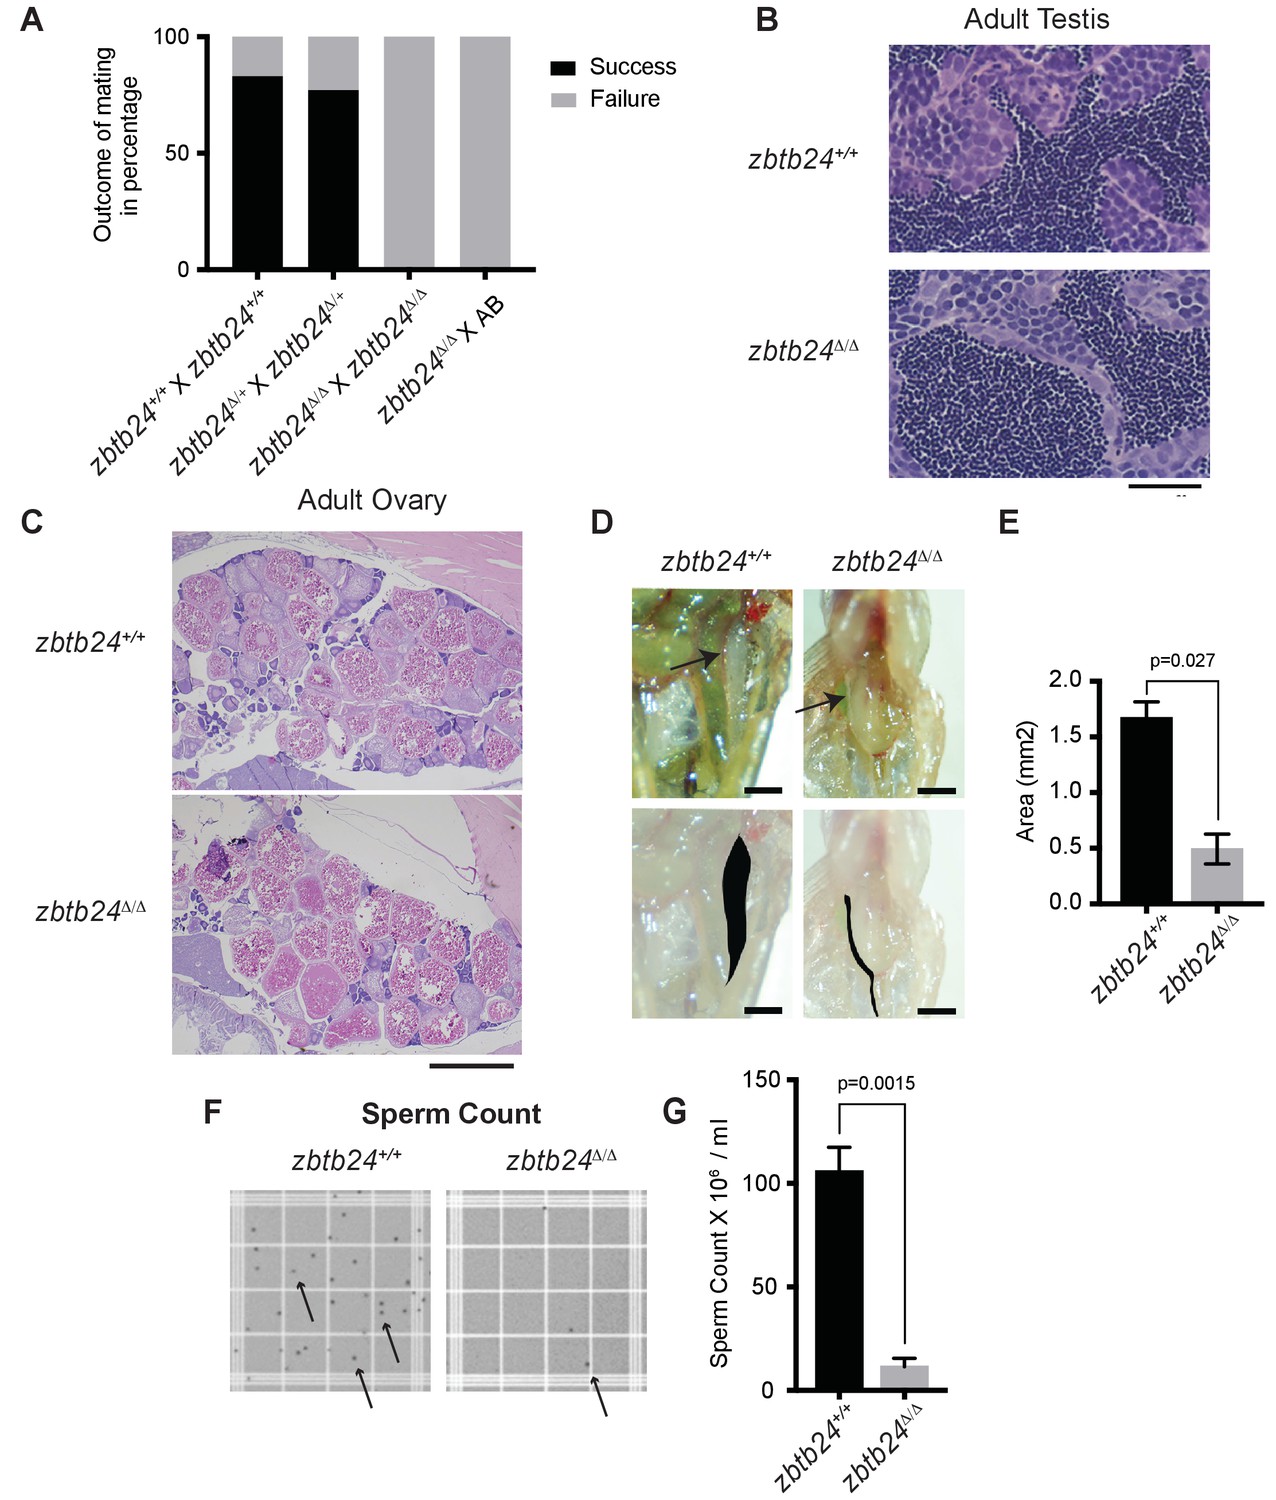
Fertility and gonad analysis in zbtb24Δ/Δ mutants.
(A) Outcome of mating for the indicated crosses. Success and failure are defined respectively as generation or lack of fertilized embryos from a male x female cross. (B) H and E staining of cross-section of testes dissected from adult zbtb24+/+ and zbtb24Δ/Δ zebrafish. Scale: 20 um. (C) H and E staining of cross-section of adult zbtb24+/+ and zbtb24Δ/Δ zebrafish ovaries. Scale: 1 mm. (D) Brightfield images of adult testes in zbtb24+/+ and zbtb24Δ/Δ zebrafish. The lower panel highlights the trace of the testis shaded in black. Scale: 1 mm. (E) Area of the black shaded region in panel D was used to measure the size of the testis. Error bars indicate SD from two biological replicates. (F) Brightfield images of counting chamber grid used to count sperm. Black specks (arrows) indicate individual sperm. (G) Sperm count from crushed testes dissected from adult zbtb24+/+ and zbtb24Δ/Δ zebrafish. Error bars indicate SEM from three biological replicates.
Figure 1—figure supplement 4
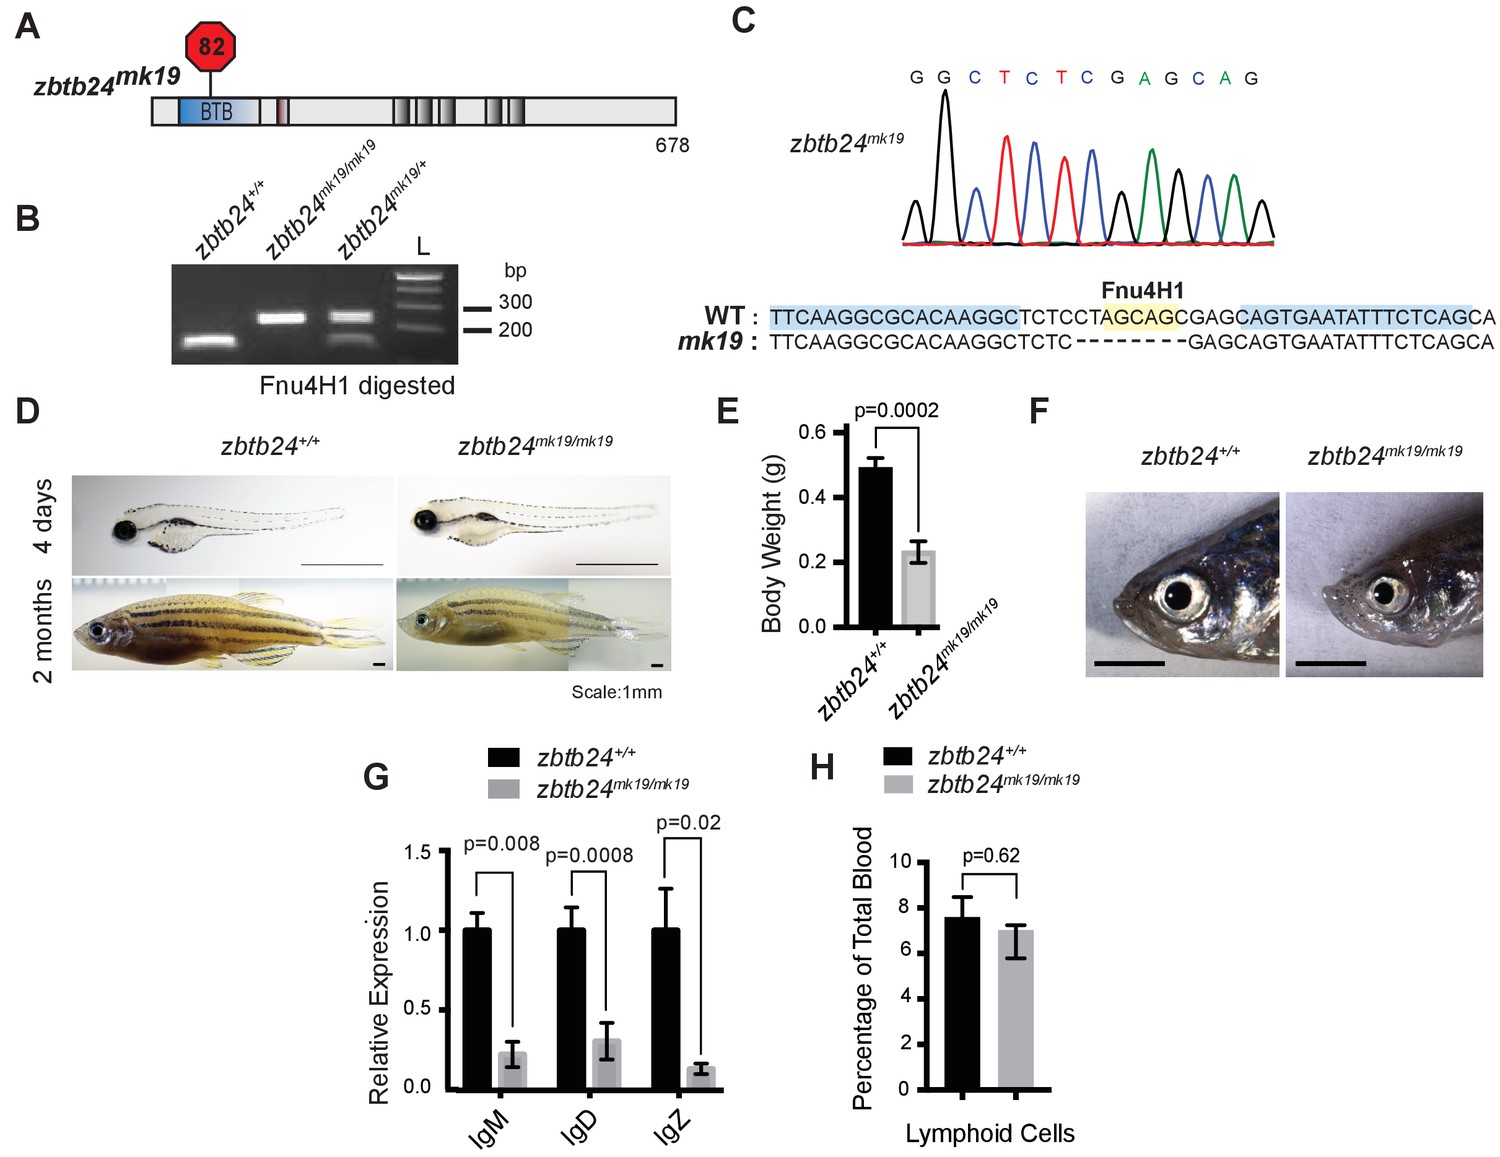
A second mutant allele of zbtb24 recapitulates key features of ICF Syndrome.
(A) Schematic of zbtb24mk19 with premature stop codon at aa 82. (B) Representative genotyping of zbtb24mk19 allele. (C) Sequence trace confirming generation of small deletion allele, zbtb24mk19. (D) Representative bright field image of zbtb24+/+ and zbtb24mk19/mk19 zebrafish at 4 days and 2 months after fertilization. Scale bar: 1 mm. (E) Quantification of body weight of zbtb24+/+ and zbtb24mk19/mk19 zebrafish at 5 months (n ≥ 6 biological replicates). (F) Facial abnormalities in zbtb24+/+ and zbtb24mk19/mk19 zebrafish. Scale bar: 3 mm. (G) qRT-PCR analysis of IgM, IgD and IgZ zebrafish immunoglobulins in zbtb24+/+ and zbtb24mk19/mk19 zebrafish measured at 6 weeks post fertilization (n = 5 biological replicates). (H) Quantification of lymphoid cell populations in total blood isolated from zbtb24+/+ and zbtb24mk19/mk19 adult kidney marrow, measured by Forward/Side scatter flow cytometry (n = 16 biological replicates). All error bars indicate standard error of the mean (SEM).
Figure 2 with 5 supplements
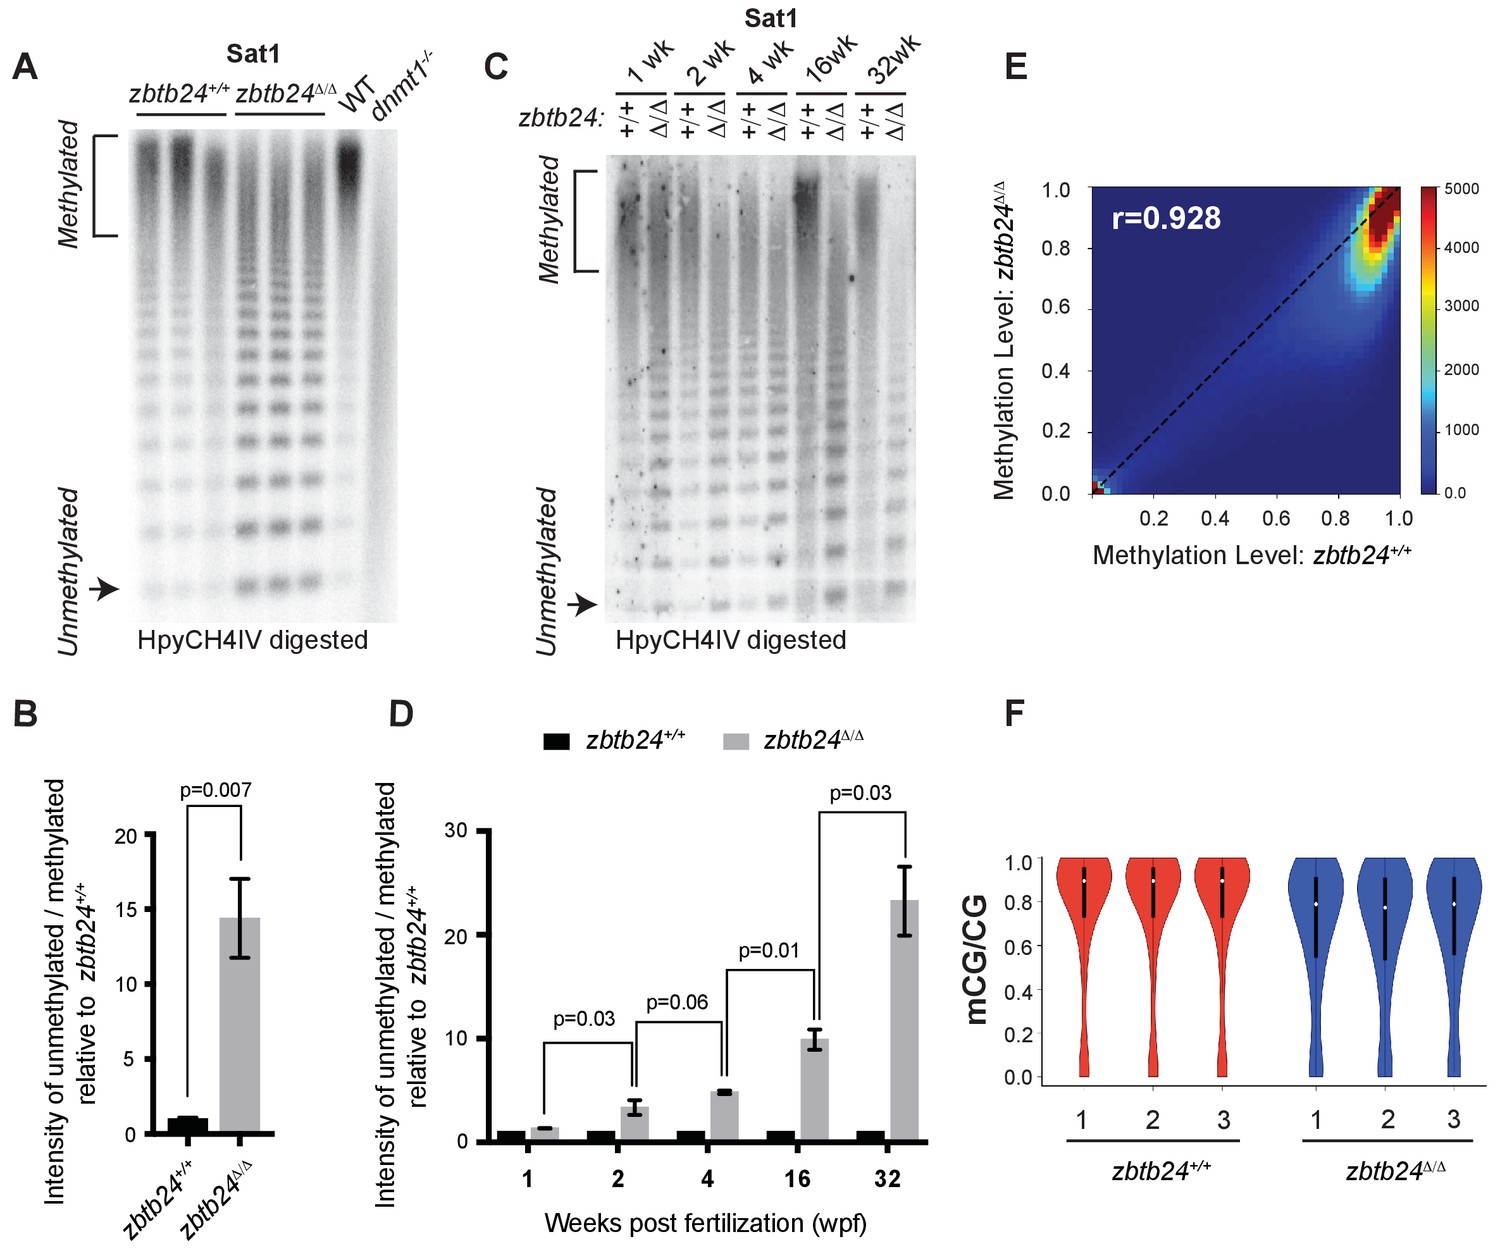
Mutation of zbtb24 causes progressive methylation loss at pericentromeric satellite repeats.
(A) Southern blot of genomic DNA digested with 5mC-sensitive restriction enzyme HpyCH4IV and probed with zebrafish Sat1 sequence. Each lane represents DNA isolated from one adult individual of the indicated genotype. DNA from dnmt1-/- zebrafish larvae at 7 days post fertilization and their phenotypically wild-type siblings (WT) provides a positive control. (B) Quantification of methylation changes at Sat1 sequences in panel A). Error bars indicate SEM from the three biological replicates. (C) Southern blot of genomic DNA digested with 5mC-sensitive restriction enzyme HpyCH4IV and probed with zebrafish Sat1 sequence. Genomic DNA was isolated from zbtb24+/+ and zbtb24Δ/Δ animals at 1, 2, 4, 16 and 32 wpf as indicated. (D) Quantification of methylation changes at Sat1 sequences in panel C). Data represent averages from two independent experiments. Error bars represent the standard deviation (SD). (E) Correlation heat map of CpG methylation levels in zbtb24+/+ and zbtb24Δ/Δ as assessed by ERRBS (Data reflects three biological replicates of each genotype). The density of CpGs increases from blue to dark red. (F) Violin Plots indicating overall CpG methylation levels in fins from adult zbtb24+/+ and zbtb24Δ/Δ zebrafish.
Figure 2—figure supplement 1
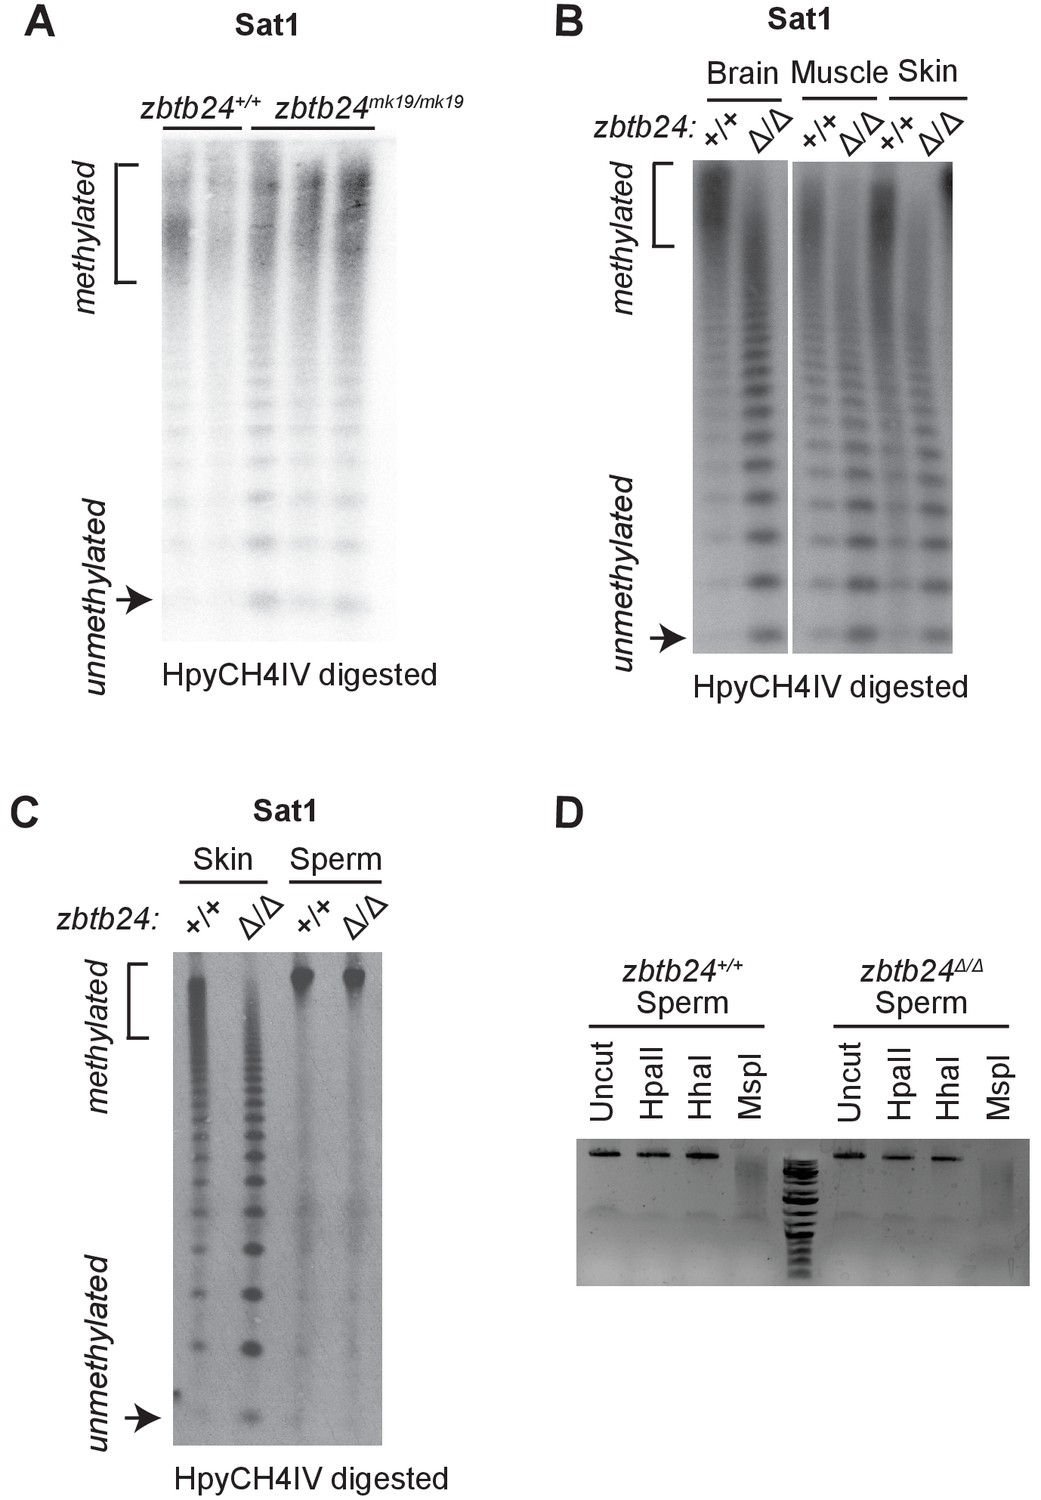
Zbtb24 mutation causes methylation loss at pericentromeric repeats.
(A) Southern blot of genomic DNA digested with 5mC-sensitive restriction enzyme HpyCH4IV and probed with zebrafish Sat1 sequence. Genomic DNA was isolated at 1 month from zbtb24+/+ and zbtb24mk19/mk19 animals. Each lane represents one biological replicate for the indicated genotype. (B) Southern blot of genomic DNA from different tissues in zbtb24+/+ and zbtb24Δ/Δ digested with 5mC-sensitive restriction enzyme HpyCH4IV and probed with zebrafish Sat1 sequence. Each lane represents pooled DNA samples of the indicated tissue from three zebrafish adults. (C) Southern blot of genomic DNA from Skin and sperm from adult zbtb24+/+ and zbtb24Δ/Δ digested with 5mC-sensitive restriction enzyme HpyCH4IV and probed with zebrafish Sat1 sequence. (D) Ethidium bromide gel with genomic DNA collected from sperm digested with methylation sensitive enzymes, HpaII and HhaI and the methylation-insensitive isoschizomer of HpaII, MspI.
Figure 2—figure supplement 2
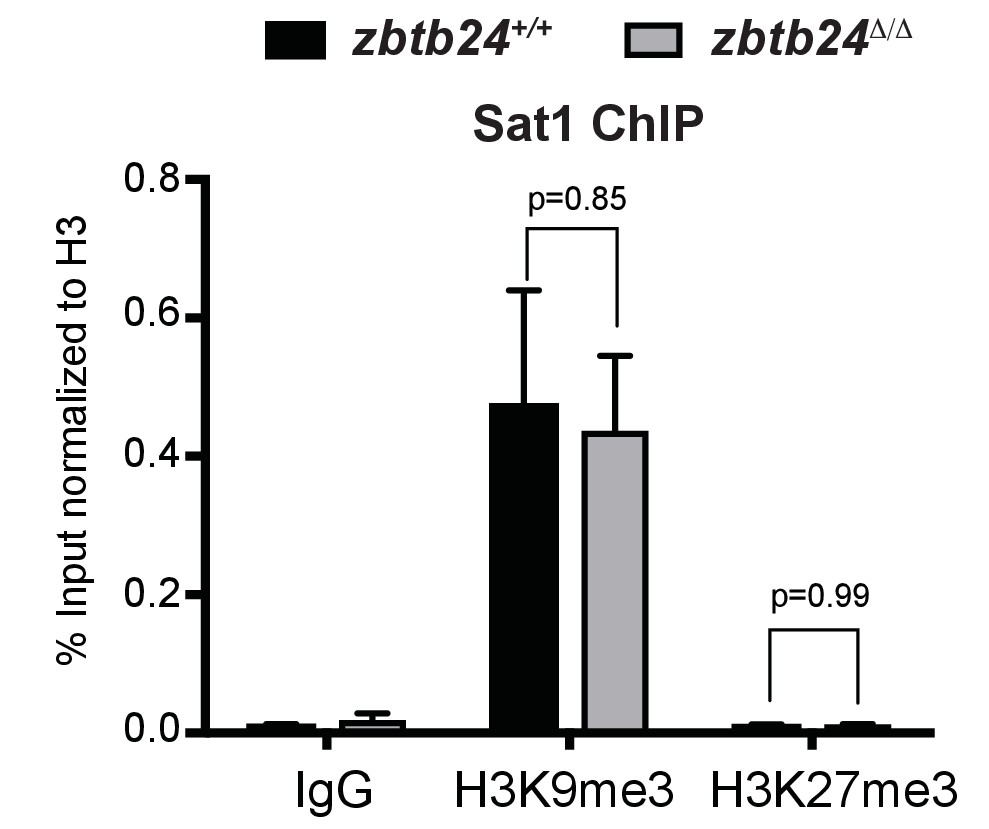
Repressive histone modifications are unaffected in zbtb24Δ/Δ mutants.
ChIP-qPCR analysis of H3K9me3 and H3K27me3 at Sat1 repeats in zbtb24+/+ and zbtb24Δ/Δ. Chromatin was collected from whole fish at 1 month post fertilization. Error bars indicate SEM with three biological replicates.
Figure 2—figure supplement 3
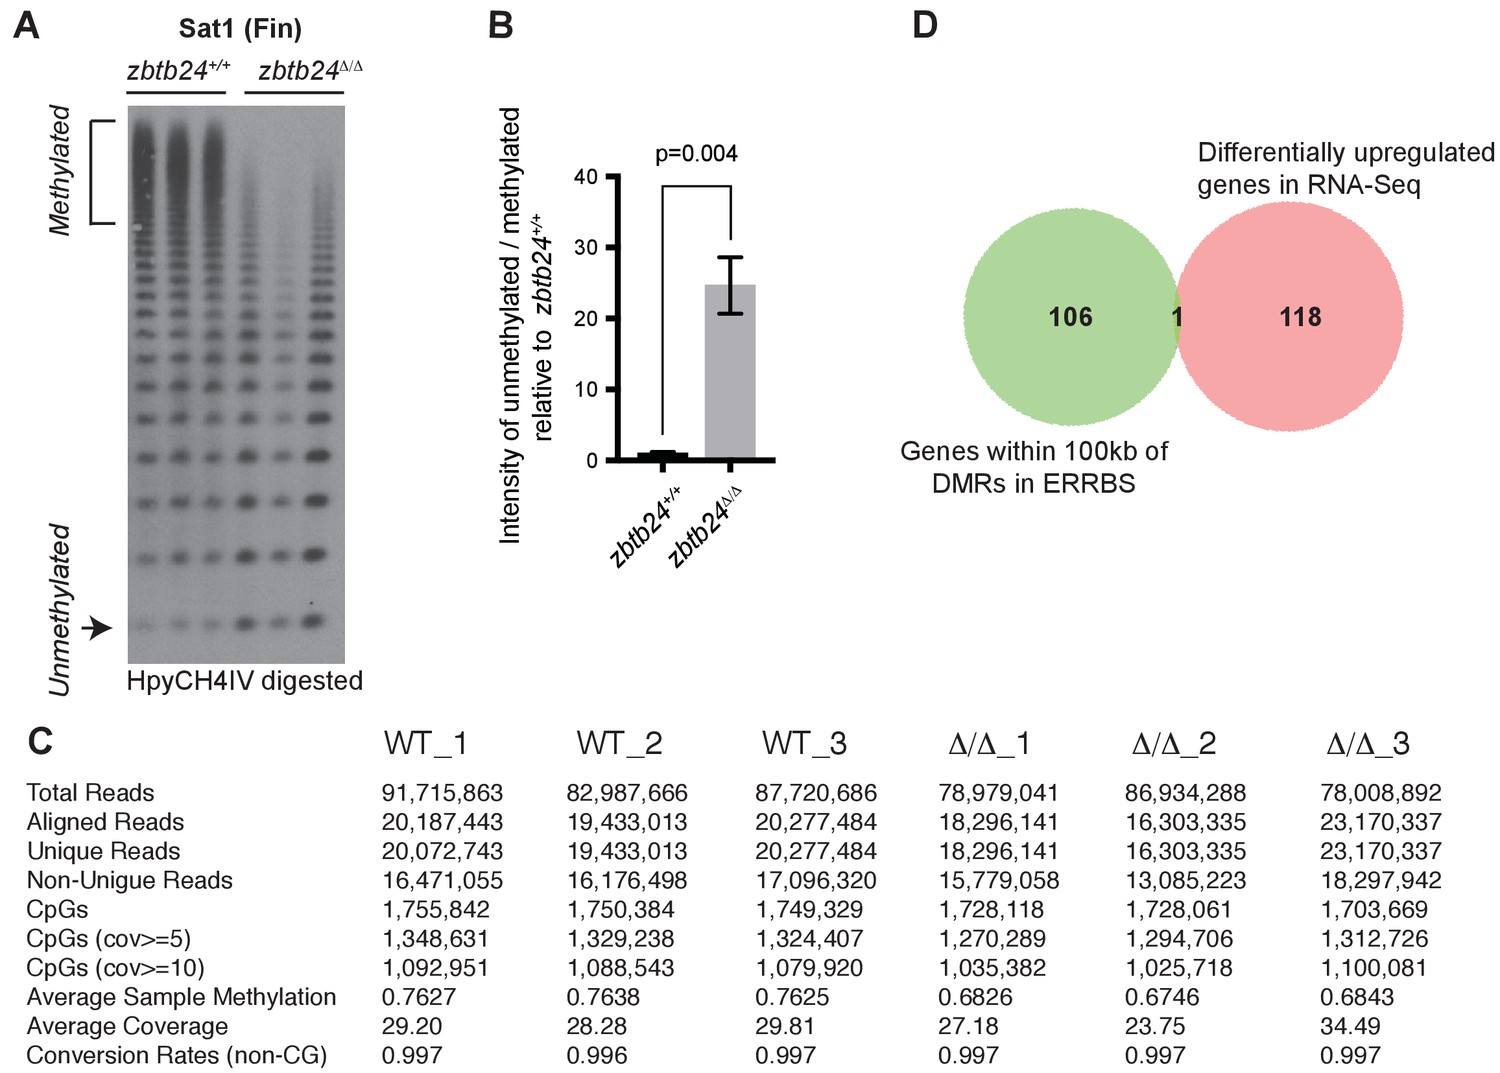
Zbtb24 mutants exhibit modest reductions in 5mC at non-pericentromeric sequences.
(A–B) Southern Blot and quantification of HpyCH4IV digestion at Sat1 sequences in fin tissues used for ERRBS. (C) Basic statistics of ERRBS analysis in zbtb24+/+ and zbtb24Δ/Δ zebrafish. (D) Venn diagram summarizing the overlap between differentially upregulated genes from RNA-Seq (right circle) and genes within 100 kb of all DMRs in ERRBS tested for differential expression (left circle).
Figure 2—figure supplement 4
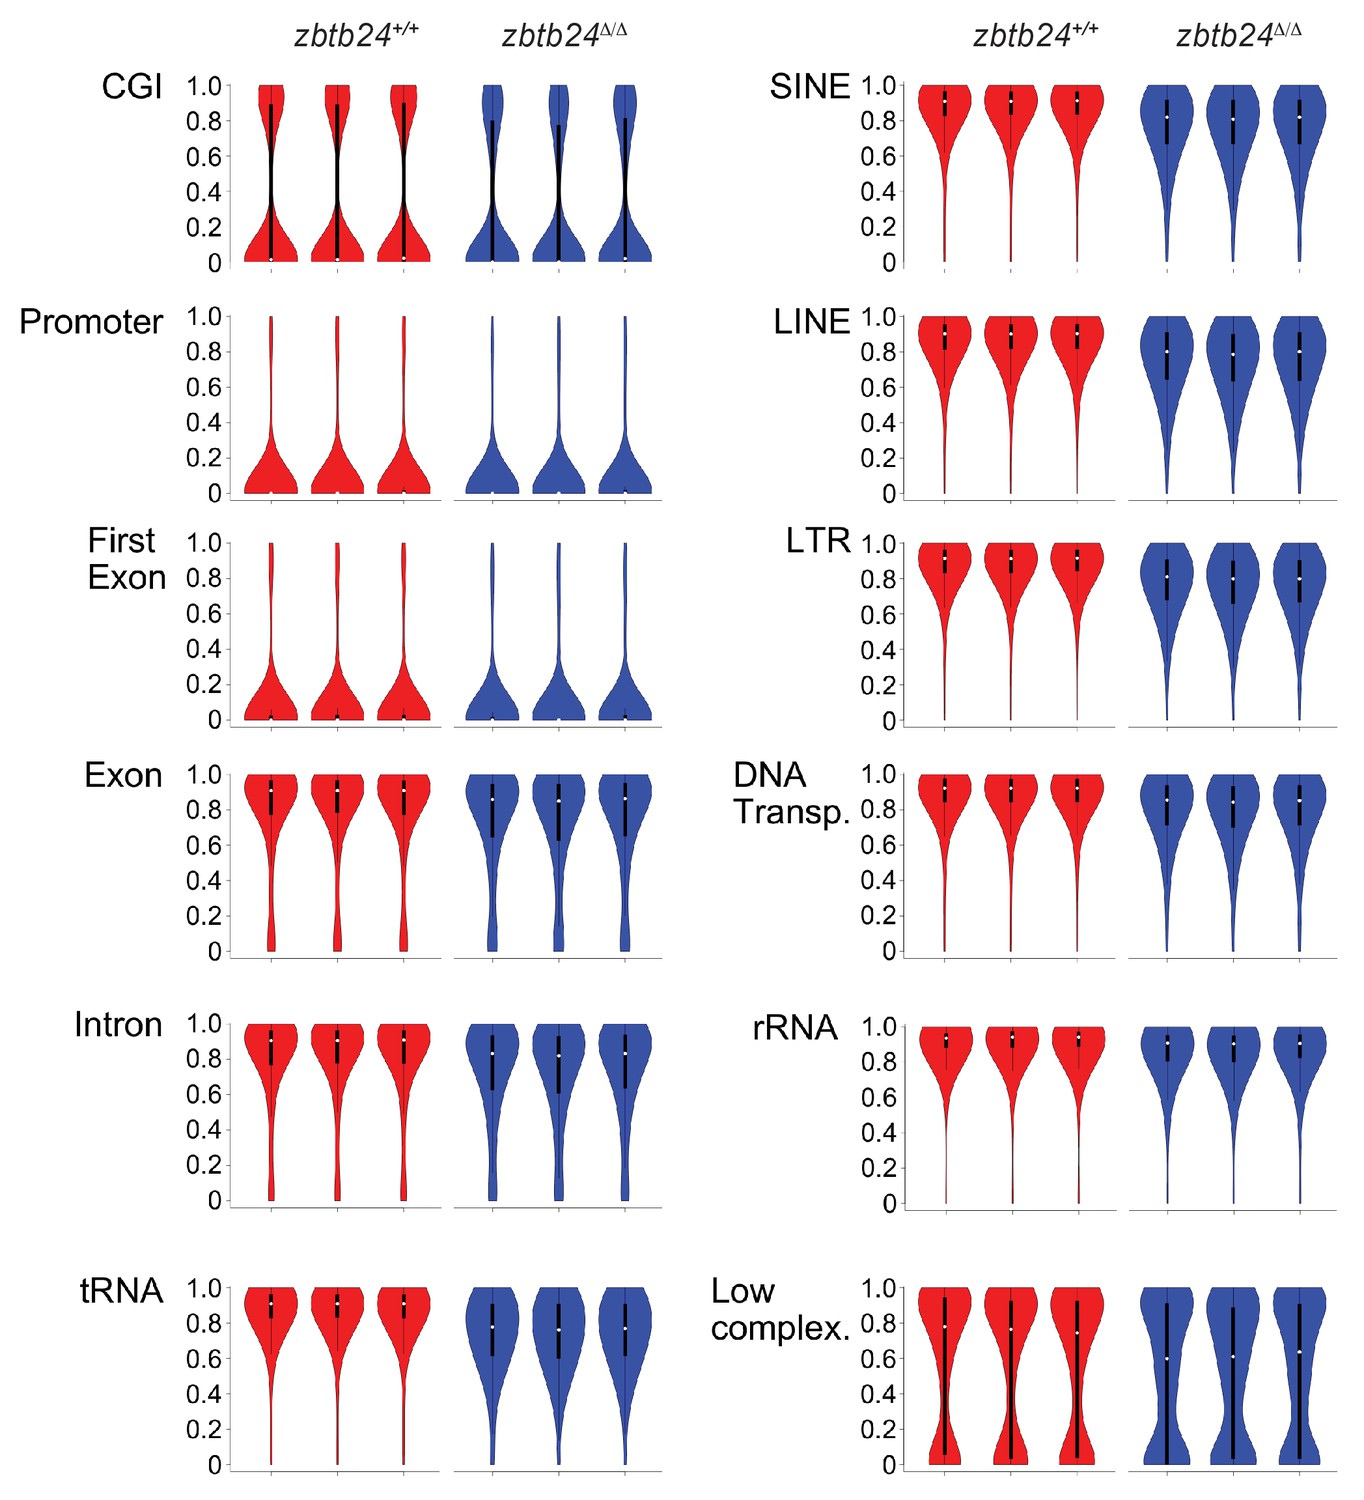
DNA Methylation levels at different genomic classes.
Violin plots indicating CpG methylation in fins from adult zbtb24+/+ and zbtb24Δ/Δ zebrafish at various genomic classes. The annotations are based on CGI, Repeatmasker, and RefSeq (only ‘cmpl’ entries) tracks from the UCSC genome browser (DanRer7). Promoters are defined as the region ±500 bp around the TSS. All CpGs had coverage >= 10. DNA Transp.: DNA Transposons, Low complex.: Low Complexity.
Figure 2—figure supplement 5
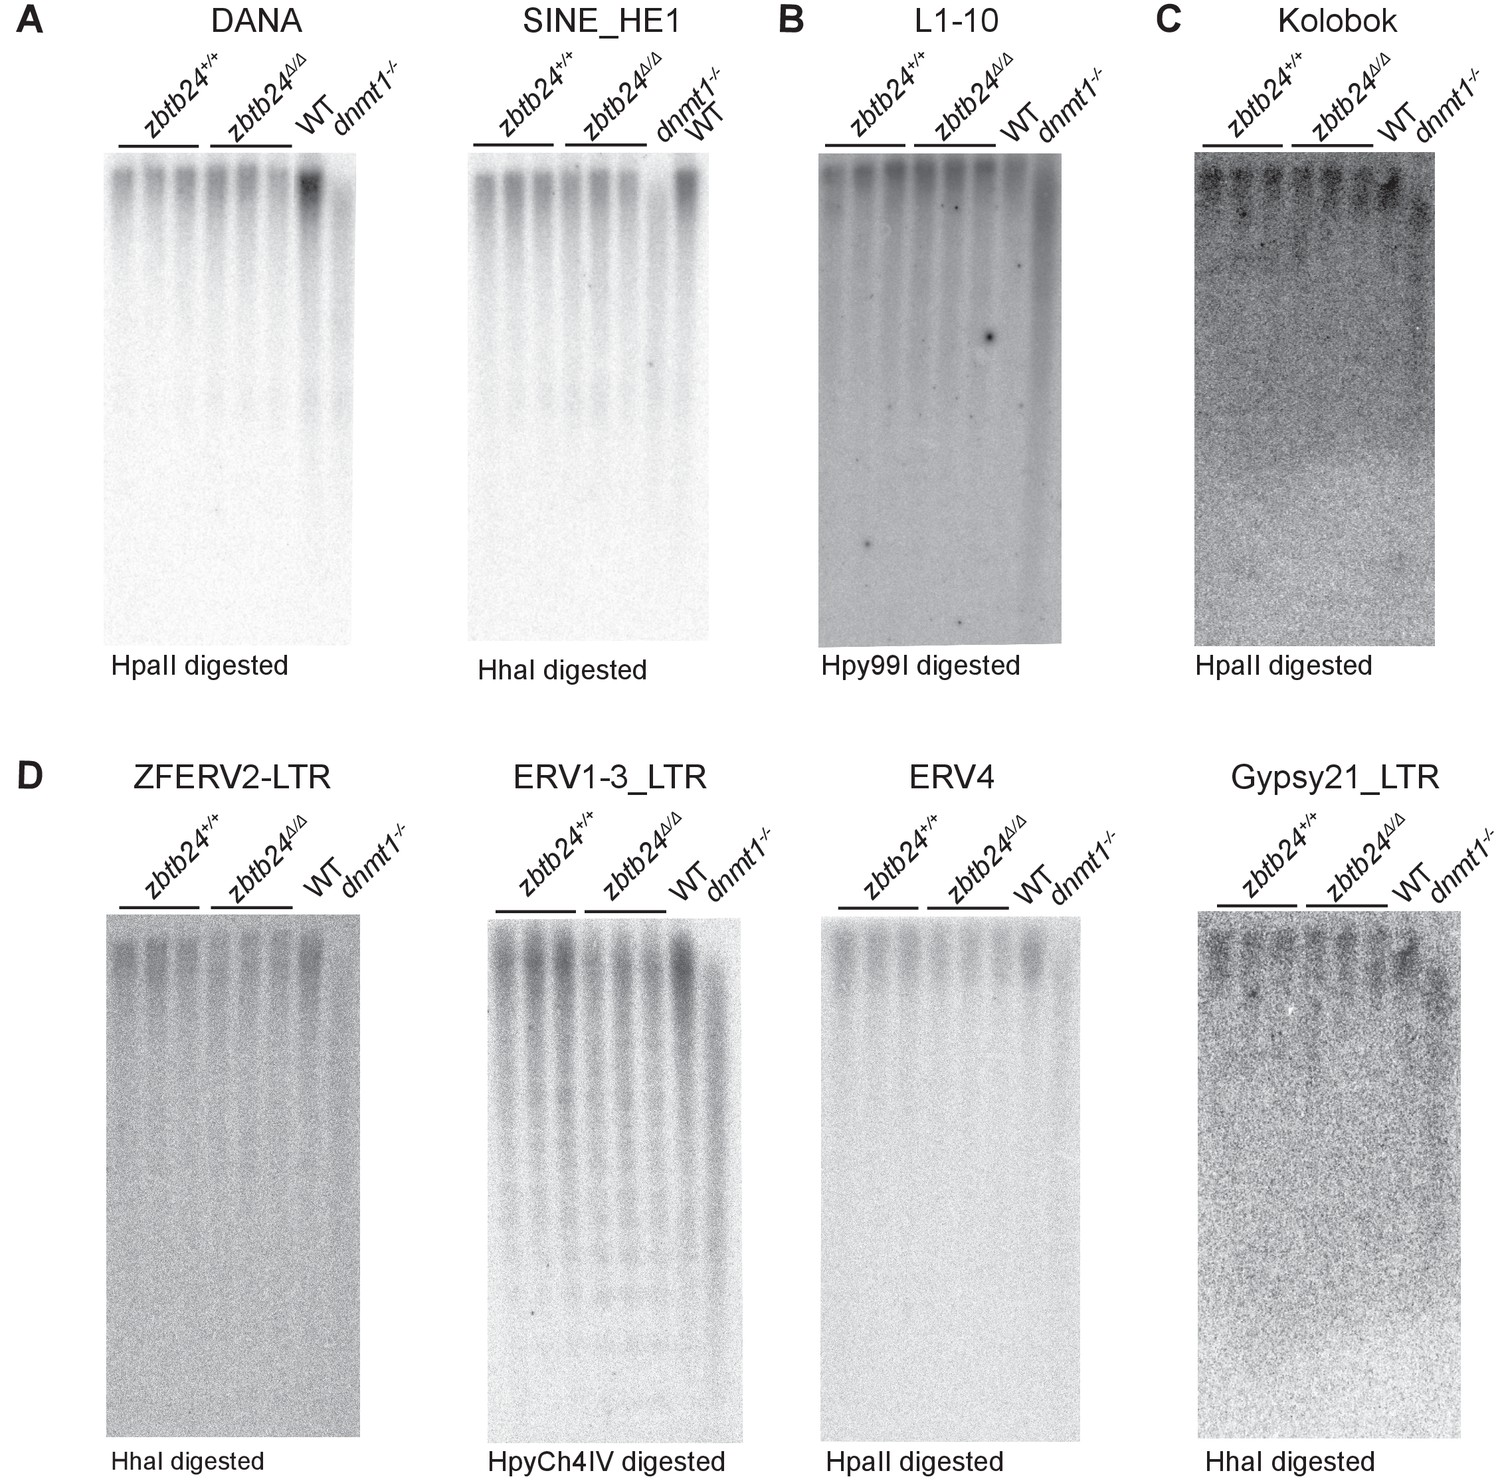
Methylation at interspersed repeats is unaffected in zbtb24 mutants.
Southern blot analysis of DNA methylation at interspersed repeats (A) Short Interspersed Nuclear Element (SINE), DANA and SINE_HE1 (B) Long Interspersed Nuclear Element (LINE), L1-10 (C) DNA Transposon, Kolobok (D) Endogenous Retroviral (ERV) elements, ZFERV2, ERV1-3, ERV4 and Gypsy21 in zbtb24+/+ and zbtb24Δ/Δ 1 month old zebrafish. Each lane represents a biological replicate of the indicated genotype. Genomic DNA from dnmt1-/- embryos is used as a positive control. The methylation-sensitive enzyme used to digest genomic DNA is indicated below the respective blot.
Figure 3 with 2 supplements
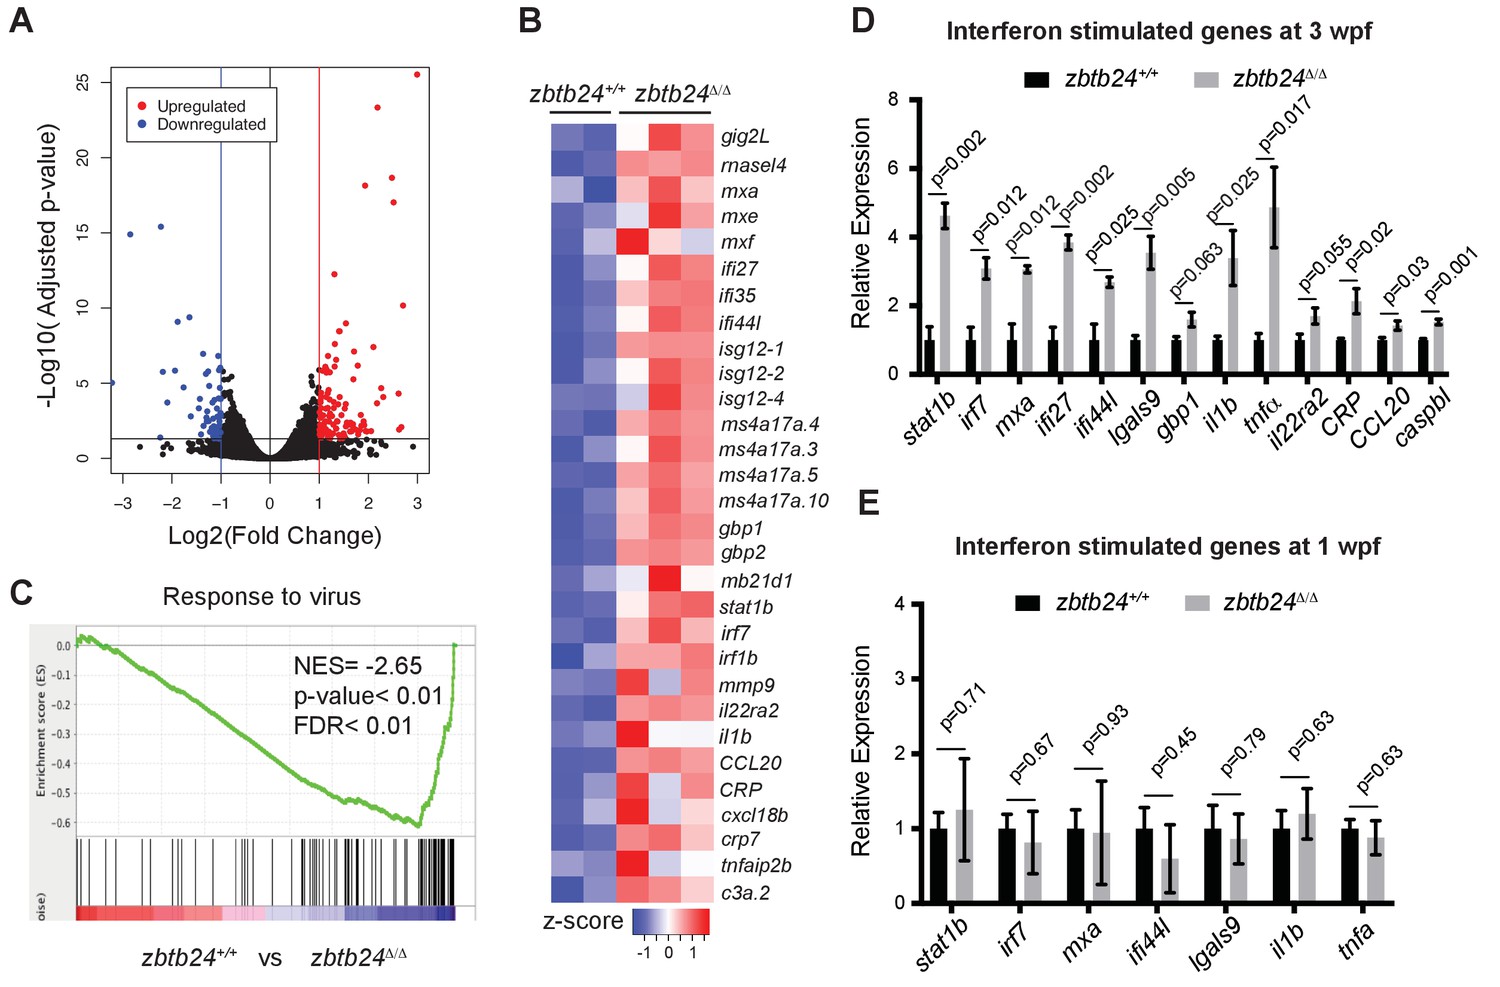
Mutation of zbtb24 leads to activation of innate immune response genes.
(A) Volcano plot representation of differential gene expression in zbtb24+/+ vs zbtb24Δ/Δ zebrafish at 2 wpf. Blue and red points mark genes with >2 fold downregulation or upregulation respectively. (B) RNA-seq heatmap showing innate immune genes upregulated in zbtb24Δ/Δ mutant compared to zbtb24+/+ siblings. Shown are Z-score normalized gene expression values. (C) GSEA of a set of genes involved in Response to Virus in zebrafish comparing zbtb24+/+ vs zbtb24Δ/Δ. NES, normalized enrichment score; FDR, false discovery rate. (D) qRT-PCR demonstrating upregulated interferon and inflammatory response genes in zbtb24Δ/Δ mutants at 3 wpf. Expression levels are reported relative to β-actin. Error bars indicate SEM from at least 3 independent biological replicates with n = 8 total animals for each replicate. (E) qRT-PCR analysis reveals similar expression of interferon genes in zbtb24+/+ and zbtb24Δ/Δ larvae at 1 wpf. Error bars represent SEM from at least five biological replicates.
Figure 3—figure supplement 1
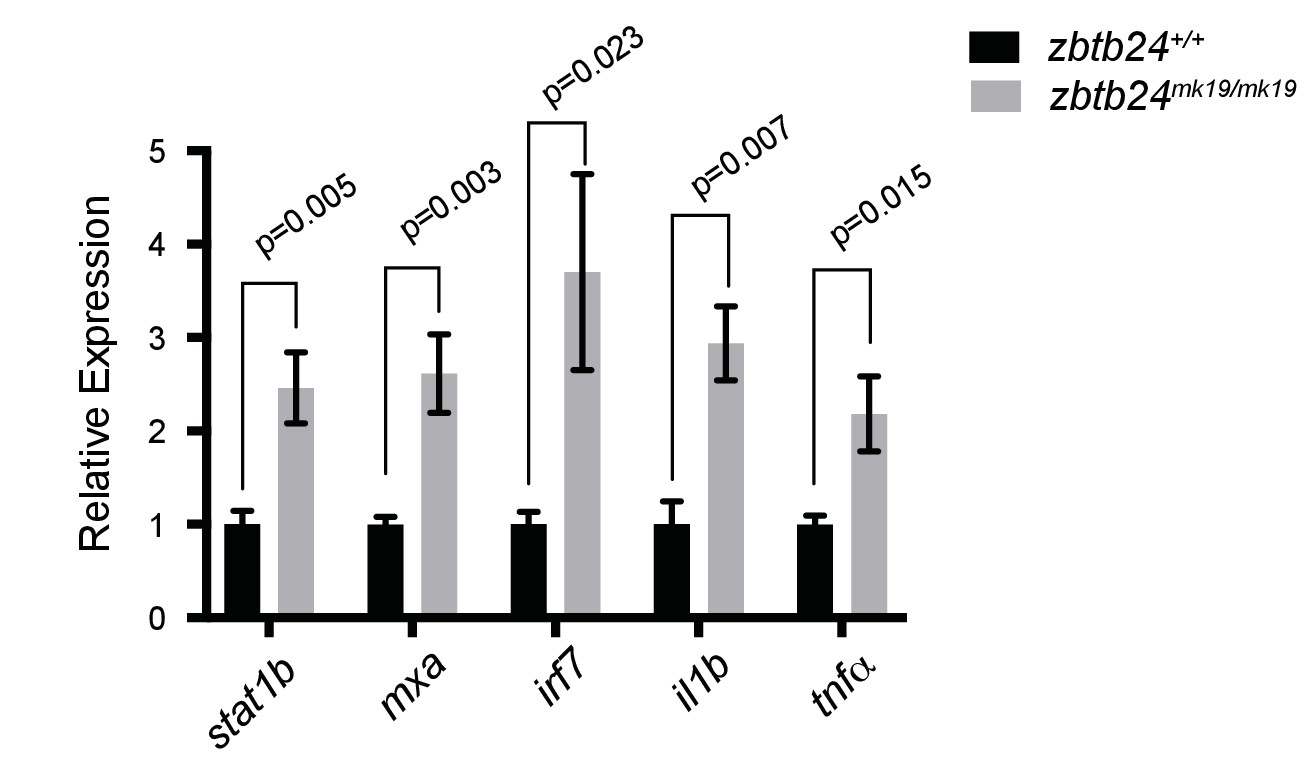
Mutation in zbtb24 leads to activation of innate immune response pathways.
qRT-PCR validation of genes that are part of the innate immune response pathway that are also upregulated in zbtb24mk19/mk19 zebrafish at 3 wpf. Error bars indicate SEM from five biological replicates.
Figure 3—figure supplement 2
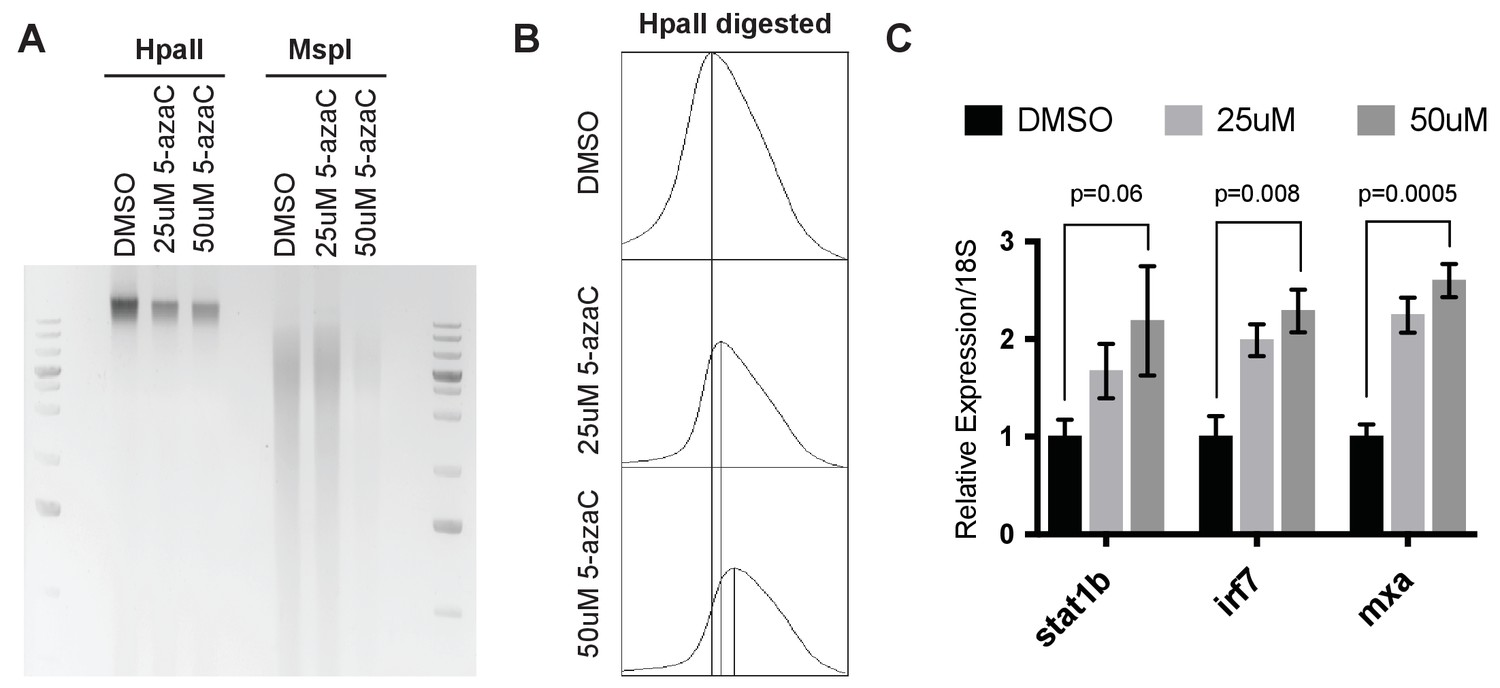
Activation of interferon stimulated genes upon treating zebrafish embryos with 5aza-cytidine.
(A) Genomic DNA collected at 24hpf from 5azaC treated zebrafish embryos was digested with HpaII or MspI and run on 1% ethidium bromide gel. Shift in higher molecular-weight band in 5azaC treated embryos upon HpaII digestion indicates DNA hypomethylation. (B) Shift in higher molecular-weight band in 5azaC treated embryos upon HpaII digestion is quantified using ImageJ. (C) qRT-PCR analysis of stat1b, irf7 and mxa expression in 5azaC treated zebrafish embryos at 24 hpf. Error bars indicate SEM from at least three biological replicates with n = 20 embryos for each biological replicate.
Figure 4 with 1 supplement
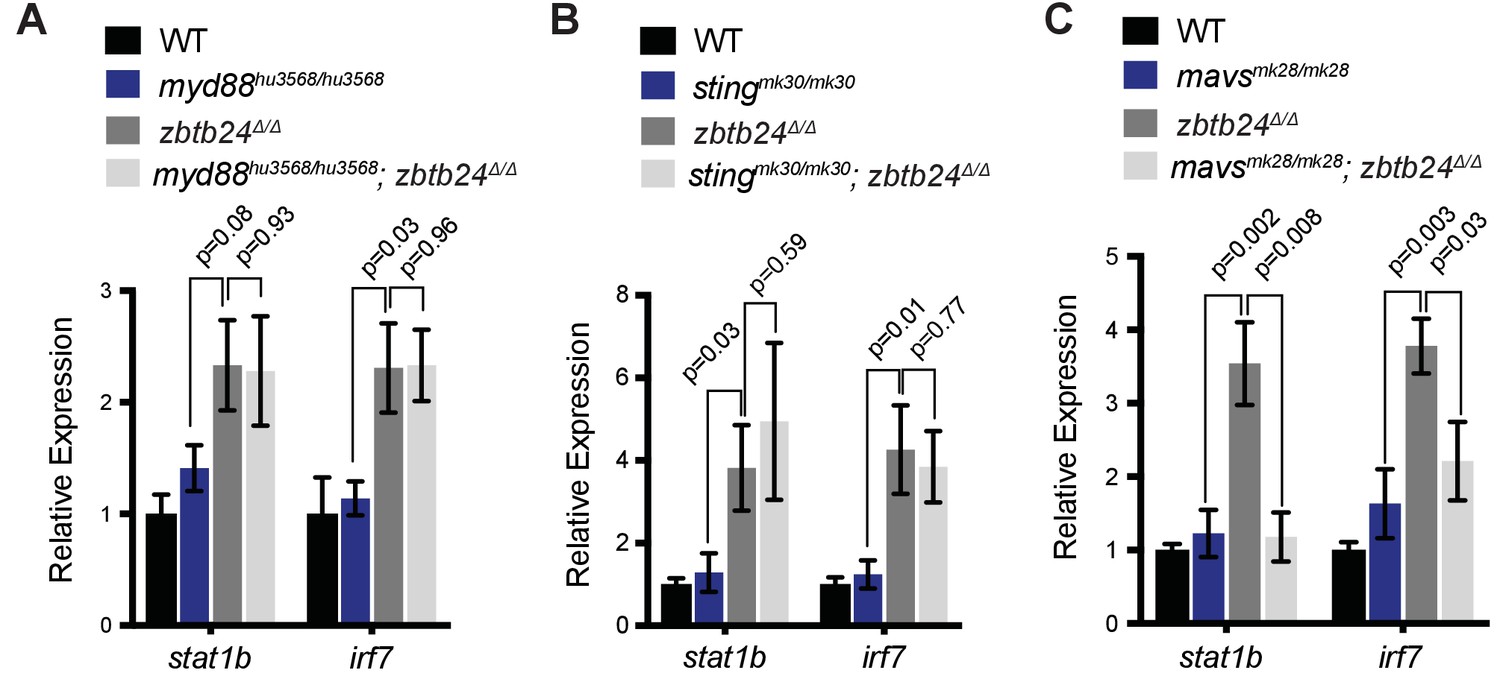
Interferon response in zbtb24 mutants is mediated by sensors of cytosolic RNA.
(A) Expression of interferon signaling genes stat1b and irf7 in indicated genotypes at 3 wpf. n = 4 biological replicates. (B) Expression of the ISGs stat1b and irf7 in indicated genotypes at 3 wpf. n ≥ 7 biological replicates. (C) Expression of interferon signaling genes stat1b and irf7 in indicated genotypes at 3 wpf. n ≥ 5 biological replicates. All error bars indicate SEM.
Figure 4—figure supplement 1
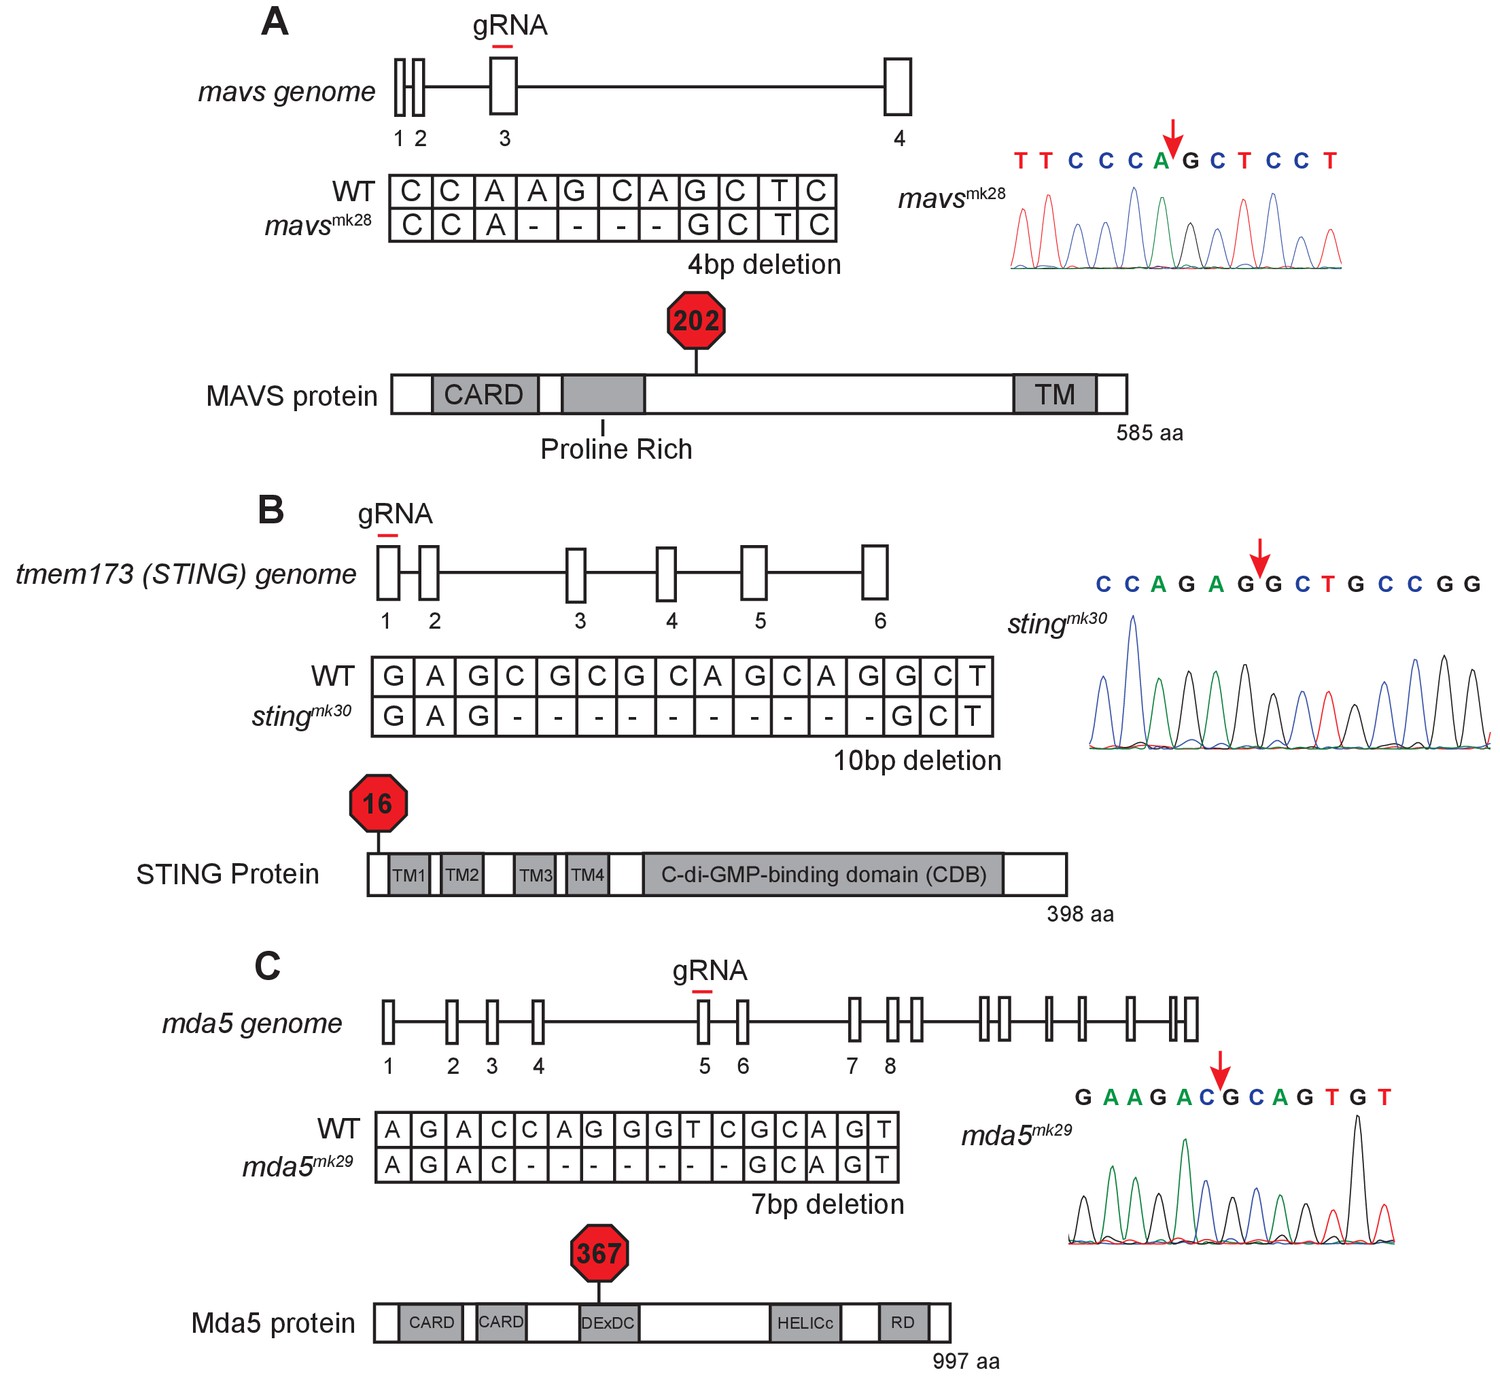
Mutation of zebrafish orthologs of mavs, sting, and mda5.
(A) Schematic of mutation in mavs including position of targeted gRNA, sequence information of the mutation, and location of predicted STOP codon. (B) Schematic of mutation in sting including position of targeted gRNA, sequence information of the mutation, and location of predicted STOP codon. (C) Schematic of mutation in mda5 including position of targeted gRNA, sequence information of the mutation, and location of predicted STOP codon. The site of deletion is indicated with a red arrow on the sequence trace.
Figure 5 with 2 supplements
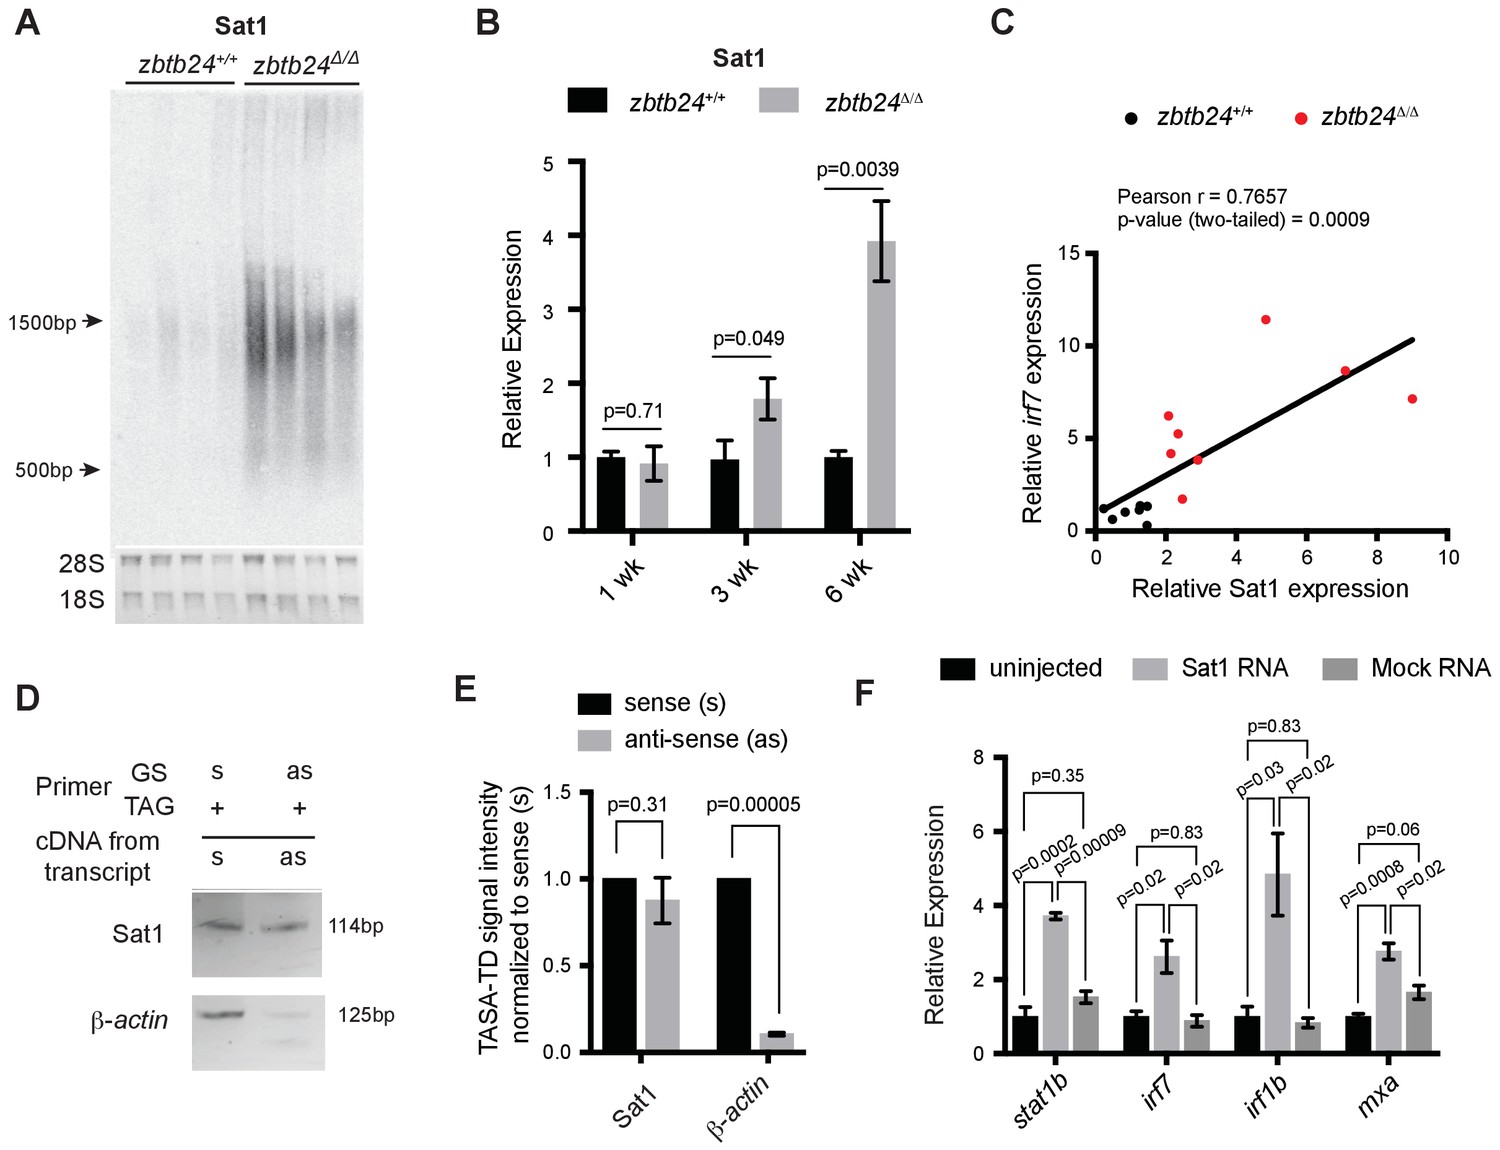
Pericentromeric transcripts are sufficient to induce the innate immune response in zbtb24 mutants.
(A) Northern blot analysis of Sat1 transcripts in zbtb24+/+ and zbtb24Δ/Δ zebrafish at 6 wpf. Each lane represents a biological replicate. The lower panel represents the cropped ethidium-bromide stained gel as loading control. (B) qRT-PCR for Sat1 transcripts in zbtb24+/+ and zbtb24Δ/Δ zebrafish at 1, 3 and 6 wpf. Error bars indicate SEM of at least four biological replicates in each group. (C) Correlation between the expression of Sat1 and irf7 in zbtb24+/+ and zbtb24Δ/Δ at 6 weeks (n = 15). (D) TASA-TD PCR amplified sense (s) and antisense (as) transcripts Sat1 (114 bp) and β-actin (125 bp) from first strand zbtb24Δ/Δ cDNA. PCR primers: gene-specific (GS); TAG. The products from TASA-TD PCR were run on the same gel, then cropped and presented. This panel is representative of two independent biological replicates. (E) Quantification of TASA-TD from panel D). Error bars indicate SD from two biological replicates. (F) Expression of interferon stimulated genes in wild-type embryos injected with Sat1 or control RNA encoding a similar-sized fragment of β-actin. 50 pg of in vitro transcribed sense and antisense transcripts were injected into wild-type zebrafish embryos at the 1 cell stage. Total RNA was extracted at 8 hr post fertilization for qRT-PCR analysis. Error bars indicate SEM from at least three biological replicates with n = 20 embryos for each biological replicate.
Figure 5—figure supplement 1
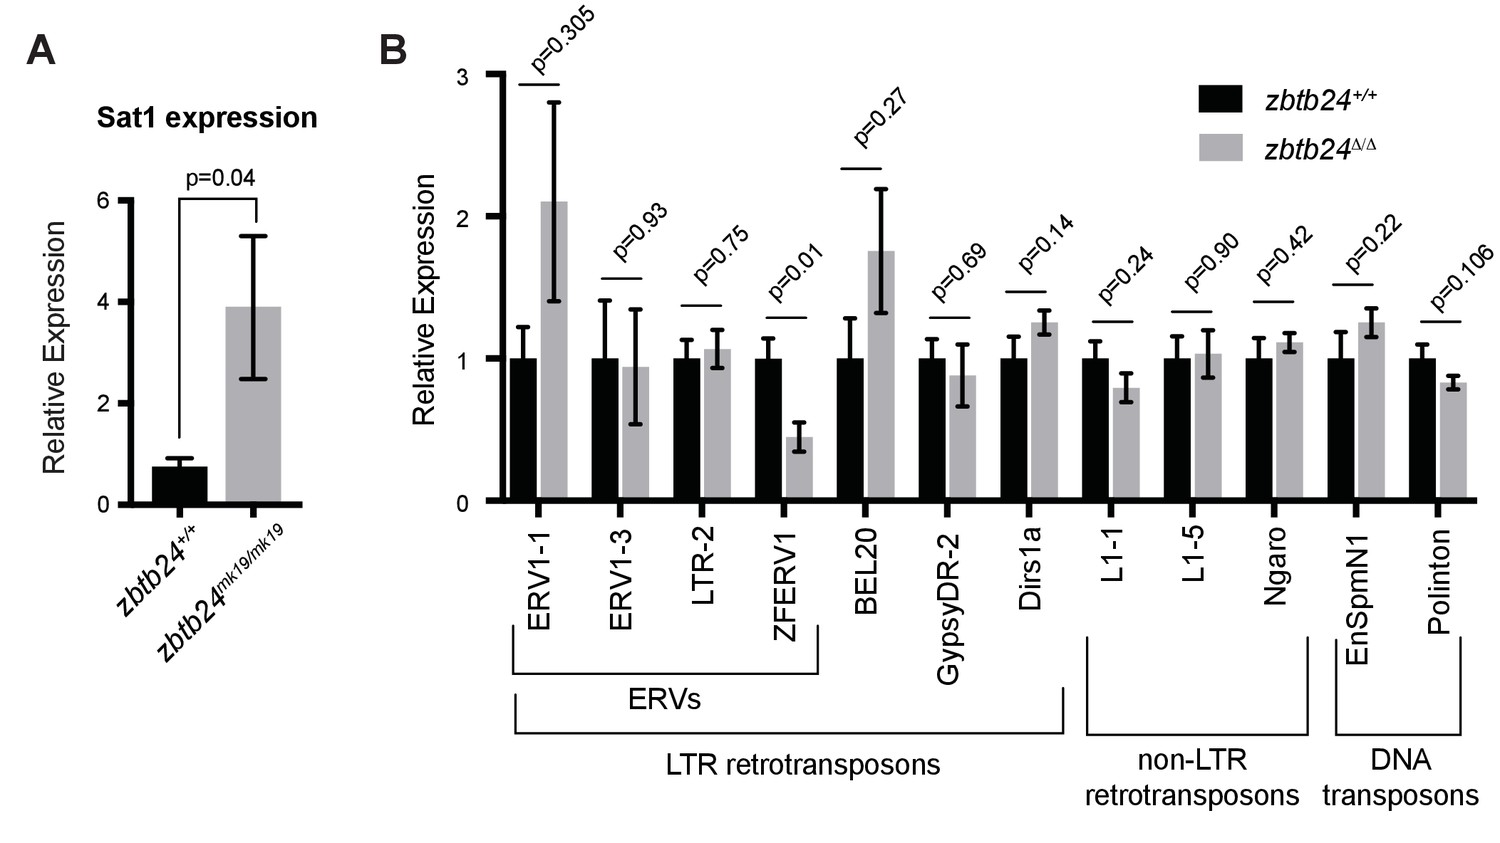
Mutation in zbtb24 upregulates Sat1 transcripts but not transposons.
(A) qRT-PCR of Sat1 RNA in zbtb24+/+ and zbtb24mk19/mk19 zebrafish at 6 wpf. Error bars indicate SEM from at least three biological replicates. (B) qRT-PCR reveals similar levels of expression from transposable elements in zbtb24+/+ and zbtb24Δ/Δ zebrafish at 6 wpf. Error bars indicate SEM from 4 to 8 biological replicates.
Figure 5—figure supplement 2
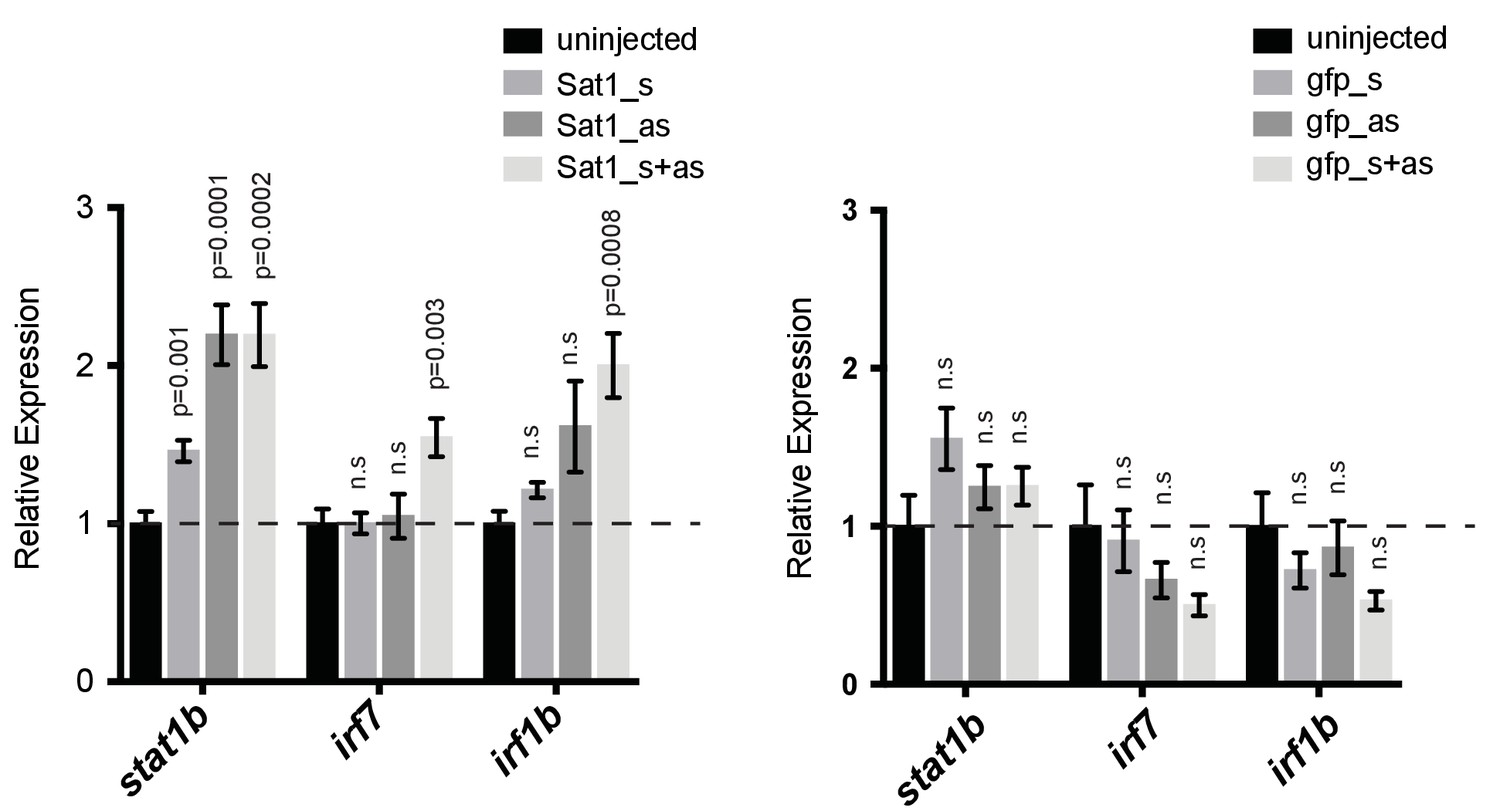
Effect of injecting in vitro transcribed Sat1 RNAs on expression of interferon stimulated genes.
Expression of interferon stimulated genes in wild-type embryos injected with sense (Sat1_s), anti-sense (Sat1_as) or an equimolar mixture of sense and anti-sense Sat1 transcripts (Sat1_s + as). Transcripts of similar size encoding a fragment of GFP are used as a control. 50 pg of in vitro transcribed transcripts were injected into wild-type zebrafish embryos at the 1 cell stage. Total RNA was extracted at 8 hr post fertilization for qRT-PCR analysis. Error bars indicate SEM from 4 to 8 biological replicates with n = 20 embryos for each biological replicate. p-values are adjusted for multiple comparisons using the Holm-Sidak method, tested against uninjected control. n.s: Not significant.
Figure 6 with 1 supplement
Mutation of cytosolic RNA receptor Mda5 mitigates the interferon response in zbtb24Δ/Δ zebrafish.
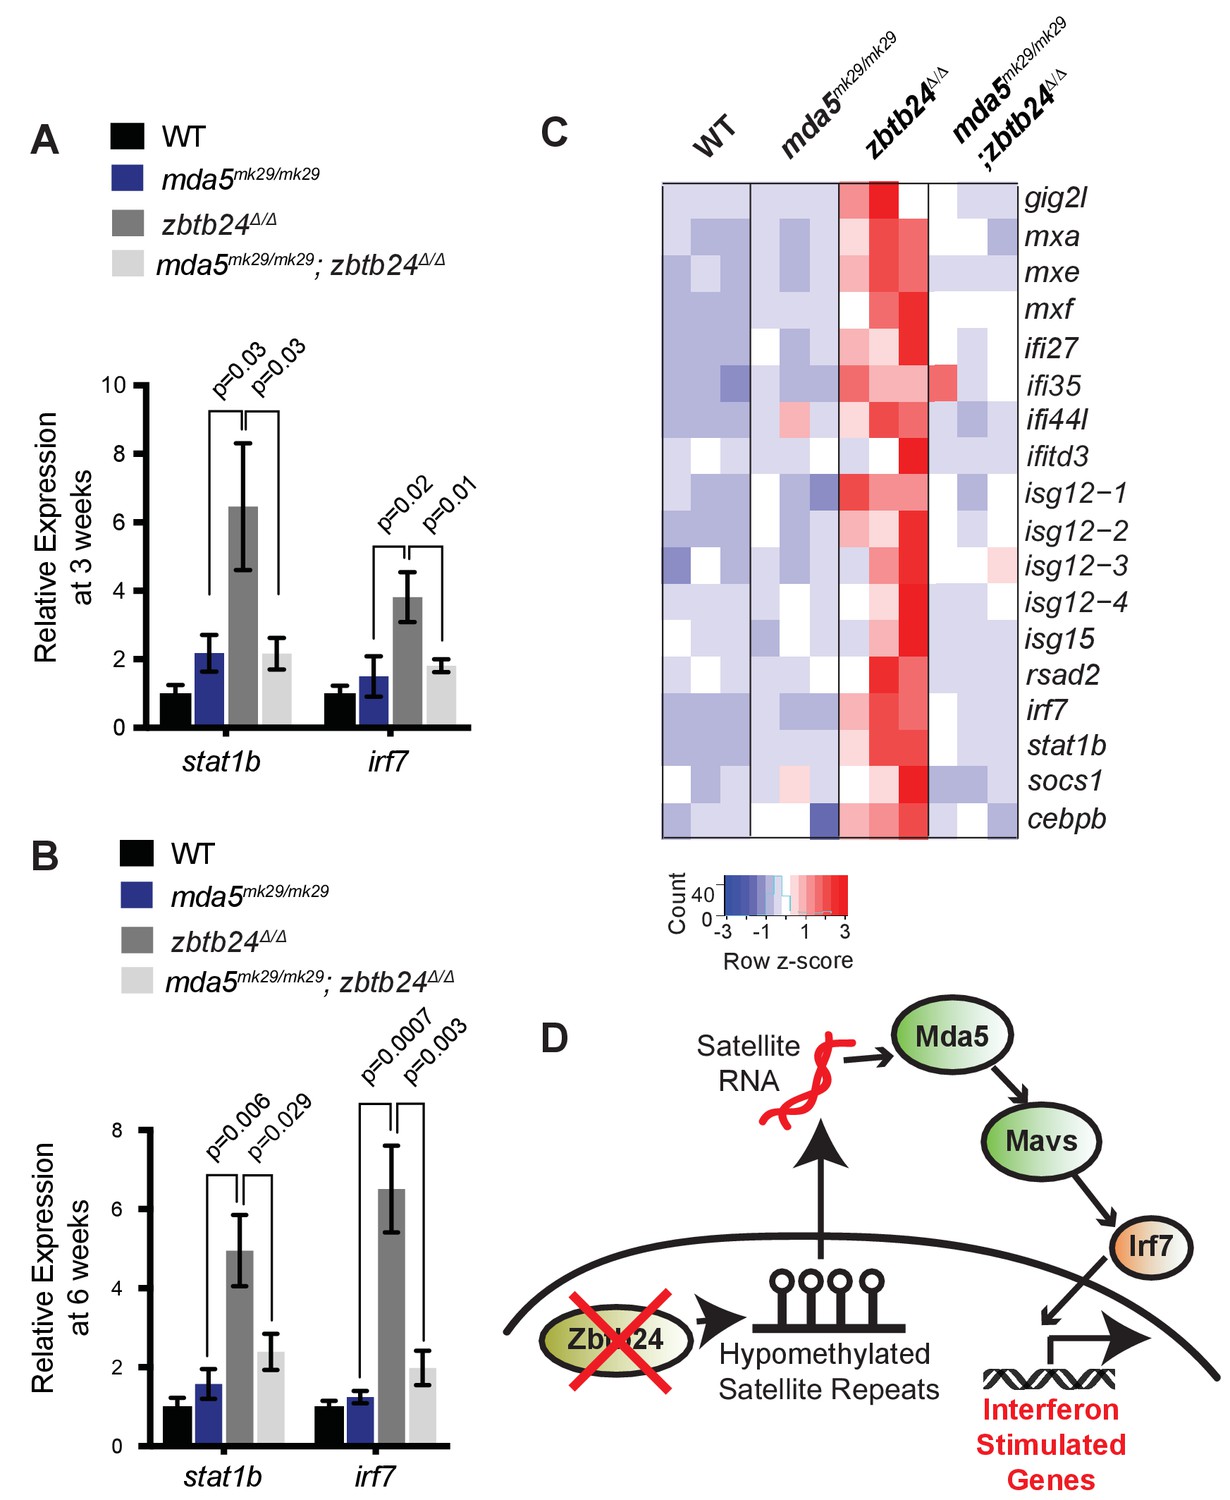
(A) Expression of interferon signaling genes stat1b and irf7 in indicated genotypes at 3 wpf. n ≥ 7 biological replicates. (B) Expression of interferon signaling genes stat1b and irf7 in indicated genotypes at 6 wpf. n = 6 biological replicates. (C) RNA-seq heatmap of interferon stimulated genes upregulated in zbtb24Δ/Δ zebrafish and rescued in mda5mk29/mk29; zbtb24Δ/Δ zebrafish at 3 wpf. Shown are Z-score normalized gene expression values. (D) Model for the activation of interferon response in zbtb24 mutants. Loss of Zbtb24 function causes hypomethylation of pericentromeric Sat1 repeats, which leads to derepression of associated Sat1 transcripts. These pericentromeric transcripts are recognized by the RNA helicase Mda5 which signals through Mavs and Irf7 to upregulate ISGs. Autoregulatory feedback implicates irf7 as both an ISG and a key downstream effector of Mda5/Mavs signaling.
Figure 6—figure supplement 1
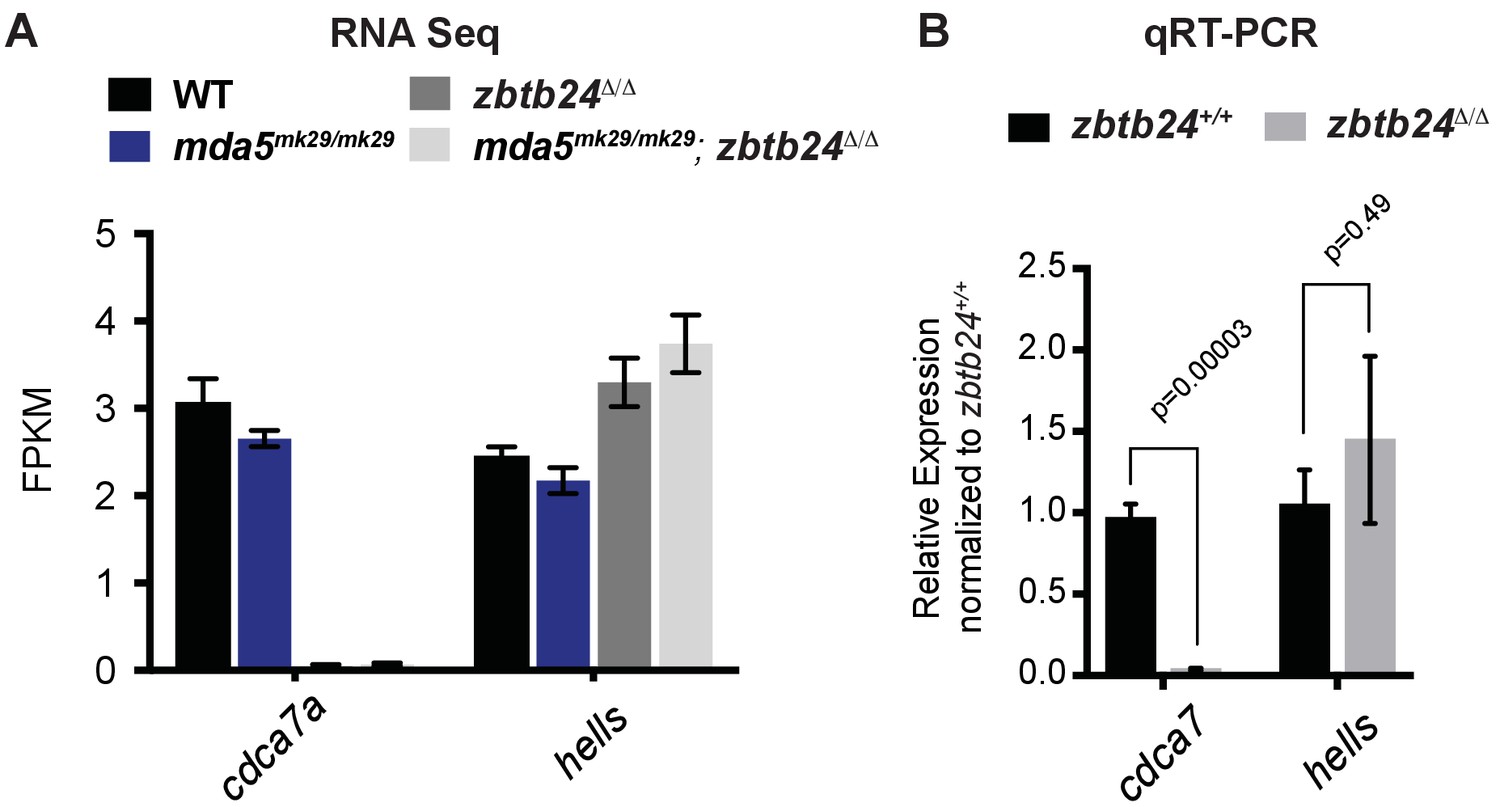
Expression of ICF genes cdca7 and hells in zbtb24 mutants (A) Expression levels of cdca7 and hells in the RNA Seq data set reported in Figure 6C (n = 3 biological replicates for each group).
Error bars indicate SEM. (B) qRT-PCR analysis of cdca7 and hells mRNA in zbtb24+/+ and zbtb24Δ/Δ zebrafish at 3 wpf (n = 4 biological replicates for each group). Error bars indicate SEM.
Additional files
-
Supplementary file 1
List of mutant alleles.
- https://doi.org/10.7554/eLife.39658.024
-
Supplementary file 2
List of primers.
- https://doi.org/10.7554/eLife.39658.025
-
Supplementary file 3
List of Oligos (5’----−3’).
- https://doi.org/10.7554/eLife.39658.026
-
Supplementary file 4
List of DMRS.
- https://doi.org/10.7554/eLife.39658.027
-
Transparent reporting form
- https://doi.org/10.7554/eLife.39658.028
Download links
A two-part list of links to download the article, or parts of the article, in various formats.
Downloads (link to download the article as PDF)
Open citations (links to open the citations from this article in various online reference manager services)
Cite this article (links to download the citations from this article in formats compatible with various reference manager tools)
Pericentromeric hypomethylation elicits an interferon response in an animal model of ICF syndrome
eLife 7:e39658.
https://doi.org/10.7554/eLife.39658


