A first order phase transition mechanism underlies protein aggregation in mammalian cells
- Massachusetts Institute of Technology, United States
- Boston University School of Medicine, United States
- Ariel University, Israel
Figures
Figure 1 with 5 supplements
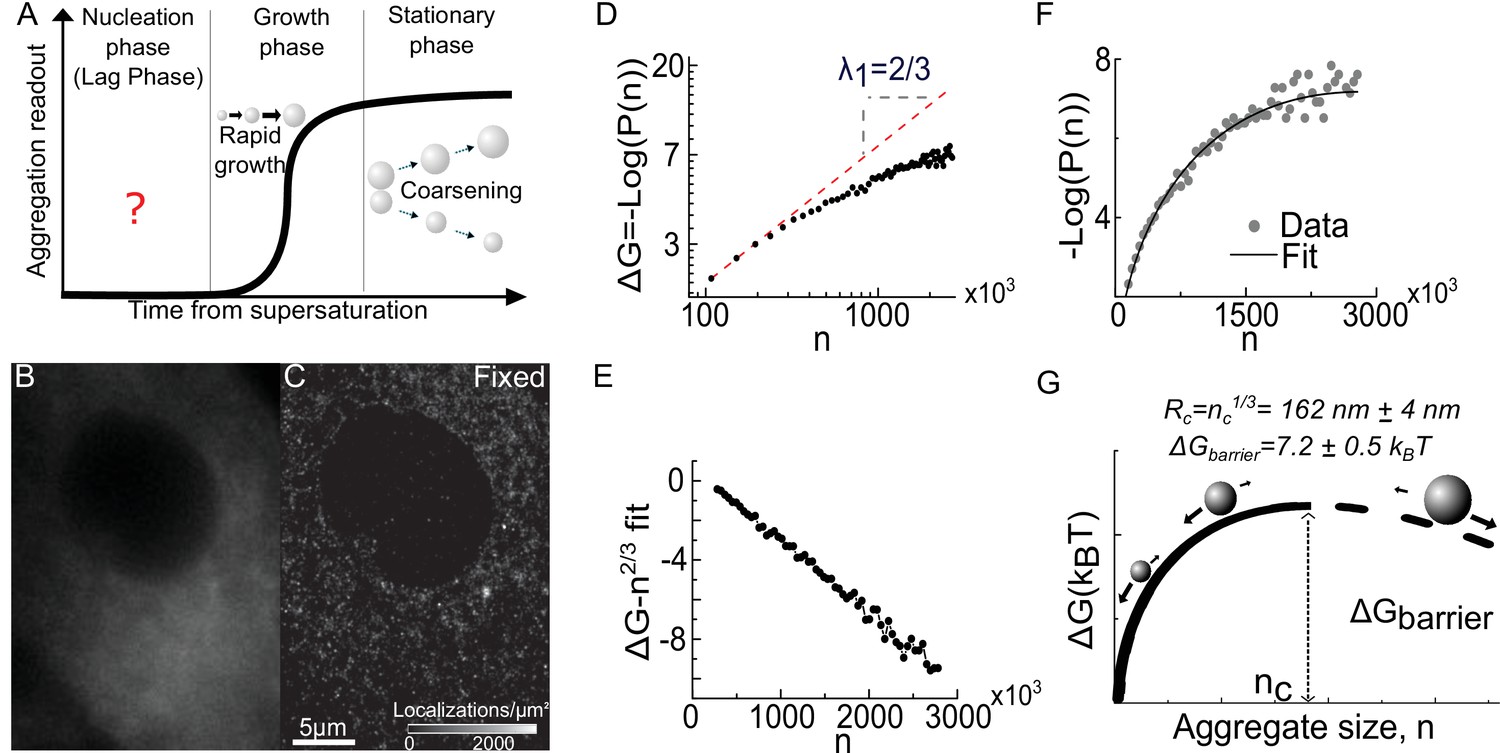
Super resolution imaging of fixed cells suggests that a condensation transition underlies aggregate formation.
(A) Schematic of traditional experimental readouts of protein aggregation. Such measurements are blind to the nucleation phase but begin to show signal during the growth phase and stationary phase. (B) Conventional fluorescence image of Synphilin1-Dendra2 in mammalian cell. (C) Super resolved reconstruction of the same cell reveals multiple sub-diffractive aggregates (see Figure 1—figure supplement 1 for representative DBSCAN images). (D) log-log plot of the free energy from the distribution of aggregate sizes (see Box 1) reveal a low-n asymptote of slope 2/3, reminiscent of a surface energy limited system () (See Figure 1—figure supplement 3 for evidence for homogenous decoration of clusters by Synphilin1). (E) Plot of the resultant after correction of surface energy: by fitting an n2/3 surface energy term from the asymptote of (D) and subtracting it from the data,the resultant data is strikingly linear, and has a negative slope, suggesting the second term (). (F) Fit of the distribution of aggregate sizes to the full function to obtain the a and b parameters. The parameters define the nucleation barrier height and critical aggregate size (see Figure 1—figure supplement 2 for expression level control and alternative tracer control, see Figure 1—figure supplement 5 for application to in neuronal precursor cells). (G) Schematic of the energy function, as predicted for a super-saturated system undergoing first order phase transition. The line is dashed after the critical size to highlight that the functional form is experimentally valid only below this size. The barrier height and critical radius from the fit in F are represented (see Figure 1—figure supplement 4 for larger schematic and definition of terms in text). Data is from 25,000 aggregates from 28 fixed cells. Errors represent s.e.m. All cells imaged in this figure were fixed cells. Log refers to the natural logarithm (base ‘e’) (see Figure 1—figure supplement 5 for control in neuronal precursor cell line).
Figure 1—figure supplement 1
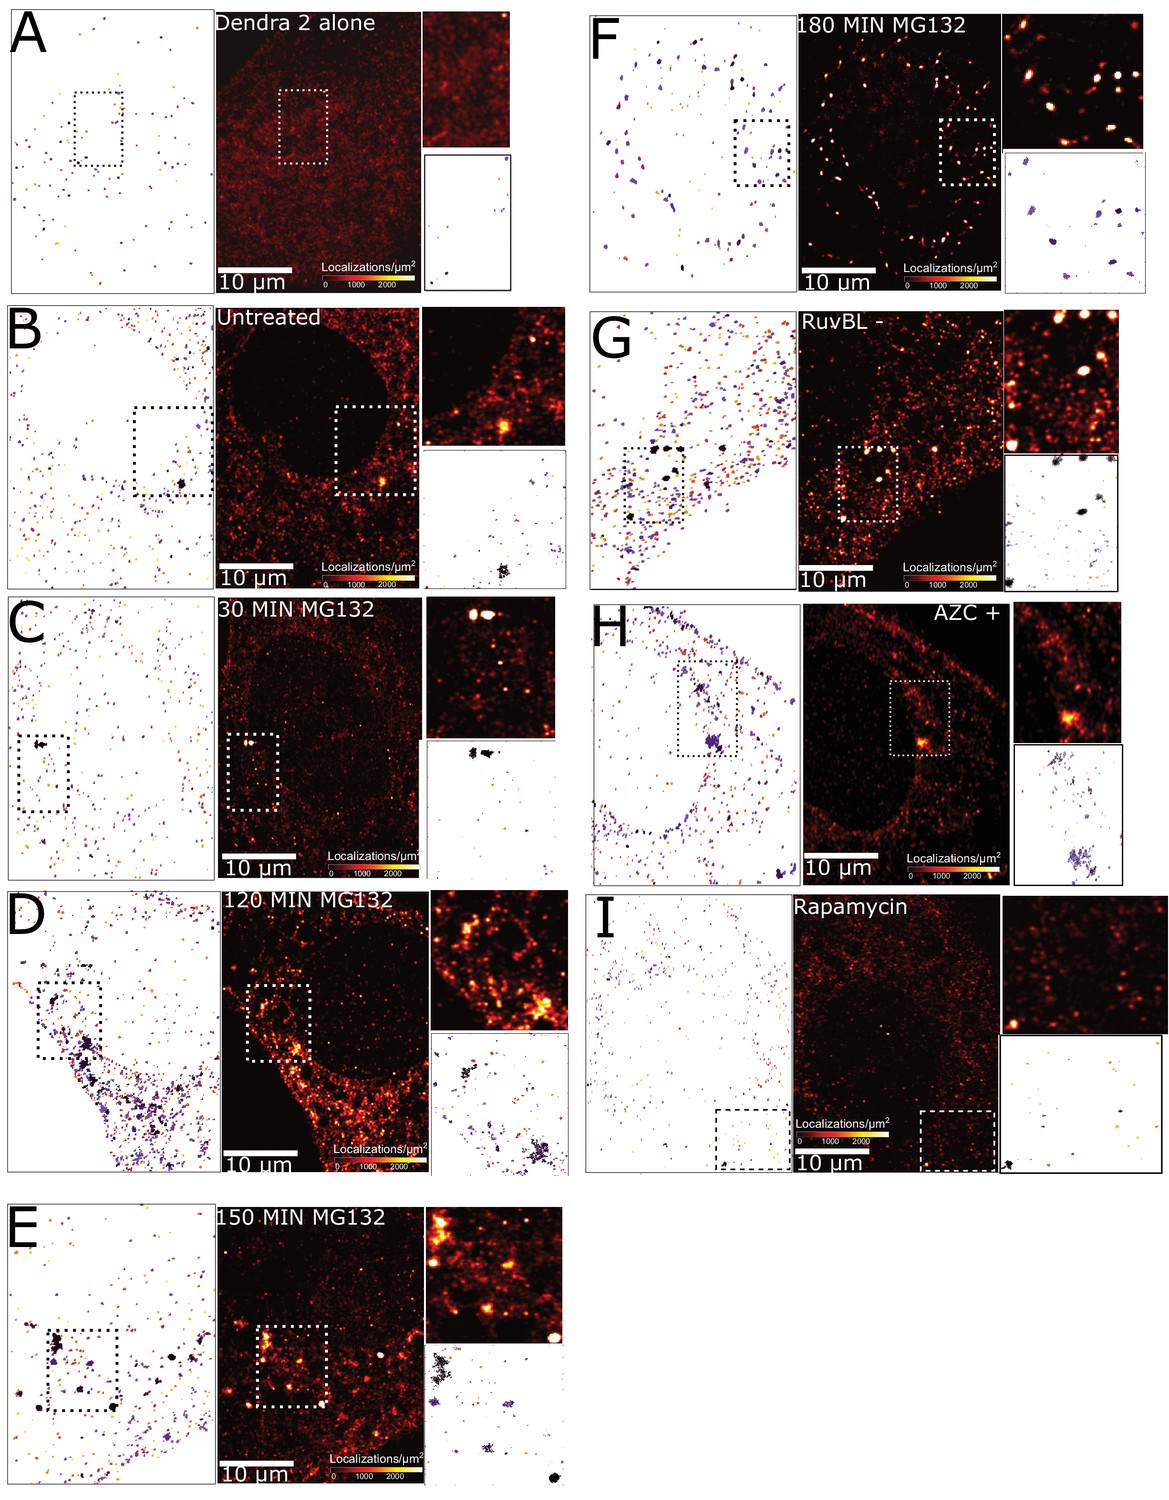
Super-resolution imaging and cluster identification using DBSCAN.
Each subfigure contains - super-resolved reconstruction (centre) a pointillist image of clusters identified by the DBSCAN algorithm (left) and a zoomed in region with super-resolution (top right) and DBSCAN (bottom right) images. Conditions represented are – (A) Plain dendra2 (unfused) control, (B) Synphilin-Dendra2 untreated cells. (C) 30 min MG132 treatment. (D) 120 minutes MG132 treatment. (E) 150 min MG132 treatment. (F) 180 minutes MG132 treatment. (G) RuvBL knockdown. (H) AZC treatment, and (I) Rapamycin treatment. All cells represented in the figure are fixed cells.
Figure 1—figure supplement 2
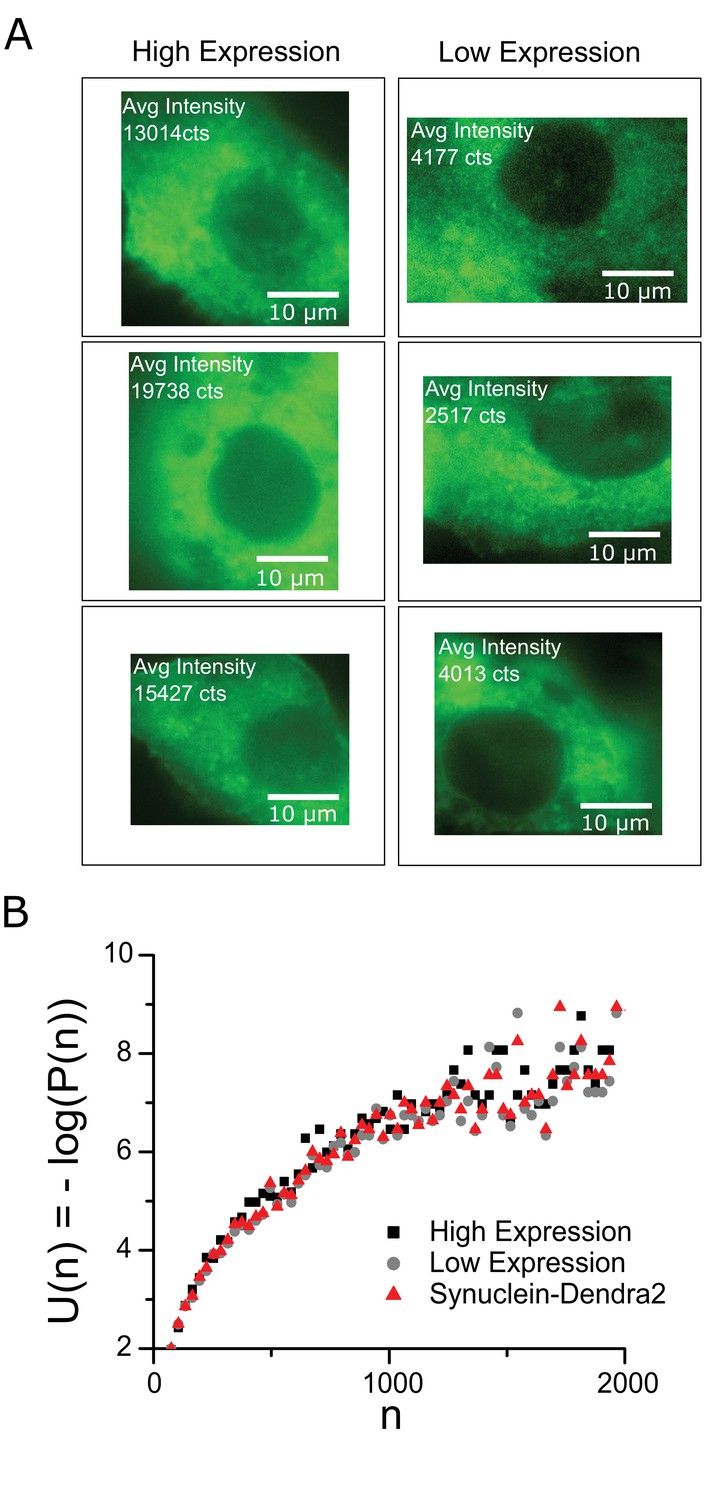
The effect of expression level, alternative protein markers.
A Representative cells with different Synphilin expression levels – Left panels, high expression level cells with average fluorescence intensity ~15,000 counts (arbitrary units). Right panels, Low expression level cells with average fluorescence intensity ~3500 counts (arbitrary units). (B) Sub-critical size distributions for three data sets – high expression (5 cells), low expression (5 cells) and with alpha Synuclein-Dendra2 as alternative aggregate marker. Log refers to the natural log (base ‘e’). The sub-critical size distributions show no detectable change despite the widely different expression levels.
Figure 1—figure supplement 3
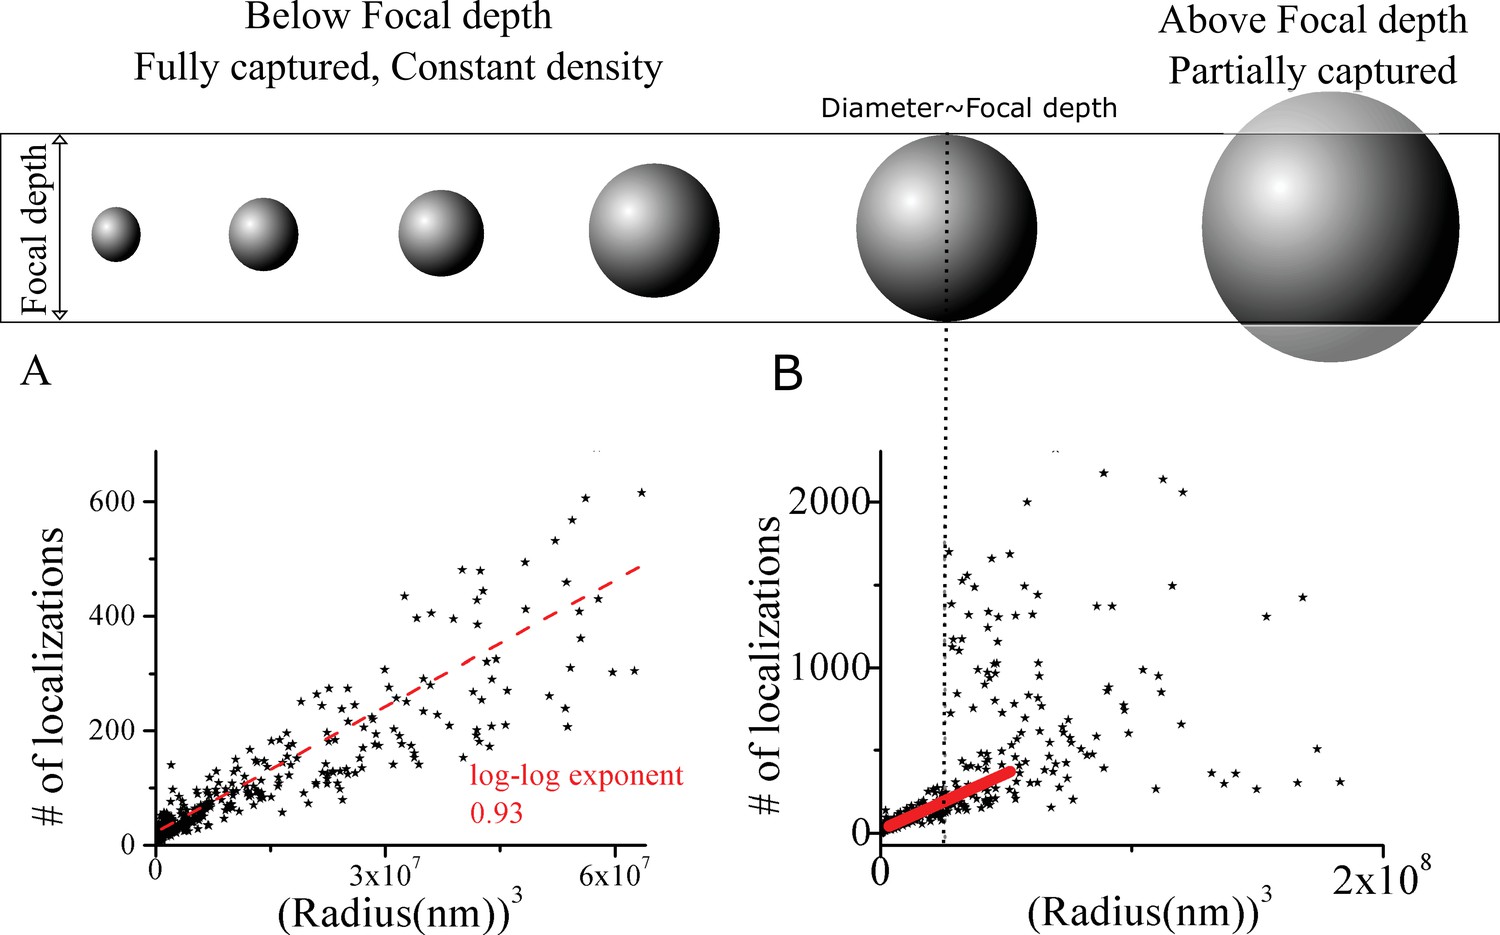
The clusters have a well defined density.
The number of localizations assigned to individual clusters by DBSCAN versus the volume (cube of radius) over which these localizations were spread out. (A) For small clusters there is a distinct linear scaling. (B) For larger clusters, the linear scaling becomes poor at a scale experimentally found to be close to the focal depth (dotted vertical line) of our system. All our analysis concentrates on clusters in low n range where both the linear scaling holds and the theoretical predictions are expected to apply. (A) corresponds to data from ~30 nm to ~400 nm cluster radius, while all our fits utilized data below 200 nm in size).
Figure 1—figure supplement 4
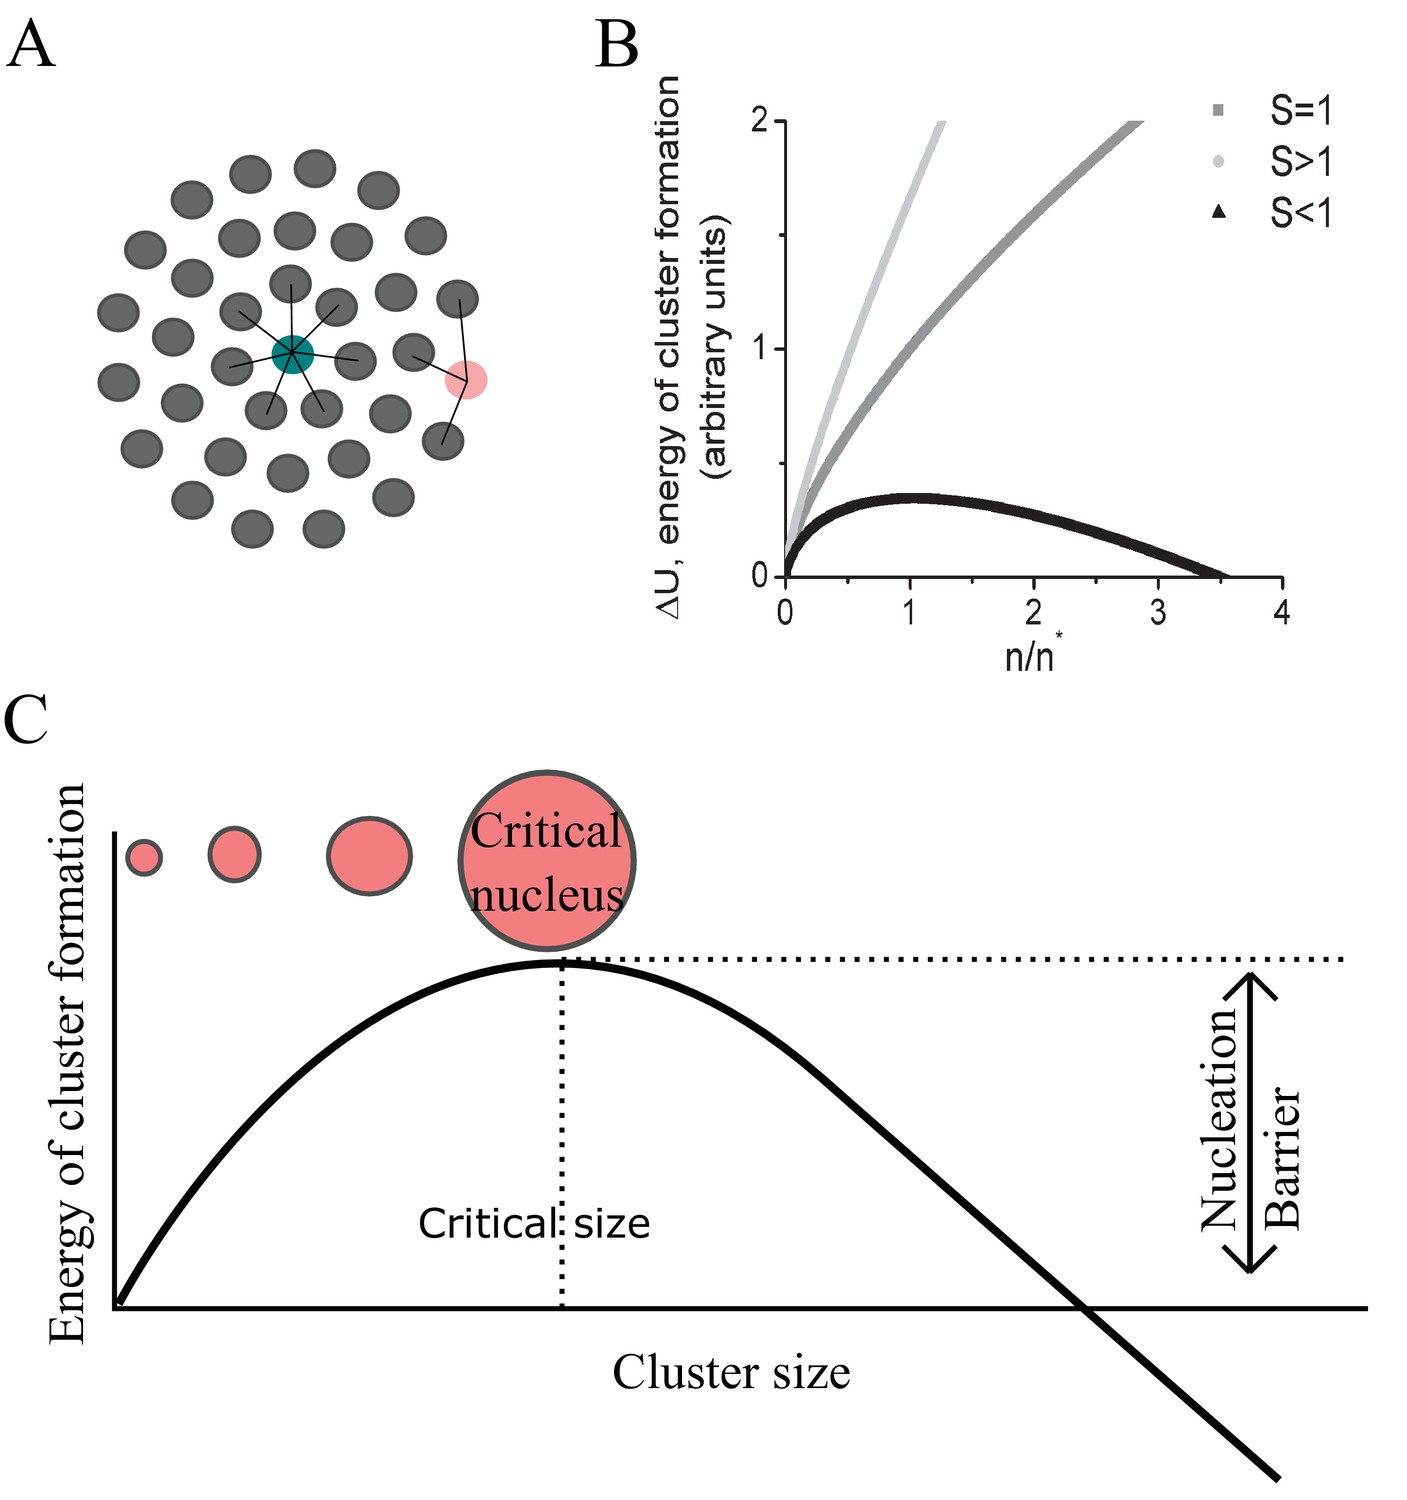
Definition of terms in condensation theory.
(A) Schematic showing the difference between bulk and surface interactions in the formation of a condensate. Molecules buried in the centre of a cluster contribute the full free energy difference per molecule from being in the condensate while molecules at the edge contribute a reduced fraction of the full free energy gain per molecule. This is what necessitates a positive correction term to the total free energy difference caused by formation of a cluster of n molecules. (B) The shape of the free energy cost function for cluster formation in the sub-saturated (light grey S < 1), saturated (grey S = 1) and super-saturated (dark grey S > 1) cases. (C) Expanded view of the super-saturated case from B with definitions of terms referred to in the text. In the super-saturated state (black curve in B) unlike in the sub-saturated state (light grey curve in B) the system is not in equilibrium. Here the free energy function has a maximum at a critical size above which a cluster is favoured to grow at the expense of the saturation level. In the sub-saturated case, the distribution of cluster, being thermodynamically unfavourable fluctuations from the equilibrium monomer phase, follows a Boltzmann distribution in size. However, during the process of condensation, and if maintained at constant super-saturation by monomer input, the distribution of cluster sizes for sub-critical sizes is also well approximated by the Boltzmann distribution (Slezov, 2009).
Figure 1—figure supplement 5
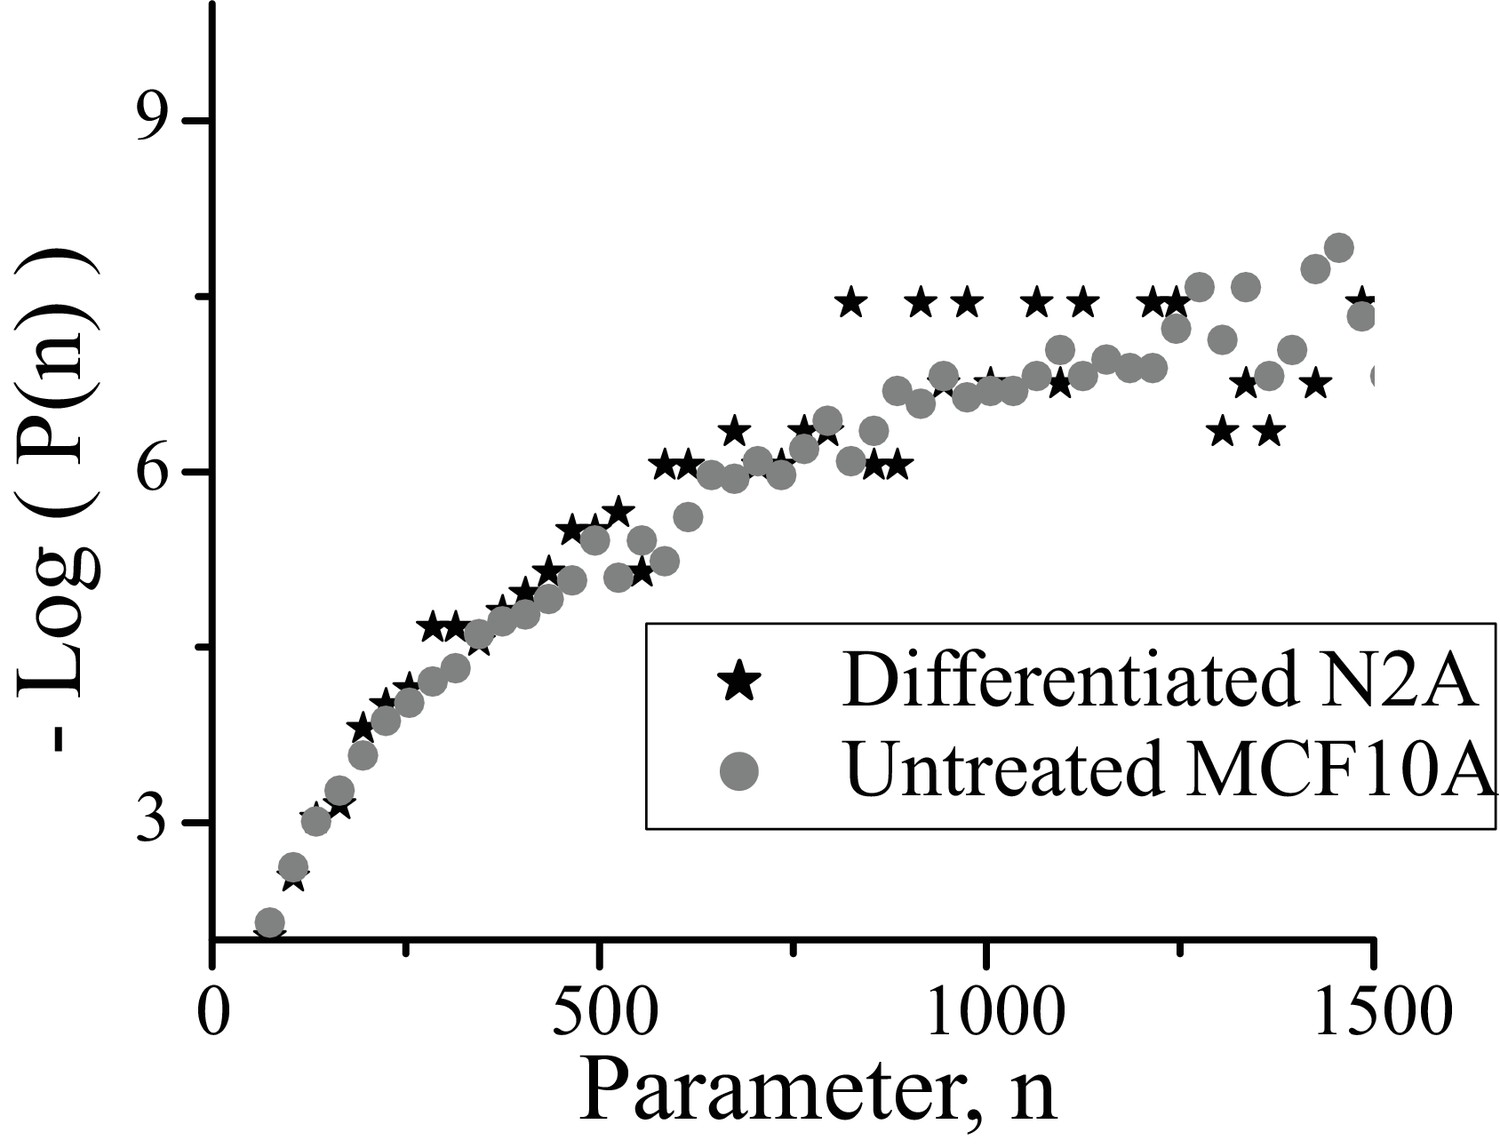
Comparison between cluster size distributions in MCF10A and Neuro2A cell lines.
Plotted is the energy of cluster formation ( as described in Box 1 versus for clusters in normal growth conditions for (i) MCF10A cells with clusters marked with Synphilin (circles), (ii) Neuro2A cells with clusters marked by alpha Synuclein (stars). For the range of values < where the Neuro2A data set begins to exhibit a high noise level due to smaller size of data set, the two distributions are indistinguishable. Log refers to the natural log (base ‘e’). Untreated cell data is from the normalized distribution of 10,000 clusters from 10 cells, Neuro2A data from 3000 clusters from 5 cells.
Figure 2 with 1 supplement
Super-saturation can be tuned by the levels of endogenous aggregative polypeptides
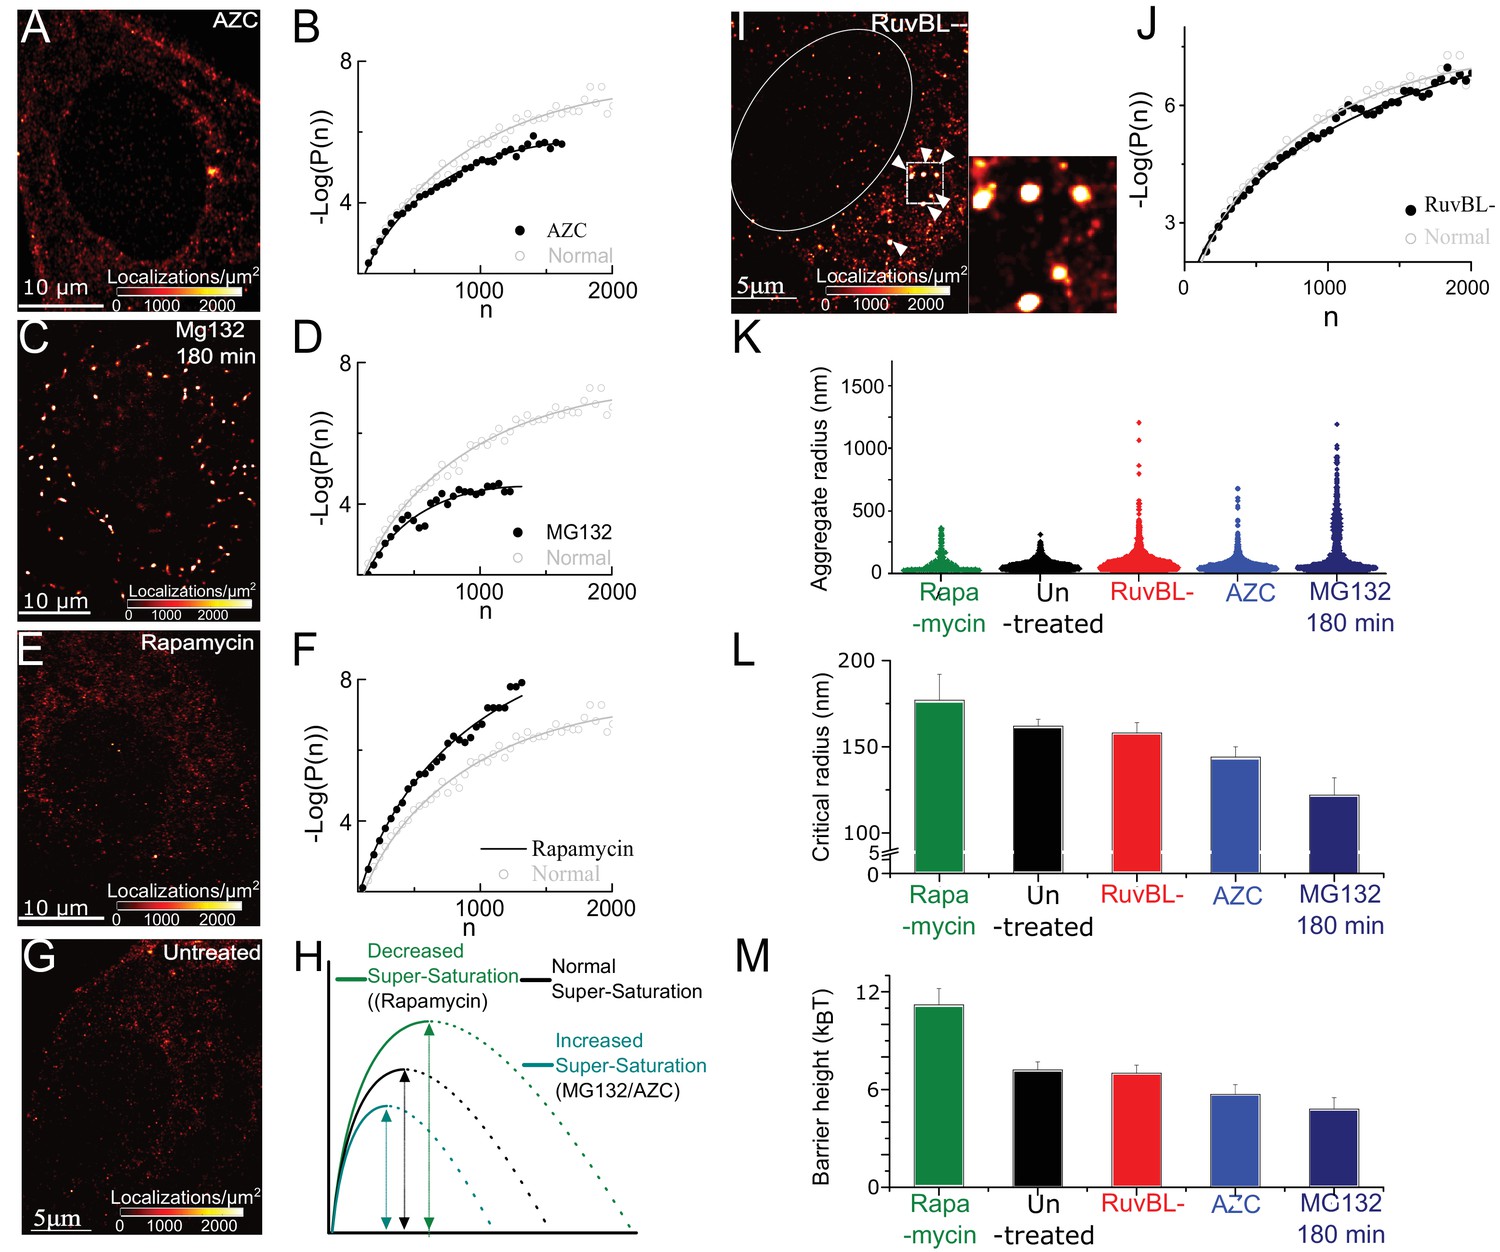
and RuvBL-dependent mechanism clears super-critical clusters: (A–F) Representative super-resolved reconstruction and free energy functional fit for AZC- (A and B), MG132-(C and D), and Rapamycin- (E and F) treated cells. Distribution functions were computed from 2500 to 10,000 clusters from 7 to 10 cells in each condition. Red-hot colour code is used to indicate the relative density of detections in A, C, E. Gray plot in B, D, F represents the functional fit for untreated cells for comparison. (G) Representative super-resolution reconstruction for an untreated cell showing many sub-diffractive aggregates (dark red) but few large aggregates (red hot). (H) Schematic of the observed effects of the different pharmacological treatments. (I) Representative super-resolution reconstruction for a RuvBL depleted cell and zoomed view of large (red hot) aggregates. (J) –Log(P(n)) versus n curve from 7000 clusters from 9 RuvBL depletion cells shows almost no effect on the sub-critical distribution. (K–M), quantification of the effect of the perturbations and comparisons of relative changes in the distributions of aggregate size (violin plot, (K), Rc (L) and the measure nucleation barrier; (M) the range of values in L and M is chosen to illustrate the main differences. Error bars in L and M represent s.e.m in fit estimation (Materials and methods). All cells imaged in this figure were fixed cells. Log refers to the natural log (base ‘e’) (See Figure 2 – figure supplement 1 for combined effect of AZC and MG).
Figure 2—figure supplement 1
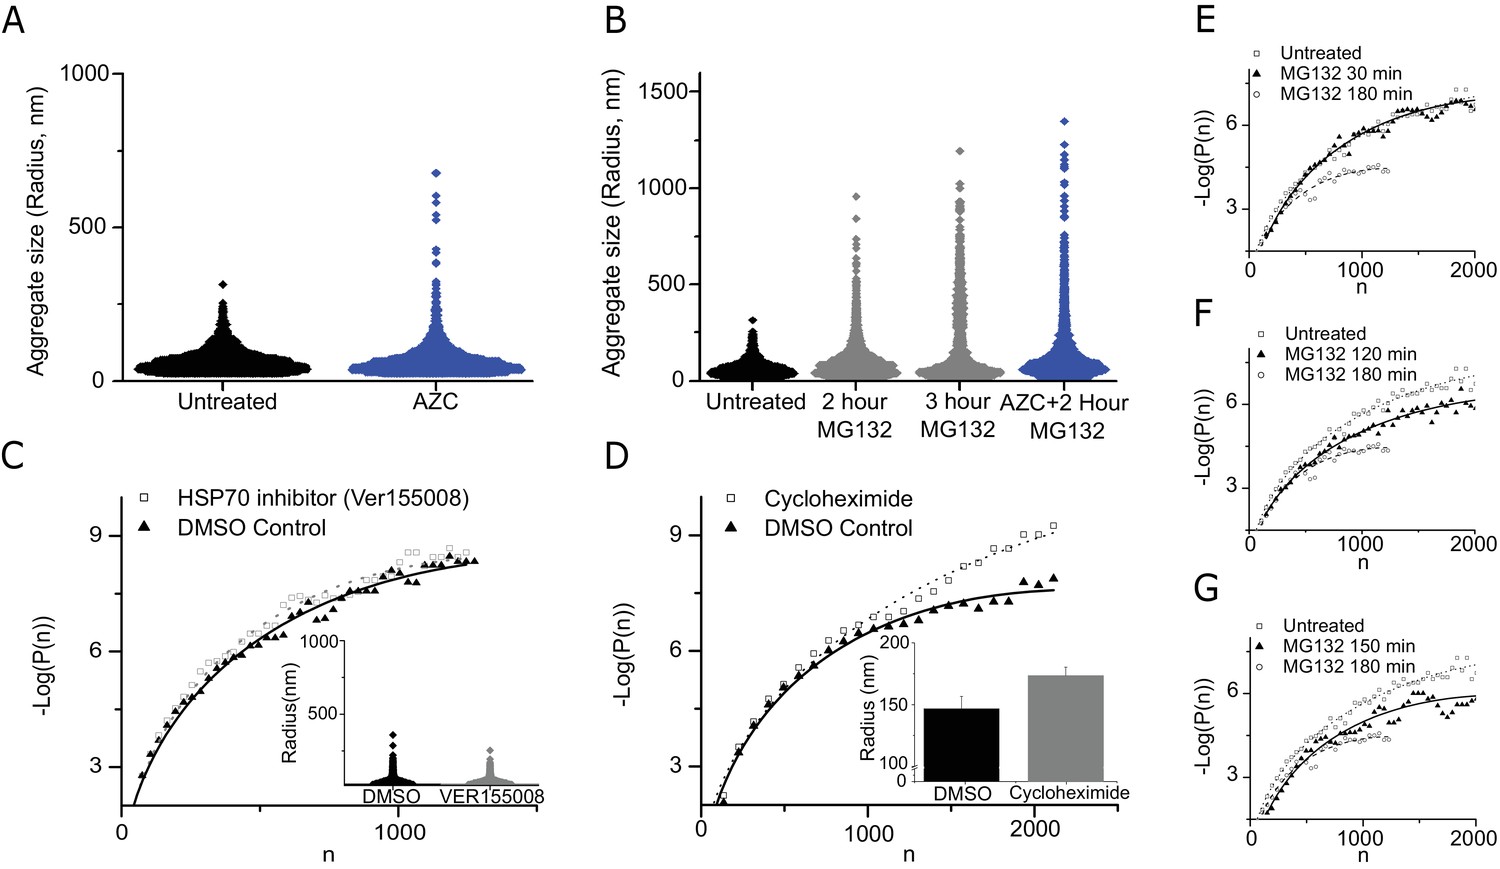
The effect of aggregation promoting amino acid substitute (AZC), proteasome inhibitor (MG132), translation inhibitor cycloheximide and the HSP70 inhibitor (Ver155008):
(A) Violin plots of data from untreated (Black) and amino acid substitute AZC treated (Blue) cells. Data is from 10,000 untreated clusters (10 cells) and 4000 AZC clusters (seven cells). (B) Violin plots of data from untreated (Black), proteasome inhibitor MG132 (grey) and the combination of AZC +MG132 (Blue) cells. AZC +MG data is from 8000 clusters from seven cells. (C) Violin plots of cluster sizes, with HSP70 inhibitor Ver155008 in DMSO (grey), and DMSO control (black). Data is of 4000 clusters from five cells. (D) Sub-critical cluster size distribution and bar graph of critical radius for cycloheximide treated cells. Data is from 4500 clusters from 5 cells. (E–G) The sub-critical cluster size distribution is plotted for various times after MG132 treatments. Data is from 4000 to 7000 clusters from 5 to 10 cells at the various time points. In (C–G) Log refers to the natural log (base ‘e’).
Figure 3
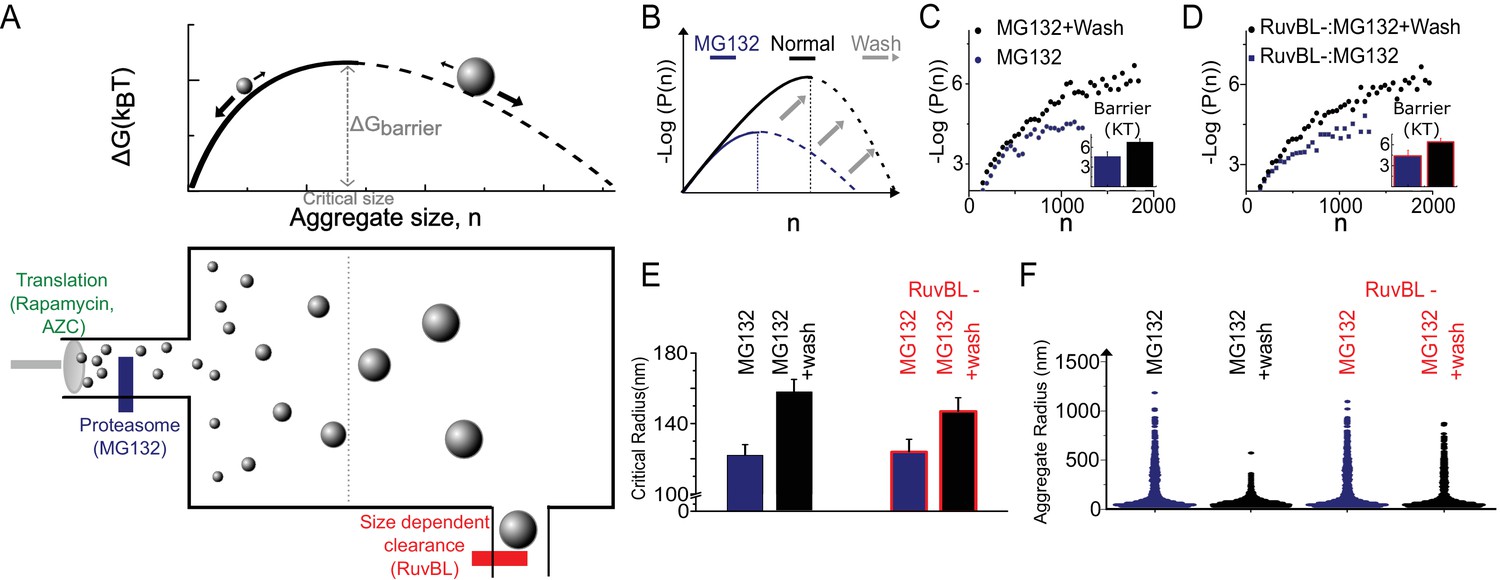
The Szilard non-equilibrium steady state accounts for all genetic and pharmacological and genetic stresses.
(A) Schematic depiction of Szilard mechanism for maintenance of super-saturated steady state by simultaneous regulation of monomer creation and super-critical elimination. The suggested mode of action of the stress conditions utilized in Figure 2 and the RUVBL depletion discussed in Figure 2, and Figure 3 are indicated. (B) Schematic of predicted effect of Mg132 washout on sub-critical cluster size distribution and free energy function. (C, D) Data plots of ∆G (n) vs. n measured before and after washout both without (C) and with (D) RuvBL depletion. Each curve is generated from 2500 to 6000 clusters from 6 to 10 cells in the various conditions. (E) Critical radii measured with and without RuvBL depletion, before and after MG132 washout. (F) Violin plots of cluster sizes in the four conditions of (C–E) showing that the super-critical clearance is impeded in the case of RuvBL depletion compared to un-depleted cells. In (B–D), Log refers to the natural log (base ‘e’).
Figure 4

Cluster size quantification in living cells corroborates fixed cell data and the estimation of surface tension at the condensate-cytoplasm interface.
(A) 2D maximum intensity projection of 3D direct imaging of Dendra2-Synphilin1 traced aggregates in a representative cell imaged with light sheet microscope. (B) Using the relative intensities rather than the radius as a measure of aggregate size, we may plot distributions that reproduce all the features of the fixed cell measurements (N=2800 aggregates from 22 cells). Insets: log-linear plot. (C) The free energy functional fit (yielding (best fit s.e.m)) of the live cell data corroborates the conclusions of the condensation through first order phase transition. Here, the variable parameter N is an estimate of the number of fluorescent Dendra2-Synphilin imaged per aggregate and Log refers to the natural log (base ‘e’). All cells imaged in this figure were live cells.
Figure 5
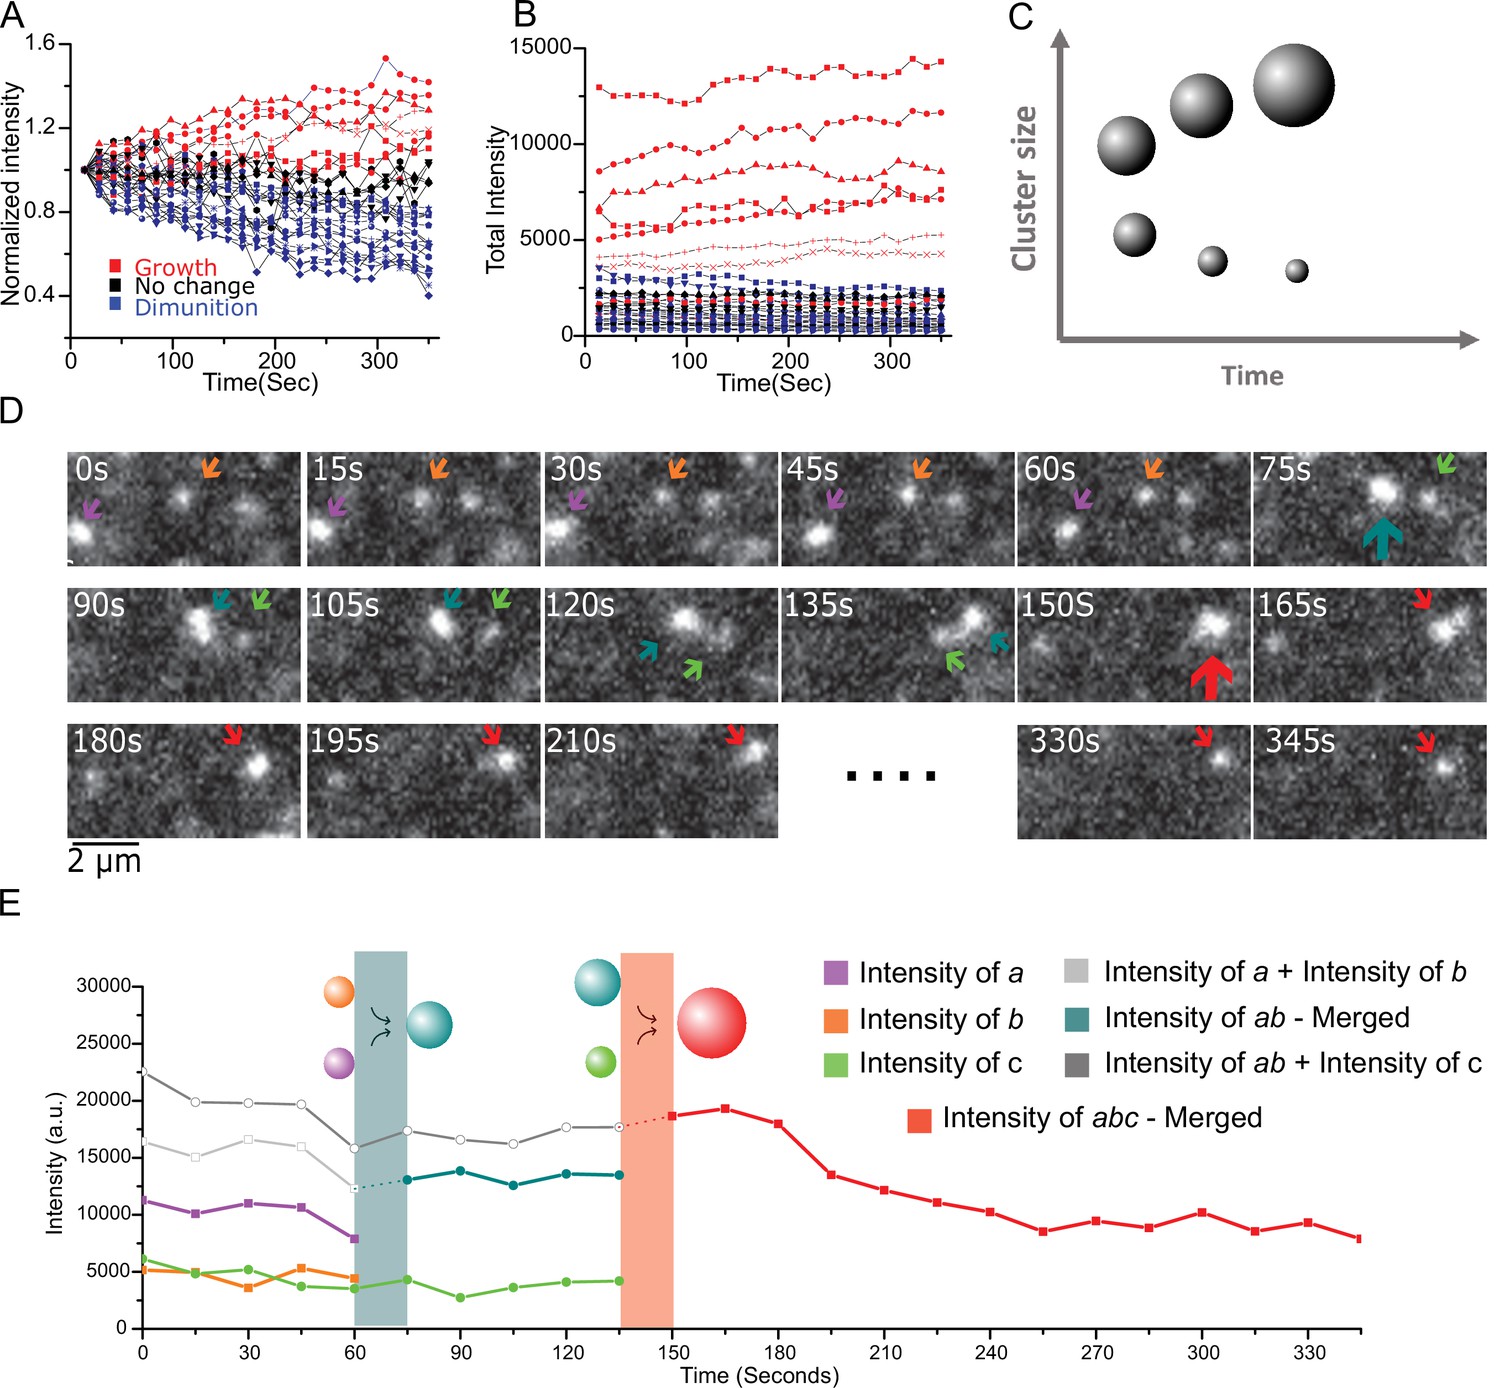
Live cell imaging of single aggregates growth and shrinking dynamics show ripening and coalescence.
(A) Aggregate growth and diminution kinetics over a period of 6 min from 30 long-lived aggregates from seven cells. Here, the intensity is normalized to the initial intensity. Color code: red are growing intensity, blue are diminishing intensity, and black represent no change (<10%) between start and end time points. (B) The intensity time traces of the individual aggregates show a clear difference in the global trend with the initially larger aggregates also corresponding to the growing (red) aggregates, and initially smaller aggregates shrinking (blue). Instantaneously all aggregates exhibit individual steps of both growth and diminution, and one small aggregate out of the 30, was seen to grow more than 10%. (C) Schematic depicting the expectations from Ostwald ripening: This coarsening/ripening behavior that large aggregates grow larger while small aggregates diminish is a key dynamic signature of a fluid in phase transition. (D and E) The aggregates coalesce. (D) A montage three aggregates successively coalescing into one aggregate over the period of ~6 min. (E) The intensity trace of the three clusters in (D) shows that in each time upon merging the new droplet is the sum of the two precursor aggregates. Also see Figure 5; Video 1 associated with 4D and 4E and Figure 5; Video 2 for more examples). All cells imaged in this figure were live cells.
Videos
Video 1
Lattice light sheet imaging of Synphilin cluster mergers in live cells - example 1.
https://doi.org/10.7554/eLife.39695.012
Video 2
Lattice light sheet imaging of Synphilin cluster mergers in live cells - example 2.
https://doi.org/10.7554/eLife.39695.013Tables
Key resources table
| Reagent type (species) or resource | Designation | Source or reference | Identifiers | Additional information |
|---|---|---|---|---|
| Cell line (H. sapiens) | MCF10A | ATCC | ATCC:CRL10317 RRID: CVCL_0598 | |
| Cell line (H. sapiens) | Neuro2A | ATCC | ATCC:CCL131 RRID: CVCL_0470 | |
| Transfected construct | Synphilin-GFP | Zaarur et al., 2008 | n/a | Generated by Sherman lab - published Zaarur et al., 2008, backbone pCXsbr |
| Transfected construct | Human Alpha Synuclein | Addgene | 51437 | |
| Transfected construct | Dendra 2 | Clonetech USA | PDendra2C | |
| Transfected construct | Synphilin-Dendra2 | This Paper | n/a | Generated from synphilin-gfp and dendra two plasmid above. Available from Cisse lab |
| Transfected construct | alpha Synuclein Dendra2 | This paper | n/a | Generated from human alpha Synuclein and Dendra two plasmid above. Available from Cisse lab |
| Sequence- based reagent | siGENOME Non-Targeting siRNA #5 | Dharmacon | D-001210–05 | |
| Sequence- based reagent | siGENOME RUVBL1 siRNA | Dharmacon | (D-008977–04) | |
| Chemical compound, drug | ||||
| Chemical compound, drug | MG132 | Sigma Aldrich | M8699 | |
| Chemical compound, drug | Rapamycin | Sigma Aldrich | R8781 | |
| Chemical compound, drug | Cycloheximide | Sigma Aldrich | C7698 | |
| Chemical compound, drug | Azetidine-2-Carboxylic acid | Sigma Aldrich | A0760 | |
| Chemical compound, drug | Cholera Toxin | Sigma Aldrich | C8052 | |
| Chemical compound, drug | Human Insulin | Sigma Aldrich | I9278 | |
| Chemical compound, drug | Leboqitz L15 medium | Sigma Aldrich | 11415064 | |
| Chemical compound, drug | Hydrocortisone | Sigma Aldrich | H0888 | |
| Chemical compound, drug | dbCAMP | Sigma Aldrich | D0627 | |
| Chemical compound, drug | Ver155008 | Sigma Aldrich | SML0271 | |
| Chemical compound, drug | Lipofectamine RNAiMAX | Thermo Fisher | 13778030 | |
| Chemical compound, drug | Xtremegene 9 | Sigma Aldrich | 6365779001 | |
| Software, algorithm | qSR | Andrews et al. (2018) | Software made available on repository - http://github.com/cisselab/qSR/ | |
| Software, algorithm | Lattice Light sheet processing code | Chen et al., 2014 | ||
| Software, algorithm | Multiple Target tracking(MTT) | Sergé et al., 2008 |
Additional files
-
Transparent reporting form
- https://doi.org/10.7554/eLife.39695.016
Download links
A two-part list of links to download the article, or parts of the article, in various formats.
Downloads (link to download the article as PDF)
Open citations (links to open the citations from this article in various online reference manager services)
Cite this article (links to download the citations from this article in formats compatible with various reference manager tools)
A first order phase transition mechanism underlies protein aggregation in mammalian cells
eLife 8:e39695.
https://doi.org/10.7554/eLife.39695


