Molecular function limits divergent protein evolution on planetary timescales
- Columbia University, United States
- Division of Cancer Treatment and Diagnosis, National Cancer Institute, United States
Figures
Figure 1 with 7 supplements

Sequence divergence of enzyme orthologs as a function of time.
The global pairwise sequence identities between pairs of orthologous enzymes are shown as a function of divergence times between the corresponding species. Three models of amino acid substitution were used to fit the divergence data. Model 1 (black lines) assumes independent and equal substitution rates across all protein sites. Model 2 (red lines) assumes, in addition to independent and equal substitution rates, that a given fraction of protein sites remains identical at large divergence distances. Model 3 (blue lines) assumes a gamma distribution of amino acid substitution rates across sites. Best fits of the models are shown for four representative EC numbers: (a) 1.5.1.3, (b) 2.7.4.3, (c) 4.2.1.2, (d) 6.3.4.2. The horizontal dashed black lines represent the average sequence identity for the global alignment of unrelated protein sequences. The data and corresponding model fits for the other EC numbers considered in the analysis are given in Figure 1—figure supplement 1 and Supplementary file 2a.
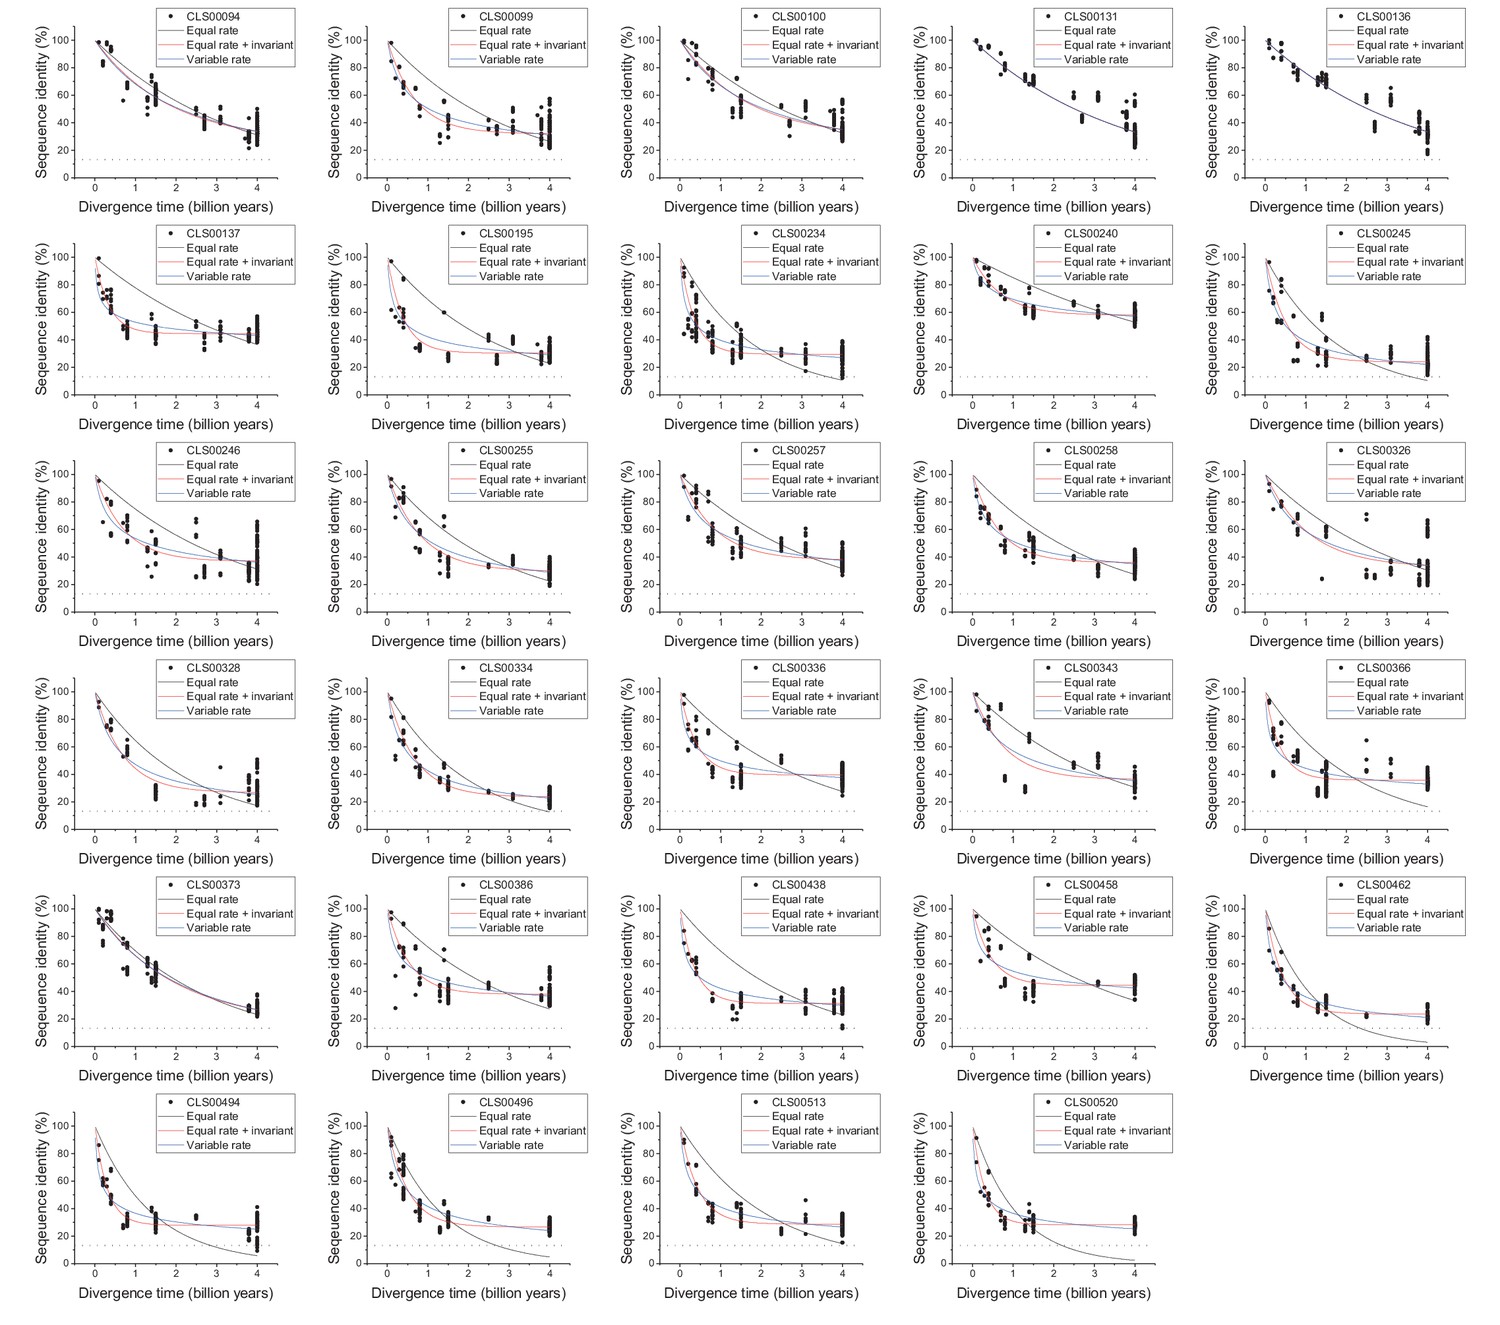
Figure 1—figure supplement 1
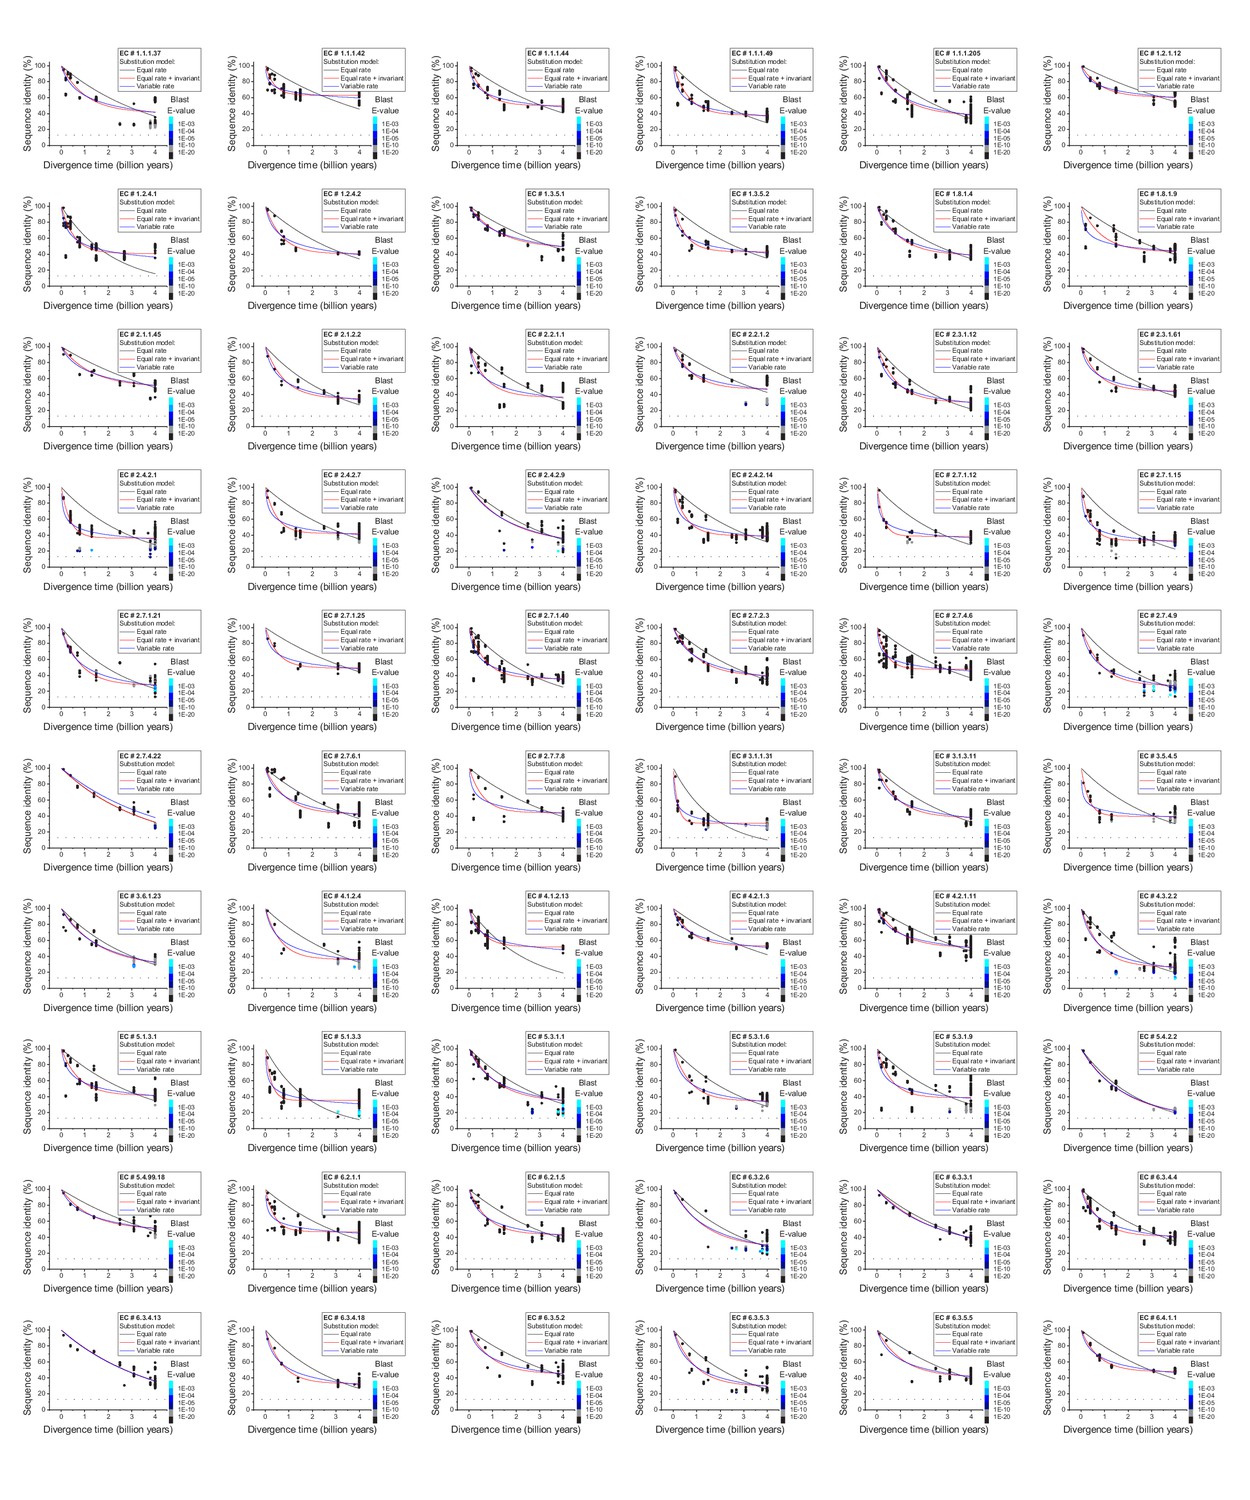
Sequence divergence of enzyme orthologs as a function of time.
The global pairwise sequence identities between pairs of orthologous enzymes as a function of divergence times between the corresponding species. The colored lines indicate fits to the data using the three models of amino acid substitutions (Equations 1-3). The horizontal dashed black lines show the average sequence identity for the global alignment of unrelated protein sequences. Dot colors indicate the corresponding psi-blast E-value of the pairwise alignments for a database size of 3.8 × 10⁵ sequences. Parameter fits of the divergence models are presented in Supplementary file 2a.
-
Figure 1—figure supplement 1—source data 1
Sequence identity versus divergence times for 64 enzyme families.
- https://doi.org/10.7554/eLife.39705.004
Figure 1—figure supplement 2
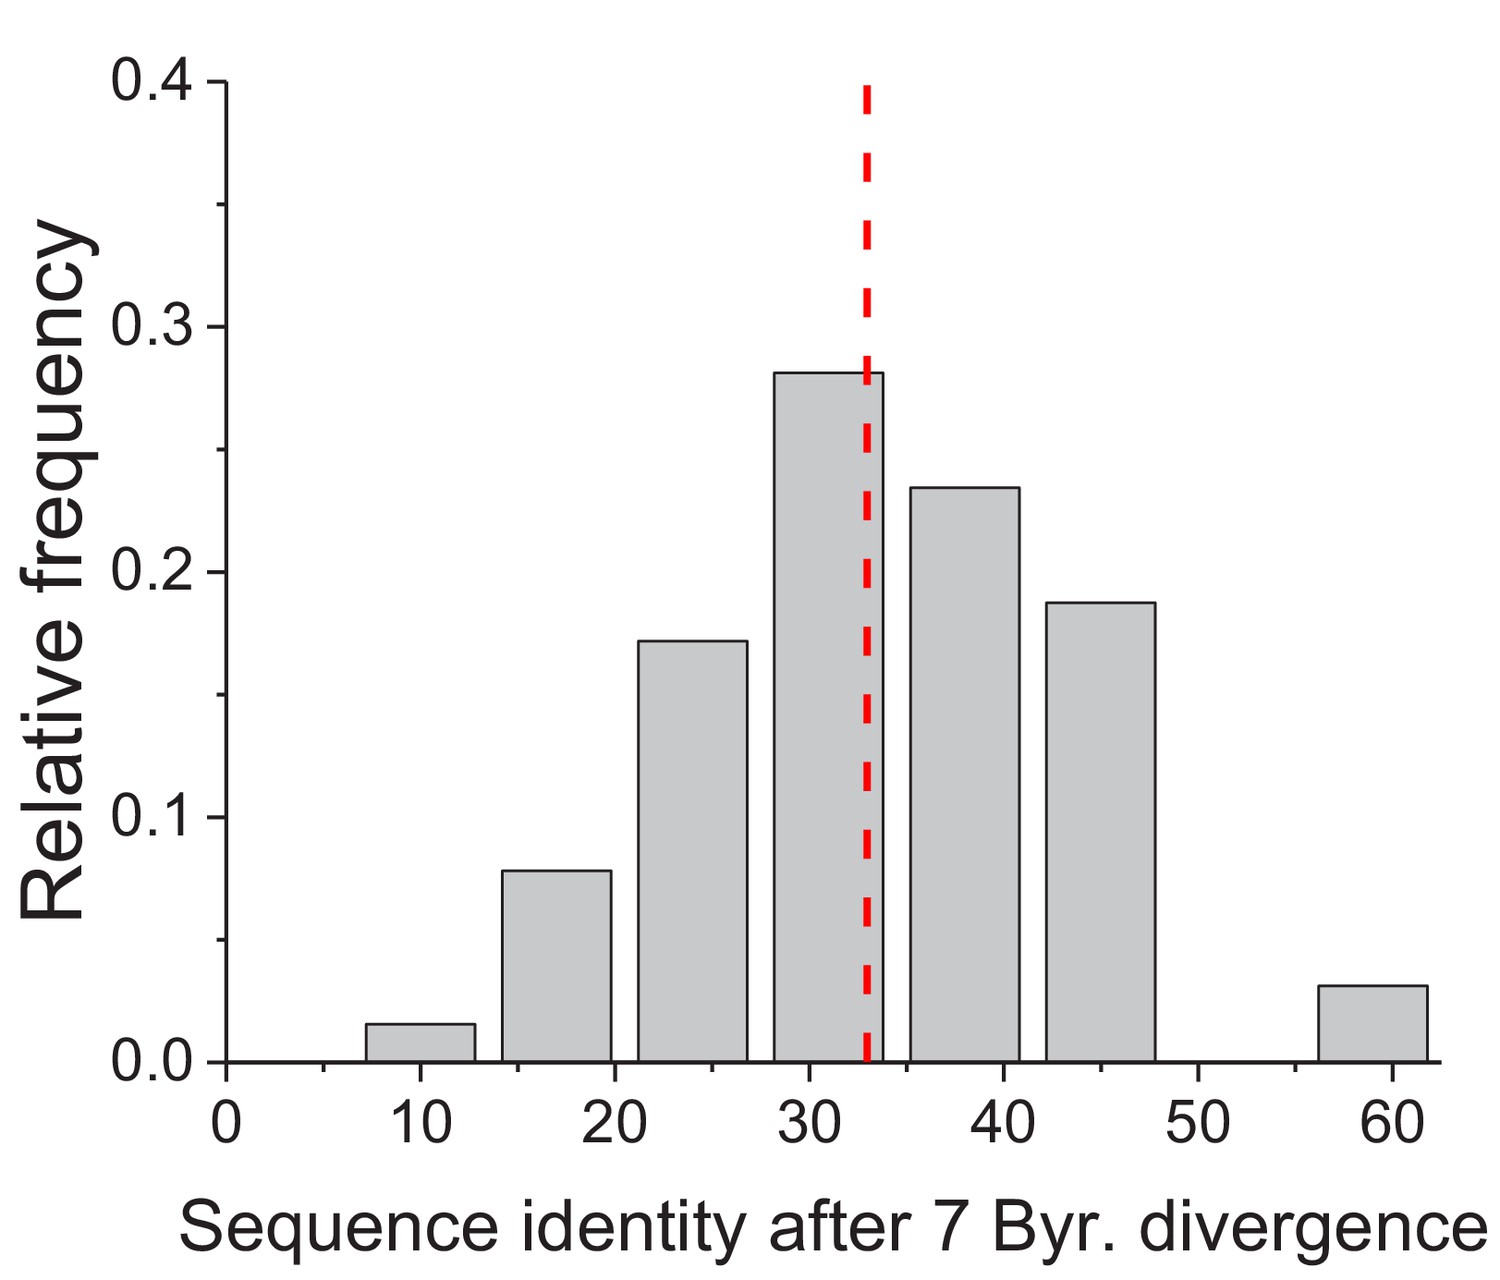
Projected long-term sequence identity of metabolic orthologs.
The distribution, across 64 EC numbers, of the projected global sequence identity after 7 billion years of sequence divergence according to the Model 3 (Equation 3). The vertical dashed red line represents the median value of the distribution (33%).
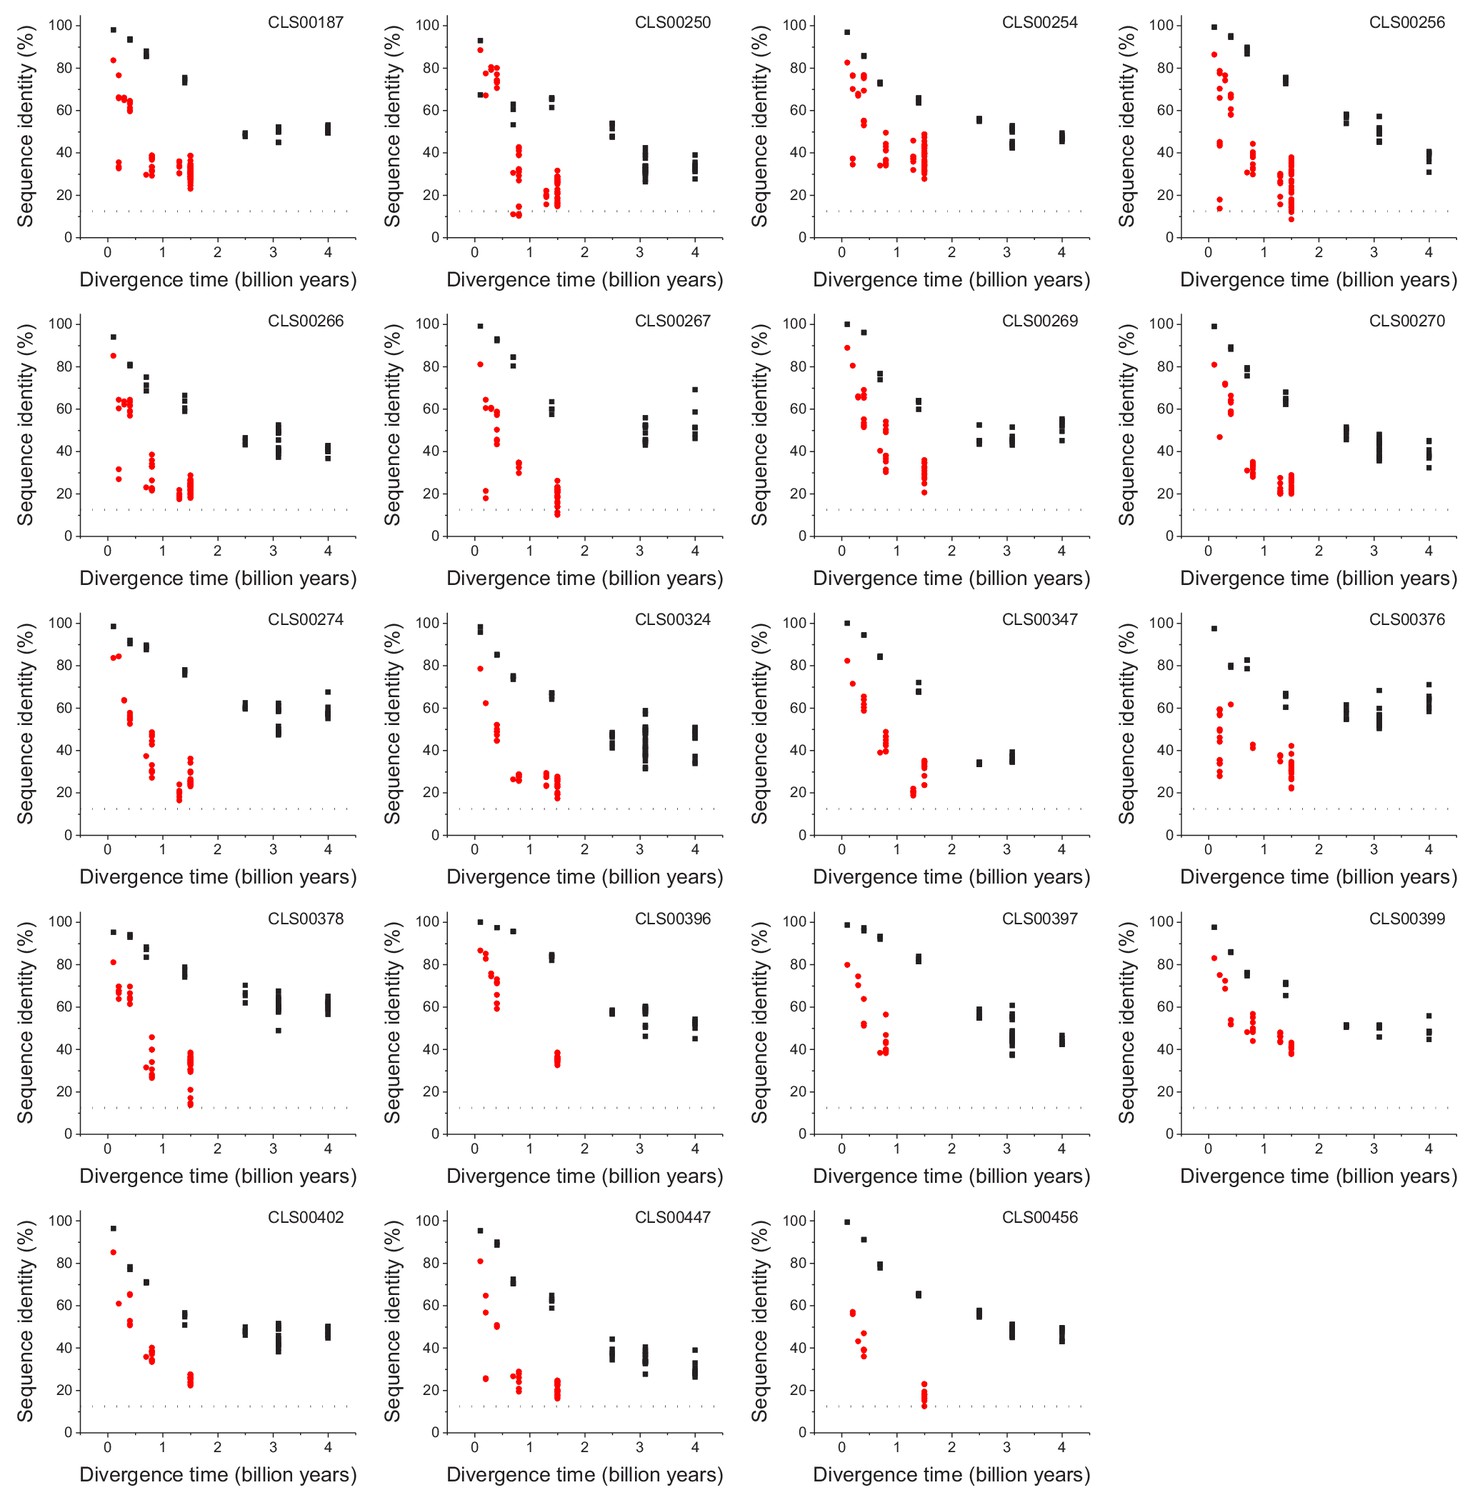
Figure 1—figure supplement 3
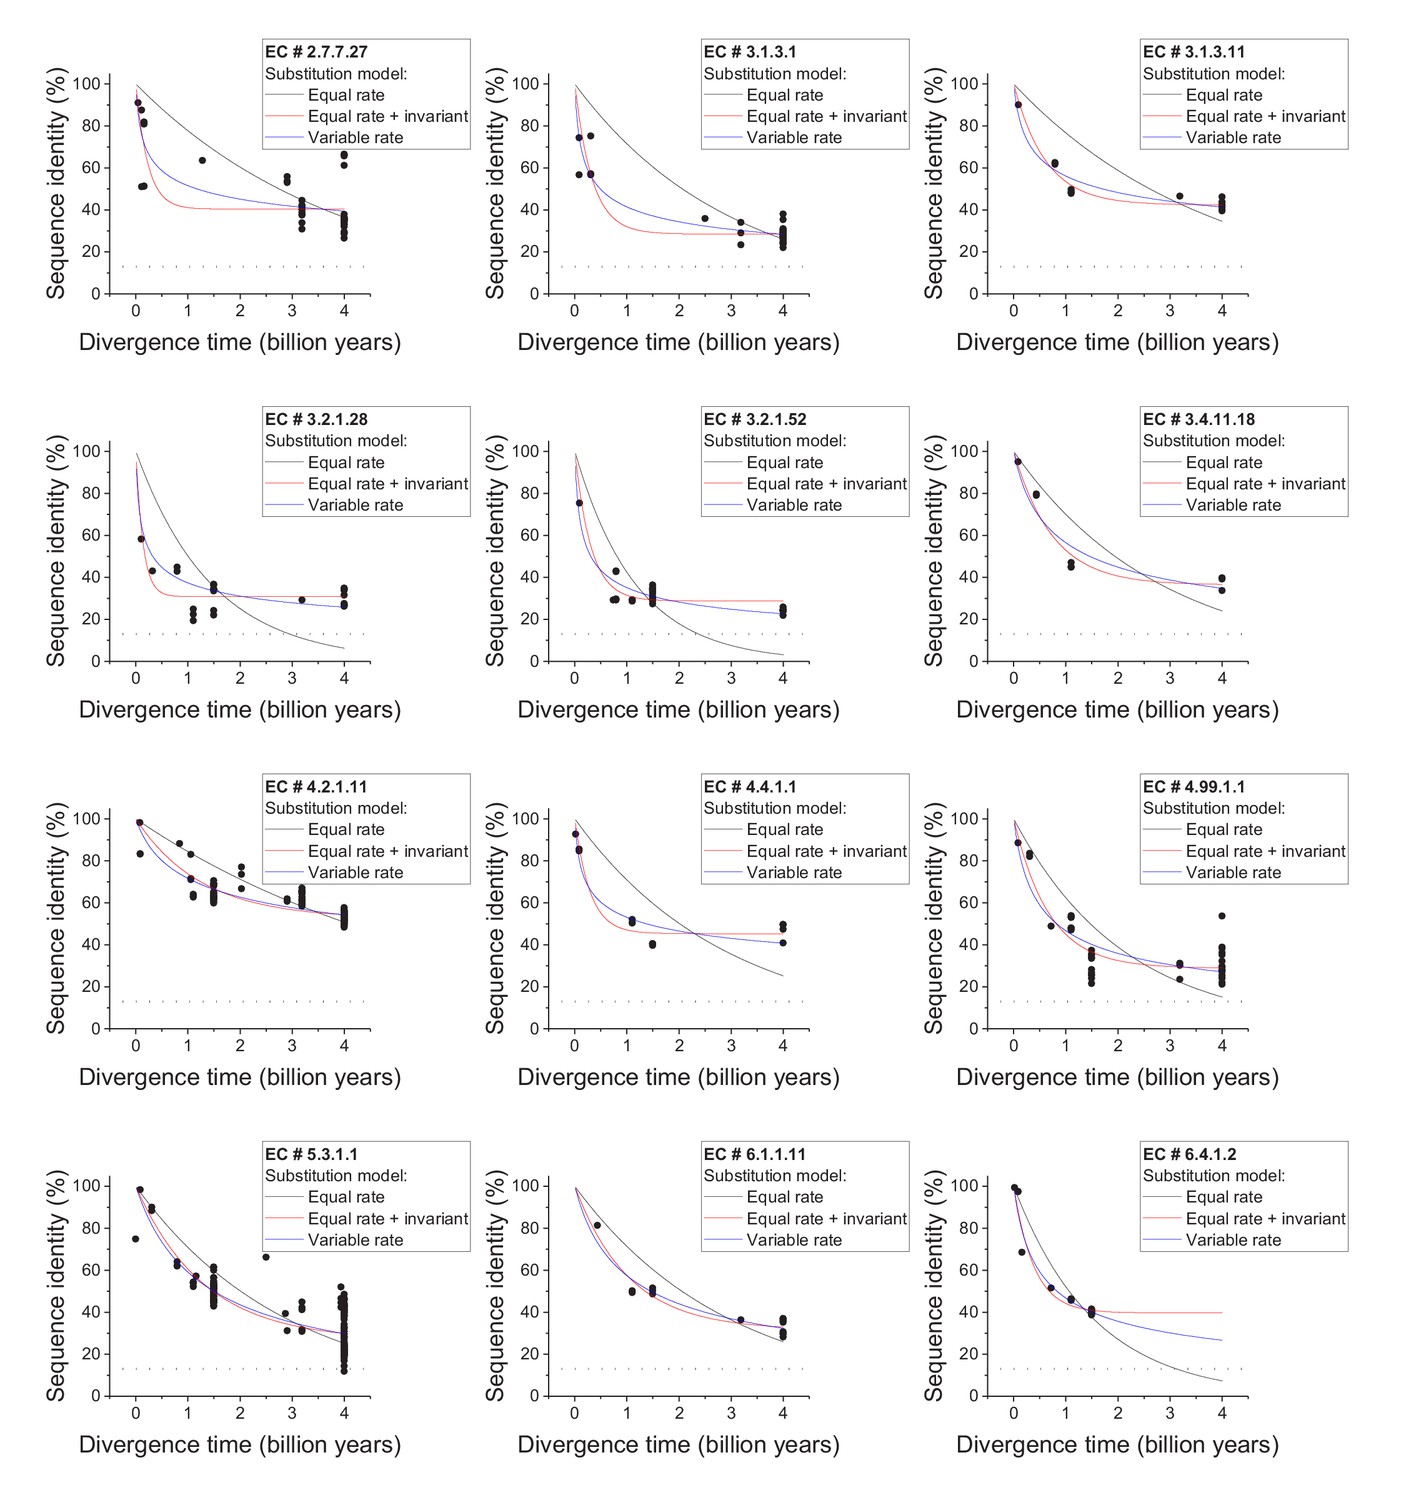
Divergence of orthologs with experimentally validated functional annotations.
Sequence identity as a function of divergence time for orthologous enzymes annotated with the same EC number and experimentally validated molecular functions. The color lines indicate fits to the data for the three models of amino acid substitution (Equations 1-3). Results are shown for 12 different EC numbers. For all EC numbers, the Model 2 (red) gives a better fit to the data compared to the Model 1 (black, F-test p-value<0.05). Also, for all EC numbers the minimum sequence identity at long divergence times (Y0, from Equation 2) is higher than the average sequence identity between unrelated protein pairs (~13.5%, dashed black lines) (Wald-test p-value<0.05).
-
Figure 1—figure supplement 3—source data 1
Sequence identity versus divergence times for experimentally validated enzymes.
- https://doi.org/10.7554/eLife.39705.007
Figure 1—figure supplement 4
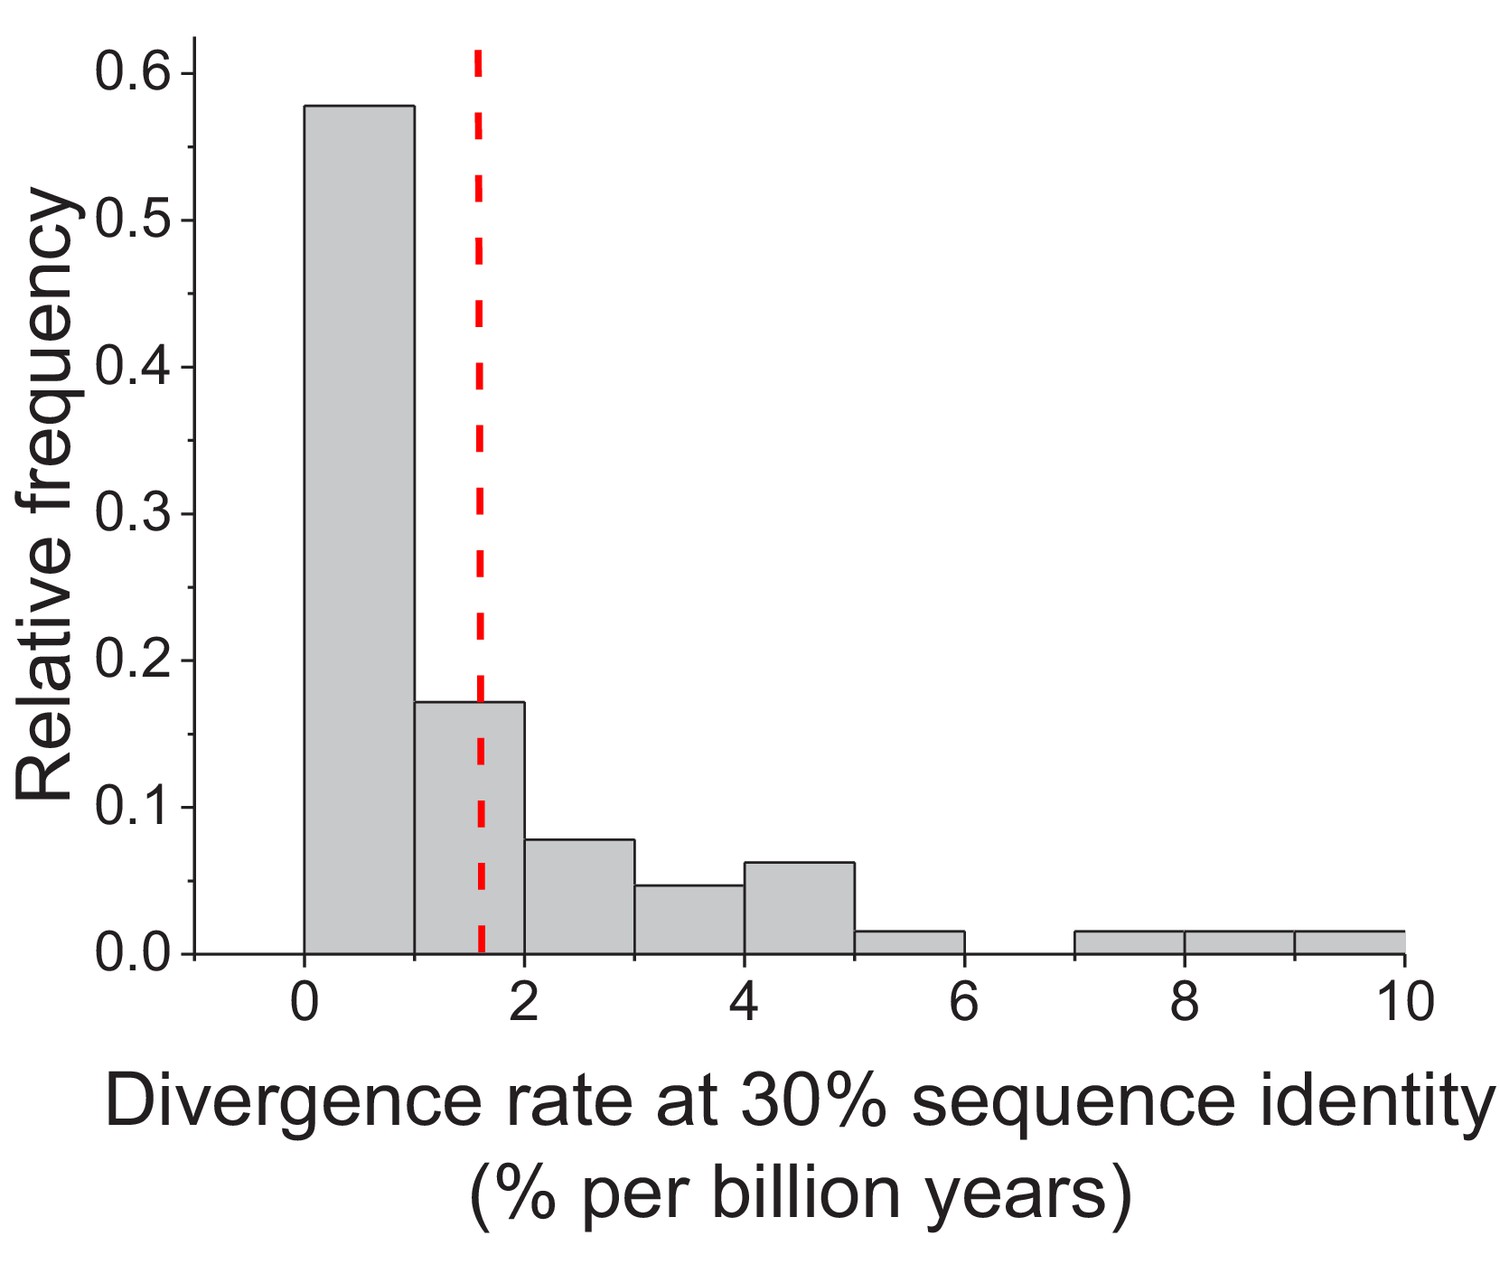
Enzyme divergence rates at 30% sequence identity.
The distribution of sequence divergence rates between orthologous enzymes when their sequence identity reaches 30%. Divergence rates were defined as the decrease in percent sequence identity per billion years. Divergence rates were calculated based on the Model 3 fits and Equation 4. The dashed red line represents the mean value of the distribution across enzymes (1.6% per billion years).
Figure 1—figure supplement 5
Sequence divergence of non-enzyme orthologs as a function of divergence time.
The global pairwise sequence identities between pairs of orthologous proteins that are not part of the EC nomenclature are shown as a function of divergence times between the corresponding species. The colored lines indicate fits to the data using the three models of amino acid substitution (Equations 1-3). The dashed black lines represent the average sequence identity for the global sequence alignment of unrelated protein sequences. Model parameter fits are presented in Supplementary file 2c.
-
Figure 1—figure supplement 5— source data 1
Sequence identity versus divergence times for 29 non-enzyme families.
- https://doi.org/10.7554/eLife.39705.010
Figure 1—figure supplement 6
Sequence divergence of mitochondrial ribosomal orthologs as a function of divergence time.
Global sequence identity as a function of divergence time for orthologous proteins with substantially different divergence rates between eukaryotic orthologs (red) and pairs of orthologs involving at least one prokaryotic sequence (black). Eukaryotic proteins are mostly annotated as mitochondrial ribosomal proteins and translation initiation factors. The dashed black lines represent the average sequence identity for the global sequence alignment of unrelated protein sequences.
-
Figure 1—figure supplement 6—source data 1
Sequence identity versus divergence times for mitochondrial ribosomal orthologs.
- https://doi.org/10.7554/eLife.39705.012
Figure 1—figure supplement 7
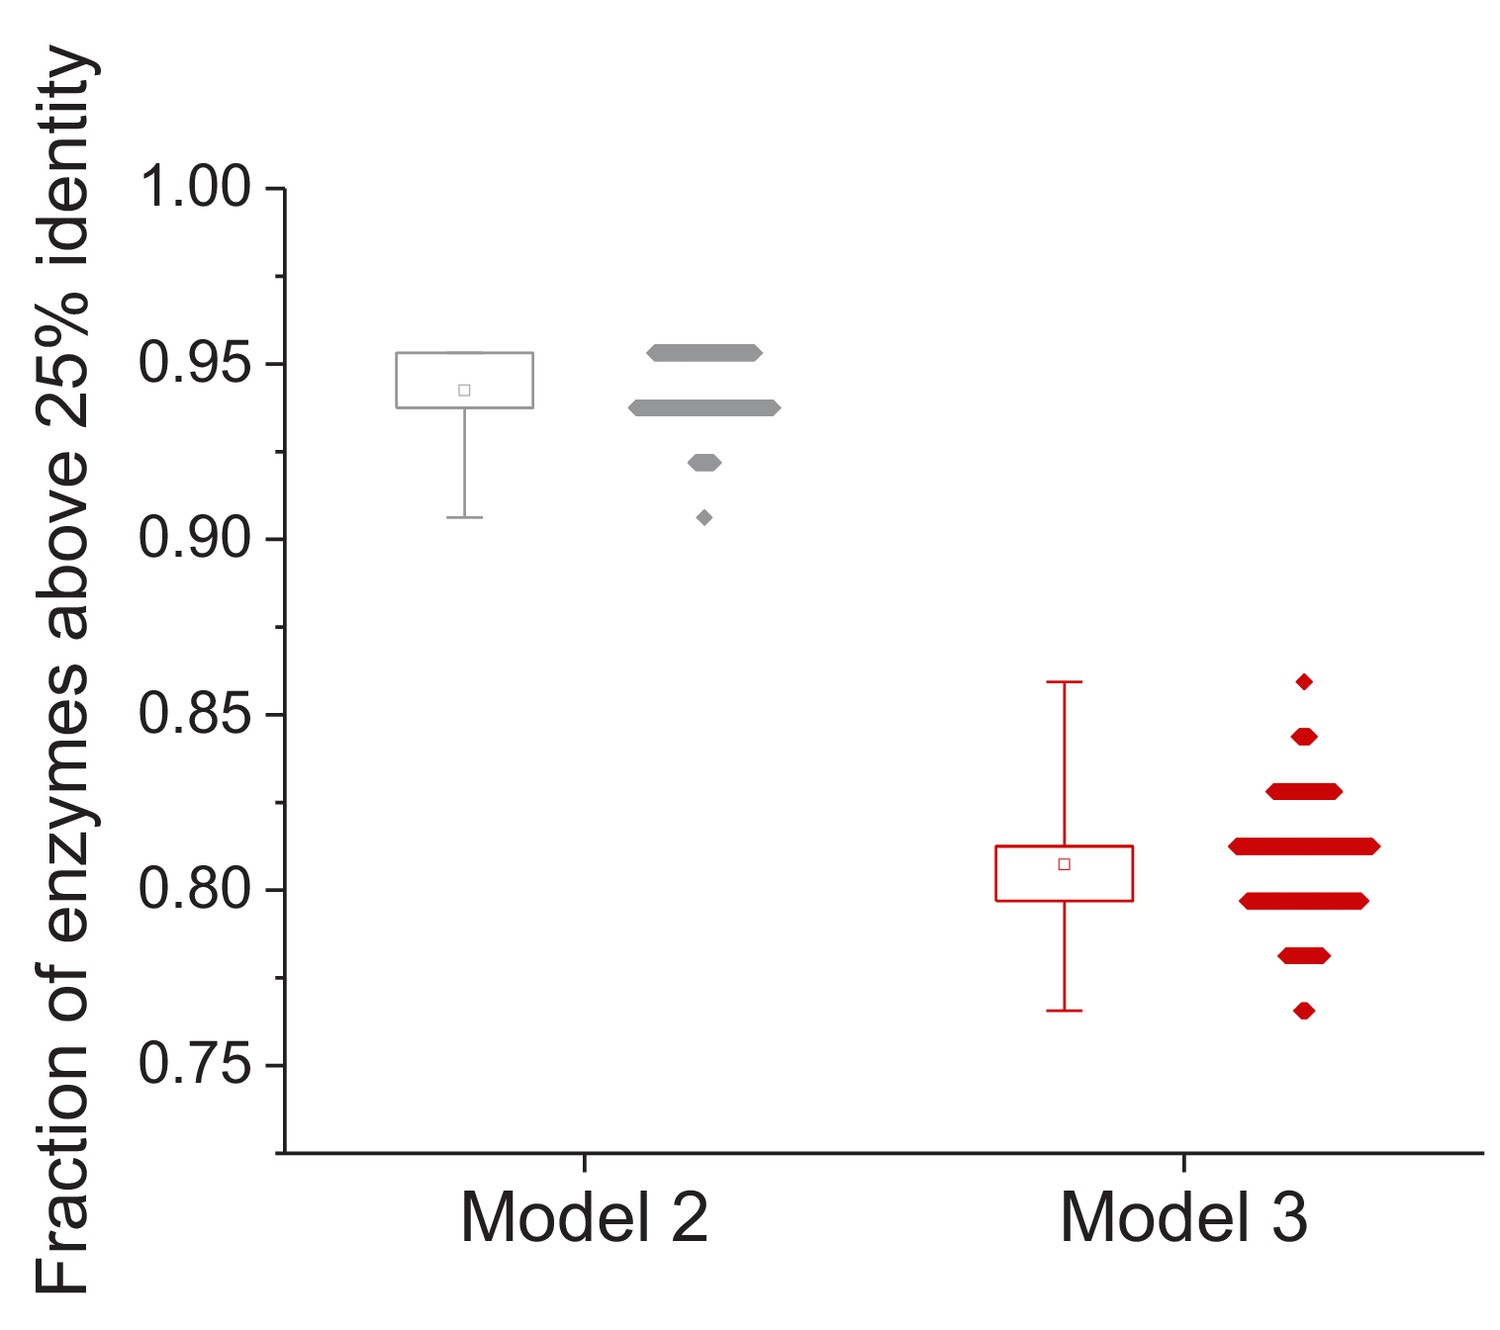
Effect of uncertainty in the estimation of species divergence times on the model fits.
Effect of different estimates of species’ divergence times on the predicted long-term sequence identity between orthologous enzymes with the same molecular function. The data on the left shows the fraction of enzymes for which the Model 2 Y0 parameter is higher than 25% sequence identity; each dot corresponds to a different assignment of lineage divergence times (based on either minimum or maximum literature estimates; see Materials and methods). The data on the right shows the fraction of orthologous enzymes for which the predicted sequence identity after 7.8 billion years of divergence is higher than 25% identity. The box plots show the minimum and maximum values and 25% and 75% percentiles based on 1000 divergence time assignments.
Figure 2
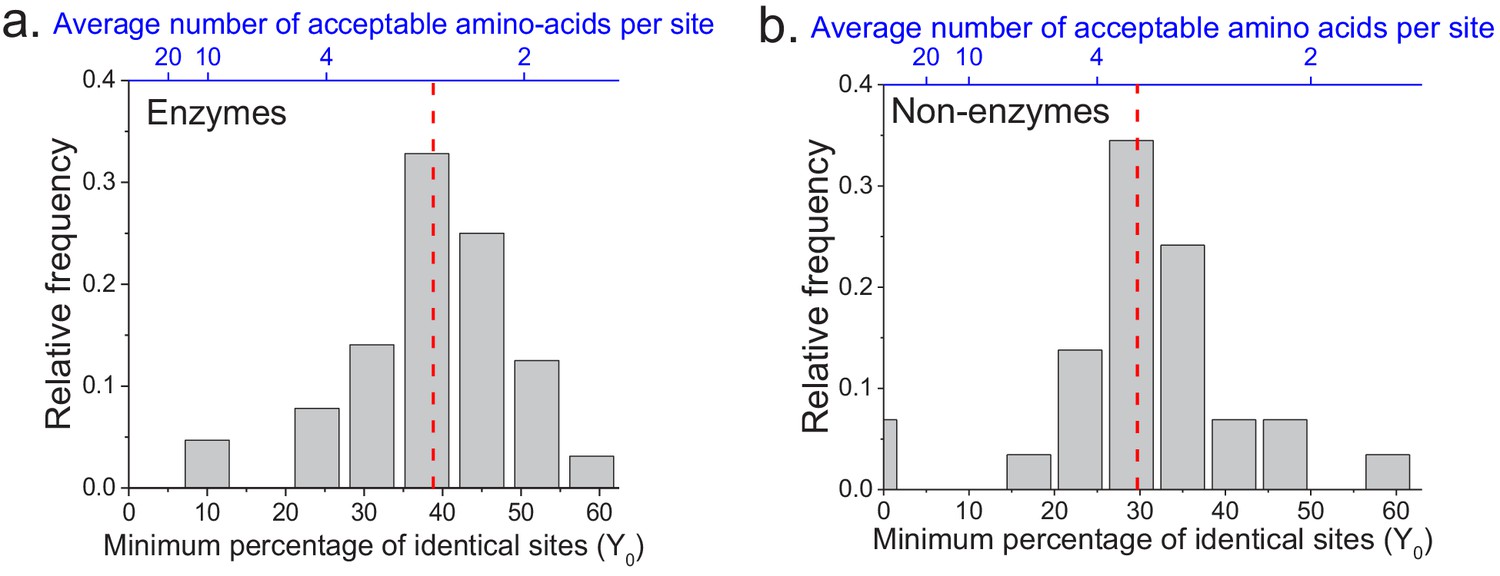
The limit of long-term protein sequence divergence between orthologous proteins.
(a) The distribution of Y0 parameter values across 64 EC numbers for fits based on Model 2 (Equation 2). The Y0 parameter represents the minimum percentage of protein sites that remain identical at long divergence times. The parameter Y0 (considered as a fraction) can also be interpreted as the inverse of the average number of amino acid types accepted per protein site during long-term protein evolution (top blue X axis). (b) Similar to panel a, but for 29 ancient protein families annotated with non-enzymatic functions. In panels a and b, the vertical red dashed lines represent the median values of the distributions (39% and 30%, respectively).
Figure 3 with 1 supplement
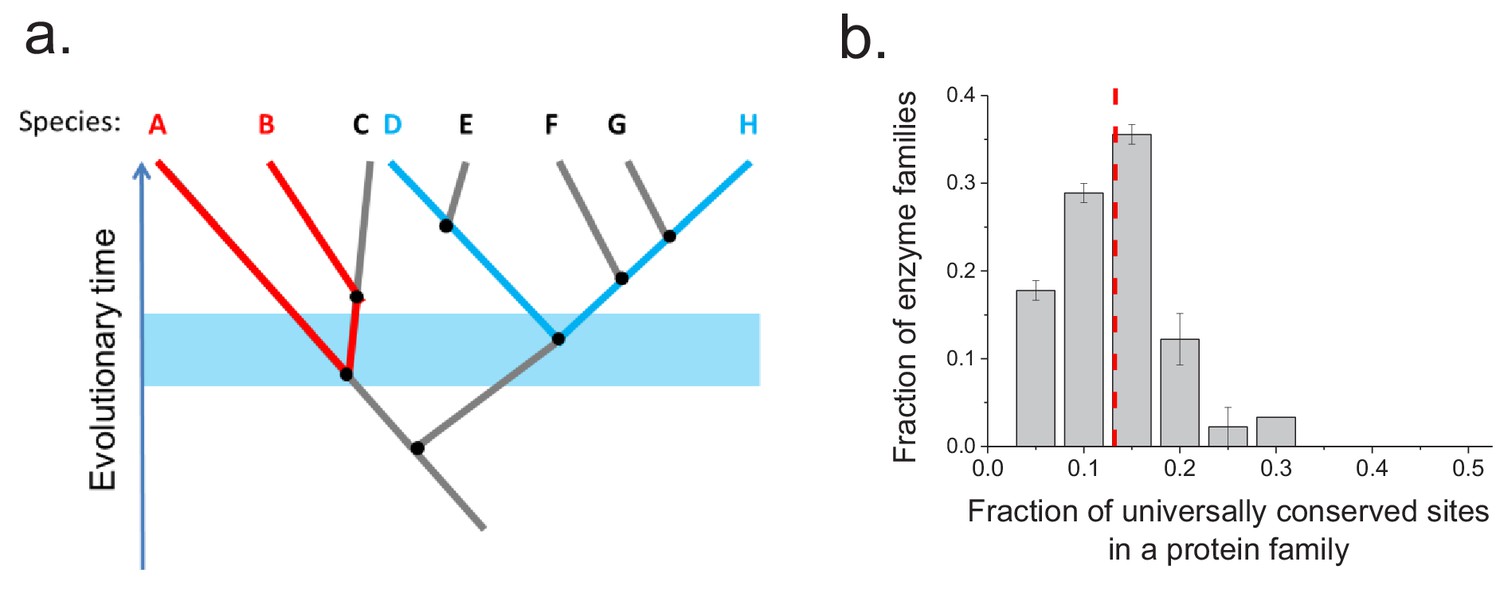
Conservation of protein sites in phylogenetically independent lineages.
To identify the fractions of protein sites that are universally conserved ― defined as sites that are identical in at least 90% of orthologs ― we considered phylogenetically independent lineages. (a) Illustration of pairs of species (e.g. A–B and D–H) representing phylogenetically independent lineages. In the figure, A-B and D-H are pairs of species that diverged within a certain time window (illustrated by the blue shaded region); these species pairs do not share more recent edges in the phylogenetic tree. (b) The distribution of the fraction of universally conserved sites across 30 enzymatic families. The analysis was performed using 30 enzymatic families for which at least 20 independent pairs of orthologs with the same molecular function could be identified based on annotations in the KEGG database (Kanehisa et al., 2016) (see Materials and methods); pairs of orthologs that diverged >2 billion years ago were selected for this analysis. Error bars represent the S.E.M. based on three replicates using different sets of orthologous pairs. The dashed red line represents the median of the distribution (~13%).
Figure 3—figure supplement 1
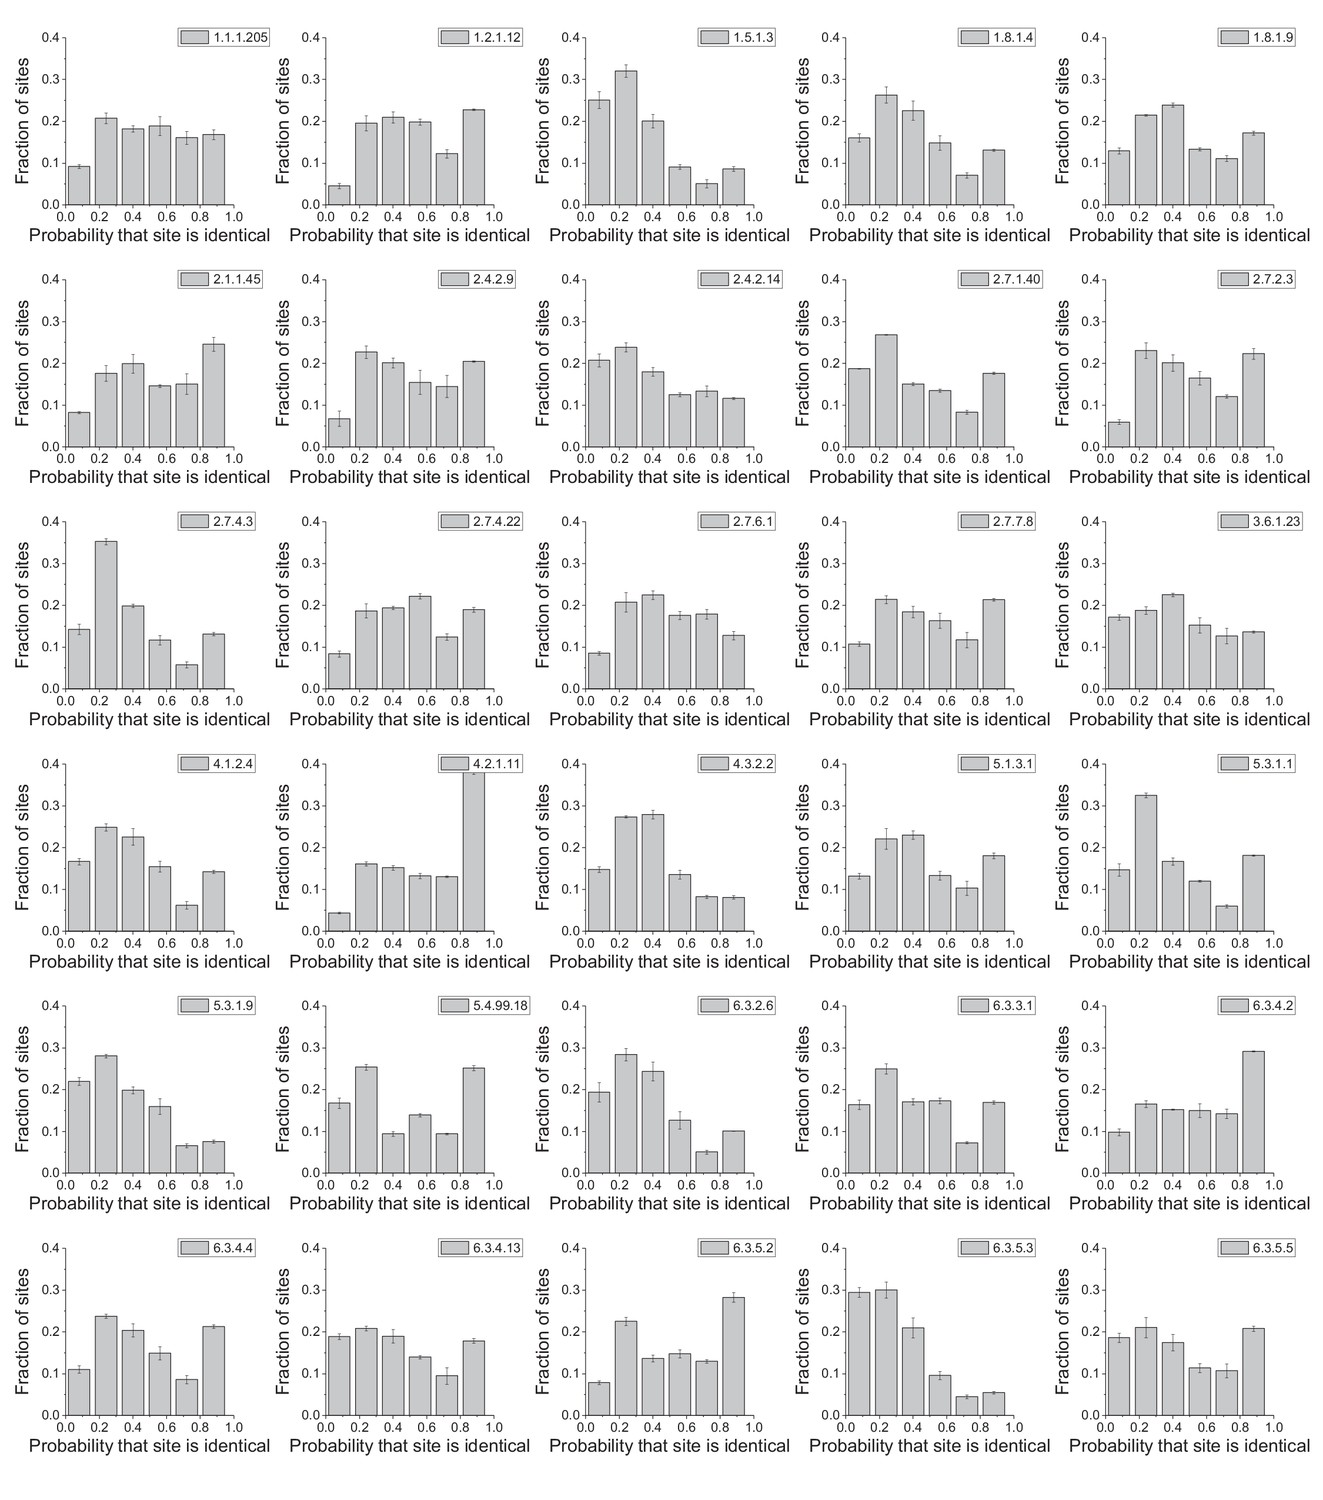
Distribution of enzyme sites according to their conservation frequency.
The panels show the distribution of protein sites according to their probability of being identical in phylogenetically independent lineages; the distributions are shown for 30 different enzyme activities (EC numbers). The probabilities were calculated as the proportion of phylogenetyically independent pairs of orthologs, with divergence times > 2 billion years (Figure 2a), in which a protein site is occupied by identical amino acids. Error bars represent the S.E.M across three replicates with different assignments of independent orthologous pairs.
Figure 4 with 2 supplements
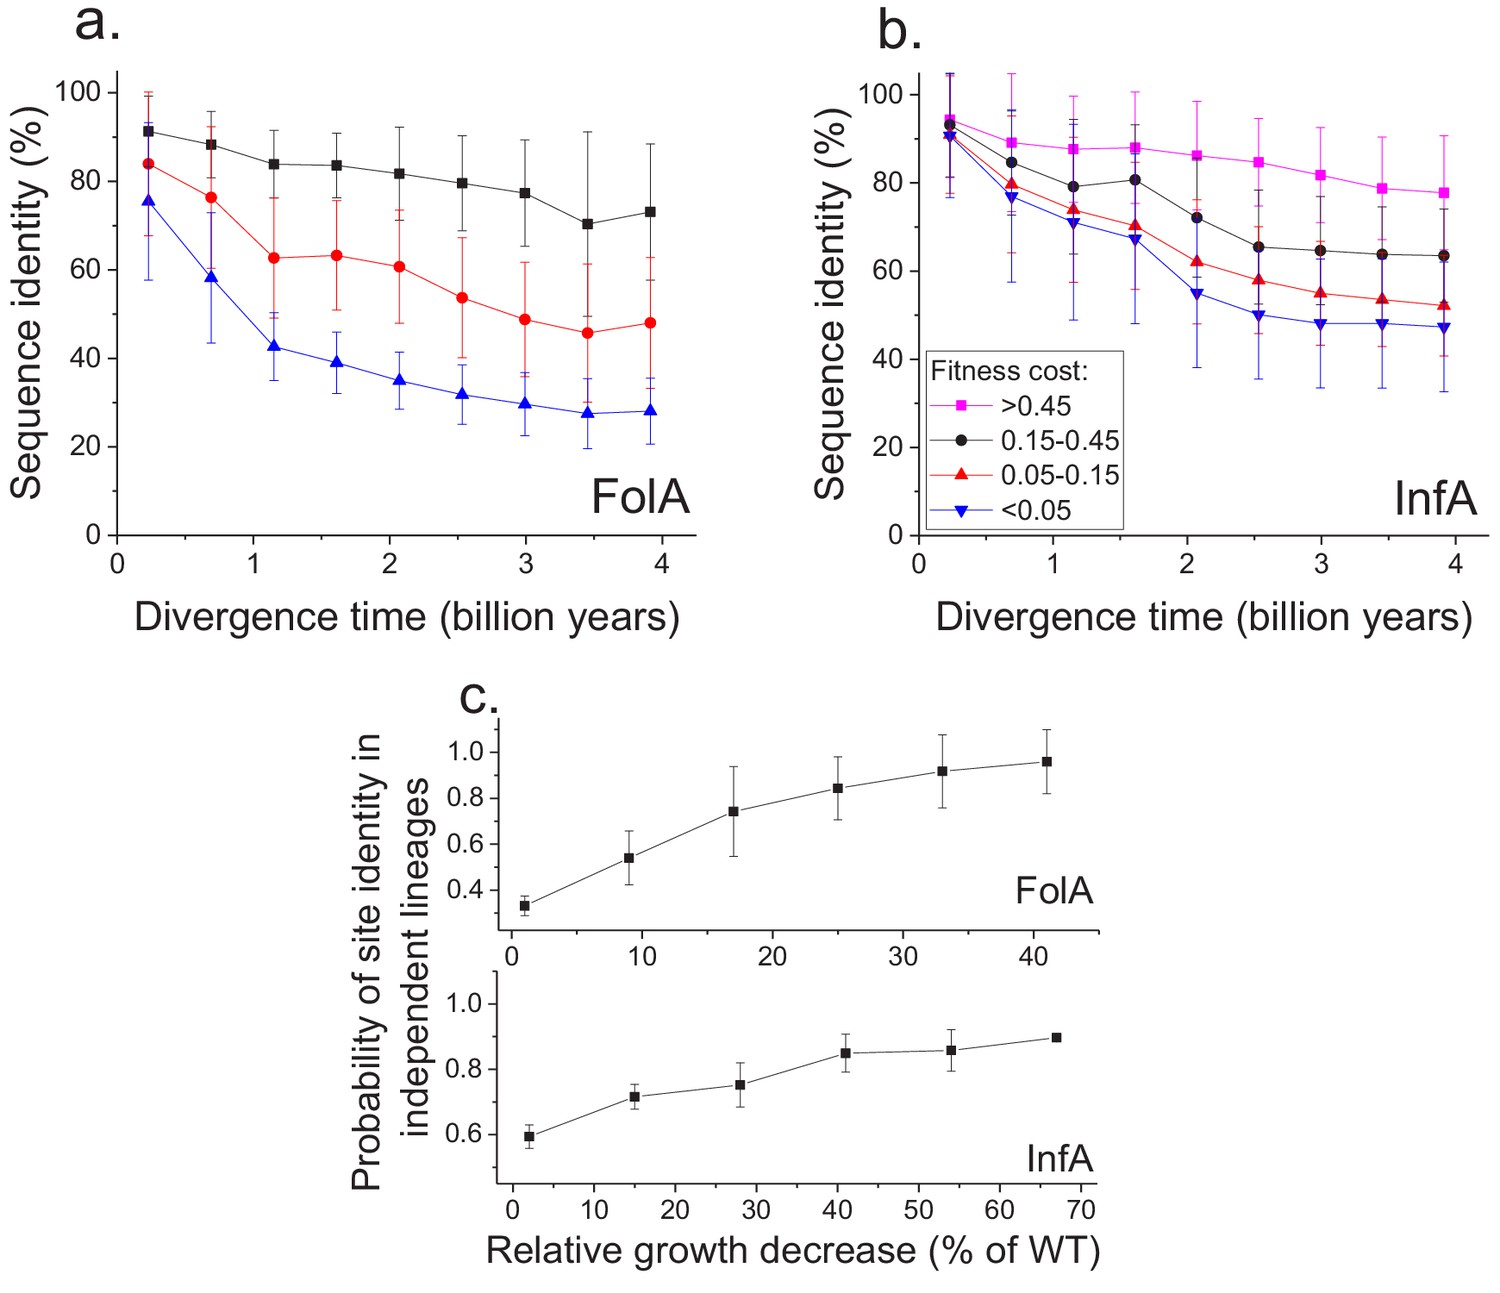
Sequence divergence of protein sites with different fitness effects of mutations measured in E. coli.
(a) The divergence of sequence identity for FolA protein sites with different average fitness effects of mutations (measured in E. coli) is shown using different colors. The average sequence identities were calculated using bacterial FolA orthologs available in the COG database (Galperin et al., 2015); divergence times were estimated using bacterial 16S rRNA sequences (see Materials and methods). Error bars represent the S.D. of sequence identity in each bin. (b) Similar to panel (a), but for the sequence divergence at protein sites of the E. coli translation initiation factor InfA. (c) The probability that protein sites in FolA orthologs (upper panel) and InfA orthologs (lower panel) are occupied by identical amino acids as a function of the average mutant fitness (measured in E. coli) at the corresponding protein sites. The probability represents the fraction of phylogenetically independent pairs of orthologs in which sites are identical at long divergence times (2 ± 0.25 billion years for FolA, and 2.5 ± 0.25 billion years for InfA). Error bars represent the S.E.M. across sites.
Figure 4—figure supplement 1
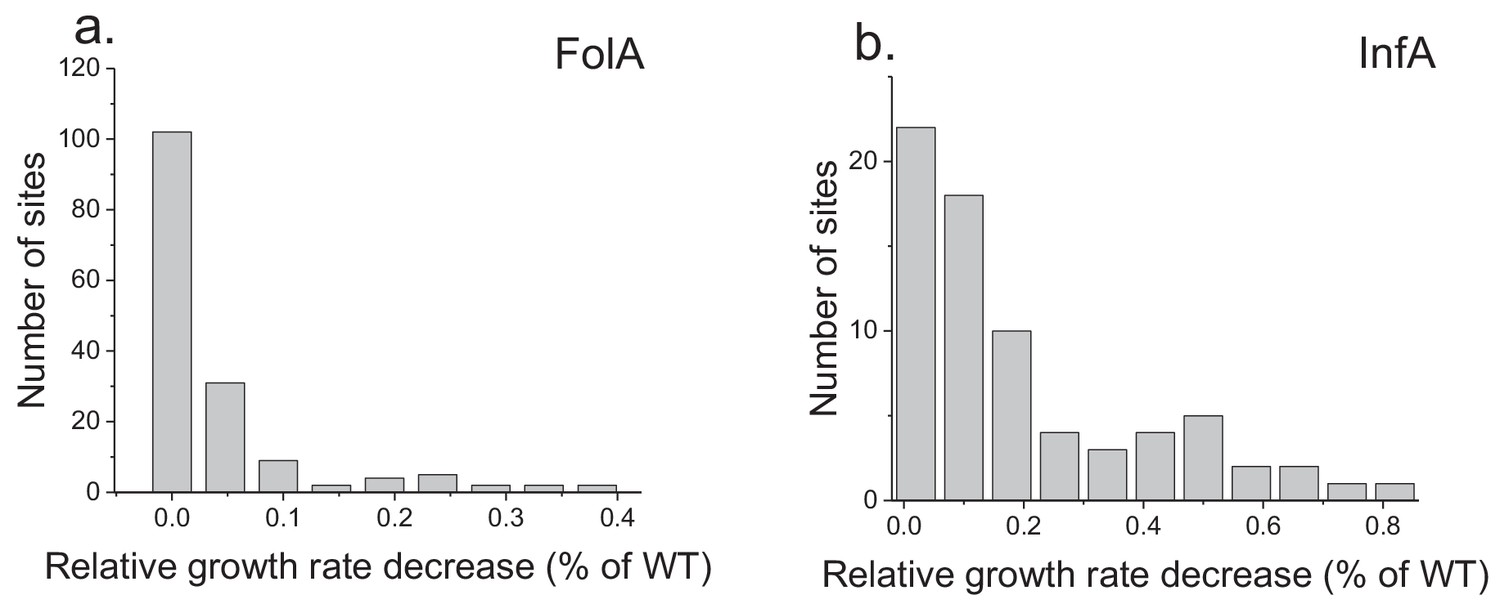
Distribution of average fitness effects of amino acid substitutions.
The panels show the distribution of average growth defects due to amino acid substitutions across FolA (a) and InfA (b) protein sites. The average growth (fitness) effects at each site was calculated as the mean values of experimentally measured growth phenotypes due to all possible amino acid substitutions at the site.
Figure 4—figure supplement 2
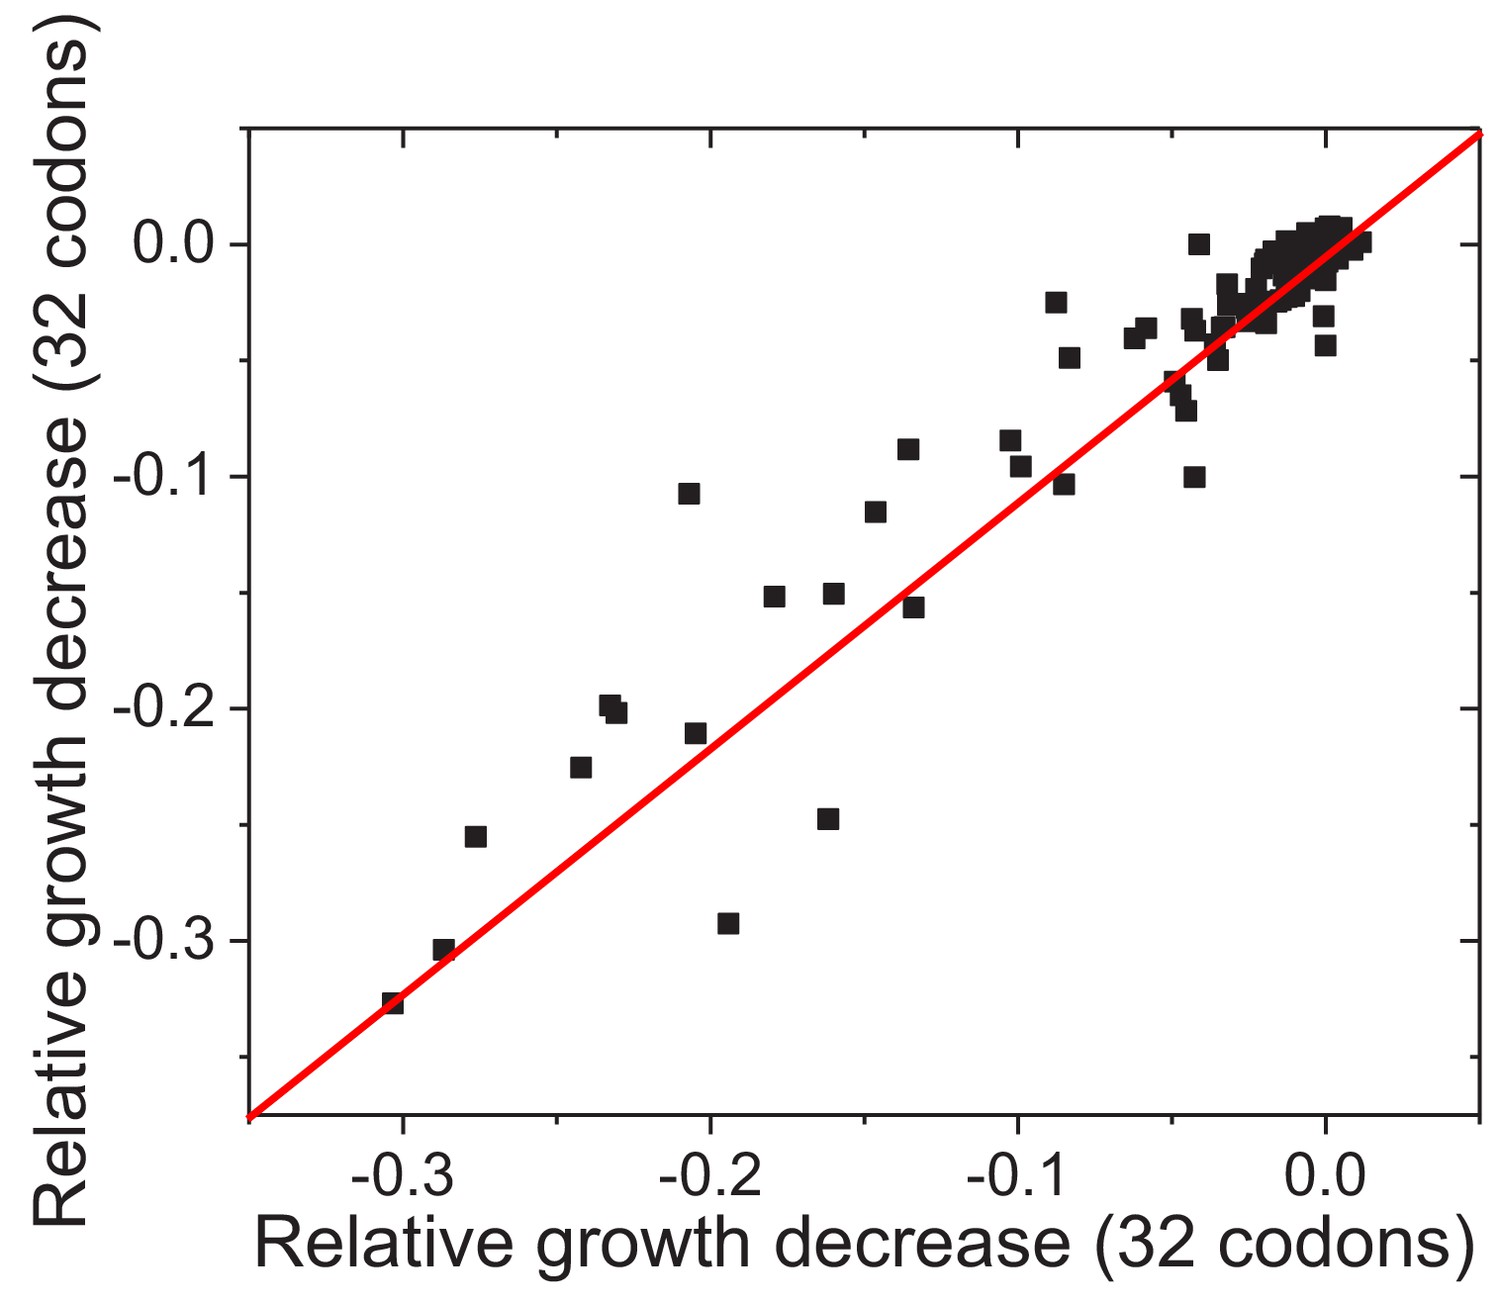
Reproducibility of experimentally measured average fitness effects of amino acid substitutions across FolA sites.
The similarity between the average fitness effects of substitutions across FolA sites was calculated using two non-overlapping sets of substitutions (see Materials and methods). Each dot in the figure represents one FolA site. The relative growth decrease in the X axis was calculated based on the relative growth rates of mutants carrying 32 randomly selected codons; the relative growth decrease in the Y axis was calculated based on the relative growth rates of mutants carrying the remaining 32 codons. The line X = Y is shown in red. Pearson’s r = 0.95, p-value<1e-20.
Figure 5
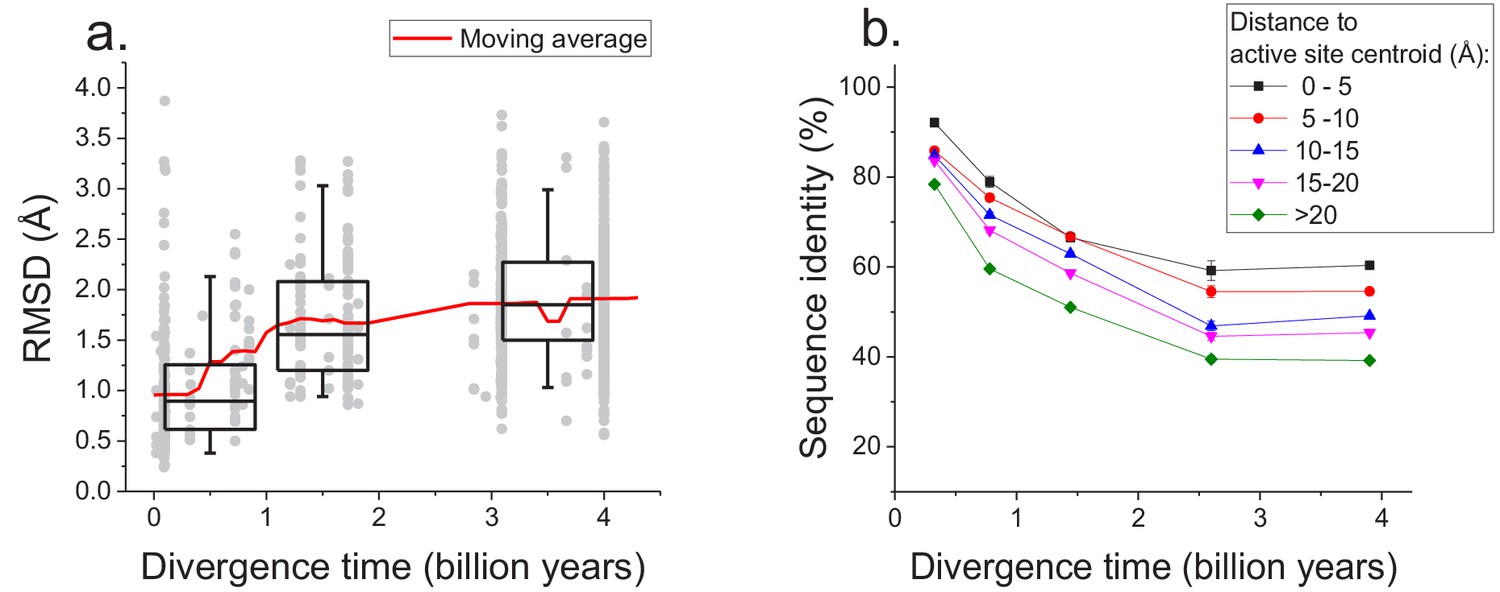
Long-term structural evolution of enzymes with the same molecular function.
(a) The pairwise C-alpha root mean square deviation (RMSD) as a function of the divergence time between pairs of orthologs annotated with the same EC number. RMSD values were calculated based on structural protein alignments using the TM-align algorithm (Zhang and Skolnick, 2005). Gray dots represent pairs of considered orthologs, boxes indicate the median and 25–75 RMSD percentiles for the corresponding divergence times, the vertical lines indicate the 5–95 percentiles, and the red line shows the moving average of the data. (b) Long-term divergence of sequence identity of protein sites located at different distances to enzymes’ active site residues. In this analysis we considered the same species and enzymatic activities used to explore the global sequence divergence (Figure 1 and Figure 1—figure supplement 1); the average sequence identities within each distance shell (shown using different colors) were calculated across all pairs of orthologs annotated with the same EC number (see Materials and methods). Error bars represent the S.E.M. across ortholog pairs.
-
Figure 5—source data 1
RMSD versus divergence times for proteins with the same enzymatic function.
- https://doi.org/10.7554/eLife.39705.021
Figure 6
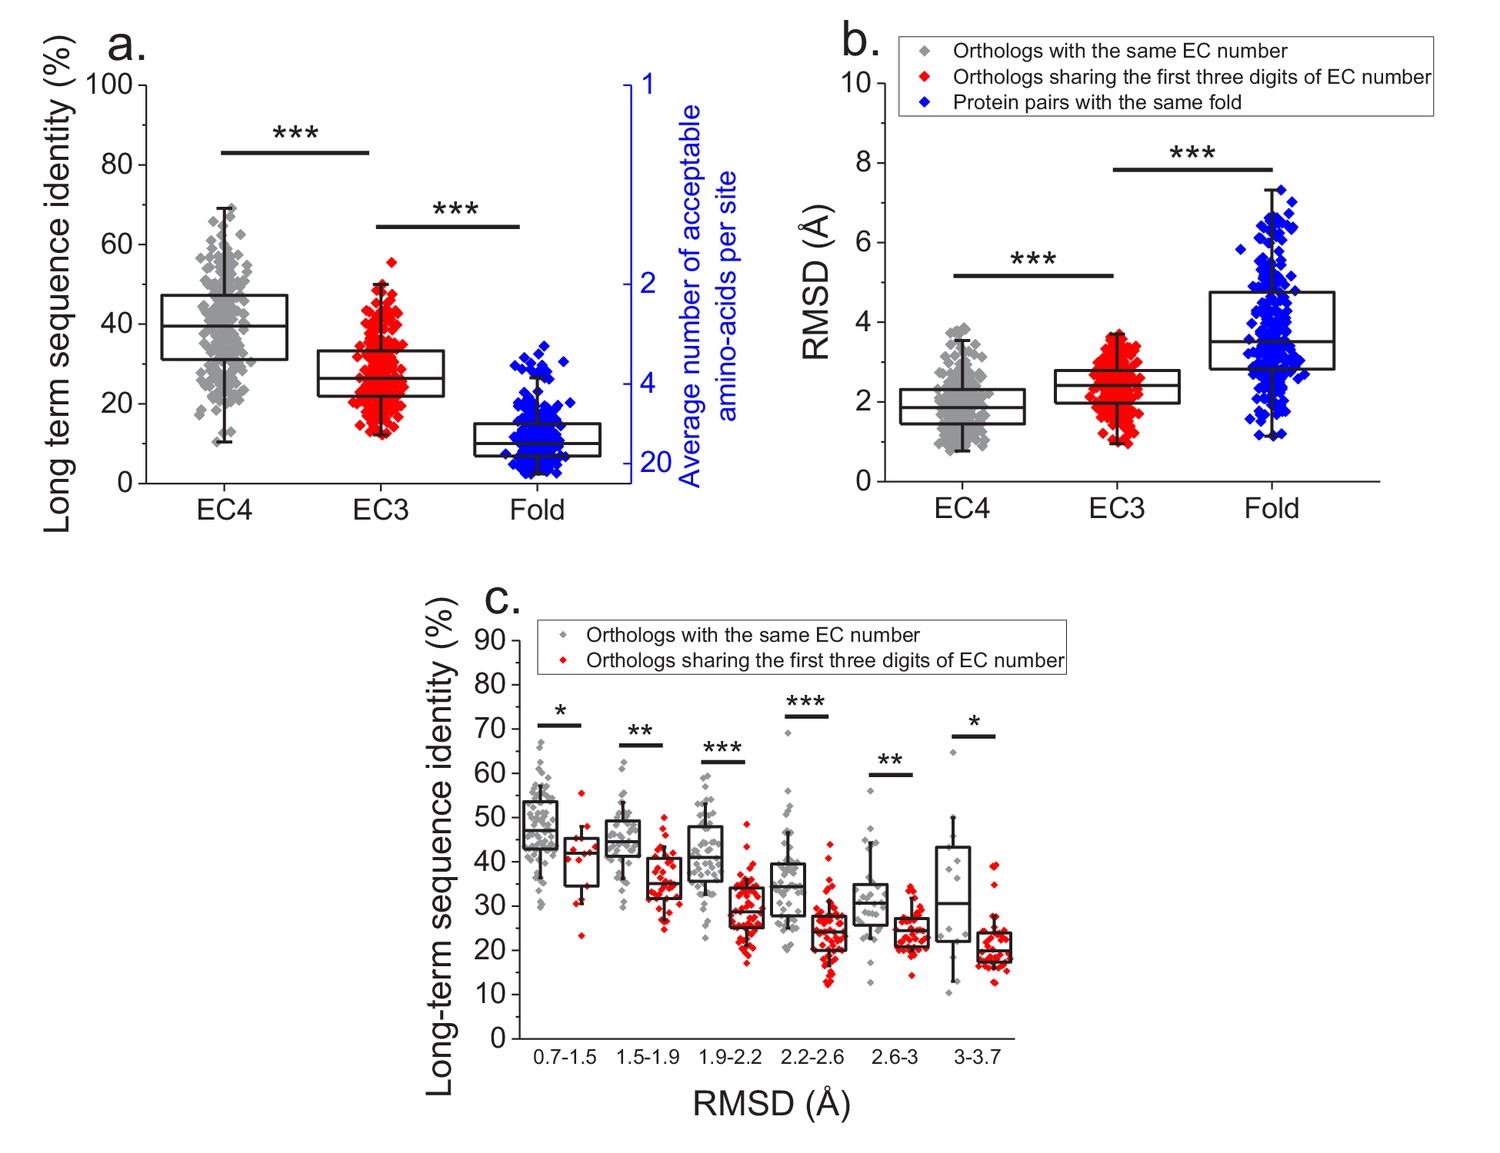
Effect of functional specificity on long-term sequence and structural divergence between orthologs.
(a) Sequence identities between orthologous pairs of enzymes that diverged over two billion years ago. The long-term sequence divergence between pairs of orthologs sharing the same EC number (gray, n = 272) is compared to the divergence between pairs only sharing the first three digits of their EC numbers (red, n = 265), that is, enzymes conserving only a general class of substrates or cofactors. The results are based on enzyme COGs for the 22 species used to analyze global sequence divergence (Supplementary file 1). Blue points show sequence identities between pairs of proteins with the same structural fold (Dawson et al., 2017) but unrelated enzyme activities, that is, activities sharing no digits in the EC classification (n = 298, see Materials and methods). The right blue Y axis represents the average number of amino acid types accepted per protein site during long-term protein evolution. (b) Similar to panel a, but showing the corresponding C-alpha structural divergence (RMSD) between protein pairs. (c) Long-term sequence identities between orthologous enzyme pairs at the same levels of structural similarity. Results are shown for pairs of enzymes sharing their full EC classification (gray dots), or only sharing the first three digits of their EC classification (red dots). In all panels: *(p<0.05), **(p<1e-4), ***(p<1e-10) for the Mann-Whitney test.
-
Figure 6—source data 1
Sequence identities between ancient orthologs sharing the same EC number and only the first three digits of their EC numbers.
- https://doi.org/10.7554/eLife.39705.023
Tables
Key resources table
| Reagent type (species) or resource | Designation | Source or reference | Identifiers | Additional information |
|---|---|---|---|---|
| Strain, strain background (Escherichia coli EcNR2) | MG1655, bla, bio-, λ-Red+, mutS-::cmR | PMID: 19633652 | Addgene #26931 | |
| Sequence-based reagent | 90 bp DNA oligos with phosphorothioated bases | This paper | See Supplementary file 4 | 100 nmole DNA Plate oligo, Integrated DNA Technologies |
| Commercial assay or kit | Miseq Reagent Kit V2 | Illumina | MS-102–2002 | |
| Commercial assay or kit | sybr green | ThermoFisher | S7567 | |
| Commercial assay or kit | Qubit HS DNA kit | ThermoFisher | Q32854 | |
| Commercial assay or kit | Q5 Hot Start High- Fidelity Mastermix | NEB | M0494S | |
| Commercial assay or kit | DNA clean and concentration kit 5 | Zymo Research | D4013 | |
| Commercial assay or kit | illustra bacteria genomicPrep Mini Spin kit | GE life sciences | 28904259 | |
| Commercial assay or kit | Agilent DNA 1000 kit | Agilent Genomics | 5067–1504 | |
| Software, algorithm | SeqPrep v1.1 | John St. John | https://github.com/jstjohn/SeqPrep | |
| Software, algorithm | Bowtie2 | PMID: 22388286 | ||
| Software, algorithm | Perl scripts to count mutant reads | This paper | https://github.com/platyias/count-MAGE-seq (copy archived at https://github.com/elifesciences-publications/count-MAGE-seq). | |
| Other | Turbidostat for growth competition assay | PMID: 23429717 |
Additional files
-
Supplementary file 1
Considered model species and pairwise average divergence times.
- https://doi.org/10.7554/eLife.39705.024
-
Supplementary file 2
Fitted model parameters, statistical test results and non-enzymatic protein annotations.
Supplementary file 2A Fitted model parameters and test results for the 64 considered activities (EC numbers). Supplementary file 2B Estimated rates of sequence divergence for pairs of orthologs according to Model three fits Supplementary file 2C Fitted model parameters and test results for 29 sets of orthologs not annotated with EC numbers Supplementary file 2D UniProt annotations of representative sequences from E. coli and H. sapiens for sets of orthologs not annotated with EC numbers Supplementary file 2E UniProt annotations of representative sequences from E. coli and H. sapiens for sets of orthologs not annotated with EC numbers and fast divergence rates in eukaryotes.
- https://doi.org/10.7554/eLife.39705.025
-
Supplementary file 3
Average relative growth rate effect of amino acid substitutions in the FolA protein of E. coli.
- https://doi.org/10.7554/eLife.39705.026
-
Supplementary file 4
DNA oligomers used to introduce amino acid substitutions along the FolA protein.
- https://doi.org/10.7554/eLife.39705.027
-
Transparent reporting form
- https://doi.org/10.7554/eLife.39705.028
Download links
A two-part list of links to download the article, or parts of the article, in various formats.
Downloads (link to download the article as PDF)
Open citations (links to open the citations from this article in various online reference manager services)
Cite this article (links to download the citations from this article in formats compatible with various reference manager tools)
Molecular function limits divergent protein evolution on planetary timescales
eLife 8:e39705.
https://doi.org/10.7554/eLife.39705


