Protein gradients on the nucleoid position the carbon-fixing organelles of cyanobacteria
- Michigan State University, United States
- University of Michigan, United States
- National Heart, Lung, and Blood Institute, National Institutes of Health, United States
Figures
Figure 1 with 1 supplement
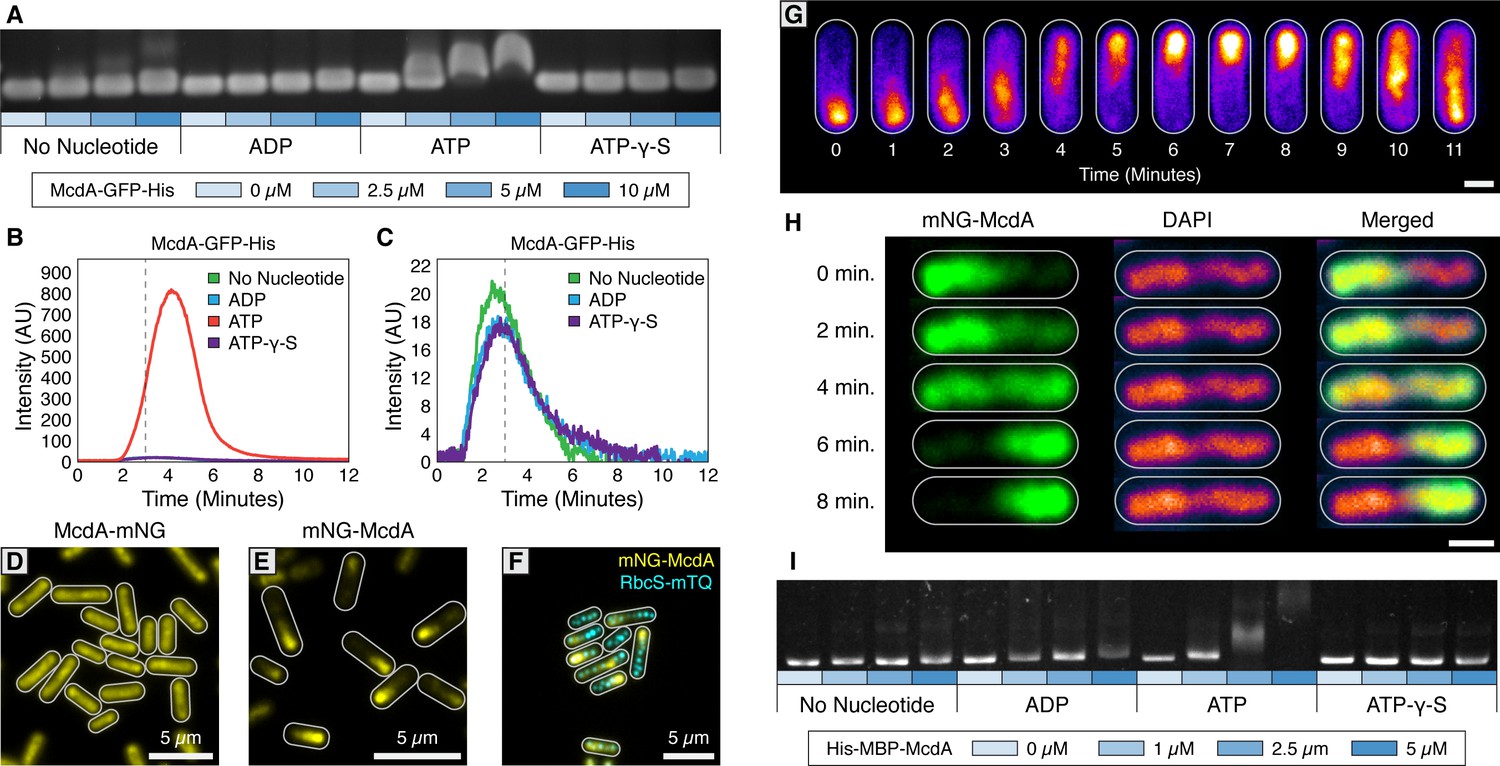
The ParA-like protein, McdA, binds nonspecifically to nucleoid DNA in the presence of ATP.
(A) Purified McdA-GFP-His slows the migration of DNA in an ATP-dependent manner in an electrophoretic mobility shift assay (EMSA). (B) In flow cell experiments containing a carpet of non-specific DNA, McdA-GFP-His is preferentially retained by binding the DNA-carpet only in the presence of ATP, and releases when switching to a wash buffer after 3 min. (C) Magnified version of Panel B to show no protein binding without ATP. See Video 1. (D) Native McdA-mNG does not oscillate, while the N-terminally tagged variant (E) native mNG-McdA displays robust oscillations in S. elongatus. (F) mNG-McdA (yellow) oscillates to position carboxysomes (RbcS-mTQ - cyan). (G) mNG-McdA waves concentrate predominantly along the central axis of the cell, and do not concentrate at the periphery near the cell membrane. Scale bar = 1 µm. (H) Oscillation of mNG-McdA colocalizes with DAPI staining of nucleoid DNA, which is also centrally localized and is excluded from peripheral thylakoid membranes. Scale bar = 1 µm. (I) Purified His-MBP-McdA slows the migration of DNA in an ATP-dependent manner in an EMSA.
Figure 1—figure supplement 1
mNG-McdA oscillates and mNG-McdB is recruited to carboxysomes.
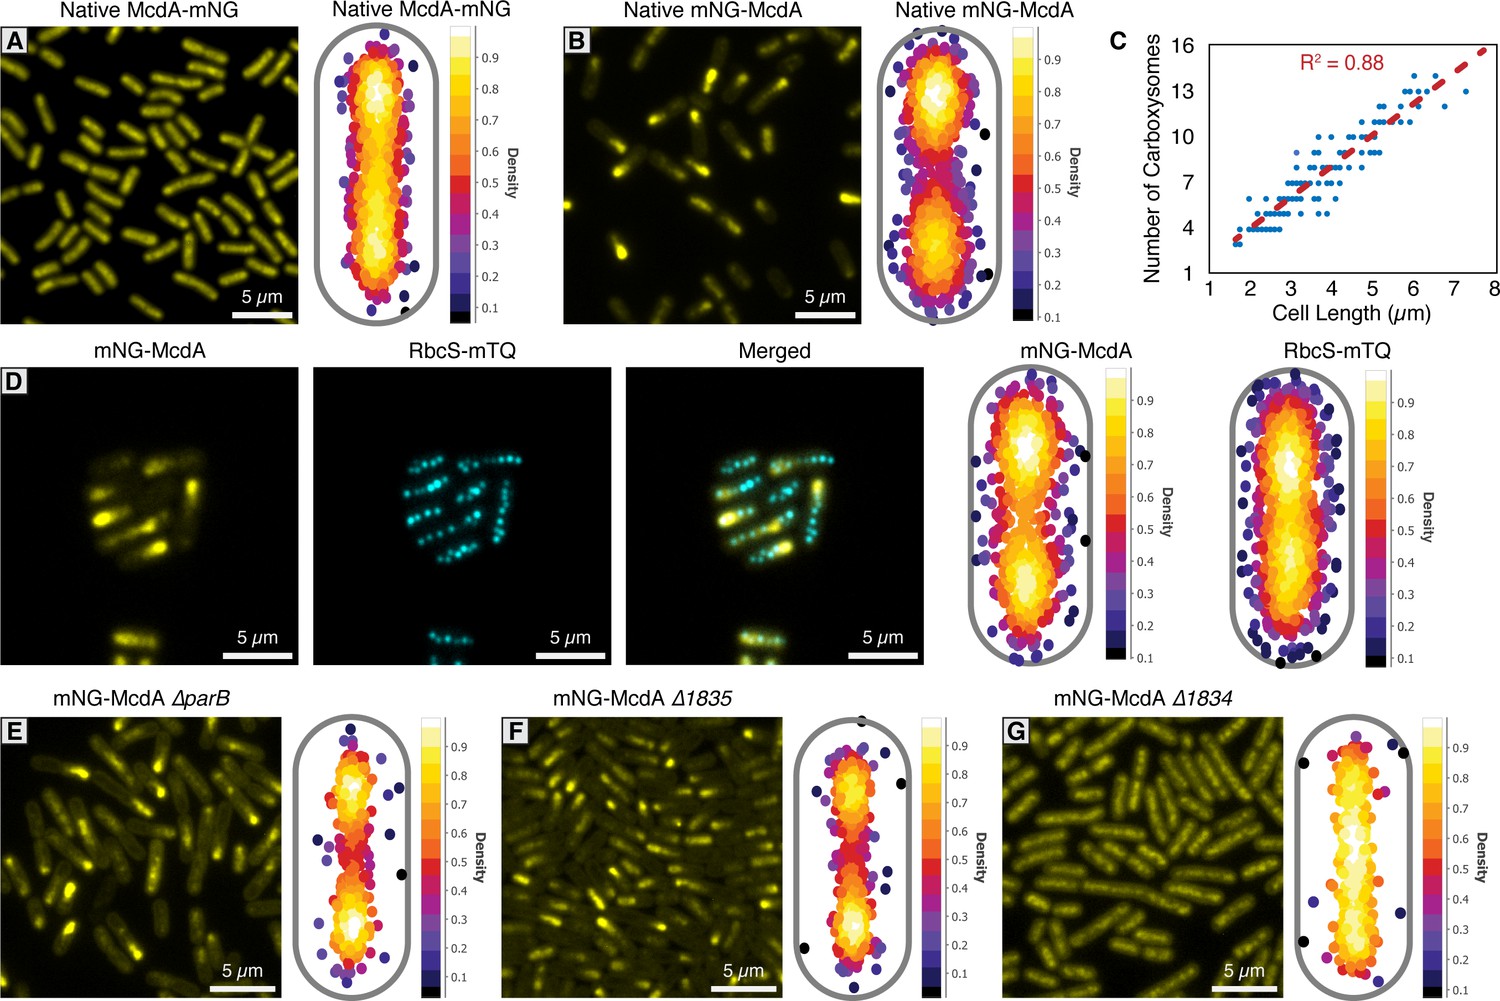
(A) Native McdA-mNG does not oscillate (left). MicrobeJ heatmap of McdA-mNG signal (n = 950 cells) (right). (B) Native mNG-McdA displays robust oscillations (left). MicrobeJ heatmap of McdA-mNG signal (n = 442 cells) (right). (C) Carboxysome quantity measured in relation to cell length. (D) Carboxysomes remained positioned in a natively-tagged mNG-McdA strain (left). MicrobeJ heatmap of mNG-McdA and RbcS-mTQ (n = 374 cells) signal (right). (E) Deletion of parB does not influence mNG-McdA oscillation (left). MicrobeJ heatmap of McdA-mNG signal (n = 554 cells) (right). (F) Deletion of Synpcc7942_1835 does not influence mNG-McdA oscillation (left). MicrobeJ heatmap of McdA-mNG signal (n = 834 cells) (right). (G) Deletion of Synpcc7942_1834 collapses mNG-McdA oscillation (left). MicrobeJ heatmap of McdA-mNG signal (n = 373 cells) (right).
-
Figure 1—figure supplement 1—source data 1
Source data for panel C.
- https://doi.org/10.7554/eLife.39723.005
Figure 2 with 1 supplement
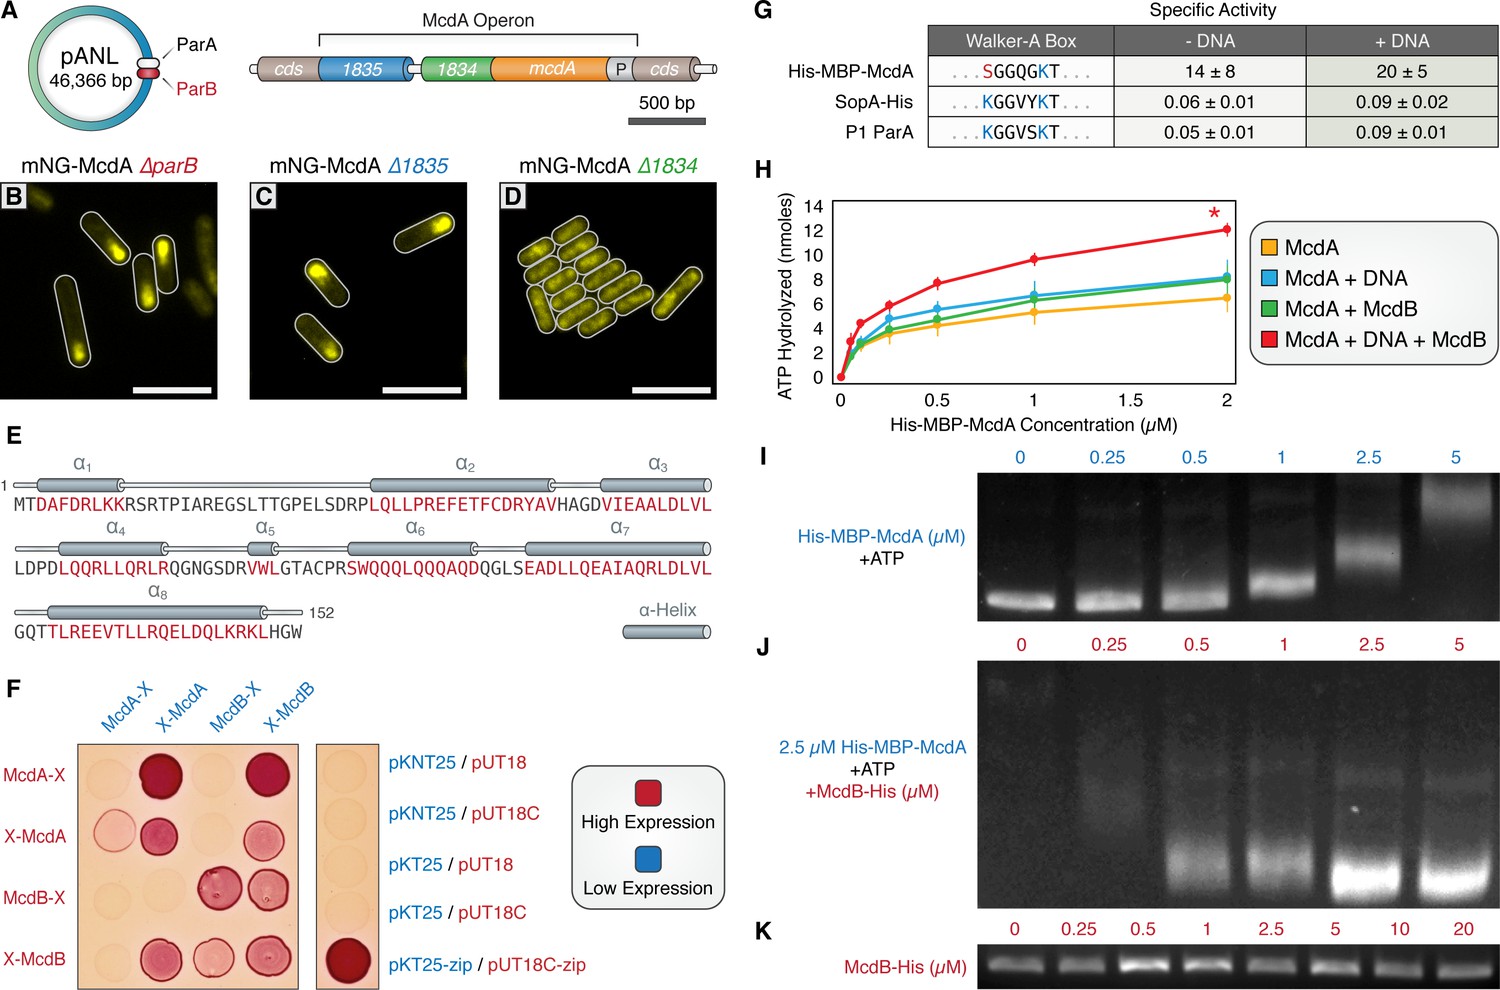
A small, carboxysome-localized protein is required for McdA oscillatory dynamics.
(A) Candidate genes controlling McdA dynamics on either the native plasmid (left) or within the genomic neighborhood of McdA. (B) Deletion of pANL parB or (C) Synpcc7942_1835 has no effect on mNG-McdA dynamics. (D) Deletion of Synpcc7942_1834 collapses mNG-McdA oscillatory dynamics. All scale bars = 5 µm. (E) Synpcc7942_1834 secondary structure prediction: residues in red are predicted to form α-helical secondary structure. (F) Bacterial two-hybrid between McdA and McdB tagged at their N-termini (X-McdA, X-McdB) or C-termini (McdA-X, McdB-X) on a MacConkey agar plate. Image representative of 3 independent trials. (G) The deviant Walker A-box motif and specific activities of McdA, F SopA-His and P1 ParA with and without DNA. (H) ATPase activity assays of His-MBP-McdA reveals stimulatory roles of DNA and McdB-His. (I) His-MBP-McdA slows the migration of DNA in an ATP-dependent manner in an EMSA. (J) Increasing concentrations of McdB-His resolves the gel shift provided by 2.5 µM of His-MBP-McdA and ATP. (K) Titration of McdB-His shows it does not directly bind nsDNA.
Figure 2—figure supplement 1
McdA Activity.
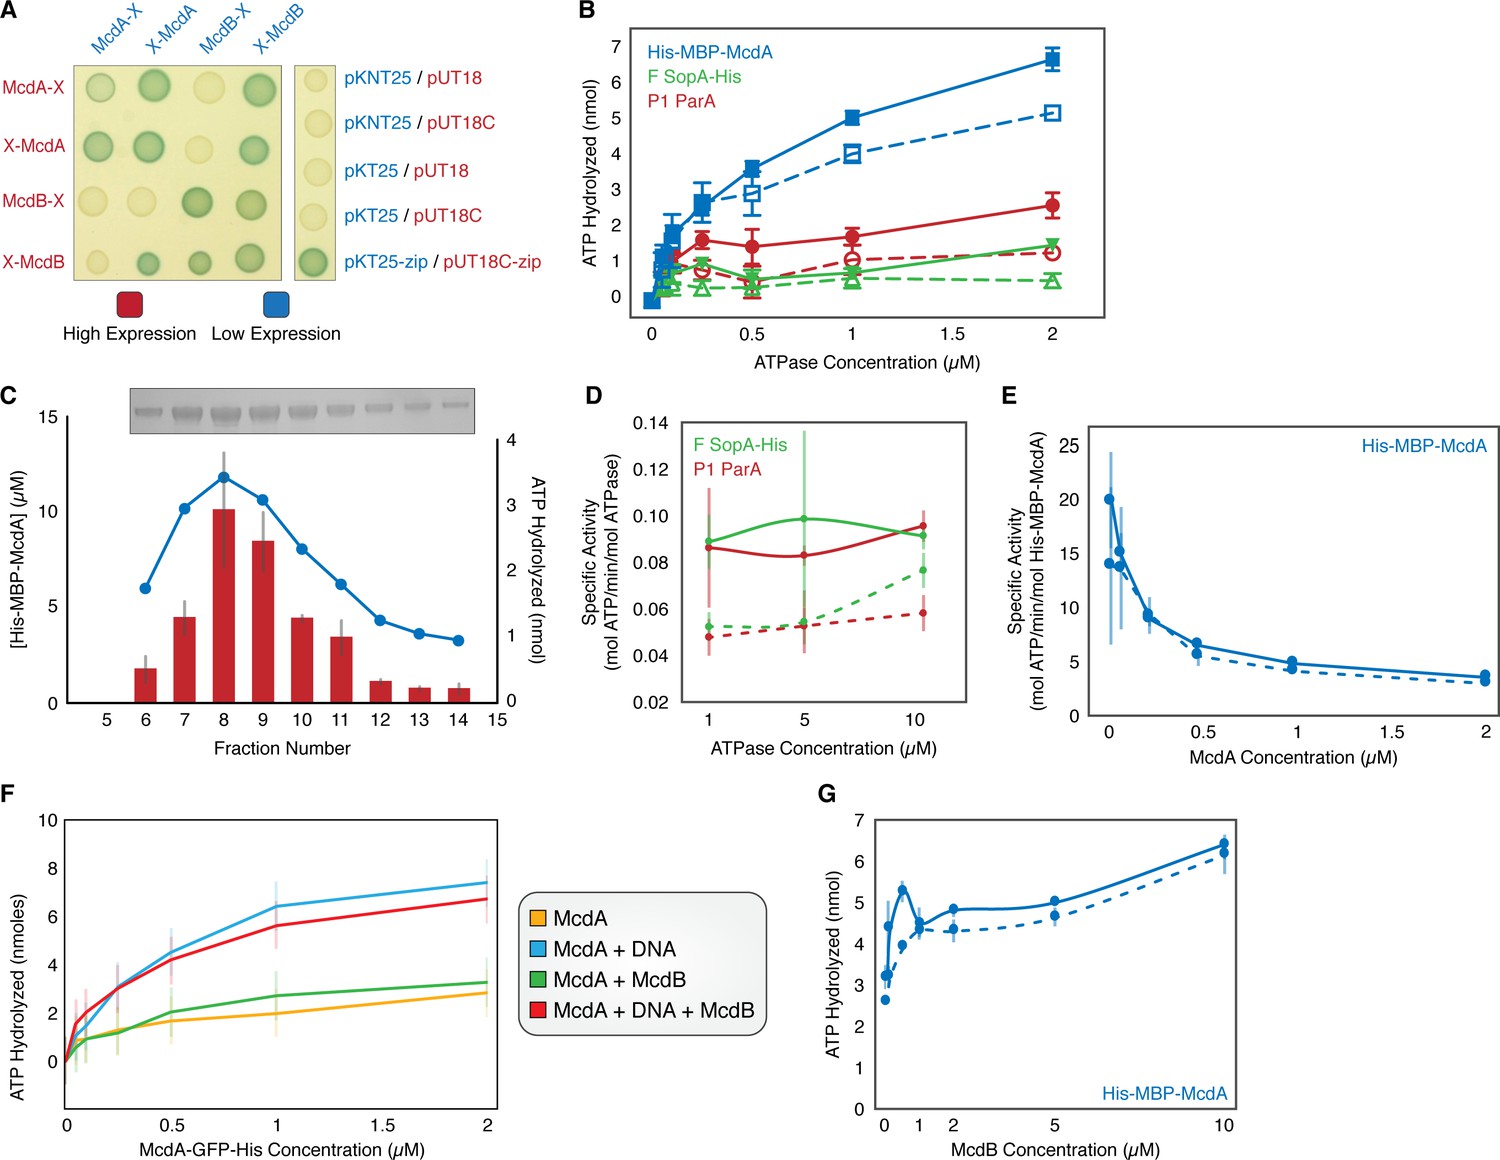
(A) Bacterial two-hybrid between McdA and McdB tagged at their N-termini (X-McdA, X-McdB) or C-termini (McdA-X, McdB-X) on X-gal supplemented plate. (B) Comparison of the ATPase activities of His-MBP-McdA, F SopA-His, and P1 ParA in the presence (solid line, filled symbols) and absence (dashed line, open symbols) of nsDNA. (C) Coelution of ATPase activity with His-MBP-McdA concentration. Purified His-MBP-McdA was further purified over a Superdex 200 column. Protein concentration (bar) and ATPase activity (line) were measured for each fraction indicated. Inset shows an SDS-PAGE gel of the purified fractions. (D) Comparison of ATPase-specific activity of P1 ParA and F SopA-His in the presence (solid line) and absence (dashed line) of nsDNA. (E) Concentration dependency on the specific activity of His-MBP-McdA in the presence (solid line) and absence (dashed line) of nsDNA. (F) ATPase activity assays of McdA-GFP-His with/without DNA and/or McdB-His. (G) Comparison of the ATPase activity of His-MBP-McdA in the presence of increasing McdB concentration with (solid line) or without (dashed line) nsDNA present. Error bars represent SD from at least three independent experiments.
-
Figure 2—figure supplement 1—source data 1
Source data for panel B.
- https://doi.org/10.7554/eLife.39723.011
-
Figure 2—figure supplement 1—source data 2
Source data for panel D.
- https://doi.org/10.7554/eLife.39723.012
-
Figure 2—figure supplement 1—source data 3
Source data for panel F.
- https://doi.org/10.7554/eLife.39723.013
-
Figure 2—figure supplement 1—source data 4
Source data for panel G.
- https://doi.org/10.7554/eLife.39723.014
Figure 3 with 1 supplement
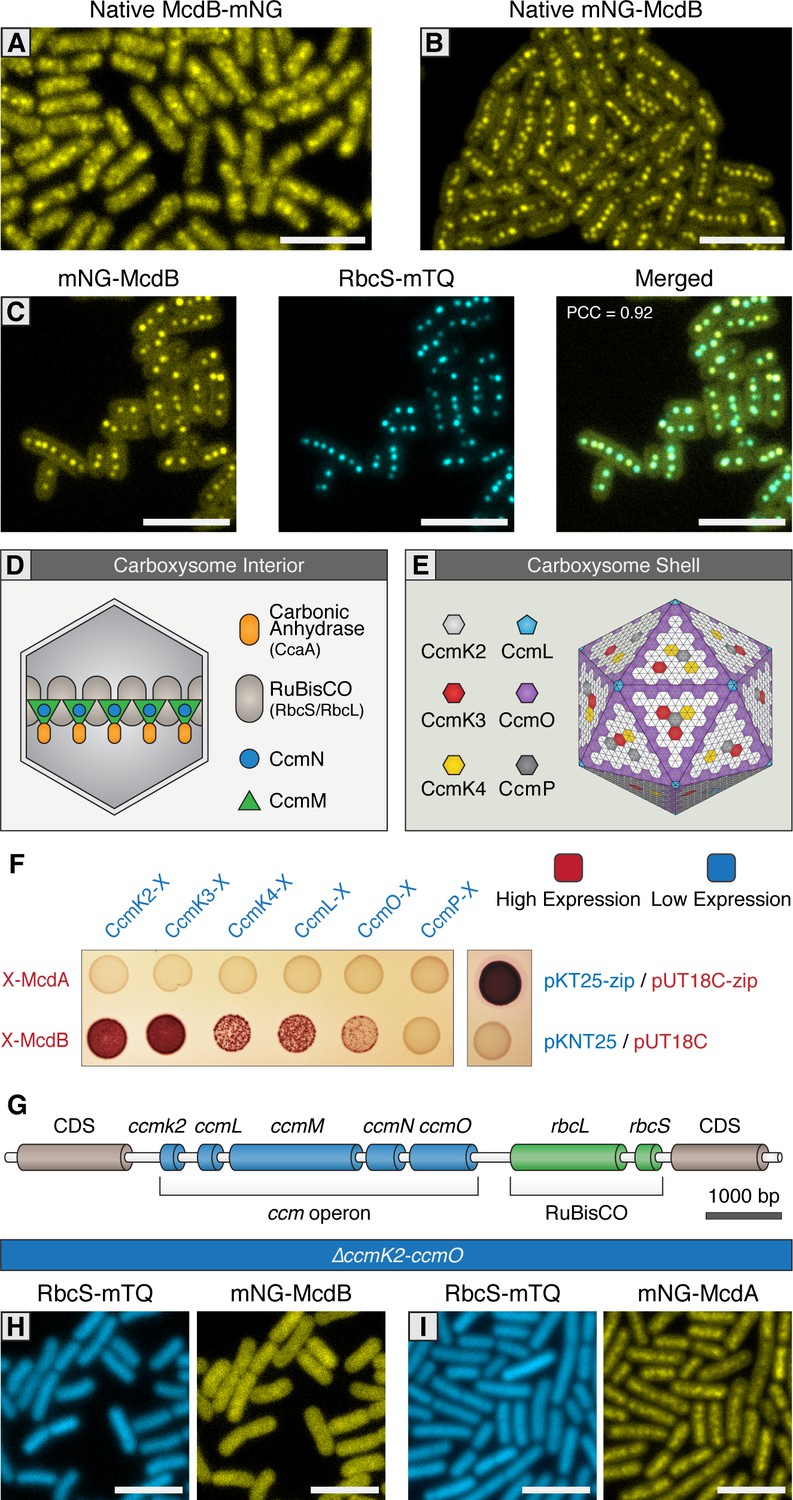
McdB interacts with the carboxysome shell.
(A) Native McdB-mNG forms diffuse and punctate-like structures, while (B) native mNG-McdB localizes to centralized foci in S. elongatus cells. (C) mNG-McdB and a carboxysome reporter - RbcS-mTQ - colocalize. Pearson correlation coefficient (PCC) is 0.92. (D) Cartoon depiction of the internal and (E) external shell components of the cyanobacterial carboxysome, adapted from models presented in Rae et al., 2013. Note that the relative geometric arrangement of some shell components to one another remain somewhat speculative. (F) Bacterial two-hybrid of McdA and McdB against carboxysome shell proteins. Image representative of 3 independent trials. (G) Cartoon schematic of the S. elongatus carboxysome operon. (H) In a ΔccmK2-O mutant without carboxysomes, mNG-McdB is not localized to central puncta but is diffuse, while (I) mNG-McdA oscillatory dynamics are lost. All scale bars = 5 µm.
Figure 3—figure supplement 1
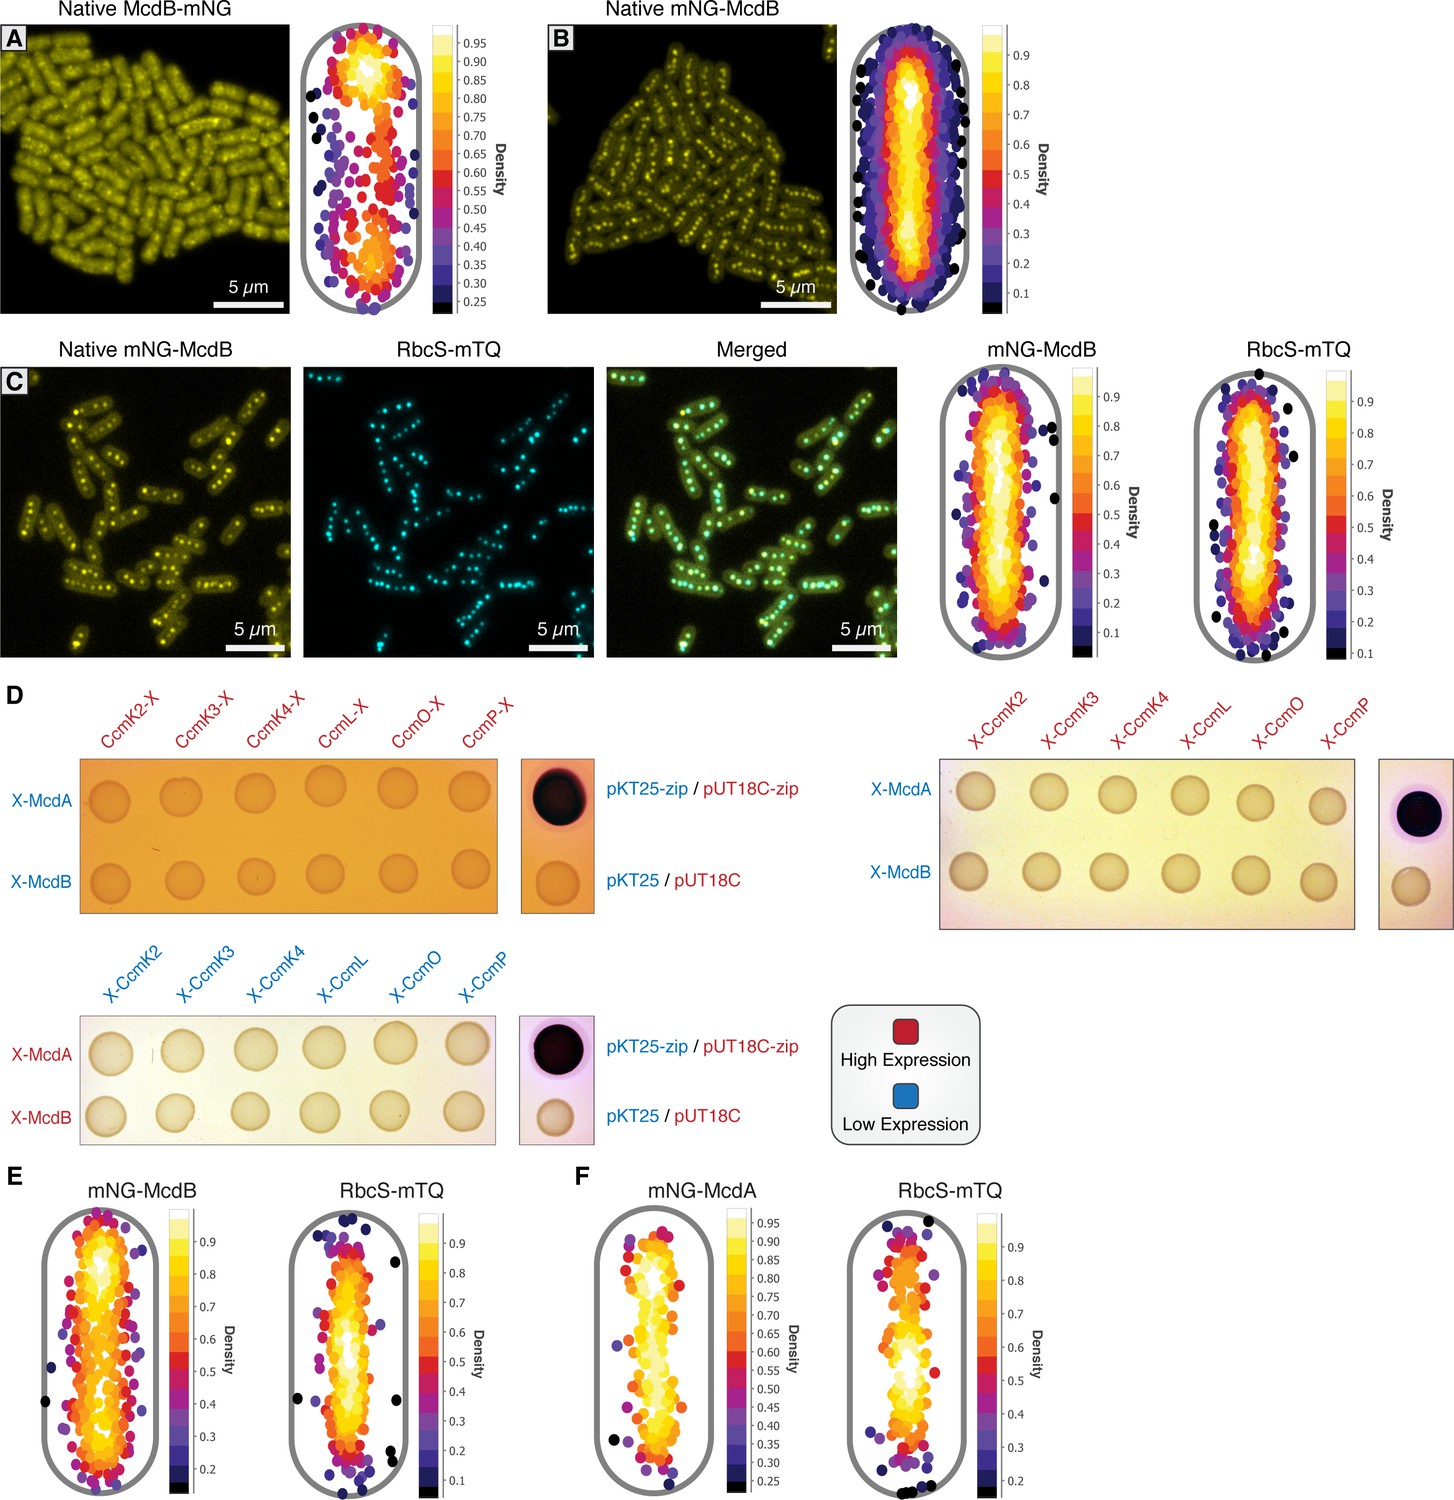
McdA/B bacterial two-hybrid against carboxysome shell proteins.
(A) Native McdB-mNG forms diffuse and punctate-like structures throughout cells (left). MicrobeJ heatmap of McdA-mNG signal (n = 371 cells) (right). (B) Native mNG-McdB forms central foci structures (left). MicrobeJ heatmap of McdA-mNG signal (n = 699 cells) (right). (C) mNG-McdB and RbcS-mTQ colocalize (left). MicrobeJ heatmap of mNG-McdB and RbcS-mTQ (n = 316 cells) signal (right). (D) Bacterial two-hybrid between McdA and McdB tagged at their N-termini (low expression) against carboxysome shell proteins tagged at their C-termini (high expression) (top left). Bacterial two-hybrid between McdA and McdB tagged at their N-termini (low expression) against carboxysome shell proteins tagged at their N-termini (high expression) (top right). Bacterial two-hybrid between McdA and McdB tagged at their N-termini (high expression) against carboxysome shell proteins tagged at their N-termini (low expression) (bottom left). (E) MicrobeJ heatmap of mNG-McdB and RbcS-mTQ (n = 389 cells) signal in the absence of ccmK2-O. (F) MicrobeJ heatmap of mNG-McdA and RbcS-mTQ (n = 227 cells) signal in the absence of ccmK2-O.
Figure 4
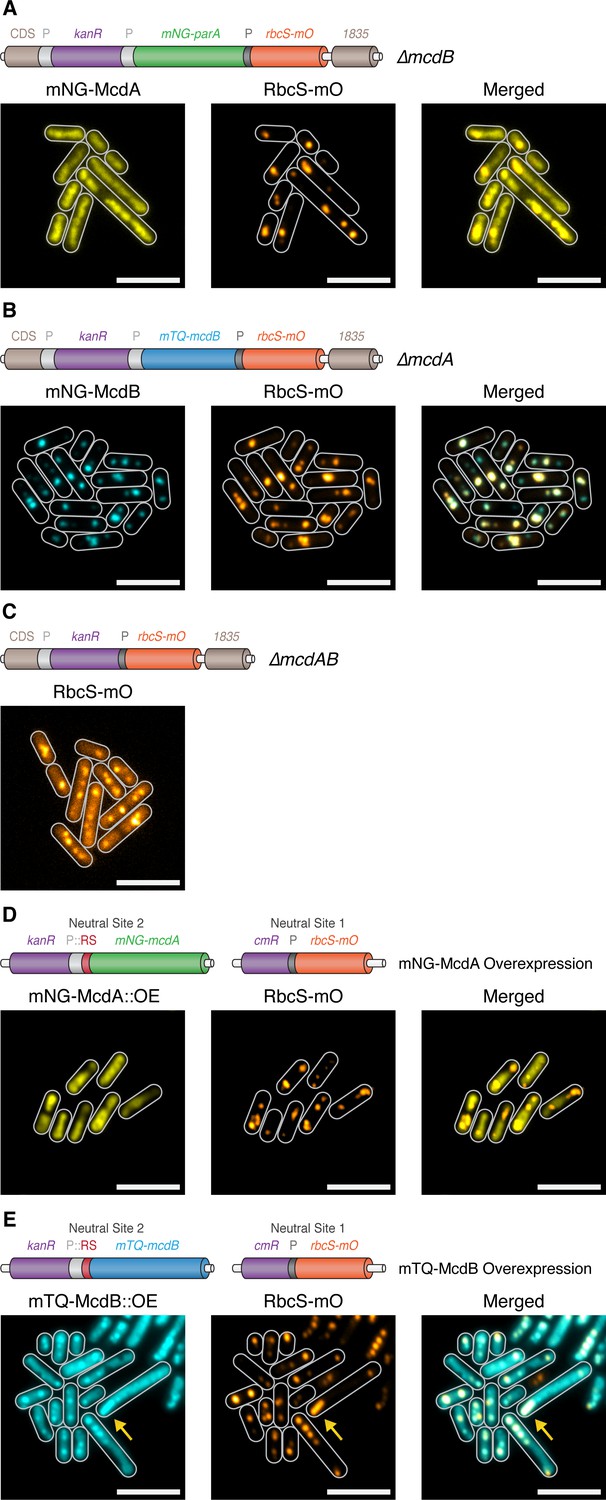
McdA and McdB are essential for distributing carboxysomes.
(A) Carboxysome (orange; rbcS-mO) and mNG-McdA (yellow) distribution in a ΔmcdB background. Cartoon schematics (top) of the genetic construct are depicted, mcdA promoter ‘P’=light grey, rbcS promoter = dark grey. mNG-McdA signal did not oscillate and was found distributed on the nucleoid (B) Carboxysome and mTQ-McdB (cyan) distribution in a ΔmcdA background. mTQ-McdB colocalizes to S. elongatus carboxysomes (RbcS-mO) (PCC = 0.85). (C) Carboxysome distribution with mcdAB deleted. (D) Carboxysome positioning is disrupted and oscillation of mNG-McdA does not occur upon mNG-McdA overexpression. mNG-McdA signal did not oscillate and was found distributed on the nucleoid. Some carboxysomes had mNG-McdA signal depleted in their vicinity. Riboswitch (RS) = red. (E) Bar carboxysome structures (yellow arrow) and loss of carboxysome positioning are observed upon overexpression of mTQ-mcdB. mTQ-McdB signal colocalized with RbcS-mO signal (PCC = 0.80). All scale bars = 5 µm.
Figure 5 with 1 supplement
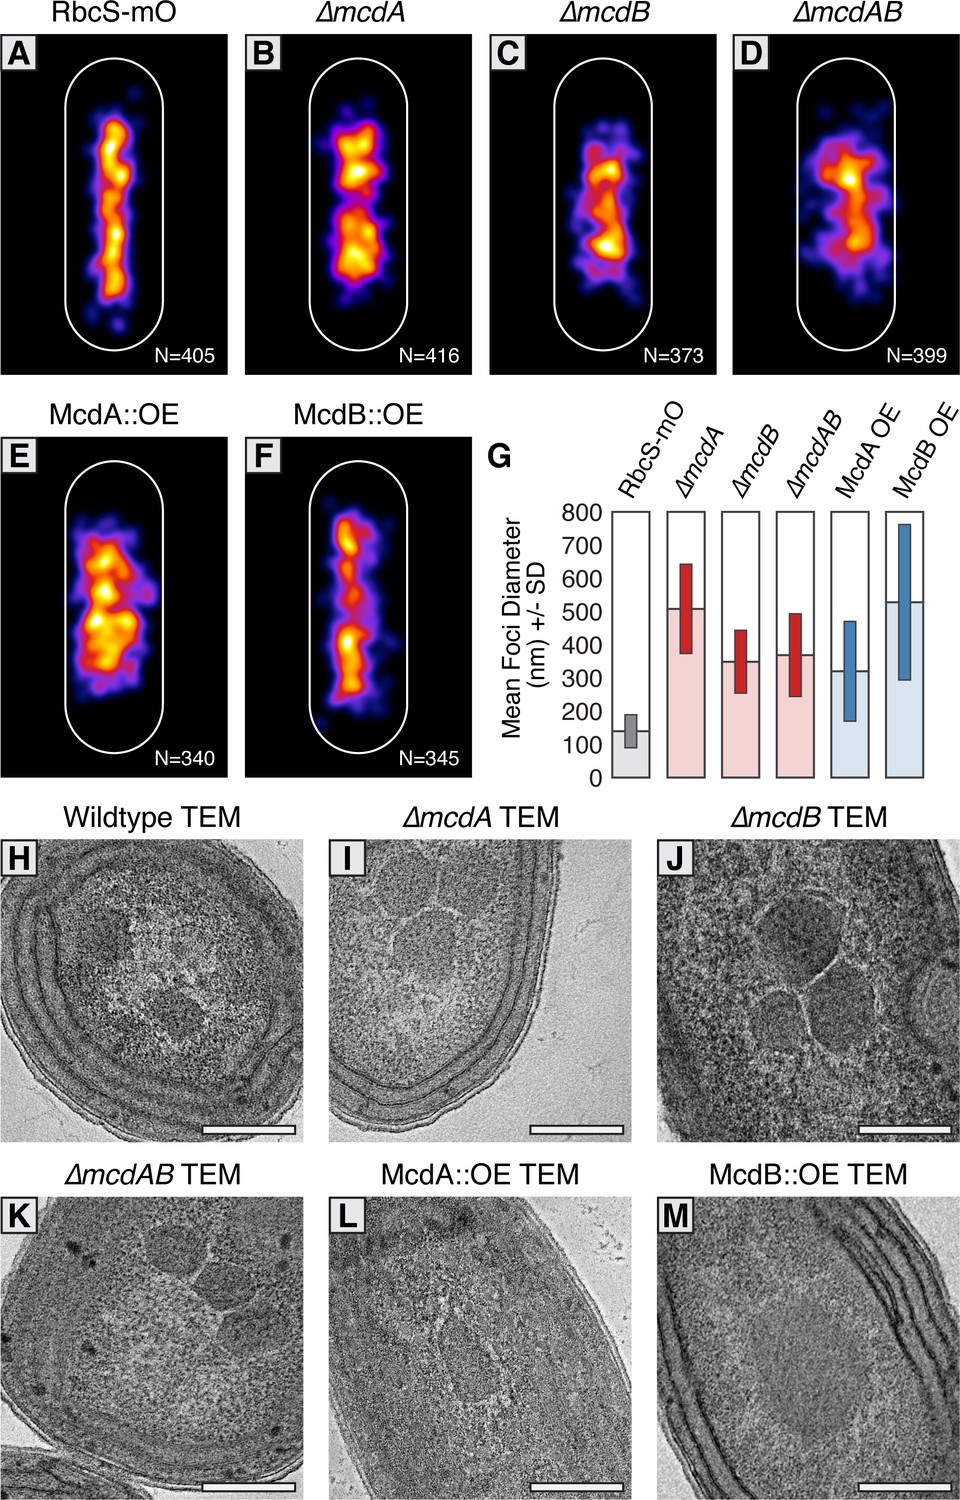
McdAB physically separate and regulate carboxysome ultrastructure.
(A–F) MicrobeJ average distribution heat-map of carboxysomes in the indicated genetic background strains. Quantity of cells measured in lower right corner. (G) Mean RbcS-mO foci area and standard deviation for wildtype and the indicated mutant strains. (H–M) Electron micrographs of carboxysomes from wildtype and mutant strains. All scale bars = 250 nm.
Figure 5—figure supplement 1
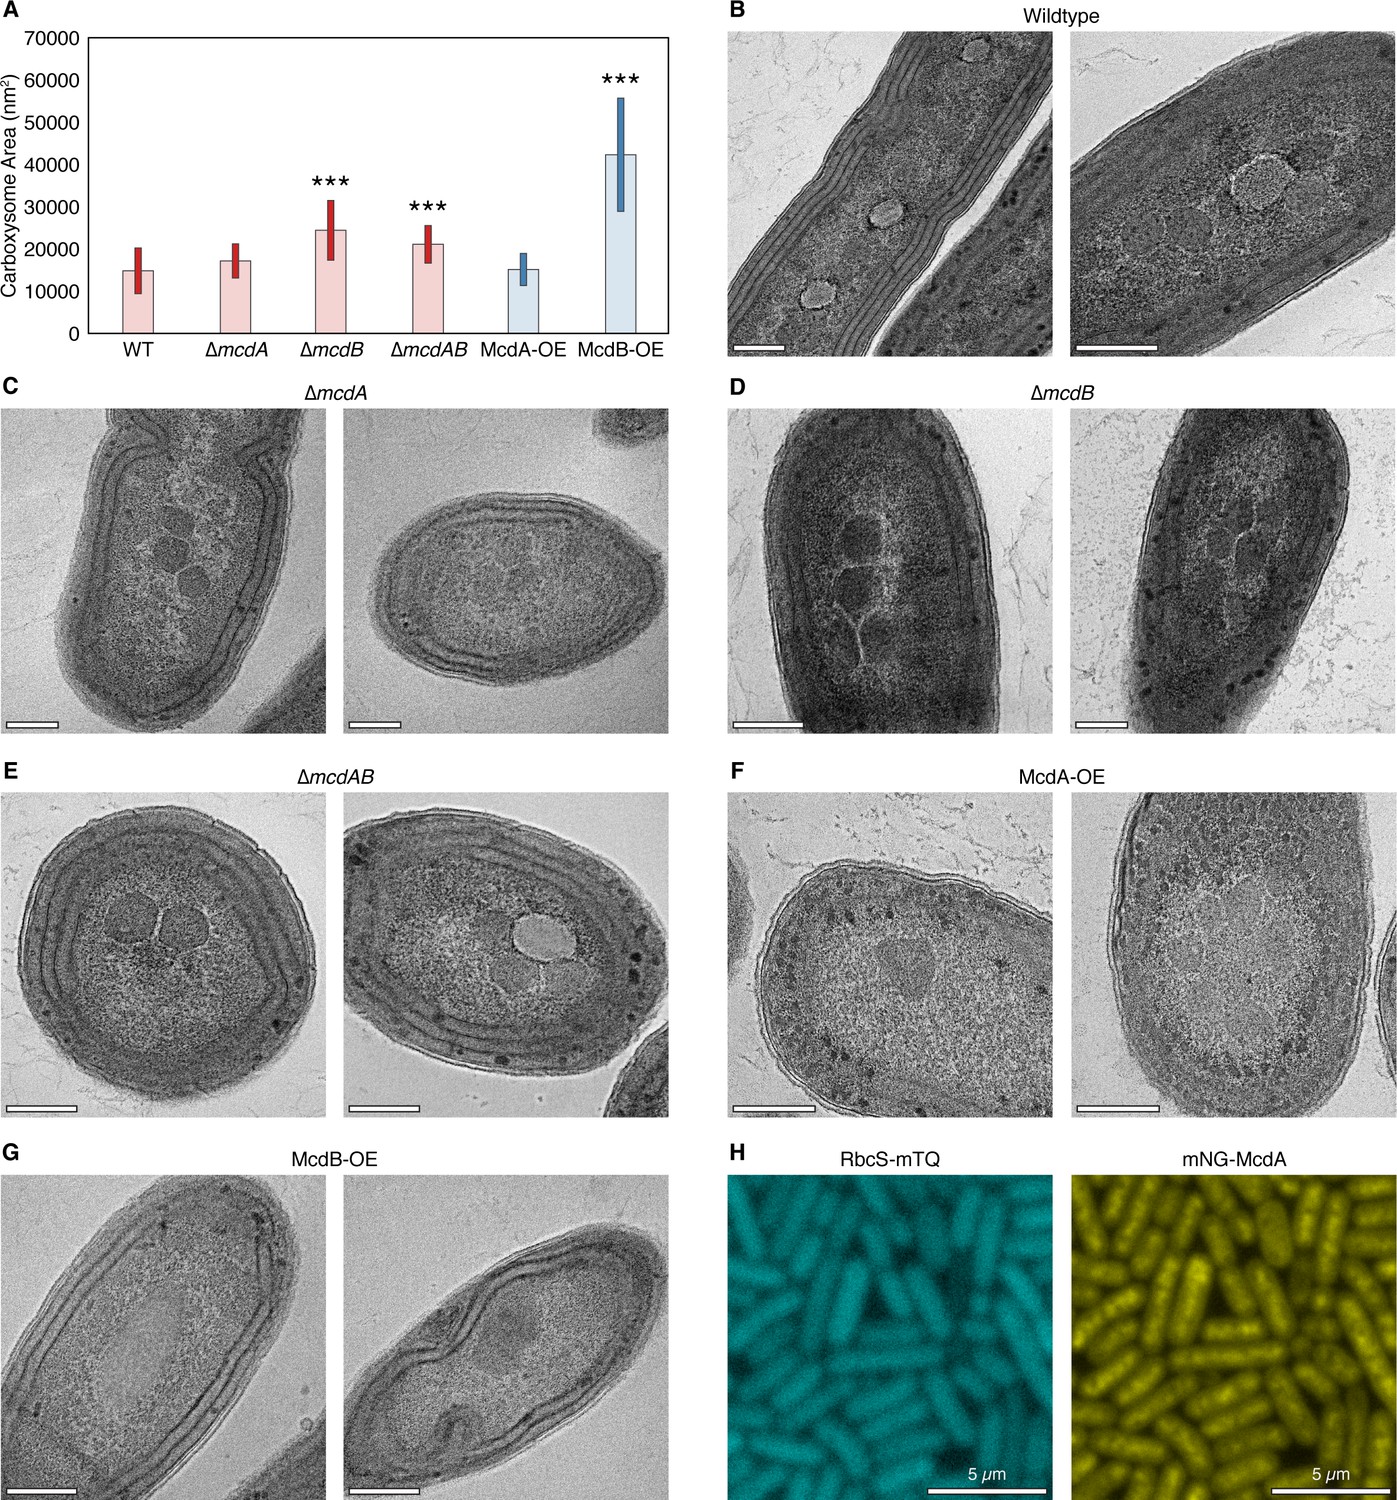
Quantification of carboxysome size from TEM.
(A) Mean carboxysome area and standard deviation for wildtype and mutant strains. p<0.0001 denoted as (***). N = at least 16 carboxysomes measured. Additional representative TEM images for (B) wildtype (C) ∆mcdA (D) ∆mcdB (E) ∆mcdAB (F) McdA overexpression and (G) McdB overexpression. All scale bars = 250 nm. (H) RbcS-mTQ signal is diffuse and mNG-McdA does not display oscillatory dynamics in the absence of the theophylline inducer.
Figure 6
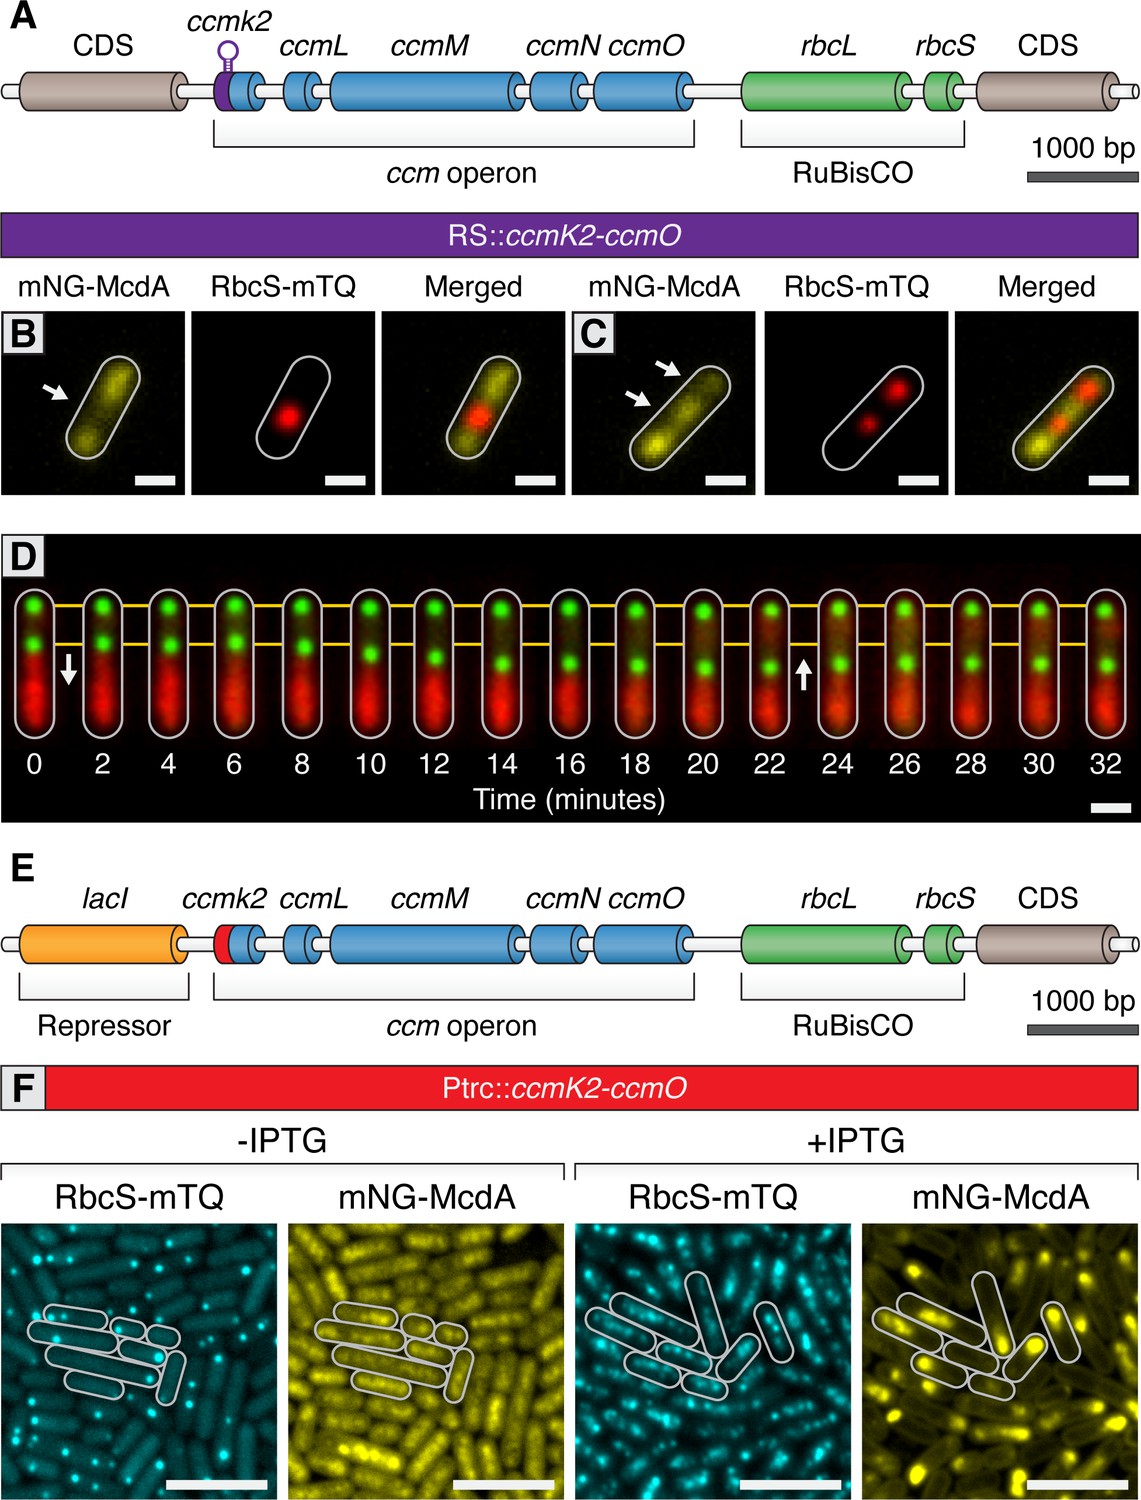
Carboxysomes locally deplete McdA from the nucleoid and cause McdA oscillation at high-copy number.
(A) Cartoon schematic of the inducible carboxysome operon with the synthetic, theophylline-inducible riboswitch proceeding ccmK2. Induction of carboxysome biogenesis with either (B) 400 µM or (C) 600 µM theophylline leads to the formation of one or two carboxysomes (red; RbcS-mTurq). mNG-McdA (yellow) is depleted from the vicinity of nearby carboxysomes (white arrows). Scale bar = 1 µm. (D) In a representative timelapse imaging of a newly formed carboxysome (green), the central carboxysome moves towards (white arrow) a cellular location with increased mNG-McdA (red). When sufficient distance is obtained between carboxysomes (~20 min) mNG-McdA begins to be recruited between them. Scale bar = 1 µm. (E) Cartoon schematic of carboxysome operon with Ptrc promoter and lacI proceeding ccmK2. (F) mNG-McdA oscillations are reconstituted following addition of IPTG and the assembly of multiple carboxysomes. Scale bar = 5 µm.
Figure 7 with 1 supplement
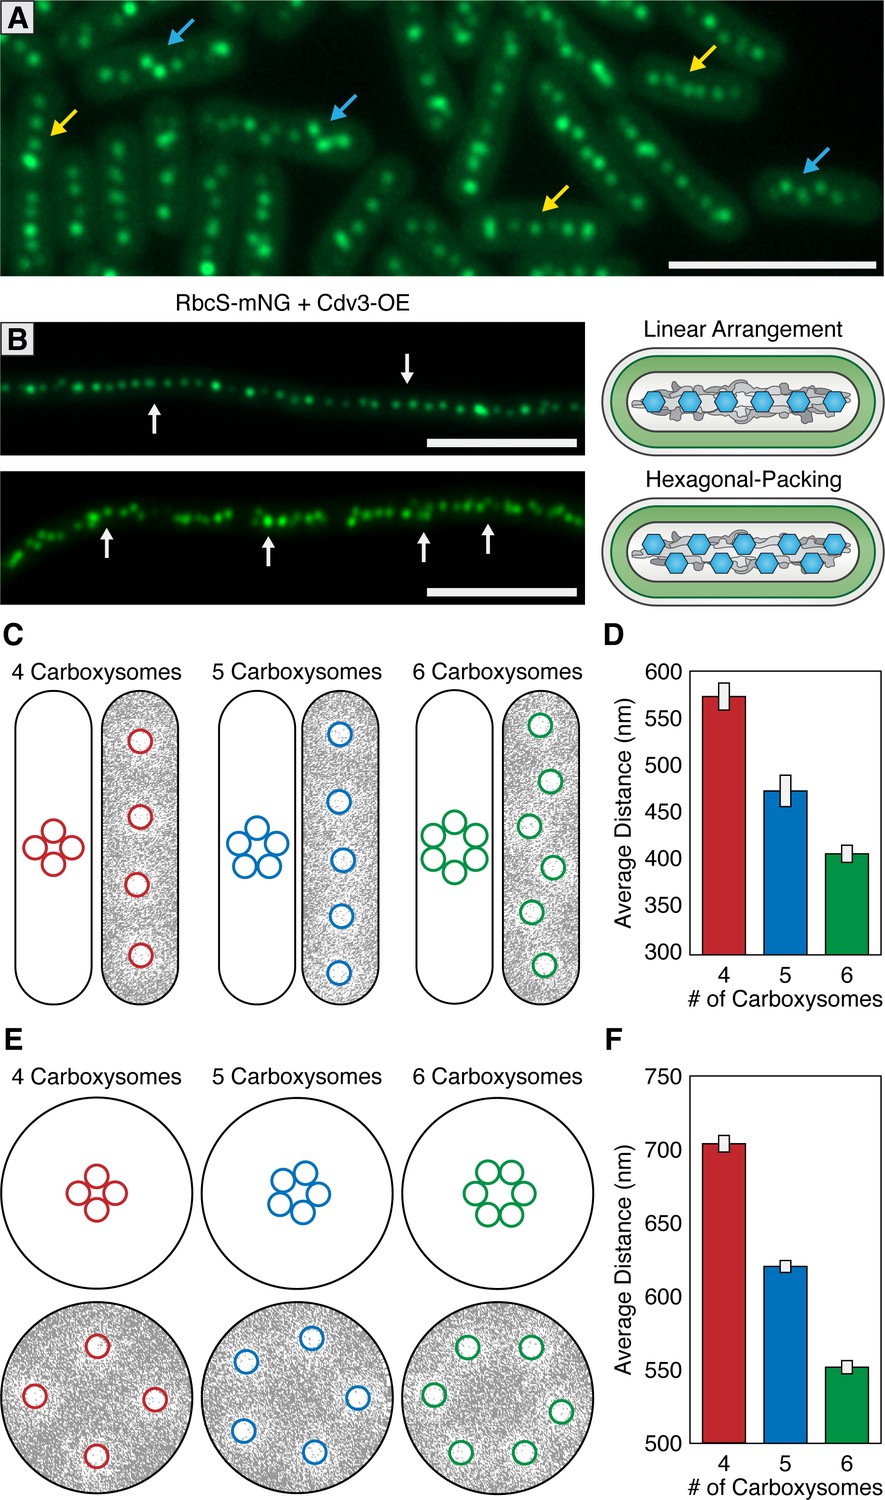
McdAB accounts for linear and hexagonal packing of carboxysomes.
(A) In a field of S. elongatus cells, carboxysomes are found in either a linear (yellow arrow) or hexagonal (blue arrow) arrangement. Scale bar = 5 µm. (B) Linear or hexagonal arrangement of carboxysomes in filamentous cells (white arrows). Scale bar = 5 µm. (C) Reaction-diffusion simulations of 4, 5, or six carboxysomes on a rounded-rectangle surface. Positions of carboxysomes in representative simulations indicated at the start of the simulation (left) and after the simulation has reached steady state (right). Grey = McdA. White = Nucleoid. (D) Average distance between carboxysomes. (E) Reaction-diffusion simulations of 4, 5, or six carboxysomes upon a round surface. Grey = McdA. White = Nucleoid. (F) Average distance between carboxysomes. Error bars = standard deviation.
Figure 7—figure supplement 1
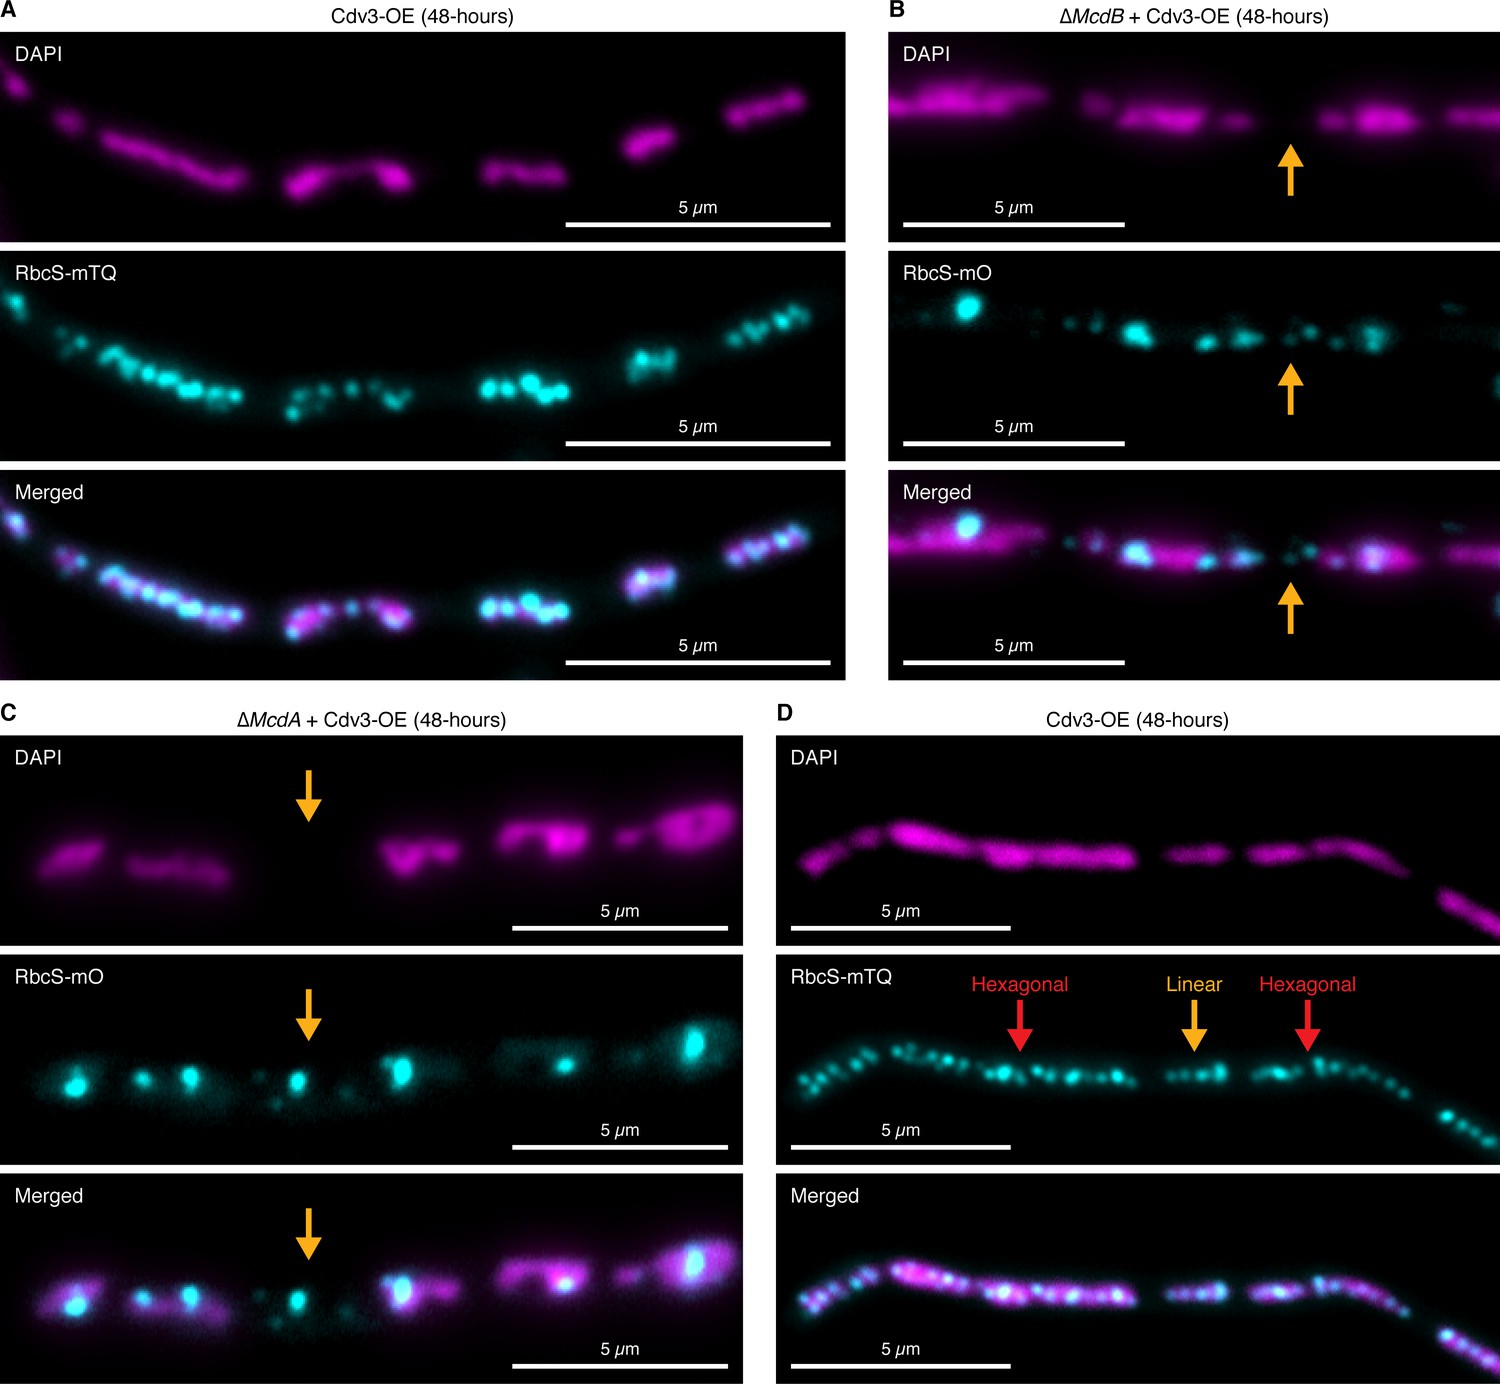
Carboxysomes fall between nucleoids in elongated cells lacking McdA or McdB.
(A) Carboxysomes are confined to nucleoid ‘islands’. (B) Carboxysomes are routinely localized away from nucleoids (orange arrow) in the absence of McdB. (C) Carboxysomes are routinely localized away from nucleoids (orange arrow) in the absence of McdA. (D) Carboxysomes can display hexagonal-packing (red arrows) or linear arrangements (orange arrow) from nucleoid-to-nucleoid.
Figure 8
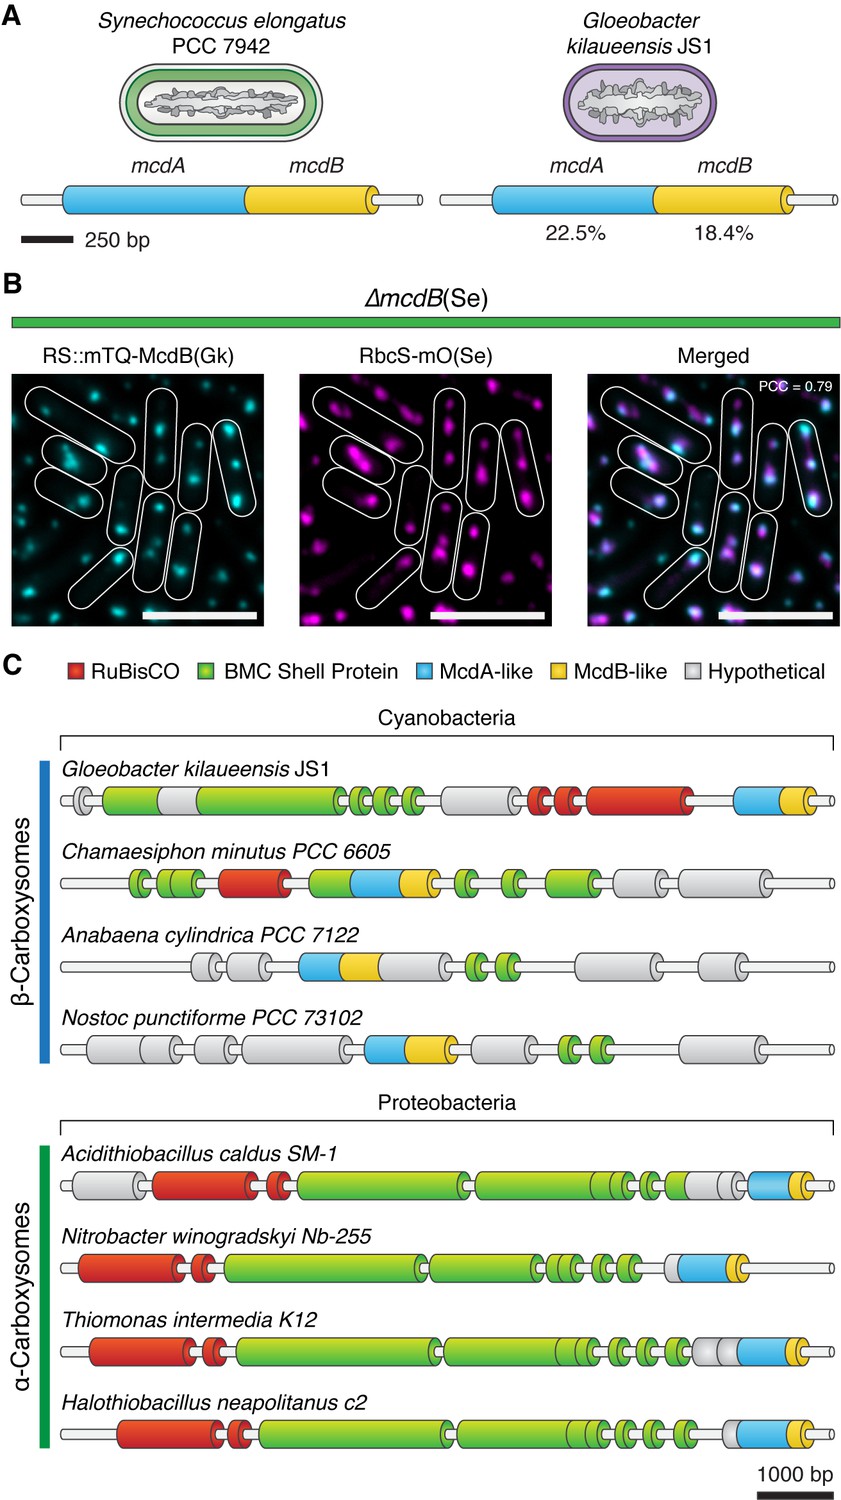
Evolutionary conservation of McdAB.
(A) Cartoon illustration of McdAB operon structures in S. elongatus and Gloeobacter kilaueensis JS1. (B) Gloeobacter kilaueensis JS1 McdB colocalizes with S. elongatus carboxysomes (RbcS-mO). Scale bar = 5 µm. (C) McdA/B-like sequences colocalize in the genome with predicted carboxysome components across diverse microbes.
Author response image 1
Author response image 2
Videos
Video 1
McdA binds DNA only in the presence of ATP.
After 3 min, a wash buffer is flowed in.
Video 2
Oscillation of mNG-McdA is observed across a population of cells.
https://doi.org/10.7554/eLife.39723.007
Video 3
Oscillation of mNG-McdA (magenta) occurs while carboxysomes (blue) are fluorescently labeled.
https://doi.org/10.7554/eLife.39723.008
Video 4
Carboxysomes (blue; RbsS-mTQ) move towards increased concentrations of mNG-McdA (magenta); notable examples of this phenomenon are denoted by white arrows. Each frame is 30 seconds.
https://doi.org/10.7554/eLife.39723.021
Video 5
Zoomed-in single cell representation of carboxysomes (blue; RbsS-mTQ) moving towards increased concentrations of mNG-McdA (red). Each frame is 15 seconds.
https://doi.org/10.7554/eLife.39723.022Tables
Table 1
Cyanobacterial strains used in this study.
https://doi.org/10.7554/eLife.39723.026| Strain Name | Description/Genotype |
|---|---|
| JSM-201 | mNG-McdA |
| JSM-202 | McdA-mNG |
| JSM-203 | mNG-McdB |
| JSM-204 | McdB-mNG |
| JSM-205 | RbcS-mO |
| JSM-206 | mNG-McdA + RbcS-mTQ |
| JSM-207 | mNG-McdB + RbcS-mTQ |
| JSM-208 | mNG-McdA∆parB |
| JSM-209 | mNG-McdA∆ Synpcc7942_1834 |
| JSM-210 | mNG-McdA∆ Synpcc7942_1835 |
| JSM-211 | mNG-McdA + ∆mcdB + RbcS-mO |
| JSM-212 | ∆mcdA + mTQ McdB+RbcS-mO |
| JSM-213 | ∆mcdA + ∆mcdB + RbcS-mO |
| JSM-214 | mNG-McdA + ∆mcdB + RbcS mO+RS::mTQ-McdB |
| JSM-215 | ∆mcdA + mTQ McdB+RbcS mO+RS::mNG-McdA |
| JSM-216 | mNG-McdA + RbcS mTQ + ∆ccmK2-ccmO |
| JSM-217 | mNG-McdB + RbcS mTQ + ∆ccmK2-ccmO |
| JSM-218 | mNG-McdA + RbcS mTQ+RS:: CcmK2 |
| JSM-219 | mNG-McdA + RbcS mTQ+Ptrc::CcmK2 |
| JSM-220 | RbcS-mTQ + RS::Cdv3 |
| JSM-221 | mNG-McdA + ∆mcdB + RbcS mO+RS::Cdv3 |
| JSM-222 | ∆mcdA + mTQ McdB+RbcS mO+RS::Cdv3 |
| JSM-223 | mNG-McdA + ∆mcdB + RbcS mO+RS::mTQ-McdB(Gk) |
Additional files
-
Transparent reporting form
- https://doi.org/10.7554/eLife.39723.027
Download links
A two-part list of links to download the article, or parts of the article, in various formats.
Downloads (link to download the article as PDF)
Open citations (links to open the citations from this article in various online reference manager services)
Cite this article (links to download the citations from this article in formats compatible with various reference manager tools)
Protein gradients on the nucleoid position the carbon-fixing organelles of cyanobacteria
eLife 7:e39723.
https://doi.org/10.7554/eLife.39723


