Cholinergic modulation of hippocampal calcium activity across the sleep-wake cycle
- Massachusetts General Hospital, United States
Figures
Figure 1 with 1 supplement
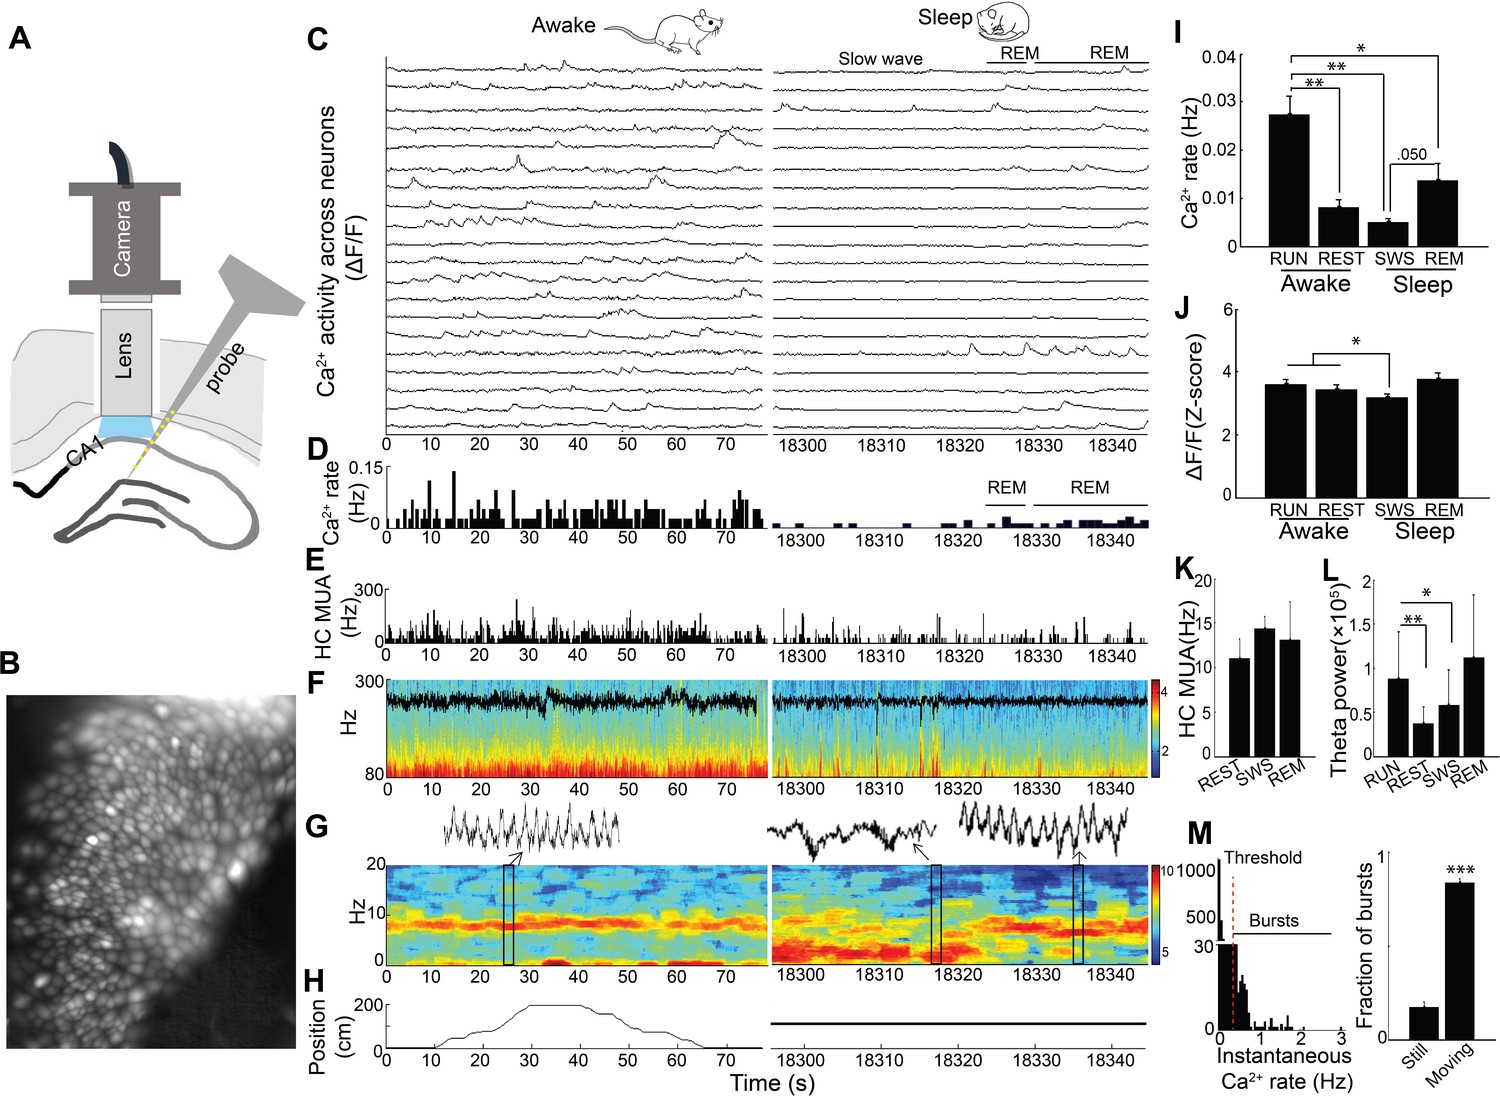
Simultaneous dynamic calcium imaging and local field potential (LFP) recording in hippocampus across behavioral states.
(A) Schematic. (B) Identified CA1 neurons for calcium imaging in a single freely behaving mouse. (C) Calcium activity of imaged neurons (20/130 neurons of one mouse are shown) across Awake (Left) and Sleep (Right) states. (D) Histogram of Ca2+ transient events of all 130 imaged cells (bin size, 500 ms). (E) Histogram of multi-unit activity (bin size, 50 ms). (F) 80–300 Hz spectrograms of LFP recorded in s. pyramidale during running behavior (Left) and sleep (Right), with LFP superimposed. (G) 0–20 Hz spectrograms of LFP recorded in s. radiatum during running behavior (Left) and sleep (Right). Insets: theta in s. radiatum during run behavior (Left, 2 s), two SWRs in s. pyramidale during slow wave sleep (Right, 2 s), theta in s. radiatum during REM sleep (Right, 2 s). (H) The animal’s position on the linear track (Left) and during the post-behavioral session (Right) as a function of time. (I) Calcium event rates within neurons were higher during run behavior and REM sleep than during quiet wakefulness (Rest) and slow wave sleep (SWS; n = 5 mice with 88, 119, 130, 134, 171 neurons). (J) Calcium event amplitudes within neurons were lower in SWS than in run behavior or rest. (K) Hippocampal multiunit activity (MUA) across behavioral states. A microscope-associated electrical noise artifact on the track prevented contrasts of multi-unit activity in run with other behavioral states. (L) Theta power is higher in run behavior than quiet wakefulness and SWS (n = 5 mice). As REM was identified on the basis of theta, REM was excluded from statistical contrasts. (M) Bursts of Ca2+ events (>0.5 Hz of instantaneous calcium rates) evident in inter-event interval histograms were more prevalent with movement (>0.5 cm/s; n = 6 mice). Statistical comparisons in I–L) were performed using one-way repeated measures ANOVA with post hoc tests. That of M) was performed with a paired t-test. *p<0.05, **p<0.01 and ***p<0.001.
-
Figure 1—source data 1
- https://doi.org/10.7554/eLife.39777.004
Figure 1—figure supplement 1
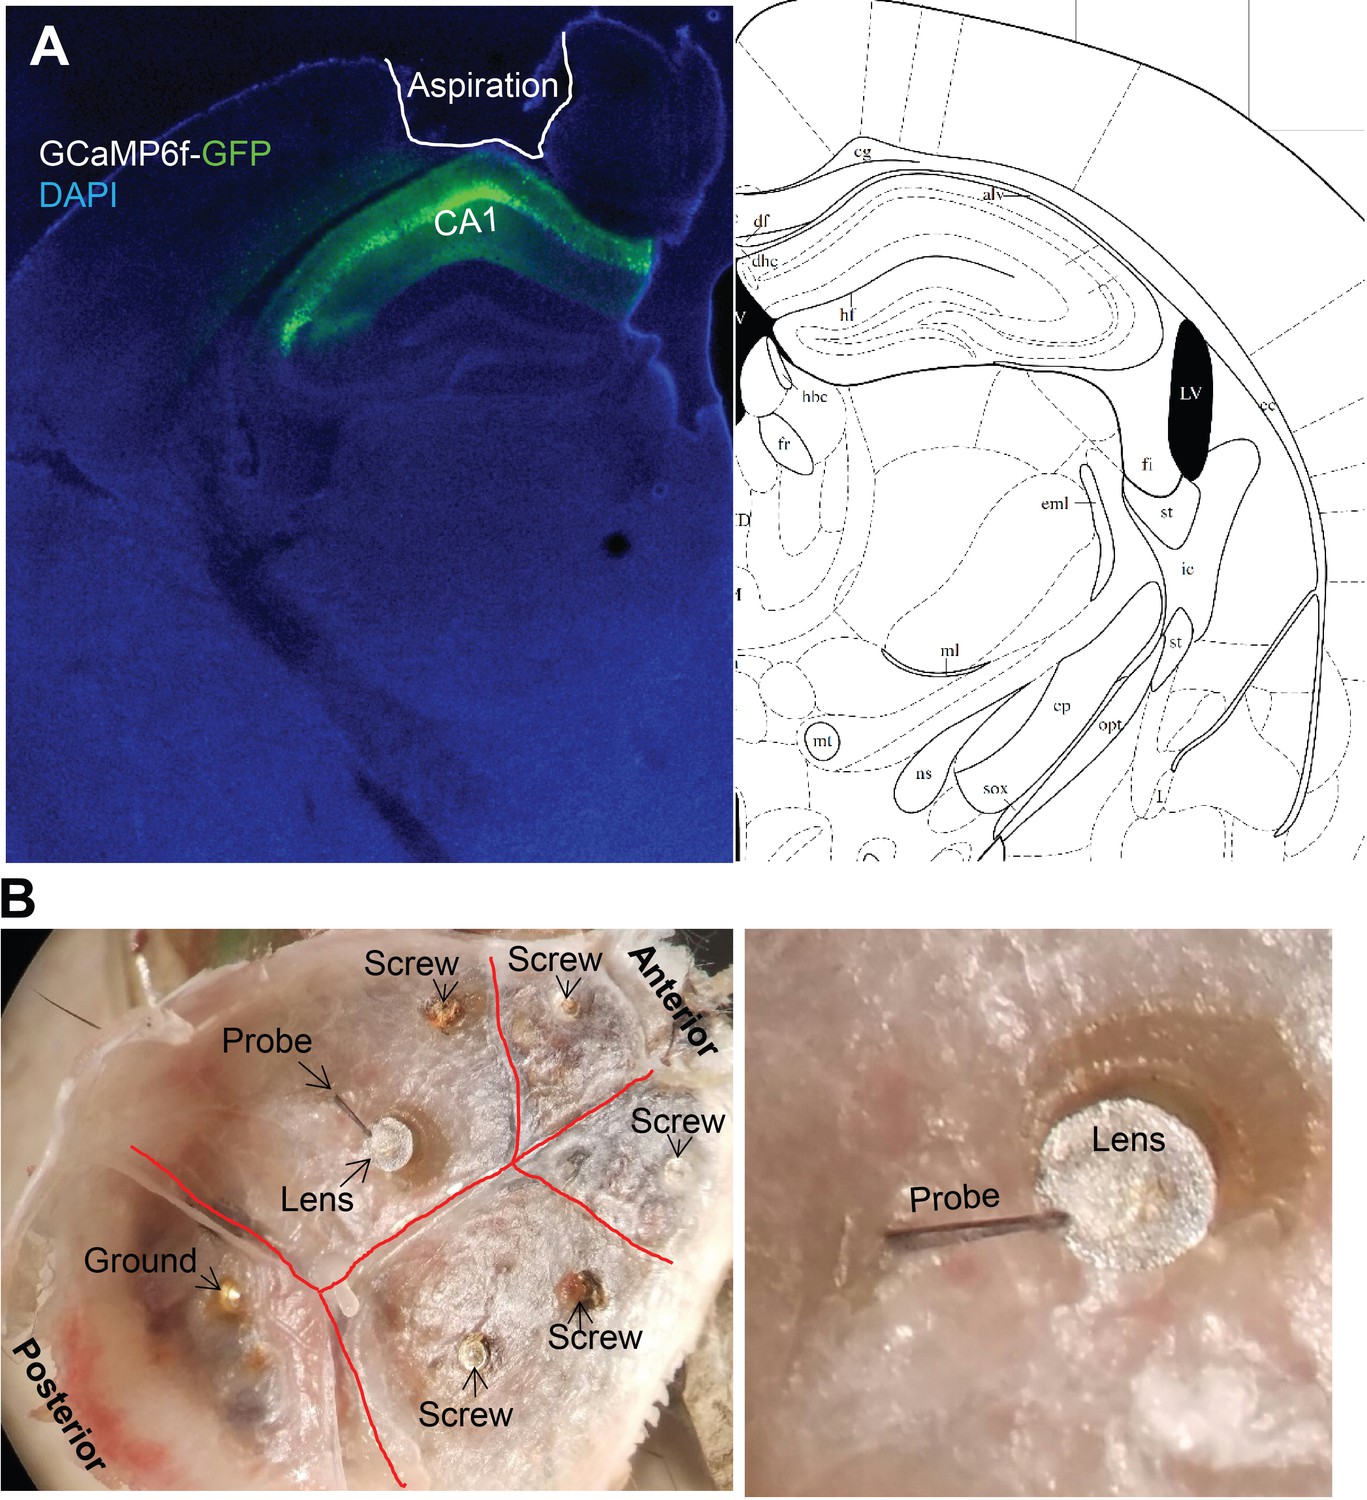
Representative GCaMP6f virus expression and lens and probe position for simultaneous Ca2+imaging and local field potential recording.
(A) GCaMP6f-GFP expression following 1 µL virus injection. (B) The position of the GRIN lens and ipsilateral probe.
Figure 2 with 3 supplements
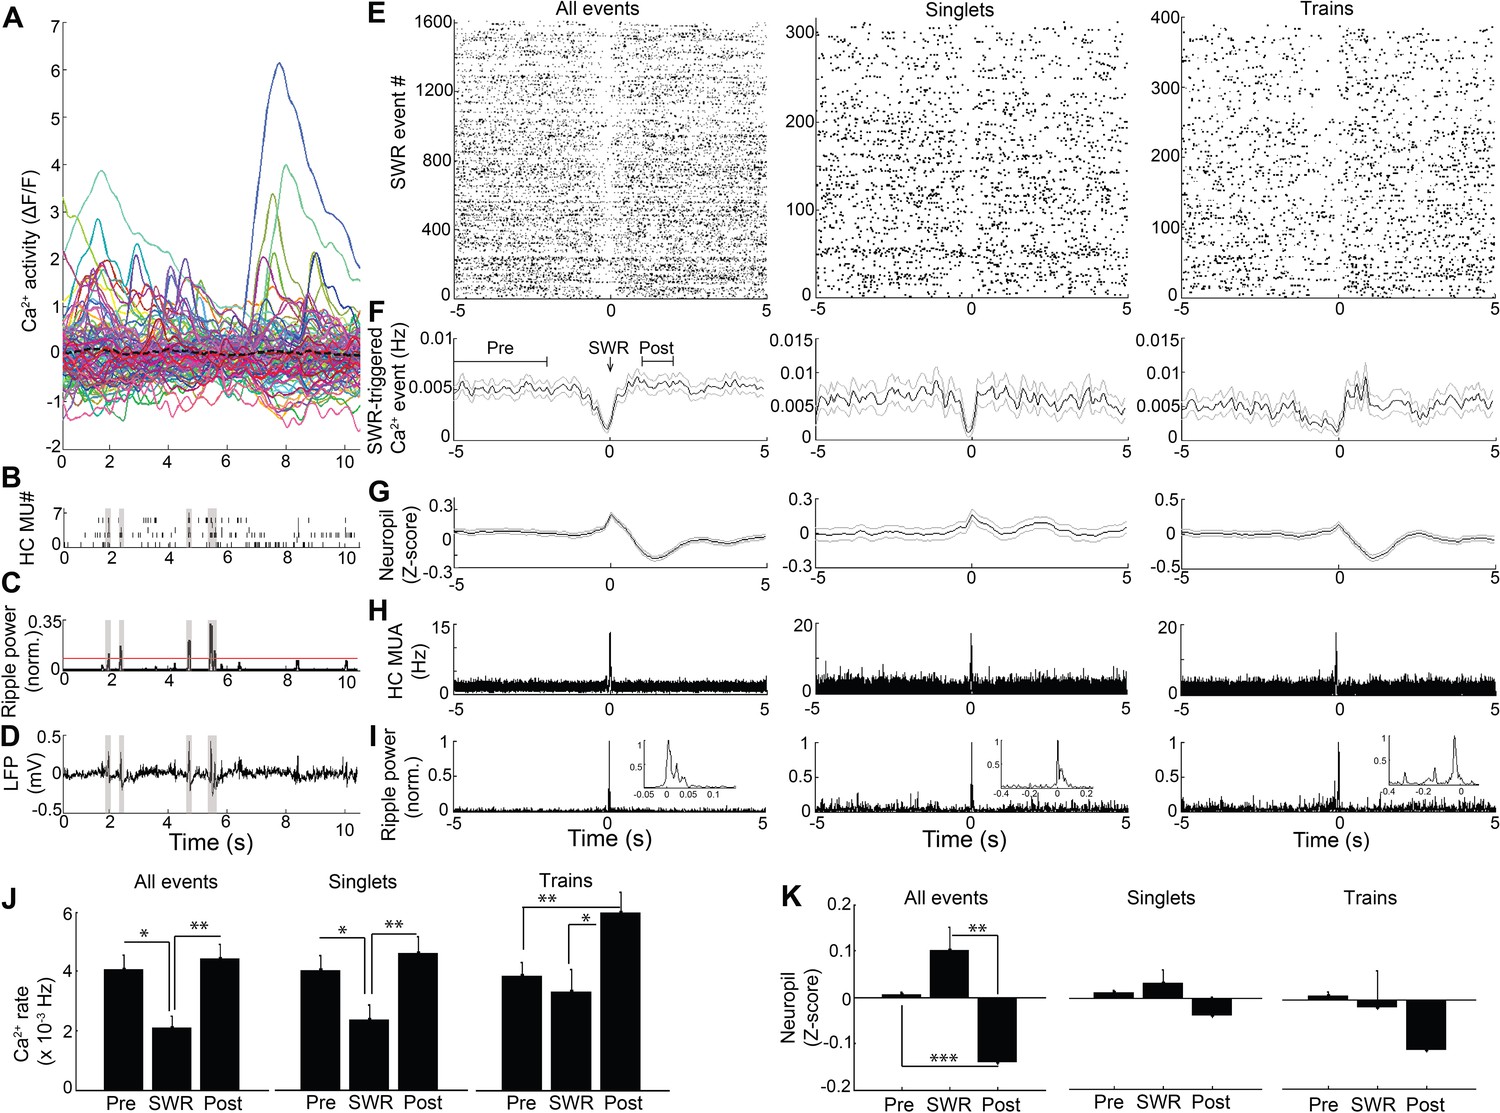
Modulation of Ca2+transients at SWRs.
(A) Temporal correspondence of simultaneously acquired dynamic calcium activity in 130 individual neurons with (B) CA1 multiunit action potentials as well as (C) ripple power and (D) LFP in a single freely behaving mouse. The dashed black line in (A) shows the global mean calcium activity. The red line in (C) reflects the threshold ripple power used to identify SWR events. (E) Raster and (F) peri-event time histogram of calcium events across all SWR events from the same mouse revealed a reduction of dynamic calcium activity that started before SWR onset. Raster and peri-event time histogram of calcium events across SWR singlets and across SWR trains are also shown. (G) Peri-event average neuropil fluorescence reveals SWR-associated calcium dynamics. (H) SWR-triggered multiunit action potentials and (I) pyramidal cell layer ripple power. Inset, expanded timescale. (J) Across all SWRs and SWR singlets, calcium transient rates at SWR onset (time = 0) were reduced compared to the preceding 2–5 s baseline and the 1–2 s post-SWR period (analysis times shown in F). After SWR trains, calcium rates were increased compared to baseline and SWR onset (n = 7 mice with 88, 112, 119, 130, 134, 171, 222 neurons). (K) Across all SWRs, the change in neuropil fluorescence was diminished in the post-SWR period (analysis times shown in (F); n = 6 mice). All events, all SWRs; Singlets, Single SWR event (separated by 1 s or more); Trains, SWR trains (doublets, triplets, etc.). (J–K) Statistics were performed using one-way repeated measures ANOVA with post hoc tests. *p<0.05, **p<0.01.
-
Figure 2—source data 1
- https://doi.org/10.7554/eLife.39777.011
Figure 2—figure supplement 1
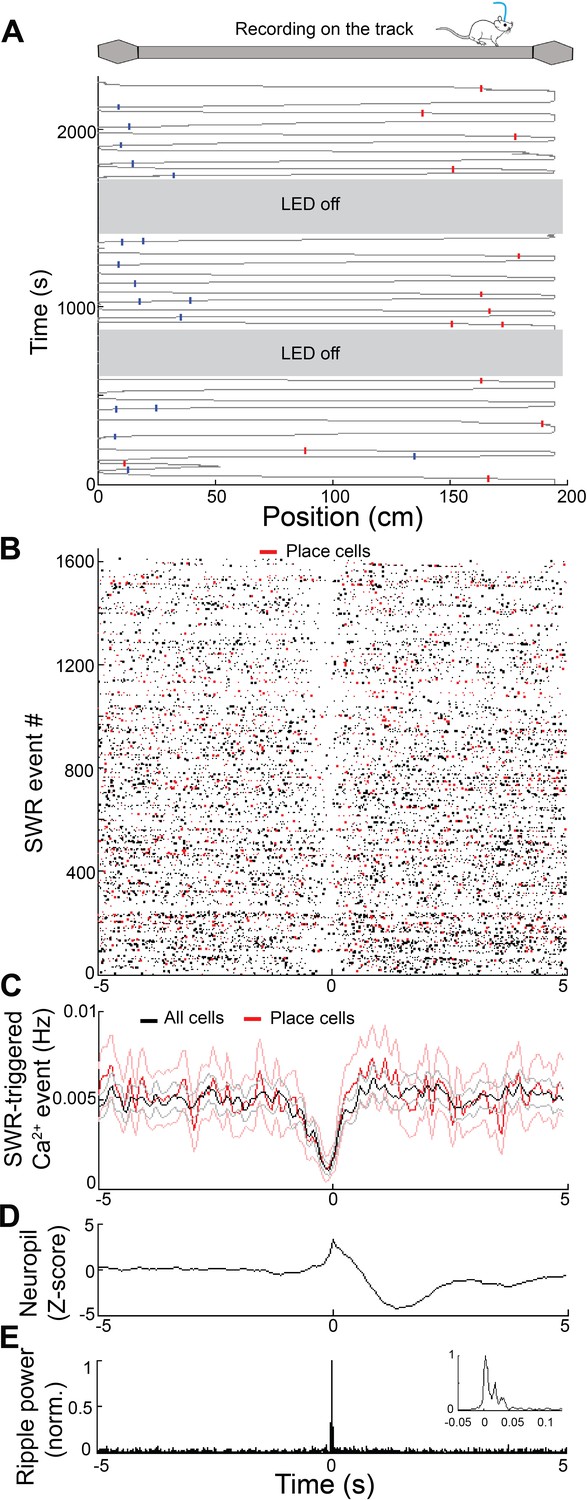
Calcium activity of place cells at SWR events.
(A) Calcium activity of two representative place cells during track navigation. (B) Raster and (C) peri-event time histogram of calcium events from all cells (n = 130 neurons, black) and place cells (n = 28, red) across all SWR events from the same mouse revealed similar reductions of calcium activity at SWRs. (D) Peri-event average neuropil fluorescence reveals SWR-associated calcium dynamics. (E) SWR-triggered pyramidal cell layer ripple power. Inset, expanded timescale.
Figure 2—figure supplement 2
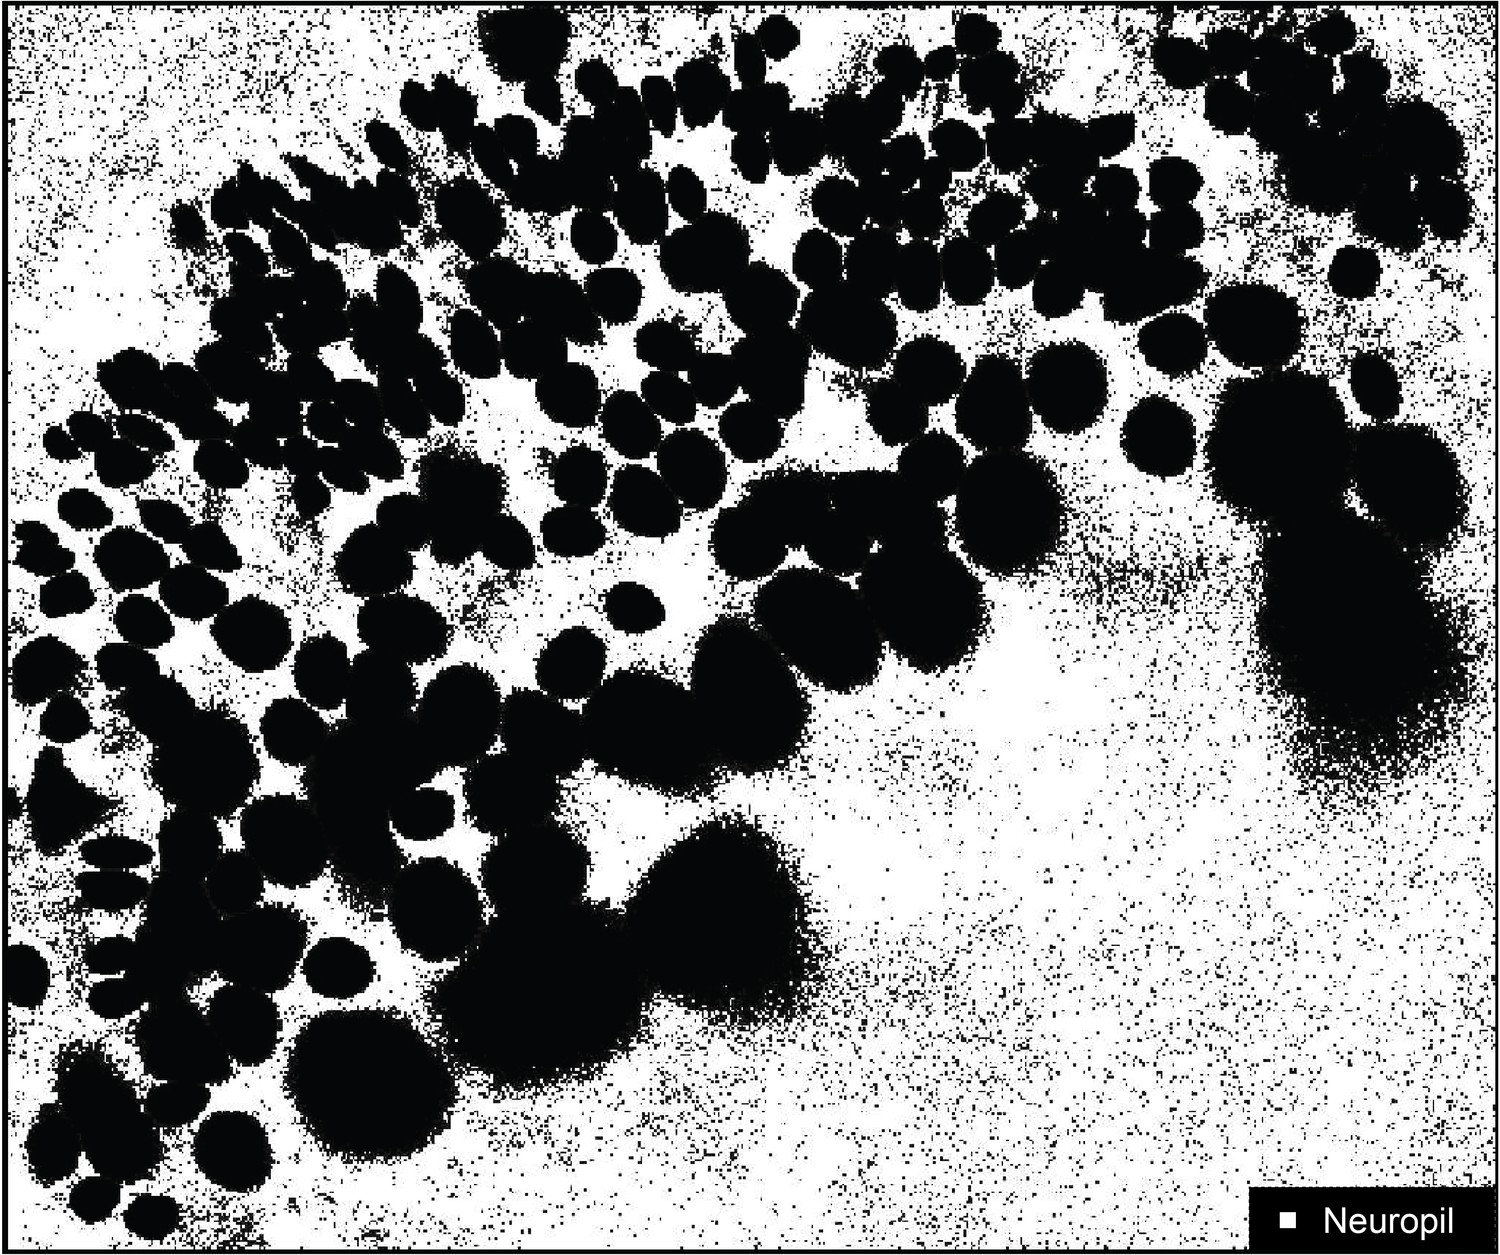
Fluorescence measurement in the neuropil.
The set of pixels used to measure fluorescence changes in the neuropil are shown in white. Non-neuropil pixels include those of identified somas and are shown in black.
Figure 2—figure supplement 3
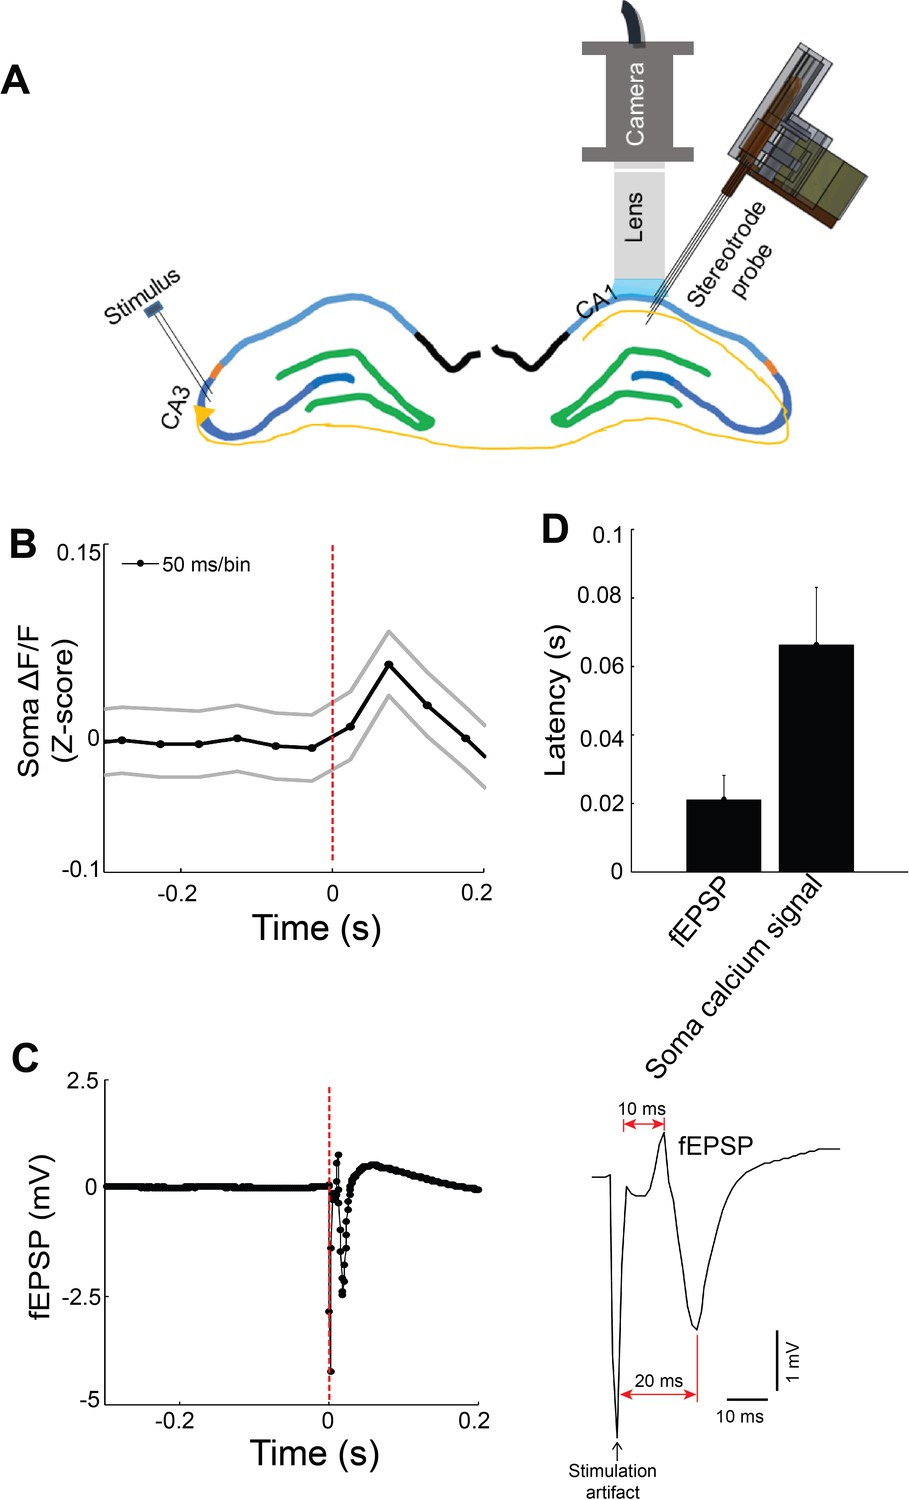
Commissural stimulation evoked field EPSP and calcium fluorescence changes.
(A) Schematic. A stimulating electrode placed in contralateral CA3 was used to activate the commissural pathway. (B) Change in somatic calcium fluorescence of 14 modulated neurons (sampling rate, 20 Hz). (C) Evoked field EPSP (fEPSP; sampling rate, 1 KHz). (D) Stimulus-evoked latency of fEPSP and somatic calcium fluorescence increase (n = 3 mice; modulated neurons per mouse: 14, 8, 48).
-
Figure 2—figure supplement 3—source data 1
- https://doi.org/10.7554/eLife.39777.009
Figure 3 with 4 supplements
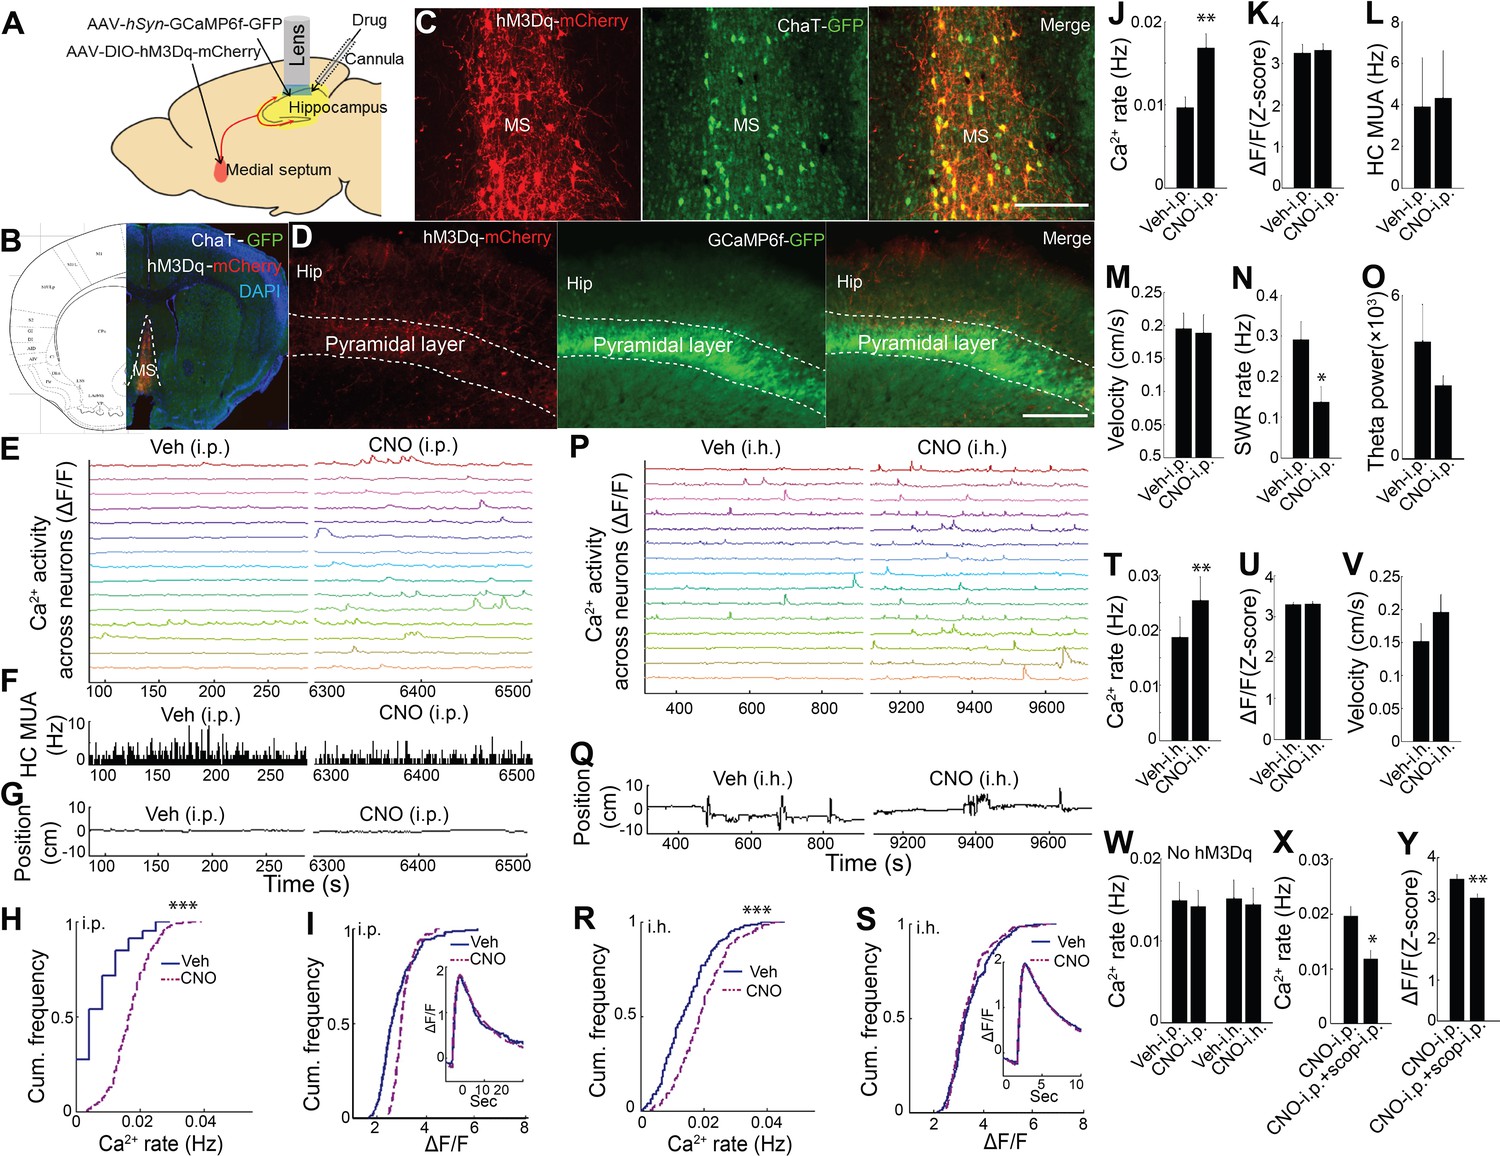
Chemogenetic activation of septal cholinergic neurons increased CA1 dynamic calcium activity in ChAT-Cre mice.
(A) Schematic for local injection. (B) Immunohistochemistry shows the expression of hM3Dq in the medial septum (MS) and (C) colocalization with cholinergic neurons (yellow): Red, anti-mCherry for hM3Dq; GFP, anti-ChAT. (D) The axons of cholinergic neurons expressing hM3Dq were also detected in the hippocampus, where CA1 neurons expressed GCaMP6f (GFP). Calibration bar: 200 μm. (E) Systemic (i.p) CNO injection (Right) increased calcium activity in individual neurons compared to vehicle (Left) (15/237 neurons of one mouse are shown). (F) Histogram of hippocampal multiunit activity (MUA). (G) Animal position during quiet wakefulness. (H) CNO injection increased calcium event rates within neurons but not (I) calcium event amplitudes. Inset, average Ca2+ event waveforms after vehicle and after CNO injection. Group data (n = 6 mice with 65, 98, 119, 184, 212, 237 neurons) show the effects of cholinergic activation with hM3Dq on (J) calcium event rates and (K) calcium event amplitudes. (L) Systemic CNO injection did not change hippocampal MUA (n = 5), (M) Velocity in the post-behavioral session after vehicle and CNO (i.p.) injection. (N) Systemic CNO injection reduced the rate of SWRs (n = 5 mice). (O) CNO injection did not change theta power. (P) Intrahippocampal (i.h.) CNO injection (Right) increased calcium activity across individual neurons compared to vehicle (Left) (15/212 neurons of one mouse are shown). (Q) Animal position in quiet wakefulness. (R) CNO i.h. injection increased calcium event rates within neurons but not (S) calcium event amplitudes. Inset, average Ca2+ event waveforms after vehicle and after CNO. Group data (n = 5 mice with 94, 113, 206, 212, 250 neurons) show the effects of local CNO injection on (T) calcium event rates and (U) amplitudes. (V) CNO i.h. injection did not affect animal velocity. (W) Neither i.p. nor i.h CNO injection affected calcium activity in mice without hM3Dq injection in the medial septum. The effects of CNO i.p. injection on (X) calcium rates and (Y) amplitudes were blocked with scopolamine. Statistics were performed using paired t-tests, *p<0.05, **p<0.01, ***p<0.001.
-
Figure 3—source data 1
- https://doi.org/10.7554/eLife.39777.020
Figure 3—figure supplement 1
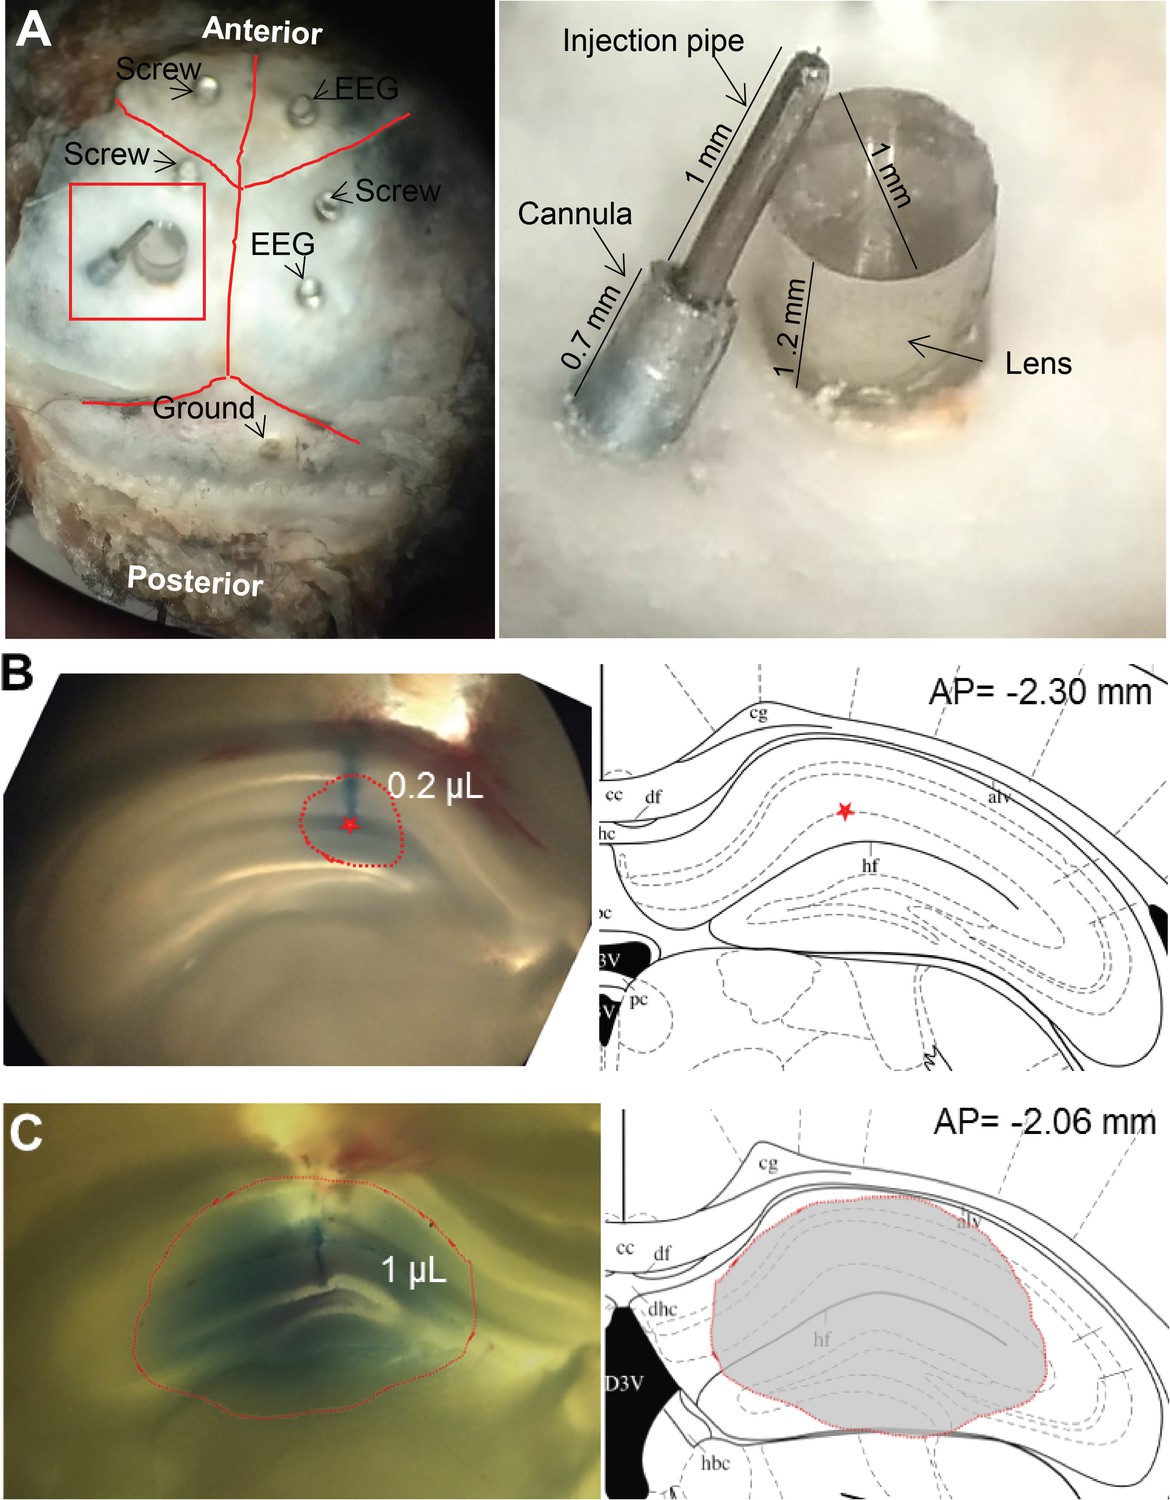
Representative lens and cannula positioning.
(A) Cannula implantation into the dorsal hippocampus in proximity to the GRIN lens. Trypan blue solution (B) local injection of 0.2 µL showed the center of drug injection (Star), (C) injection of 1 µL indicated the extent of drug diffusion (shadow), Brain slice: 400 µm.
Figure 3—figure supplement 2
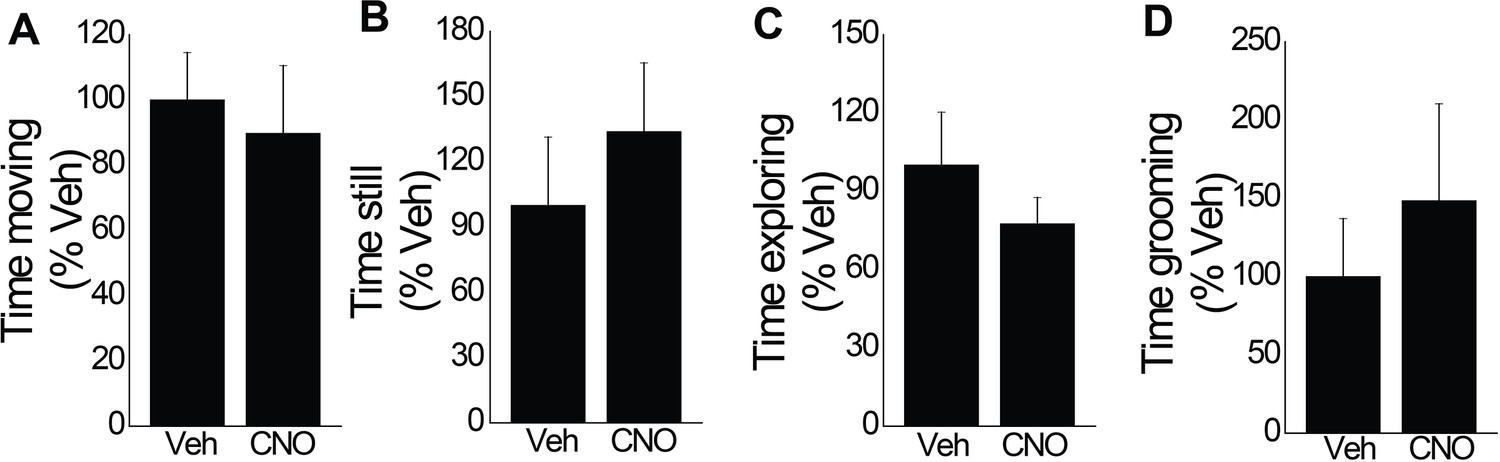
CNO systemic injection did not affect other behaviors.
Time spent (A) moving, (B) still, (C) exploring, and (D) grooming after CNO injection, normalized to time spent in these activities after vehicle injection. Statistics were performed with paired T-tests.
-
Figure 3—figure supplement 2—source data 1
- https://doi.org/10.7554/eLife.39777.015
Figure 3—figure supplement 3
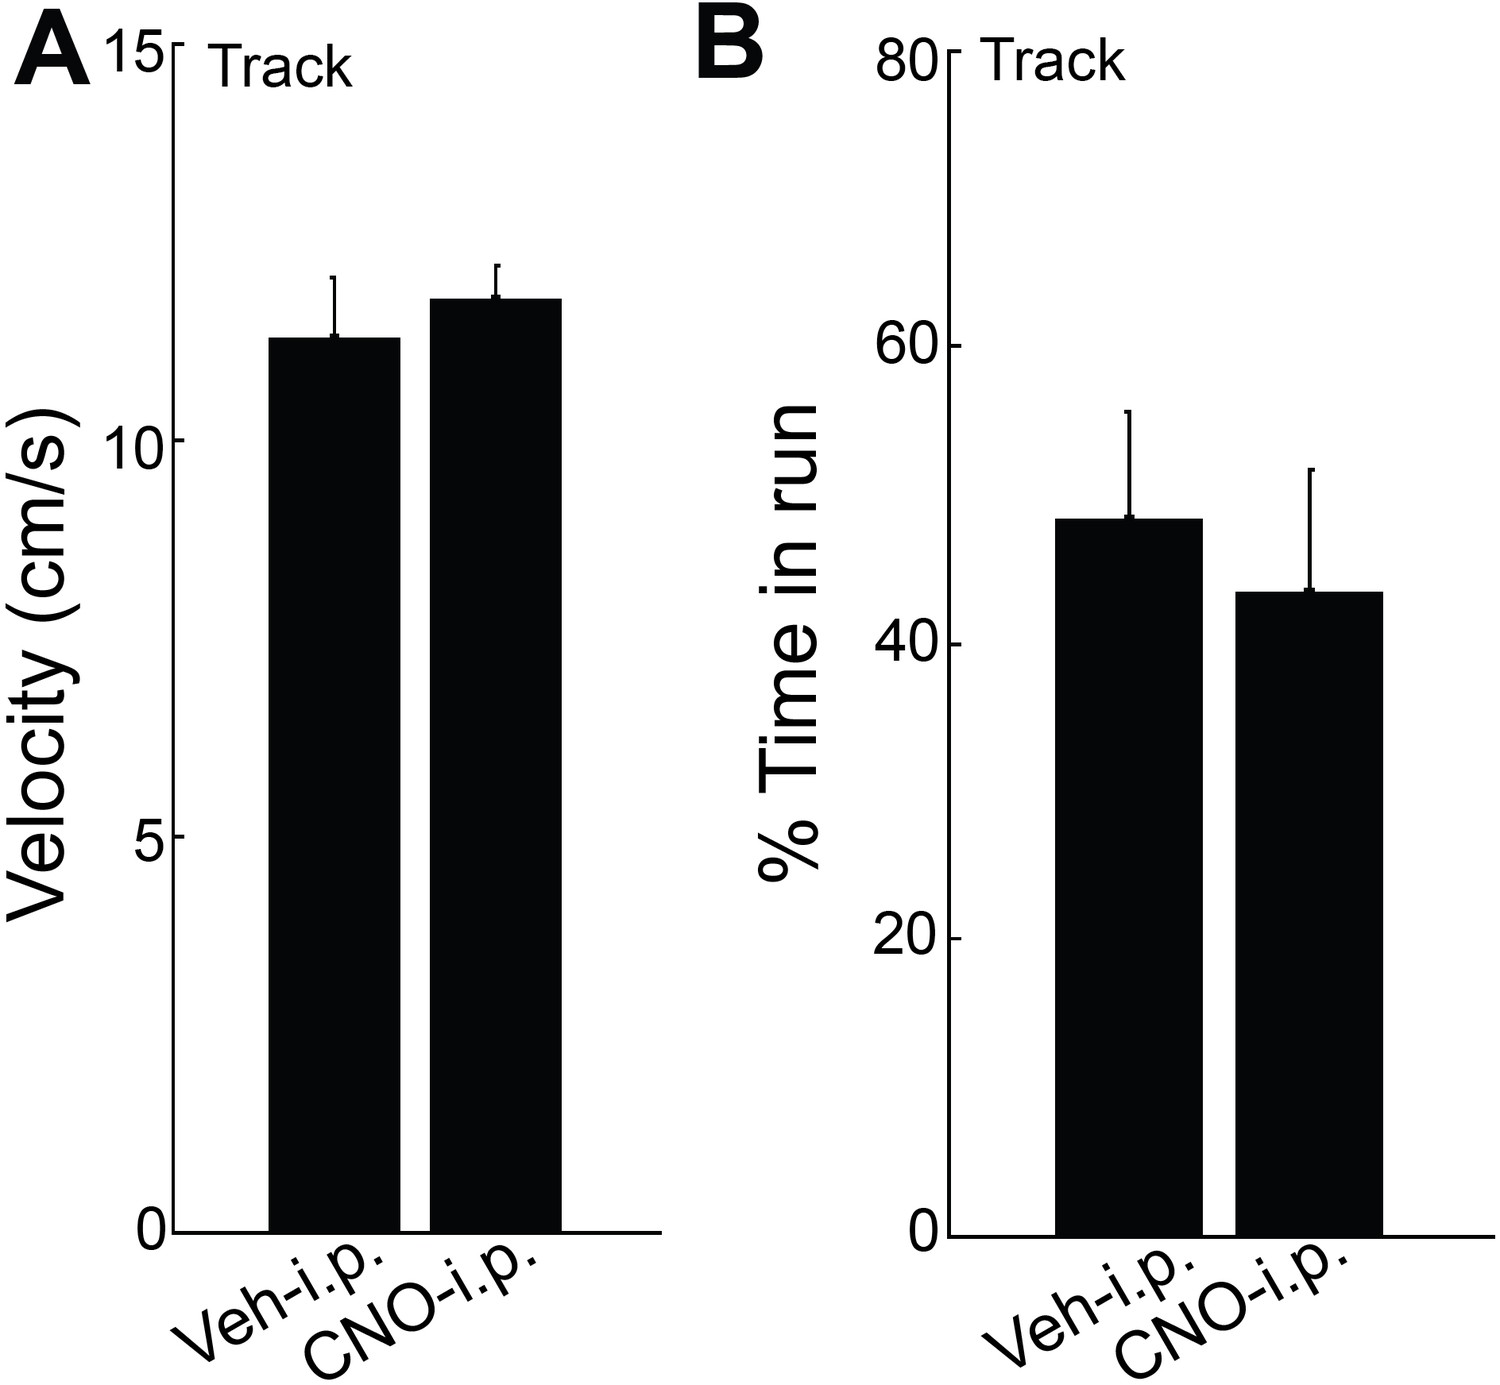
The effects of CNO systemic injection on velocity.
Systemic vehicle and CNO injection on (A) velocity on the task and (B) the percentage of time spent running. Statistics were performed with paired T-tests.
-
Figure 3—figure supplement 3—source data 1
- https://doi.org/10.7554/eLife.39777.017
Figure 3—figure supplement 4
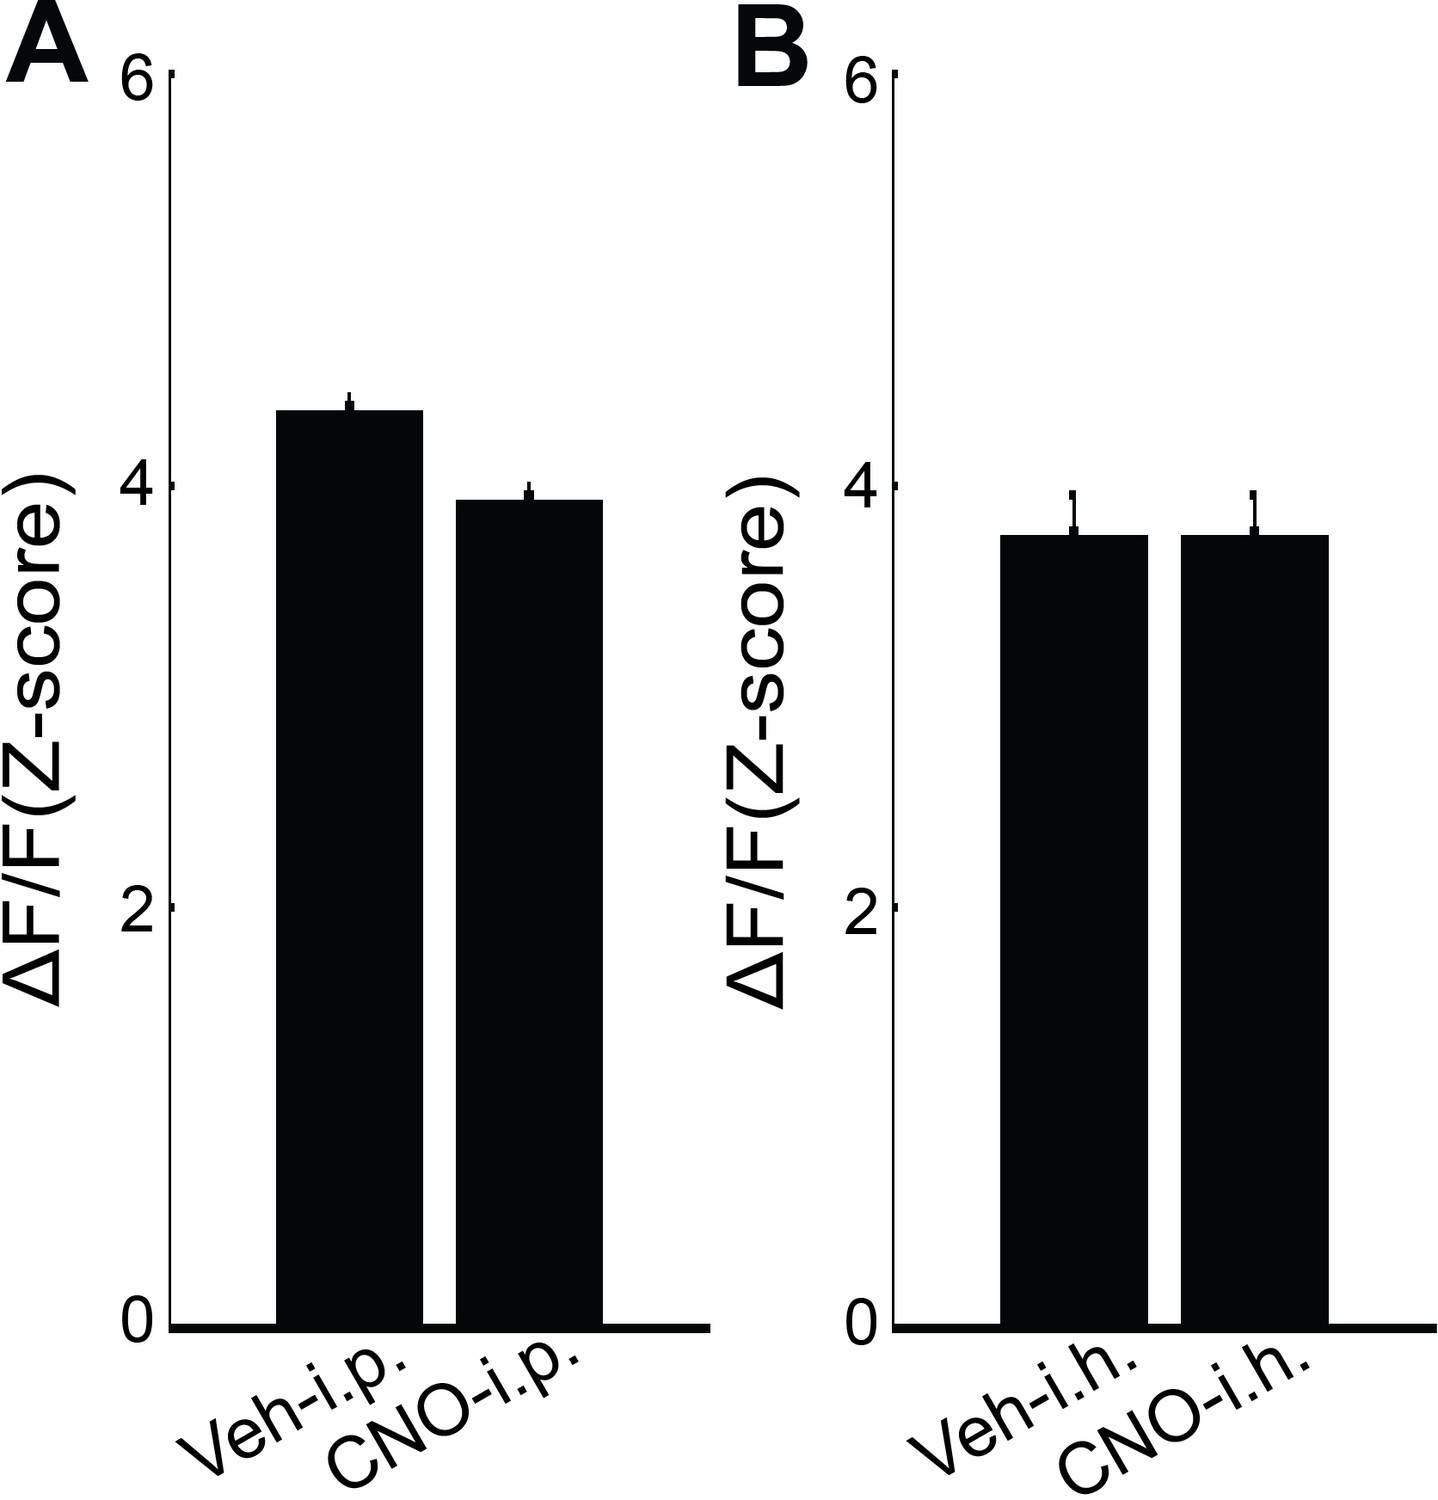
The effect of CNO injection on calcium event amplitudes in mice that did not undergo hM3Dq injection in the medial septum.
Neither (A) i.p. nor (B) i.h. CNO injection affected calcium event amplitudes. Statistics were performed with paired T-tests.
-
Figure 3—figure supplement 4—source data 1
- https://doi.org/10.7554/eLife.39777.019
Figure 4 with 2 supplements
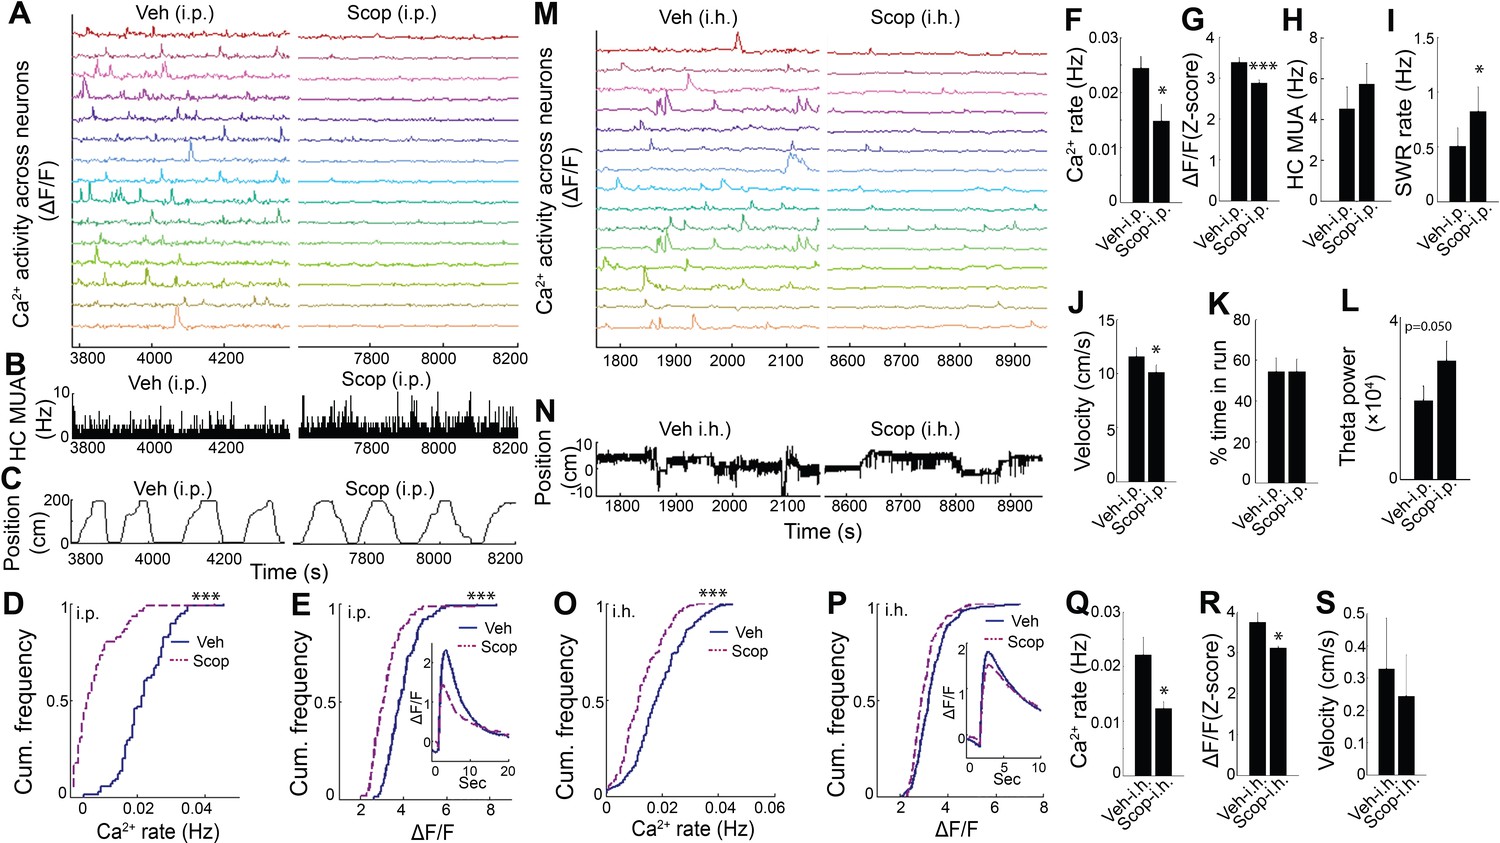
Hippocampal dynamic calcium activity was mAChR dependent.
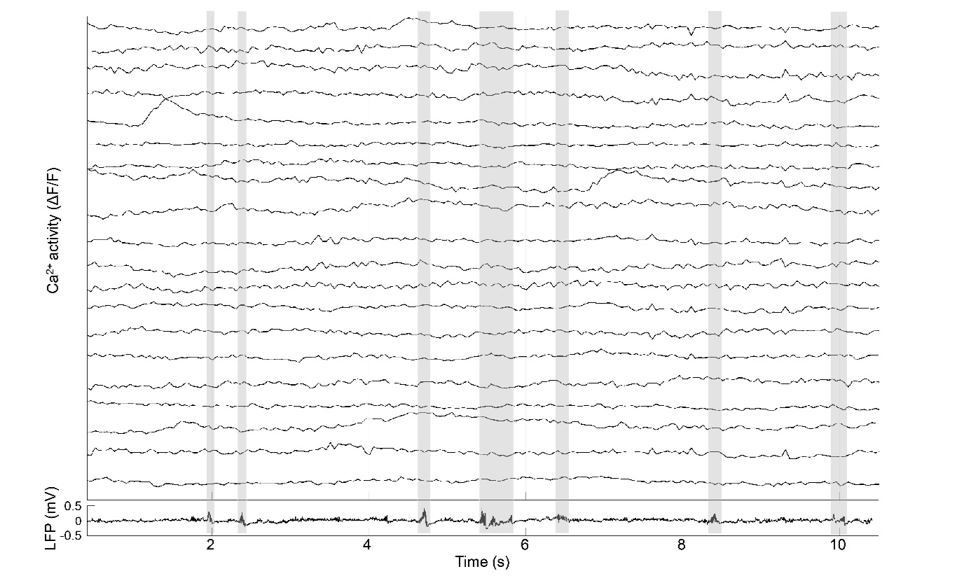
(A) Systemic (i.p) scopolamine injection (Right) reduced calcium activity across individual neurons compared to vehicle (Left) (15/75 neurons of one mouse are shown). (B) Histogram of hippocampal multiunit activity (MUA) after injection of vehicle and scopolamine. (C) Animal position as a function of time on the track. Both (D) calcium event rates and (E) event amplitudes were reduced after scopolamine injection. Inset, average Ca2+ event waveforms after vehicle and after scopolamine. Group level effects of scopolamine on (F) calcium event rates and (G) event amplitudes during run behavior (n = 7 mice with 73, 74, 75, 106, 183, 219, 225 neurons). (H) Scopolamine i.p. did not change hippocampal MUA. (I) Scopolamine injection increased SWR rates (n = 6 mice). (J) Scopolamine injection reduced run velocity but not (K) the percentage of time spent in run on the task. (L) Effect of scopolamine injection on hippocampal theta power. (M) Intrahippocampal (i.h.) scopolamine injection (Right) reduced calcium activity across individual neurons compared to vehicle (Left) (15/239 neurons of one mouse are shown). (N) Animal position during quiet wakefulness. (O) Calcium event rates and (P) event amplitudes after vehicle and scopolamine injection. Group level effects of i.h. scopolamine injection on (Q) calcium event rates and (R) event amplitudes during quiet wakefulness (n = 5 mice with 31, 119, 154, 239, 263 neurons). (S) Intrahippocampal scopolamine injection did not affect animal activity during quiet wakefulness (n = 5 mice). Statistics were performed using paired t-tests, *p < 0.05, ***p < 0.001.test
-
Figure 4—source data 1
- https://doi.org/10.7554/eLife.39777.027
Figure 4—figure supplement 1
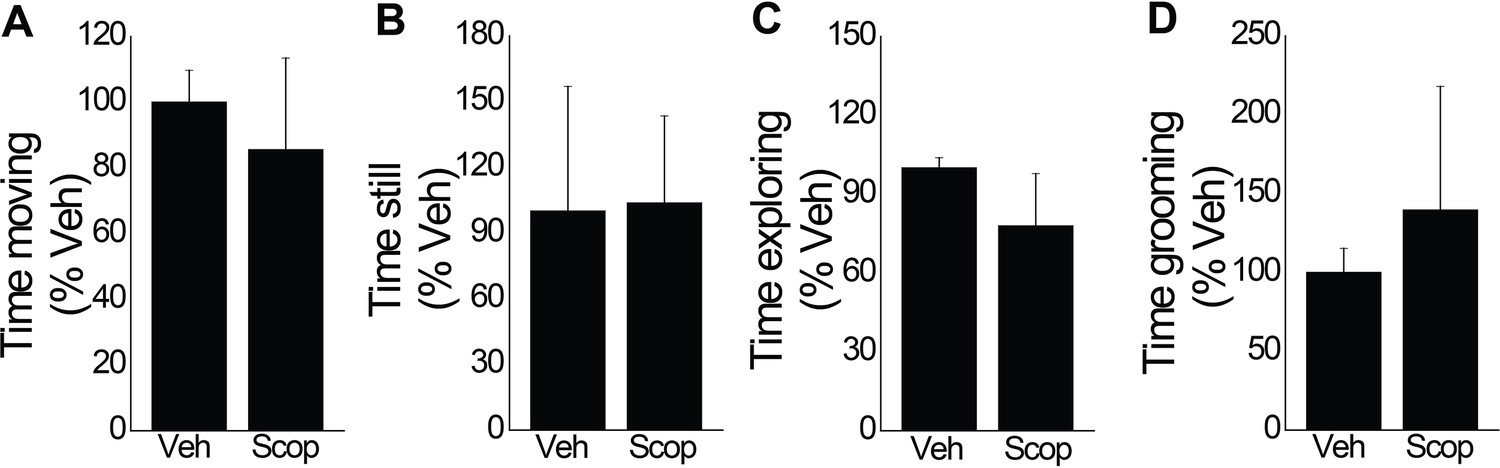
Scopolamine systemic injections did not affect other behaviors.
Time spent (A) moving, (B) still, (C) exploring, and (D) grooming after scopolamine injection, normalized to time spent in these activities after vehicle injection. Statistics were performed with paired T-tests.
-
Figure 4—figure supplement 1—source data 1
- https://doi.org/10.7554/eLife.39777.024
Figure 4—figure supplement 2
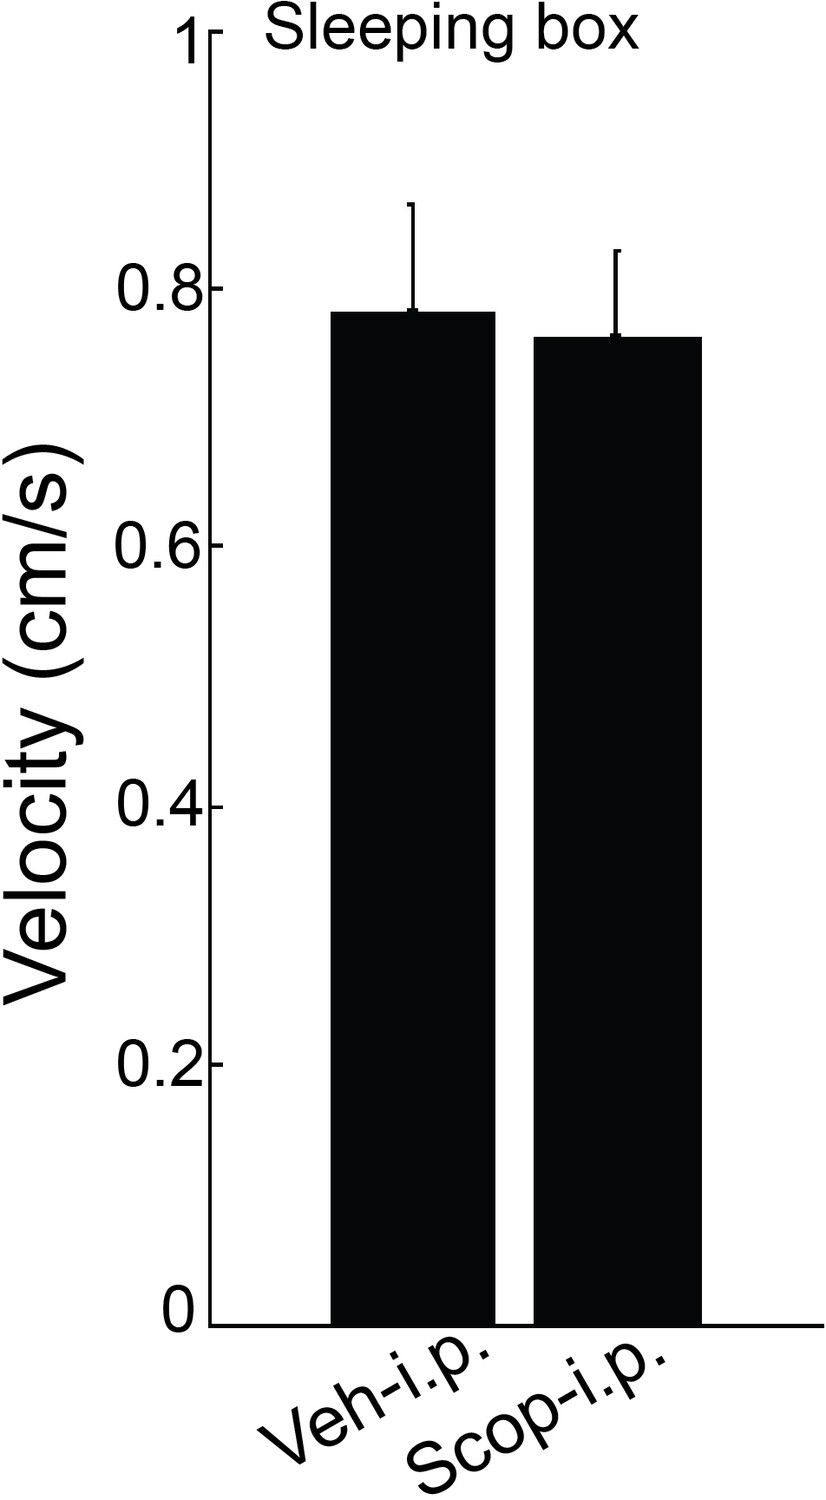
The effects of scopolamine systemic injection on velocity.
Systemic vehicle and scopolamine injection on velocity in the post-behavioral session. Statistics were performed with paired T-tests.
-
Figure 4—figure supplement 2—source data 1
- https://doi.org/10.7554/eLife.39777.026
Author response image 1
Videos
Video 1
Representative calcium activity from a single mouse recording across the sleep-wake cycle.
SWS (slow wave sleep), REM (rapid eye movement). Time: 20 s.
Video 2
Representative calcium activity after Vehicle and CNO injections (i.p. or i.h.).
Time: 20 s.
Video 3
Representative calcium activity after Vehicle and Scopolamine injections (i.p. or i.h.).
Time: 20 s.
Additional files
-
Supplementary file 1
Statistical analyses for group data.
- https://doi.org/10.7554/eLife.39777.029
-
Transparent reporting form
- https://doi.org/10.7554/eLife.39777.030
Download links
A two-part list of links to download the article, or parts of the article, in various formats.
Downloads (link to download the article as PDF)
Open citations (links to open the citations from this article in various online reference manager services)
Cite this article (links to download the citations from this article in formats compatible with various reference manager tools)
Cholinergic modulation of hippocampal calcium activity across the sleep-wake cycle
eLife 8:e39777.
https://doi.org/10.7554/eLife.39777


