Endothelial-specific FoxO1 depletion prevents obesity-related disorders by increasing vascular metabolism and growth
- York University, Canada
Figures
Figure 1
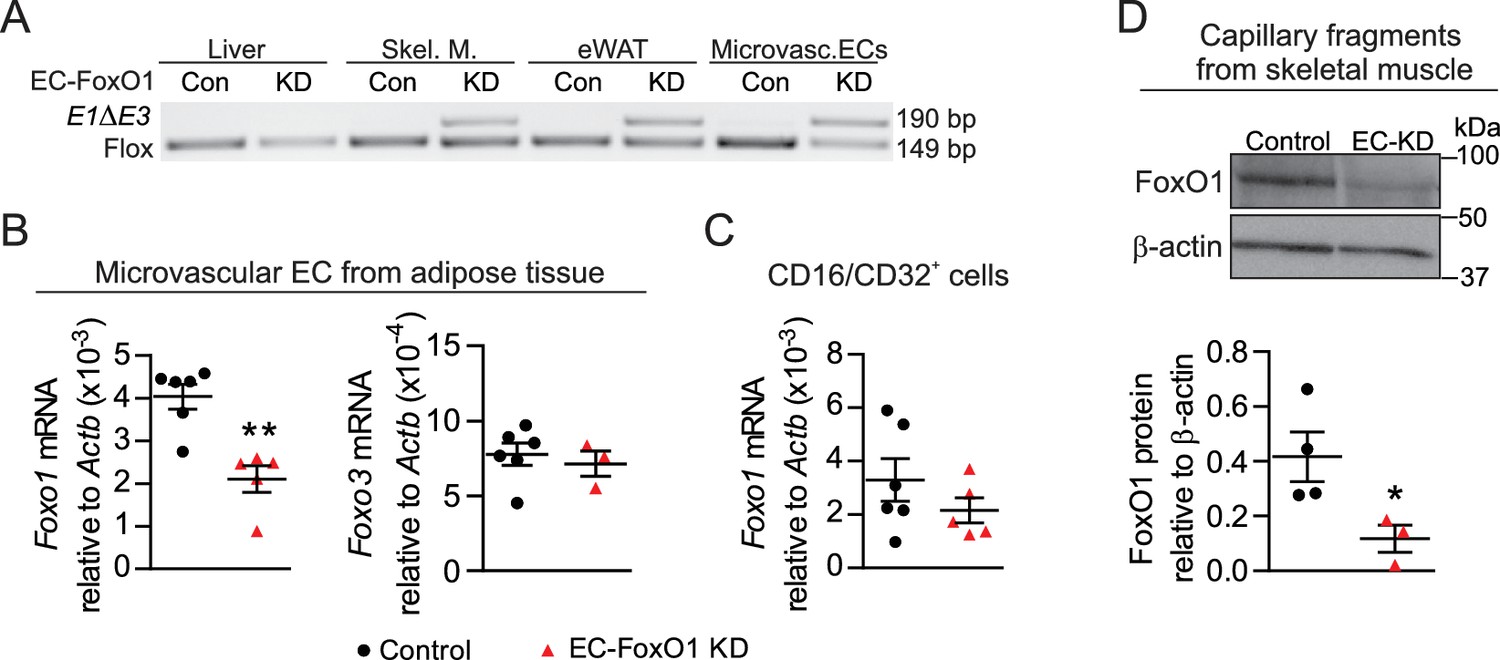
Endothelial-specific depletion of Foxo1 induced in adult male mice effectively reduces FoxO1 levels in skeletal muscle and adipose microvascular beds.
(A) PCR of genomic DNA from multiple organs of control (Cre-; Foxo1f/f) and EC-FoxO1 KD mice using primers for the floxed and deleted (E1∆E3) alleles. (B–C) Gene expression analysis of microvascular EC and CD16/CD32+ cells isolated from white adipose tissue of Control (n = 6) and EC-FoxO1 KD (n = 3–5) mice. (D) Representative Western blot images and quantitative analysis of FoxO1 and β-actin levels in capillary fragments isolated from skeletal muscle (n = 3–4). Results are expressed relative to β-actin levels. Data in all panels are expressed as mean ± SEM; *p < 0.05, **p < 0.01, calculated with two-tailed unpaired t-test.
Figure 2
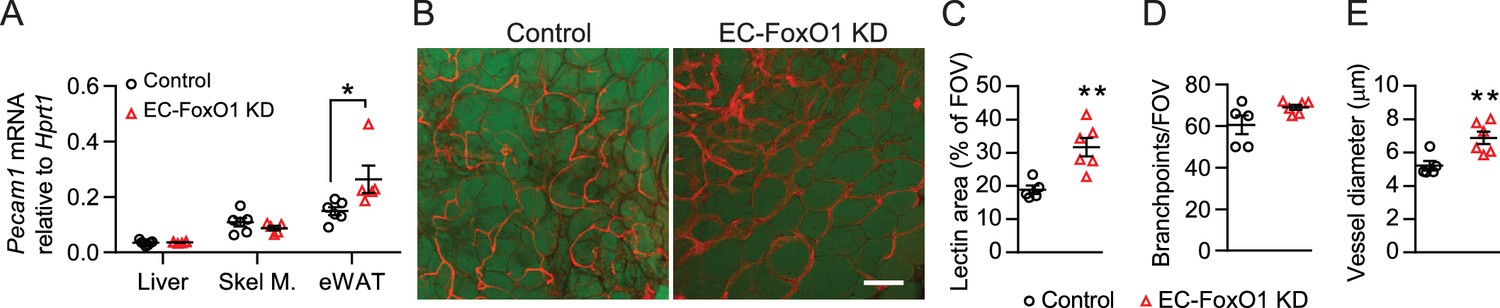
Greater vascular density in visceral adipose tissue of normal chow-fed EC-FoxO1 KD mice.
(A) Pecam1 mRNA levels in various tissues of Control and EC-FoxO1 KD mice after 16 weeks of normal chow (NC) diet (Control n = 6, EC-FoxO1 KD n = 5). (B) Representative confocal images of adipose tissue whole-mount staining with BODIPY 493/503 (green) and G. simplicifolia lectin (red) (×20 magnification; scale bar = 100 μm). (C–E) Lectin area (C), capillary branch density (D) and microvessel diameters (E) were quantified from confocal images (Control n = 5, EC-FoxO1 KD n = 6). Data in all panels are expressed as mean ± SEM; *p < 0.05, **p < 0.01, calculated with two-tailed unpaired t-test.
Figure 3

EC-Foxo1 depletion strongly induces vascular growth within adipose tissue in response to HF diet.
(A) Pecam1 mRNA levels in different adipose tissue depots of Control and EC-FoxO1 KD mice after 16 weeks of high-fat (HF) diet (Control n = 5–7, EC-FoxO1 KD n = 7). (B) Gene expression analysis of eWAT of HF-fed Control and EC-FoxO1 KD mice (Control n = 7, EC-FoxO1 KD n = 6–7). (C) Representative confocal images of adipose tissue whole-mount staining with BODIPY 493/503 (green) and G. simplicifolia lectin (red) (C - scale bar = 100 μm). (D,E and I). Lectin area (D) and capillary branch density were quantified from these images (Control, n = 6; EC-FoxO1 KD, n = 5 or 6). (F–G) G. simplicifolia lectin (green) and Wheat germ aggluttinin (red) staining of paraffin-sectioned adipose tissue (F - scale bar = 100 μm) was used to assess capillary to adipocyte ratio (G). (H) Representative confocal images of adipose tissue whole-mount staining with Isolectin alone (greyscale; scale bar = 20 μm). (I) Microvessel diameters were quantified from confocal images (Control, n = 6; EC-FoxO1 KD, n = 6). Data in all panels are expressed as mean ± SEM; *p < 0.05, ***p < 0.001, calculated with two-tailed unpaired t-test.
Figure 4

EC-Foxo1 depletion also favors microvascular expansion in skeletal muscle under HF diet feeding.
(A) Pecam1 mRNA levels in liver and skeletal of HF-fed Control (n = 5–6) and EC-FoxO1 KD (n = 6–7) mice. (B) Images of EDL muscle stained with Isolectin-FITC to identify capillaries (scale bar = 50 μm). (C) Capillary to fiber (C:F) ratios were calculated from 3 to 4 independent fields of view per mouse (Control n = 6, EC-FoxO1 KD n = 6). (D) Representative EM images of capillaries within skeletal muscle from HF-fed Control and EC-FoxO1 KD mice (×6.5k magnification; scale bar = 2 μm). (E–F) EC cross-sectional area (E) and capillary luminal diameter were quantified from EM images from n = 4 mice per group, with individual capillary measurements shown (F). Data in all panels are expressed as mean ± SEM; *p < 0.05, calculated with two-tailed unpaired t-test.
Figure 5 with 2 supplements
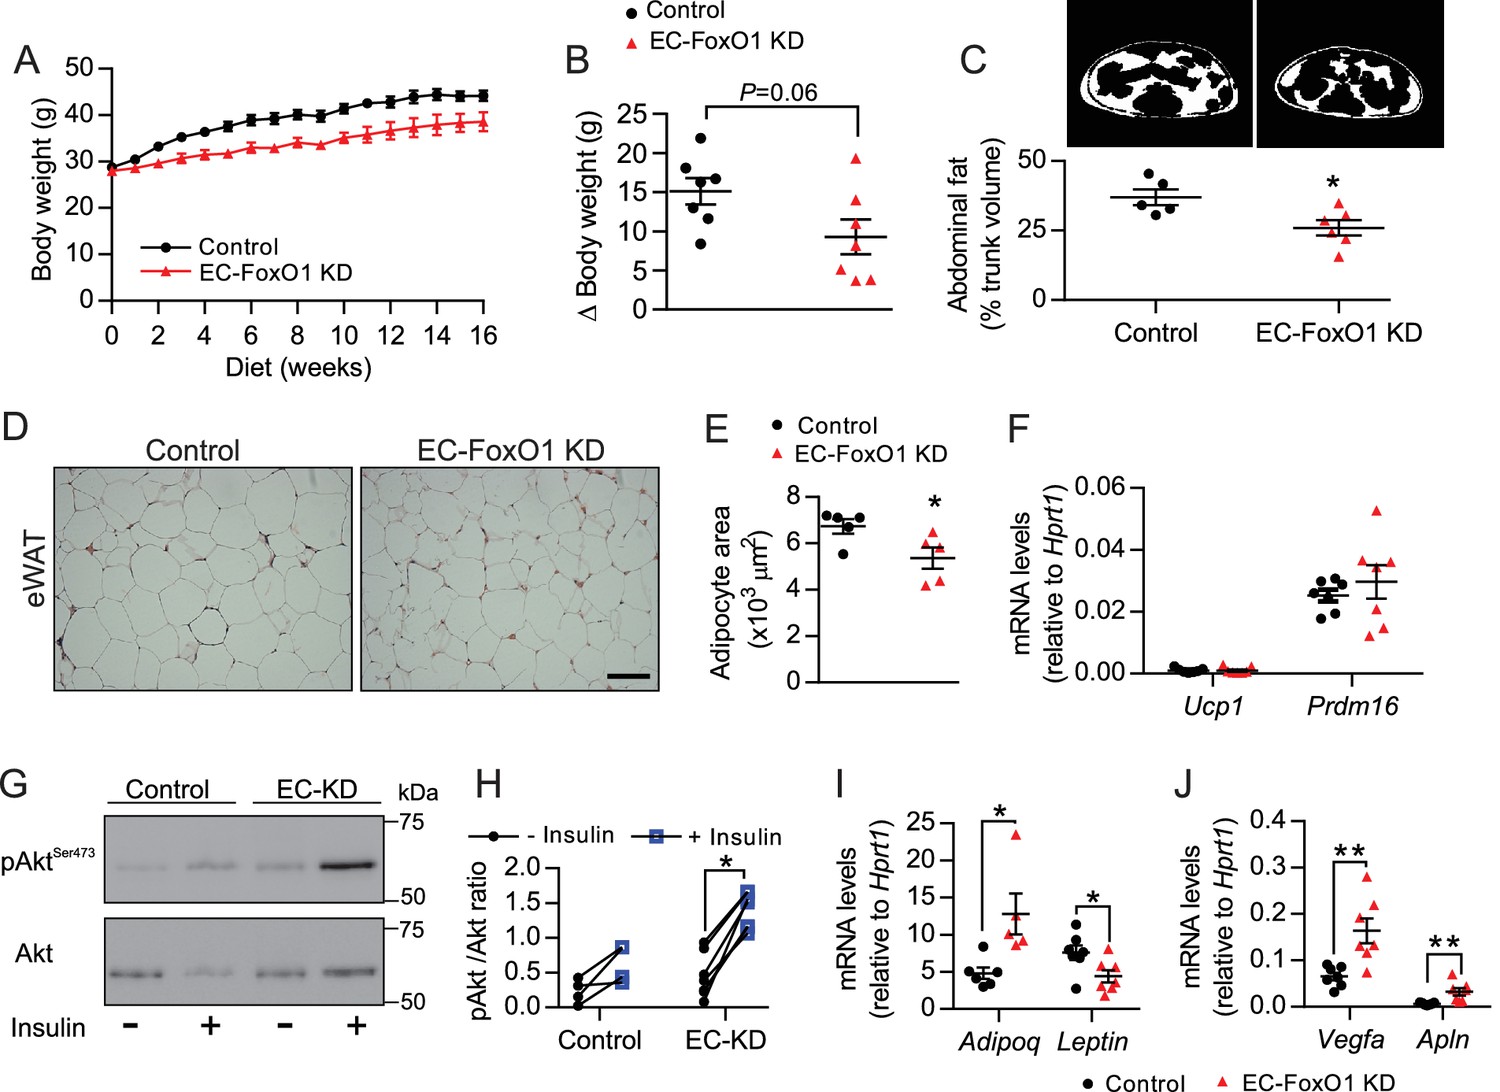
EC-FoxO1 KD mice exhibit a healthier adipose tissue expansion in response to HF diet.
(A) Body weights during 16 weeks of HF feeding. (B) Summarized weight gain over the course of 0–14 weeks (Control n = 7, EC-FoxO1 KD n = 7). (C) Abdominal transverse micro-CT images of HF-fed Control (n = 5) and EC-FoxO1 KD (n = 6) mice (upper panel). Fat content (shown in white) was calculated as % of total trunk volume. (D) Representative hematoxylin and eosin-stained images of adipose tissue from the epididymal fat pad (scale bar = 100 μm). (E) Mean adipocyte cross-sectional area (Control n = 5 EC-FoxO1 KD n = 5). (F) mRNA for browning markers Ucp1 and Prdm16 relative to Hprt1 (Control n = 7, EC-FoxO1 KD n = 7). (G–H) Representative Western blot images (G) and quantitative analysis (H) of pSer473-Akt and total Akt levels in eWAT after ex vivo incubation in the absence or presence of insulin. Results are expressed relative to total Akt levels (Control n = 4, EC-FoxO1 KD n = 7). (I–J) mRNA for adipokines (I, Adipoq and Leptin) and angiogenic markers (J, Vegfa and Apln) in eWAT relative to Hprt1 (Control n = 6–7, EC-FoxO1 KD n = 5–7). Data in all panels are expressed as mean ± SEM; *p < 0.05, **p < 0.01, calculated with two-tailed unpaired t-test.
Figure 5—figure supplement 1
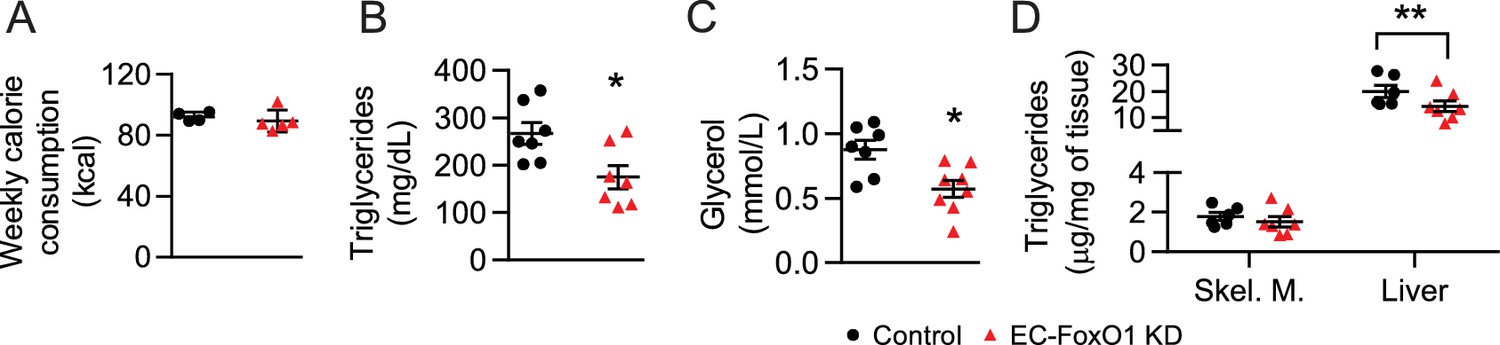
Lower circulating and liver triglycerides in HF-fed EC-FoxO1 KD mice.
(A) Average weekly caloric intake of mice determined between diet weeks 4 to 11 from only single housed mice (Control n = 4, EC-FoxO1 KD n = 5). (B–C) Non-fasting serum levels of triglycerides (B) and glycerol (C) of Control (n = 7) and EC-FoxO1 KD (n = 7–8) mice. (D) Triglyceride concentration in the skeletal muscle (gastrocnemius) and liver (Control n = 6, EC-FoxO1 KD n = 7).
Figure 5—figure supplement 2
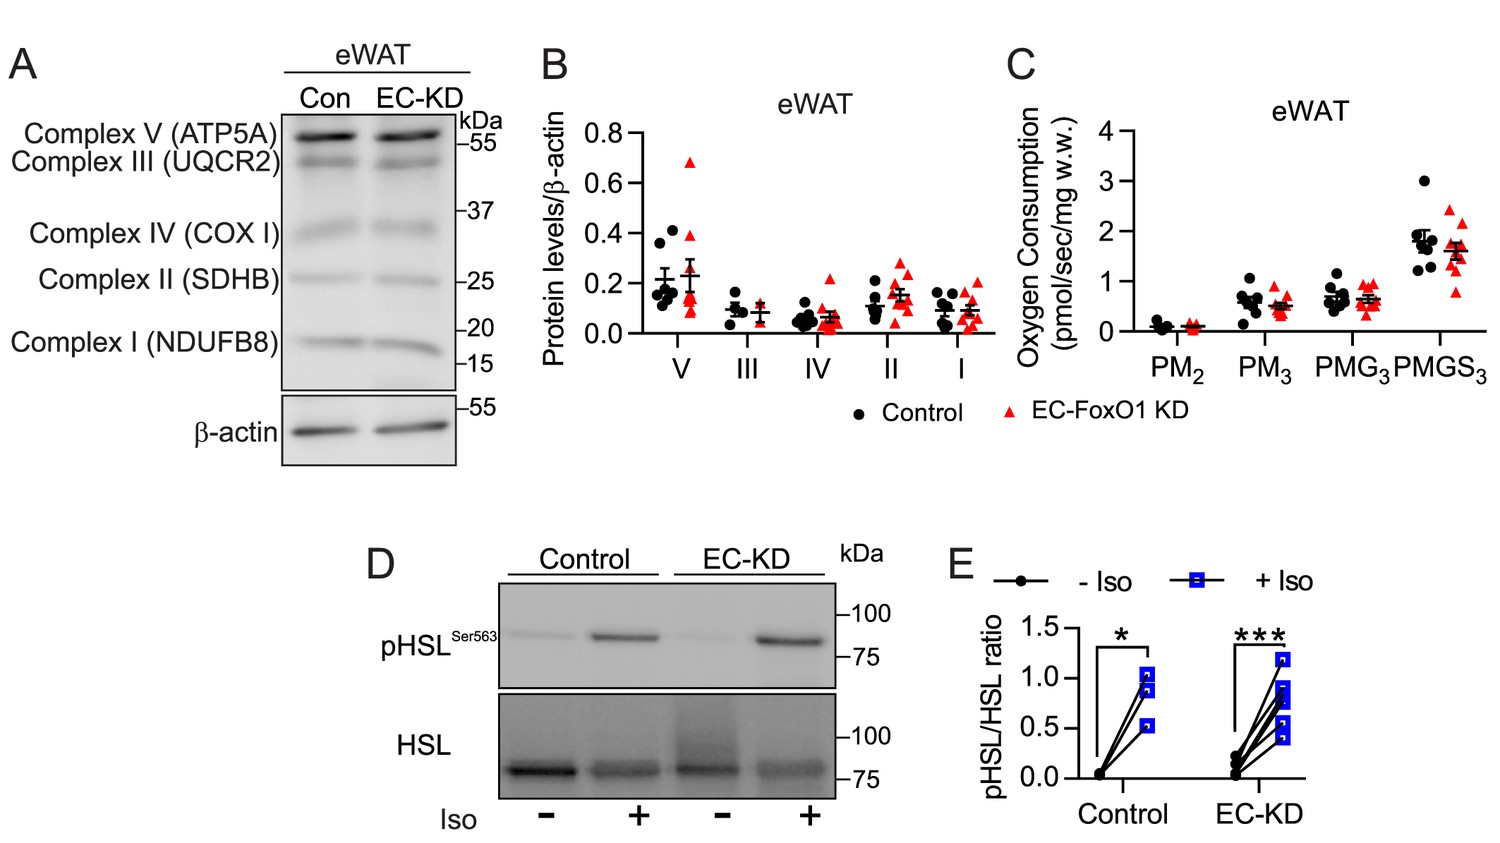
EC-Foxo1 depletion has no impact on adipose mitochondrial content and respiration, or sensitivity to isoproterenol.
(A–B) Representative Western blot images (A) and quantitative analysis (B) of mitochondrial OXPHOS proteins in total homogenates from eWAT of HF-fed Control (n = 7) and EC-FoxO1 KD mice (n = 9). Results are expressed relative to β-actin. (C) Analysis of uncoupled (State 2) and ADP-stimulated (State 3) respiration rates in eWAT from HF-fed Control (n = 7) and EC-FoxO1 KD mice (n = 9) supported by Complex I (NADH from pyruvate/malate, PM, and glutamate, (G) and Complex II (FADH2 from succinate, (S). (D–E) Representative Western blot images (D) and quantitative analysis (E) of pSer563-HSL and total HSL levels in eWAT after ex vivo incubation in the absence or presence of 10 µmol/L isoproterenol for 30 min. Results are expressed relative to total HSL levels (Control n = 3, EC-FoxO1 KD n = 7). Data in all panels are expressed as mean ± SEM; *p < 0.05, ***p < 0.001, calculated with two-tailed paired t-test.
Figure 6 with 2 supplements
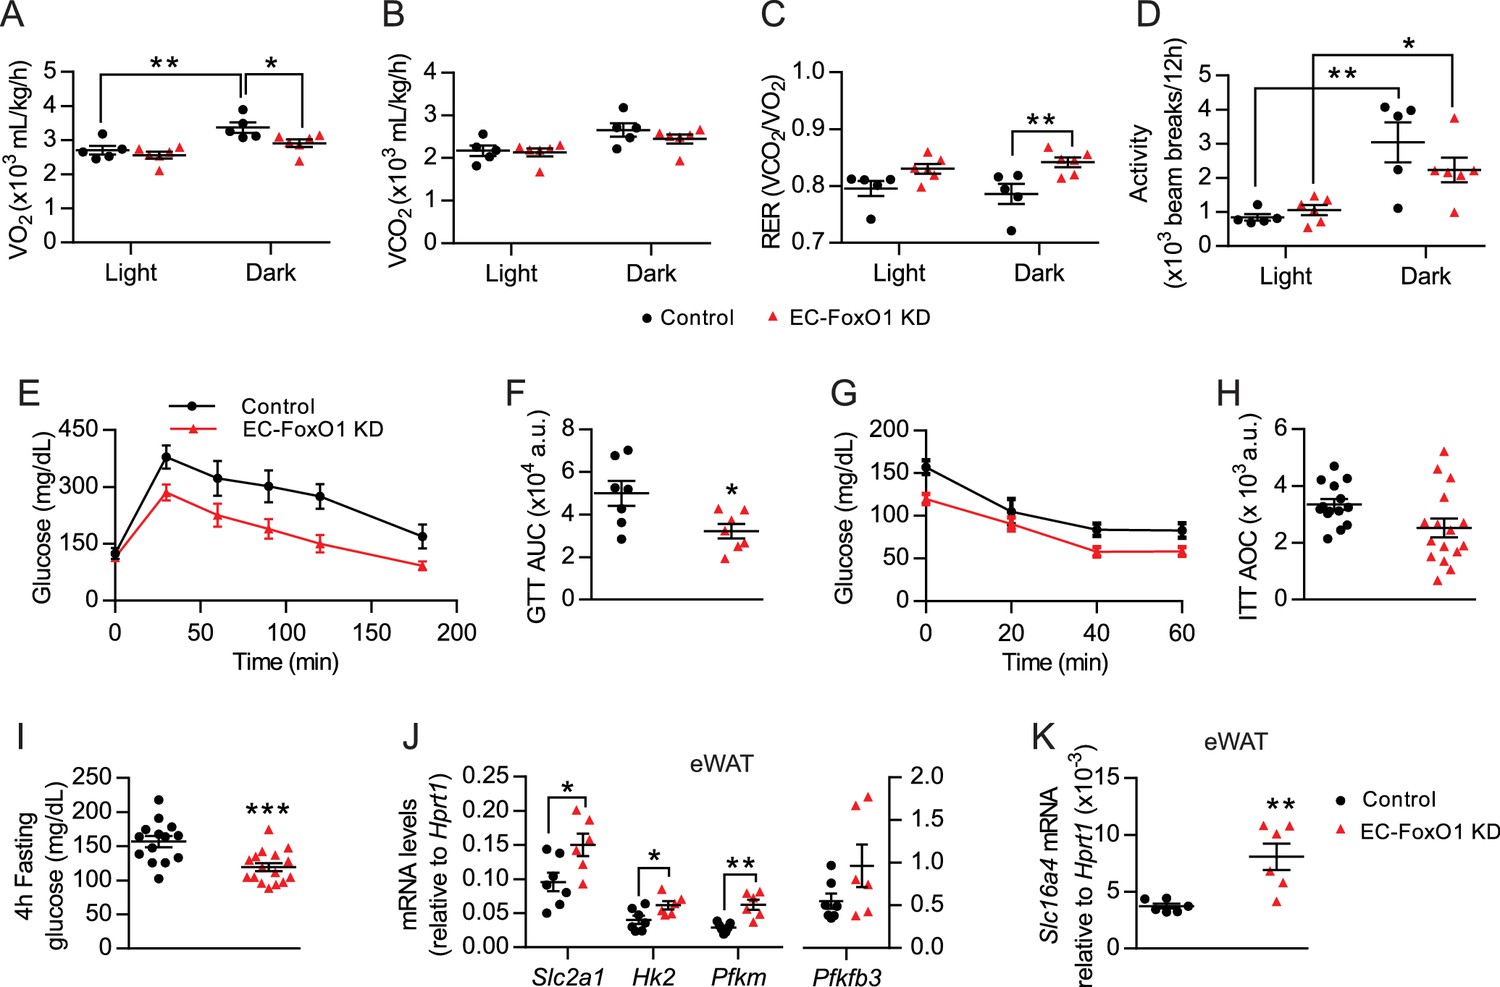
EC-Foxo1 depletion improves glucose homeostasis in HF-fed mice.
(A–D) O2 consumption (A), CO2 production (B), Respiratory exchange ratio - RER (C) and daily activity (D) were measured during indirect calorimetry tests using a comprehensive laboratory animal monitoring system (CLAMS, Control n = 5, EC-FoxO1 KD n = 6). (E) Glucose tolerance of HF-fed Control and EC-FoxO1 KD mice was examined by intraperitoneal glucose tolerance test after 15 weeks of HF diet and 16 hr fasting. (F) Area under the curve (AUC, Control n = 7, EC-FoxO1 KD n = 7). (G) Insulin sensitivity of HF-fed Control and EC-FoxO1 KD mice was assessed by intraperitoneal insulin tolerance test after 14 weeks of HF diet and 4 hr fasting. (H) Area over the curve (AOC, Control n = 14, EC-FoxO1 KD n = 16). (I) Plasma glucose levels of HF-fed Control (n = 14) and EC-FoxO1 KD (n = 16) mice after 4 hr fasting. (J–K) eWAT gene expression analysis by qPCR (Control n = 6–7, EC-FoxO1 KD n = 6). Data in all panels are expressed as mean ± SEM; *p < 0.05, **p < 0.01, ***p < 0.001, calculated with two-tailed unpaired t-test (F, I, J, K) or post hoc Bonferroni-corrected t-tests when a statistical significance was detected by two-way ANOVA model (A,C,D).
Figure 6—figure supplement 1
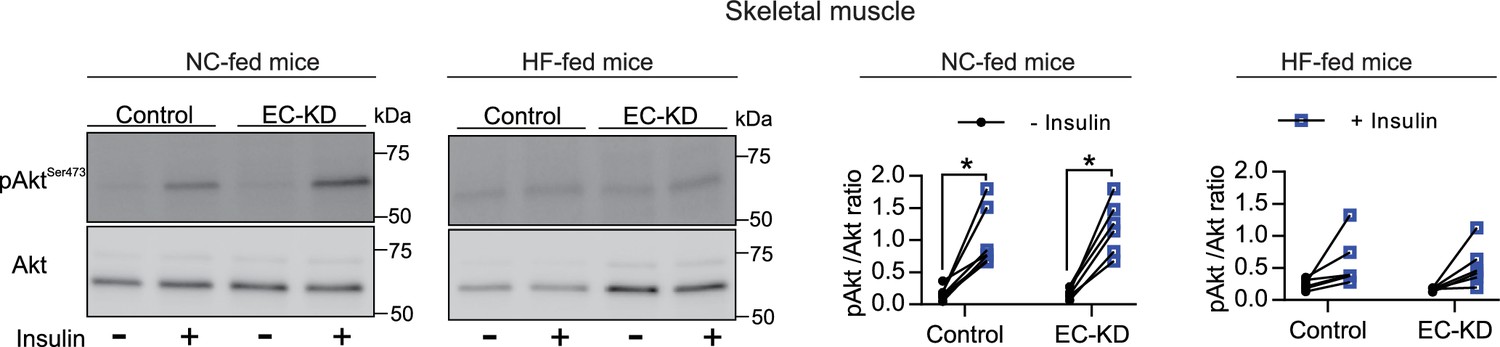
EC-Foxo1 depletion has no effect on muscle insulin sensitivity.
Control and EC-FoxO1 KD mice fed NC or HF diet for 16 weeks were analyzed for muscle insulin sensitivity. Representative Western blot images (top) and quantitative analysis (bottom) of pSer473-Akt and total Akt levels in EDL muscle before and after in vivo insulin injection. Results are expressed relative to total Akt levels (NC-fed mice: Control n = 7, EC-FoxO1 KD n = 6; HF-fed mice: Control n = 6 and EC-FoxO1 KD n = 6). Data are expressed as mean ± SEM; *p < 0.05, calculated with two-tailed paired t-test.
Figure 6—figure supplement 2
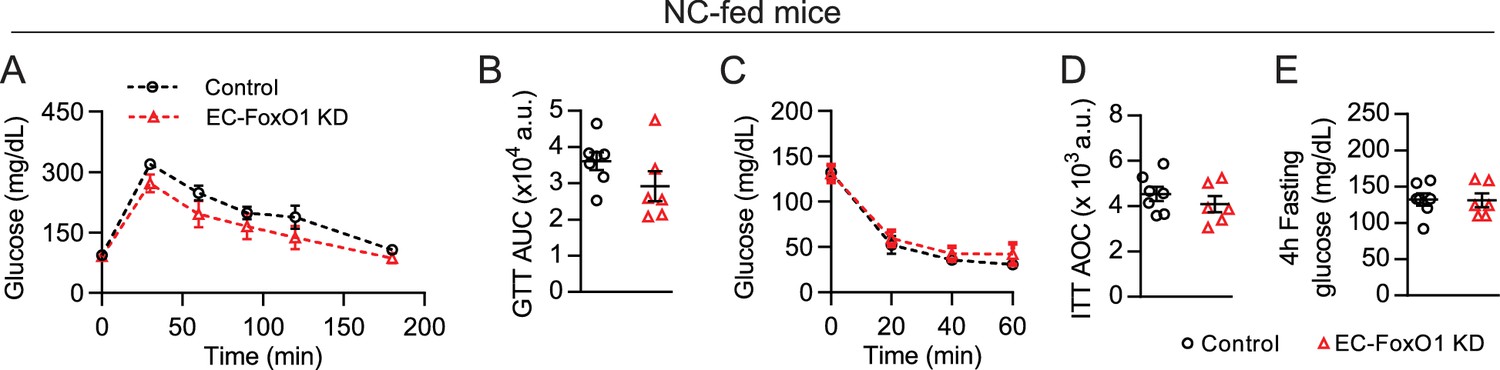
EC-Foxo1 depletion does not affect glucose homeostasis in NC-fed mice.
Glucose metabolism was assessed in Control and EC-FoxO1 KD mice after 16 weeks of NC diet. (A) Glucose tolerance of Control and EC-FoxO1 KD mice was examined by intraperitoneal glucose tolerance test after 15 weeks of NC diet and 16 hr fasting (Control n = 7 and EC-FoxO1 KD n = 6). (B) Area under the curve (AUC). (C) Insulin sensitivity of Control and EC-FoxO1 KD mice was assessed by intraperitoneal insulin tolerance test after 14 weeks of NC diet and 4 hr fasting. (D) Area over the curve (AOC, Control n = 7 and EC-FoxO1 KD n = 6). (E) Plasma glucose levels after 4 hr fasting (Control n = 7 and EC-FoxO1 KD n = 6). Data in all panels are expressed as mean ± SEM.
Figure 7
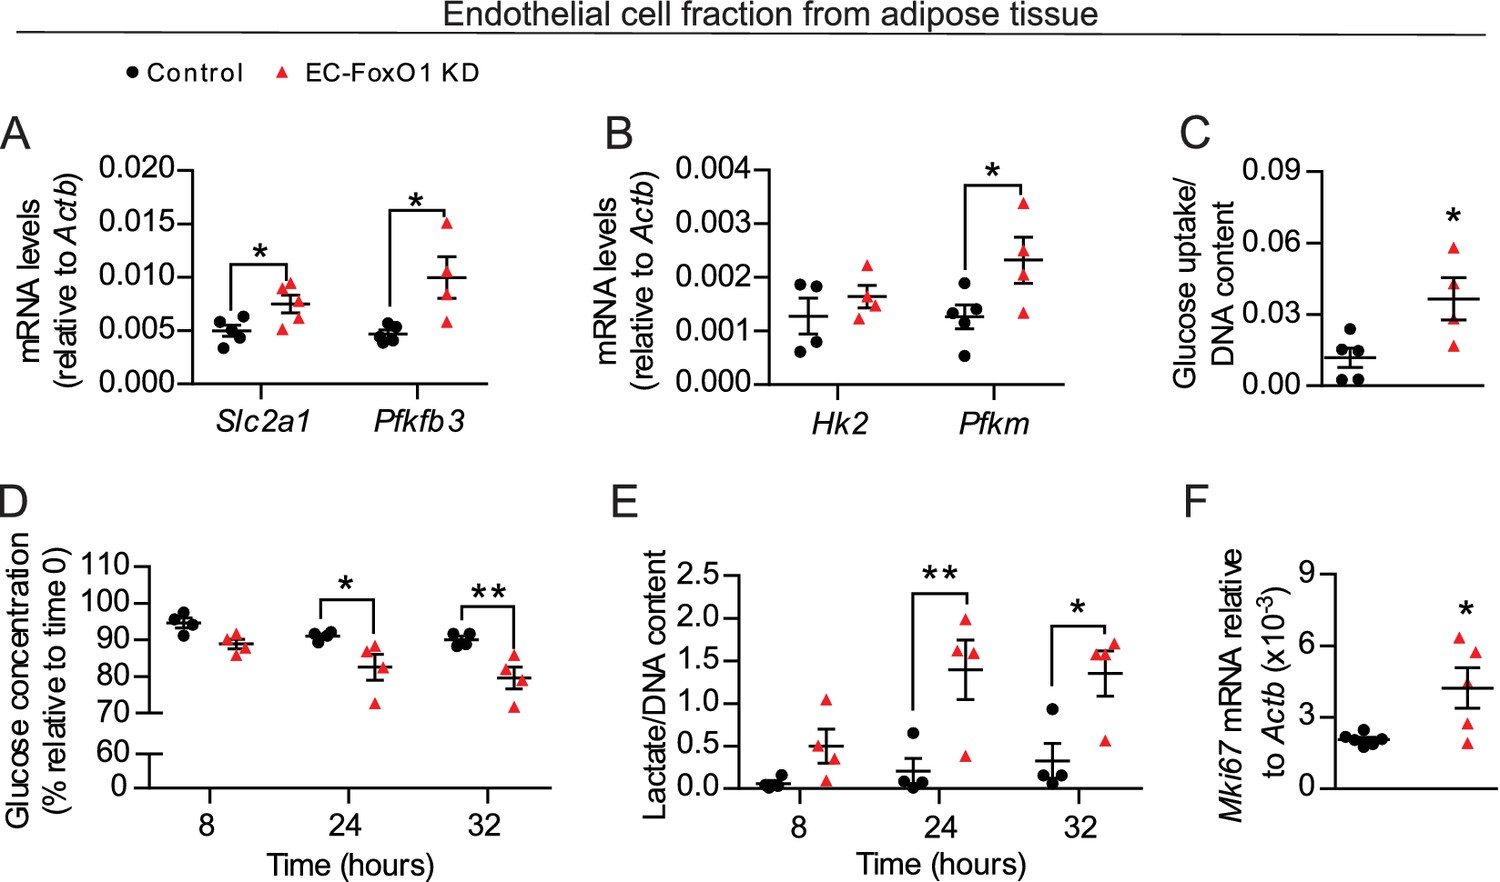
FoxO1 is a critical regulator of glucose metabolism in EC.
(A, B, F) Gene expression analysis of EC fraction from adipose tissue from Control (n = 3–6) and EC-FoxO1 KD (n = 4–5) mice fed a HF diet for 7 weeks. (C–E) Increased glucose uptake (C) glucose consumption (D) and lactate production (E) in EC fraction from HF-fed EC-FoxO1 KD (n = 4) mice compared to Control (n = 4–5). Data in all panels are expressed as mean ± SEM; *p < 0.05, **p < 0.01, calculated with two-tailed unpaired t-test (A,B,C,F) or post hoc Bonferroni-corrected t-tests when a statistical significance was detected by two-way ANOVA model (D,E).
Figure 8 with 1 supplement
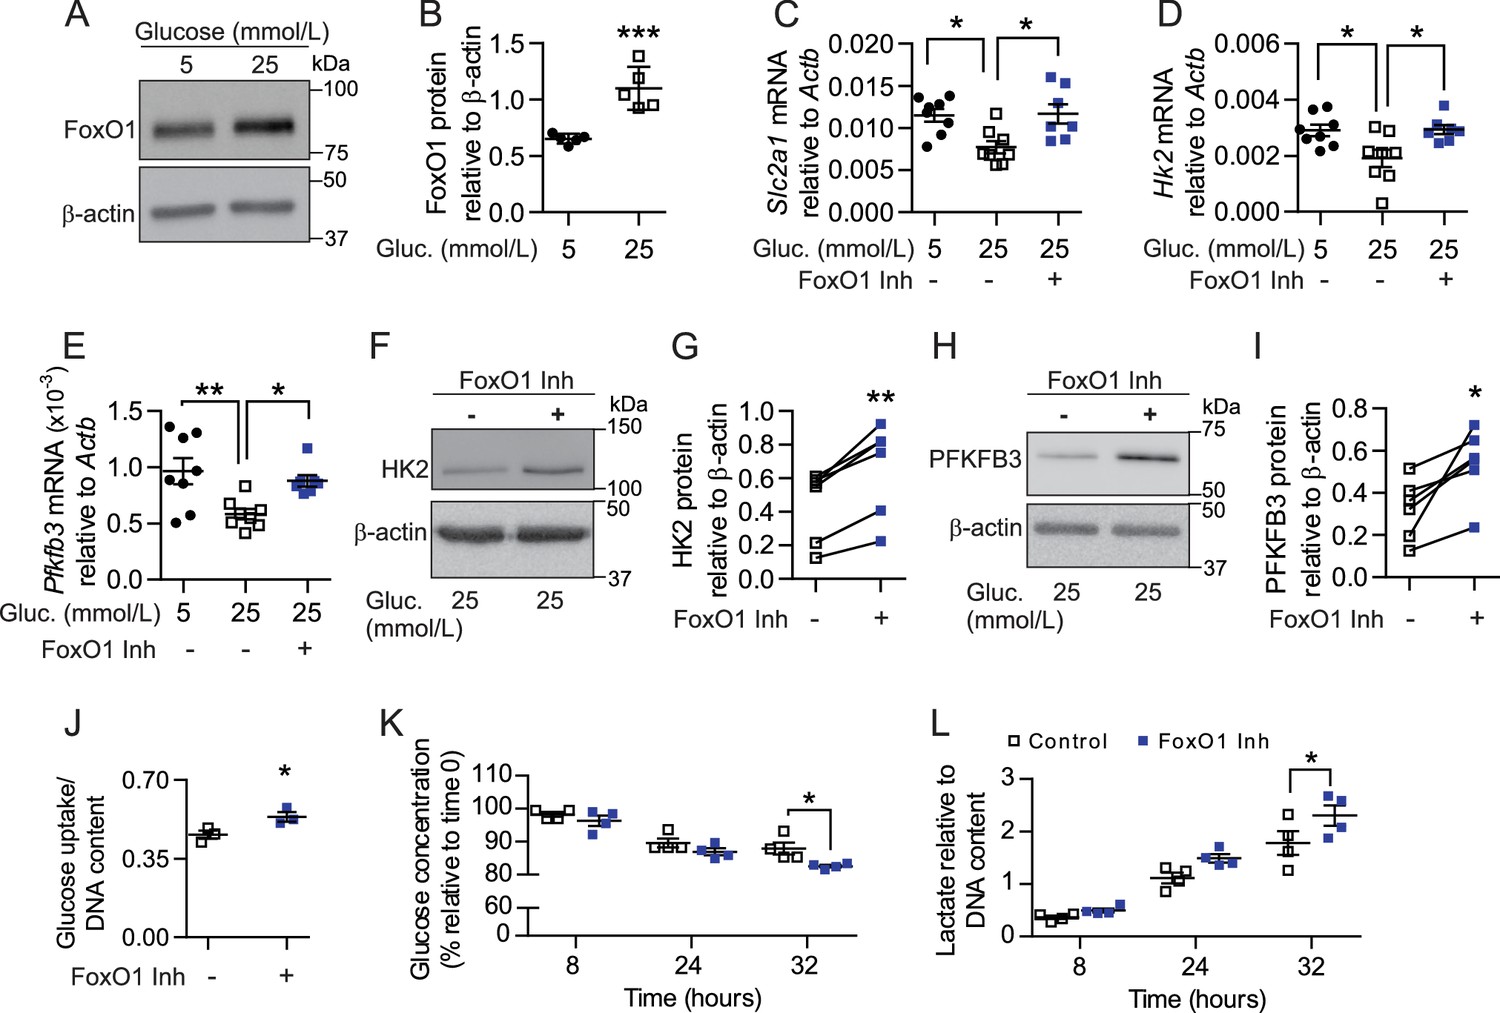
Pharmacological inhibition of FoxO1 in SMEC reproduces in vitro the endothelial phenotype observed with EC-Foxo1 depletion.
(A–B) Representative Western blot images (A) and quantitative analysis (B) of FoxO1 and β-actin levels in primary EC from skeletal muscle cultivated under low (5 mmol/L) or high (25 mmol/L) glucose conditions for 48 hr (n = 5). Results are expressed relative to β-actin levels. (C–E) Transcript analysis by qPCR of microvascular EC from skeletal muscle cultivated under low (5 mmol/L, n = 8) or high (25 mmol/L, n = 8) glucose conditions for 48 hr in the presence or absence of the FoxO1 inhibitor (1 μmol/L AS1842856, n = 7) in the last 18 hr. (F–I) Representative Western blot images and quantitative analysis of hexokinase II (HK2, (F,G), PFKFB3 (H, I) and β-actin levels in primary EC from skeletal muscle cultivated under high glucose (25 mmol/L) conditions and treated with 1 μmol/L AS1842856 for 24 hr (n = 6). Results are expressed relative to β-actin levels. (J) Glucose uptake after 18 hr treatment with 1 μmol/L AS1842856 of microvascular EC from skeletal muscle cultivated under high glucose conditions (n = 3). (K–L) Glucose consumption (K) and Lactate production (L) were assessed in SMEC in the absence or presence of 1 μmol/L AS1842856. Cells were pretreated with 1 μmol/L AS1842856 for 24 hr (n = 4). Data in all panels are expressed as mean ± SEM; *p < 0.05, **p < 0.01, ***p < 0.001, calculated with two-tailed unpaired t-test (B,J), post hoc Bonferroni-corrected t-tests when a statistical significance was detected by two-way ANOVA model (C–E, K–L) or two-tailed paired t-test (G,I).
Figure 8—figure supplement 1
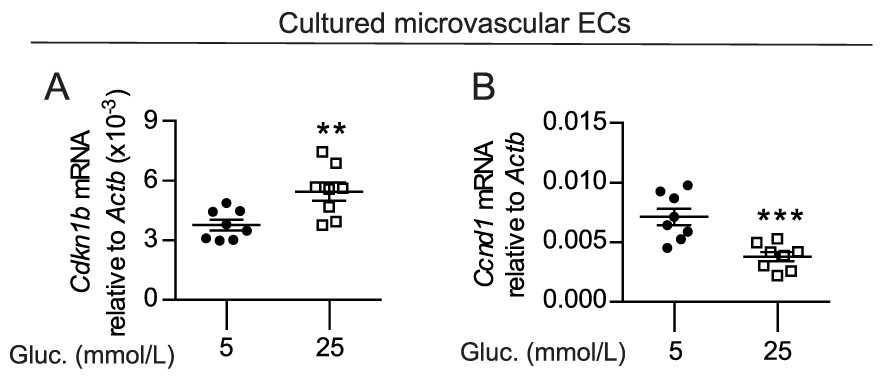
High-glucose conditions induce the expression of FoxO1 target genes.
(A–B) Gene expression analysis of cultured skeletal muscle ECs in low (5 mmol/L, n = 8) and high glucose (25 mmol/L, n = 8) conditions. Data in all panels are expressed as mean ± SEM; **p < 0.01, ***p < 0.001 calculated with two-tailed unpaired t-test.
Figure 9

EC-Foxo1,3 depletion increases vascular growth and upregulates endothelial glycolytic processes comparable to EC-Foxo1 depletion.
(A) PCR of genomic DNA from eWAT of Control (Foxo1,3f/f) and EC-FoxO1,3 KD mice using primers for the floxed and deleted alleles for each gene. (B) Foxo1 and Foxo3 mRNA levels in microvascular EC from white adipose tissue (Control n = 4, EC-FoxO1,3 KD n = 3). (C) Glucose levels after 14 weeks of HF feeding and 4 hr fasting (Control n = 6, EC-FoxO1,3 KD n = 6). (D) Endothelial cell marker Pecam1 mRNA level in skeletal muscle and eWAT of HF-fed Control and EC-FoxO1,3 KD mice (Control n = 5, EC-FoxO1,3 KD n = 5). (E–F) Gene expression analysis by qPCR of eWAT (E) and EC fraction from adipose tissue (F) of HF-fed Control (n = 3–5) and EC-FoxO1,3 KD (n = 3–5) mice. (G–H) Increased glucose uptake (G) and lactate production (H) in EC fraction from adipose tissue of EC-FoxO1,3 KD mice (n = 4) compared to Control counterparts (n = 4–5). Data in all panels are expressed as mean ± SEM; *p < 0.05, **p < 0.01, ***p < 0.001, calculated with two-tailed unpaired t-test.
Figure 10

Schematic depicting the influence of FoxO1 in controlling the response of ECs to a HF diet.
In wild-type mice, FoxO1 represses glycolysis, which prevents endothelial cell growth. This results in impaired angiogenesis during adipose tissue expansion as well as dysfunction of the adipose tissue, which consequently leads to decreased glucose tolerance and increased serum and intra-tissue levels of triglycerides. Conversely, when FoxO1 is depleted in endothelial cells, up-regulation of glycolytic genes accelerates glycolysis, which supports increased cellular metabolism, growth and proliferation. This, in turn, increases the nutrient demand of endothelial cells, resulting in higher uptake and consumption of glucose and an increased production of lactate. The accelerated endothelial cell growth ultimately preserves adipose tissue functions and promotes improved systemic glucose tolerance and lipid metabolism.
Tables
Table 1
Tissue weights of Control and EC-FoxO1 KD mice after 16 weeks of HF diet
https://doi.org/10.7554/eLife.39780.010| Control | EC-FoxO1 KD | |||
|---|---|---|---|---|
| Body weight (g) | 44 ± 1.1 | 38 ± 2.2 | ||
| eWAT (g) | 1.8 ± 0.2 | 1.6 ± 0.6 | ||
| rWAT (mg) | 881.7 ± 86.1 | 579.8 ± 98.7* | ||
| Subcutaneous adipose (g) | 2.1 ± 0.3 | 1.3 ± 0.2* | ||
| BAT (mg) | 189.2 ± 21.2 | 144.3 ± 14.8 | ||
| Liver (g) | 1.5 ± 0.1 | 1.2 ± 0.1* | ||
| Heart (mg) | 135 ± 4.2 | 126.6 ± 3.4 | ||
| Gastrocnemius (mg) | 130.9 ± 4.3 | 115.5 ± 4.4* | ||
| Soleus (mg) | 8.3 ± 0.5 | 8.0 ± 0.5 | ||
| Tibialis anterior (mg) | 44.5 ± 1.5 | 42.6 ± 1.4 |
-
eWAT: epididymal adipose tissue; rWAT: retroperitoneal adipose tissue; BAT: brown adipose tissue
Data are expressed as mean ± SEM, n = 7 per group
-
Significance was established using unpaired t-test
*P < 0.05 vs Control group
Key resources table
| Reagent type (species) or resource | Designation | Source or reference | Identifiers | Additional information |
|---|---|---|---|---|
| Strain, strain background (M. musculus, FVB/n) | Foxo1f/f (FVB-Foxo1tm1Rdp) | From the laboratory of Dr Tara L. Haas | Generated by crossing Foxo1,3,4f/f mice (FVB background; from the laboratory of Dr. Ronald A. DePinho) with FVB/n mice. | |
| Strain, strain background (M. musculus, FVB/n) | Foxo1,3f/f (FVB-Foxo1tm1Rdp; Foxo3tm1Rdp) | From the laboratory of Dr Tara L. Haas | Generated by crossing Foxo1,3,4f/f mice (FVB background; from the laboratory of Dr. Ronald A. DePinho) with FVB/n mice. | |
| Strain, strain background (M. musculus, (C57BL/6 x CBA)F2) | Pdgfb-iCre [B6-Tg(Pdgfb-icre /ERT2)1Frut] | From the laboratory of Dr. Marcus Fruttiger | The founder mouse was a kind gift from Dr. Marcus Fruttiger.. | |
| Strain, strain background (M. musculus, FVB.B6) | Foxo1iEC-D [FVB.B6-Tg (Pdgfb-icre/ERT2) 1Frut; Foxo1tm1Rdp] | This paper | Mice were generated by cross-breeding Pdgfb-iCre with Foxo1f/f mice, followed by backcrossing offspring with Foxo1f/f mice for 3 + generations | |
| Strain, strain background (M. musculus, FVB.B6) | Foxo1,3iEC-D [FVB.B6-Tg (Pdgfb-icre/ERT2) 1Frut; Foxo1tm1Rdp; Foxo3tm1Rdp] | This paper | Mice were generated by cross-breeding Pdgfb-iCre with Foxo1,3f/f mice, followed by backcrossing offspring with Foxo1,3f/f mice for 3 + generations | |
| Cell line (primary mouse adipose derived endothelial cells, male) | Endothelial cell fraction from adipose tissue | This paper | Isolated freshly for each experiment | |
| Cell line (primary mouse skeletal muscle endothelial cells, male) | Cultured microvascular EC, SMEC | This paper | ||
| Antibody | Biotin Rat Anti-Mouse CD31 | BD Pharmingen | 553371 | Cell purification |
| Antibody | MitoProfile Total OXPHOS Rodent WB Antibody Cocktail | Abcam | ab110413 | WB (1:500) |
| Antibody | Mouse Anti-β-actin | Santa Cruz Biotechnology | sc-47778 | WB (1:5000) |
| Antibody | Peroxidase AffiniPure Goat Anti-Mouse | Jackson ImmunoResearch | 115-035-003 | WB (1:10,000) |
| Antibody | Peroxidase AffiniPure Goat Anti-Rabbit | Jackson ImmunoResearch | 111-035-003 | WB (1:10,000) |
| Antibody | Purified Rat Anti-Mouse CD16/CD32 (Mouse BD Fc Block) | BD Pharmingen | 553141 | Cell purification |
| Antibody | Purified Rat Anti-Mouse CD144 | BD Pharmingen | 555289 | Cell purification |
| Antibody | Rabbit Anti-α/β-tubulin | Cell Signaling | 2148 | WB (1:1000) |
| Antibody | Rabbit Anti-Akt | Cell Signaling | 9272 | WB (1:1000) |
| Antibody | Rabbit Anti-HSL | Cell Signaling | 4107 | WB (1:1000) |
| Antibody | Rabbit Anti-Hexokinase | Cell Signaling | 2867T | WB (1:1000) |
| Antibody | Rabbit Anti-PFKFB3 | Cell Signaling | 13123S | WB (1:1000) |
| Antibody | Rabbit Anti-phospho-Akt (Ser473) | Cell Signaling | 4058 | WB (1:1000) |
| Antibody | Rabbit Anti- phospho-HSL (Ser563) | Cell Signaling | 4139 | WB (1:1000) |
| Sequence- based reagent (oligonucleotide) | oFK1ckA: GCT TAG AGC AGA GAT GTT CTC ACA TT | ThermoFisher Scientific | NA | |
| Sequence- based reagent (oligonucleotide) | oFK1ckB: CCA GAG TCT TTG TAT CAG GA AAT AA | ThermoFisher Scientific | NA | |
| Sequence- based reagent (oligonucleotide) | oFK1ckC: CAA GTC CAT TAA TTC AGC ACA TTG A | ThermoFisher Scientific | NA | |
| Sequence- based reagent (oligonucleotide) | oFK2ckA: ATT CCT TTG GAA ATC AAC AAA ACT | ThermoFisher Scientific | NA | |
| Sequence-based reagent (oligonucleotide) | oFK2ckB: TGC TTT GAT ACT ATT CCA CAA ACCC | ThermoFisher Scientific | NA | |
| Sequence- based reagent (oligonucleotide) | oFK1ckC: AGA TTT ATG TTC CCA CTT GCT TCCT | ThermoFisher Scientific | NA | |
| Peptide, recombinant protein | Humalog Insulin | Lilly | NA | |
| Commercial assay or kit | PureLink Genomic DNA Mini Kit | ThermoFisher Scientific | K182001 | |
| Commercial assay or kit | EnzyFluoTML- lactate Assay Kit | BioAssay Systems | EFLLC-100 | |
| Commercial assay or kit | Glycerol Assay Kit | Sigma- Aldrich | MAK117 | |
| Commercial assay or kit | Glucose (HK) Assay | Sigma- Aldrich | GAHK20 | |
| Commercial assay or kit | Lactate-Glo Assay | Promega | J5021 | |
| Commercial assay or kit | RNeasy Mini Kit | Qiagen | 74106 | |
| Commercial assay or kit | Triglyceride Colorimetric Assay kit | Cayman Chemical Company | 10010303 | |
| Chemical compound, drug | AS1842856 FoxO1 inhibitor | EMD Millipore | 344355 | |
| Chemical compound, drug | Isoproterenol | Tocris | 1747 | |
| Chemical compound, drug | Tamoxifen | Sigma | T5648 | |
| Software, algorithm | Image J Analysis Software | National Institutes of Health | https://imagej.nih.gov/ij/download.html | |
| Software, algorithm | GraphPad Prism Version 6.07 | GraphPad Software Inc. | https://www.graphpad.com/scientific-software/prism/ | |
| Other | 11 kcal% fat w/ sucrose Surwit Diet | Research Diets | D12329 | |
| Other | 58 kcal% fat w/sucrose Surwit Diet | Research Diets | D12331 | |
| Other | BODIPY 493/503 | ThermoFisher Scientific | D3922 | |
| Other | Dynabeads | ThermoFisher Scientific | 14311D | |
| Other | Fast TaqMan Master Mix | ThermoFisher Scientific | 4444963 | |
| Other | M-MLV reverse transcriptase | New England Biolabs | M0253 | |
| Other | Streptavidin Particles Plus - DM | BD IMag | 557812 | |
| Other | Rhodamine labeled Griffonia (Bandeiraea) Simplicifolia lectin | VectorLabs | RL1102 | |
| Other | QIAzol Lysis Reagent | Qiagen | 79306 | |
| Other | SuperSignal West Pico | ThermoFisher Scientific | 34080 | |
| Other | Type I collagenase | ThermoFisher Scientific | 17100–017 | |
| Other | Type II collagenase | ThermoFisher Scientific | 17101–005 |
Additional files
-
Supplementary file 1
Supplementary Table 1.
Tissue weights of Control and EC-FoxO1,3 KD mice after 14 weeks of HF diet
- https://doi.org/10.7554/eLife.39780.019
-
Supplementary file 2
TaqMan primer sets used in gene expression analysis
- https://doi.org/10.7554/eLife.39780.020
-
Transparent reporting form
- https://doi.org/10.7554/eLife.39780.021
Download links
A two-part list of links to download the article, or parts of the article, in various formats.
Downloads (link to download the article as PDF)
Open citations (links to open the citations from this article in various online reference manager services)
Cite this article (links to download the citations from this article in formats compatible with various reference manager tools)
Endothelial-specific FoxO1 depletion prevents obesity-related disorders by increasing vascular metabolism and growth
eLife 7:e39780.
https://doi.org/10.7554/eLife.39780


