Dopamine neuron glutamate cotransmission evokes a delayed excitation in lateral dorsal striatal cholinergic interneurons
- New York State Psychiatric Institute, United States
- Columbia University, United States
- College of Staten Island, United States
- City University of New York, United States
- Northwestern University, United States
Figures
Figure 1 with 3 supplements
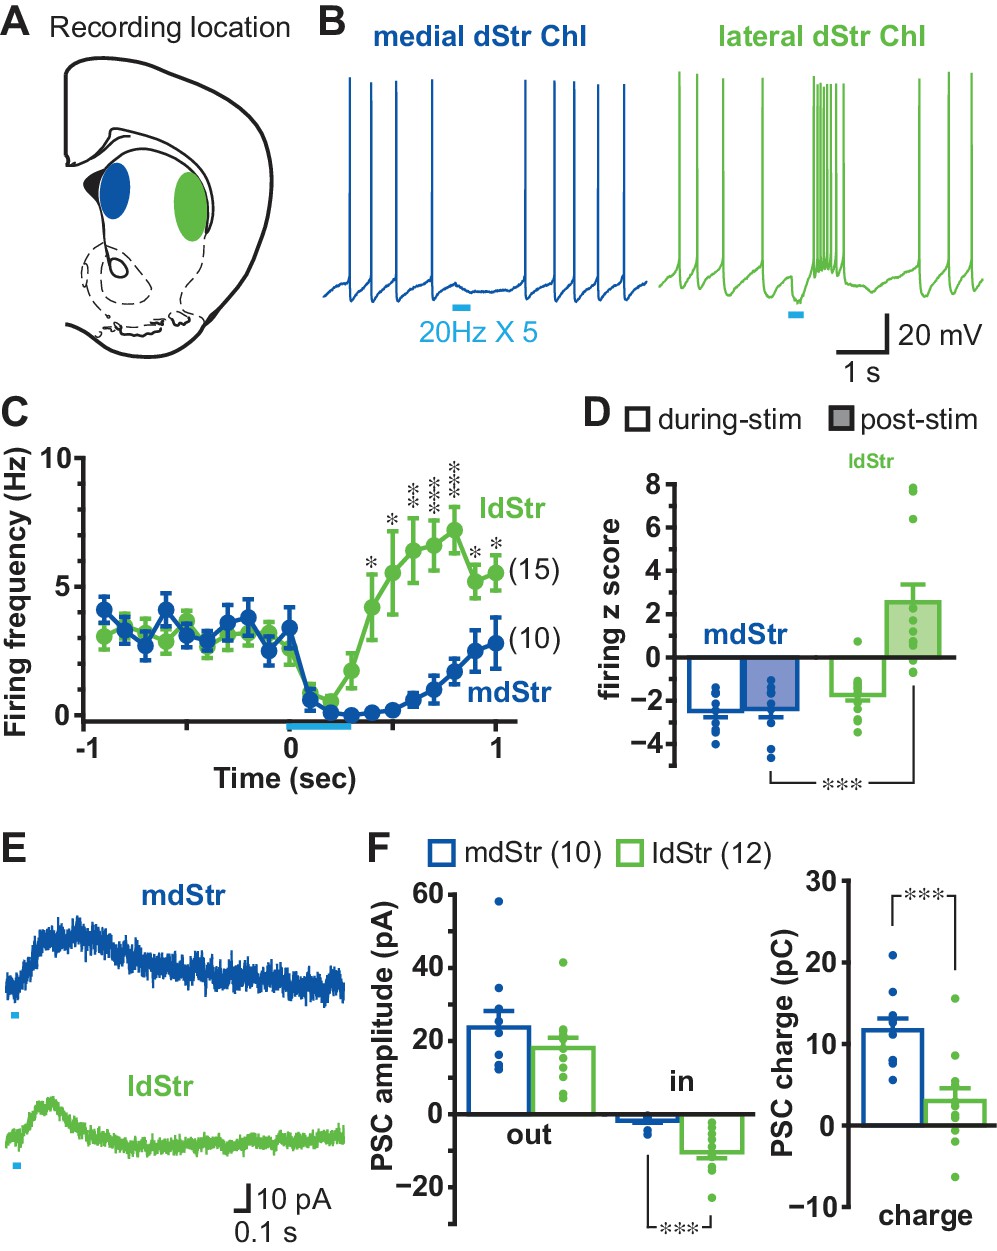
Different responses of ChIs to DA neuron terminal stimulation in the mdStr and ldStr.
(A) DA neuron terminals were activated optogenetically, and recordings made from ChIs in the mdStr (blue) or ldStr (green). (B) Train photostimulation (five pulses, 20 Hz; light blue bars) paused ChI firing in the mdStr, while it paused and then increased ChI firing in the ldStr. (C) Peristimulus firing frequencies were calculated from 10 consecutive traces (100 msec bins) for each cell, and cells pooled. mdStr and ldStr responses were significantly different (F = 8.1, p=0.000, mixed ANOVA). mdStr: n = 10 cells from nine animals. ldStr: n = 15 cells from nine animals. (D) Firing z score during photostimulation (0–0.4 s from train onset; open bars) and post (0.5–0.9 s; shaded bars), for the same cells. F = 22.9, p=0.000, mixed ANOVA; post-hoc regional comparison during-stim p=0.074, post-stim p=0.000. (E) Under voltage clamp, PSCs were evoked by single-pulse photostimulation, delivered at 0.1 Hz. Traces are the average of 10 consecutive traces. (F) Average amplitude of IPSCs (outward current), EPSCs (inward current), and synaptic response charge transfer during and following stimulation (1 s window). IPSCs showed no regional difference in amplitude (p=0.29, independent sample t-test); EPSCs showed a regional difference in amplitude (p=0.000, Welch’s t-test) and charge (p=0.001, independent sample t-test). mdStr: n = 10 cells from six animals. ldStr: n = 12 cells from eight animals. Dots in bar graphs show the average measurement from each recorded cell. Numbers of cells recorded are in parentheses. *, ** and *** indicate p<0.05, p<0.01 and p<0.001, respectively. See also Figure 1—figure supplements 1, 2 and 3.
Figure 1—figure supplement 1
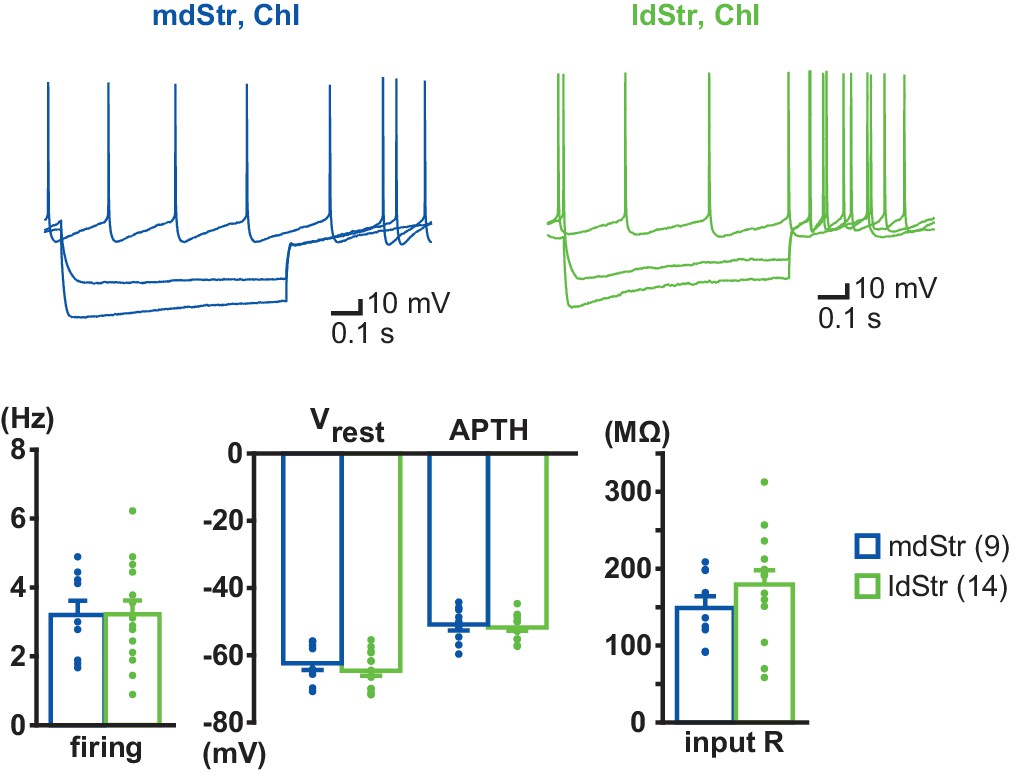
Electrophysiological properties of ChIs in the mdStr and ldStr.
Voltage responses to current steps of −400 pA, −200 pA and 0 pA were recorded in mdStr ChIs (blue) and ldStr ChIs (green). ChIs were identified by spontaneous firing and a voltage sag in response to −400 pA current injection, which was followed by rebound firing, hallmarks of Str ChIs. There were no regional differences in baseline firing (p=0.97, Welch’s t-test), resting membrane potential (Vrest; p=0.38, Welch’s t-test), action potential threshold (APTH; p=0.68, Welch’s t-test) or input impedance (input R; p=0.22, Welch’s t-test). mdStr: n = 9 cells from eight animals. ldStr: n = 14 cells from nine animals. Numbers of cells recorded are in parentheses.
Figure 1—figure supplement 2
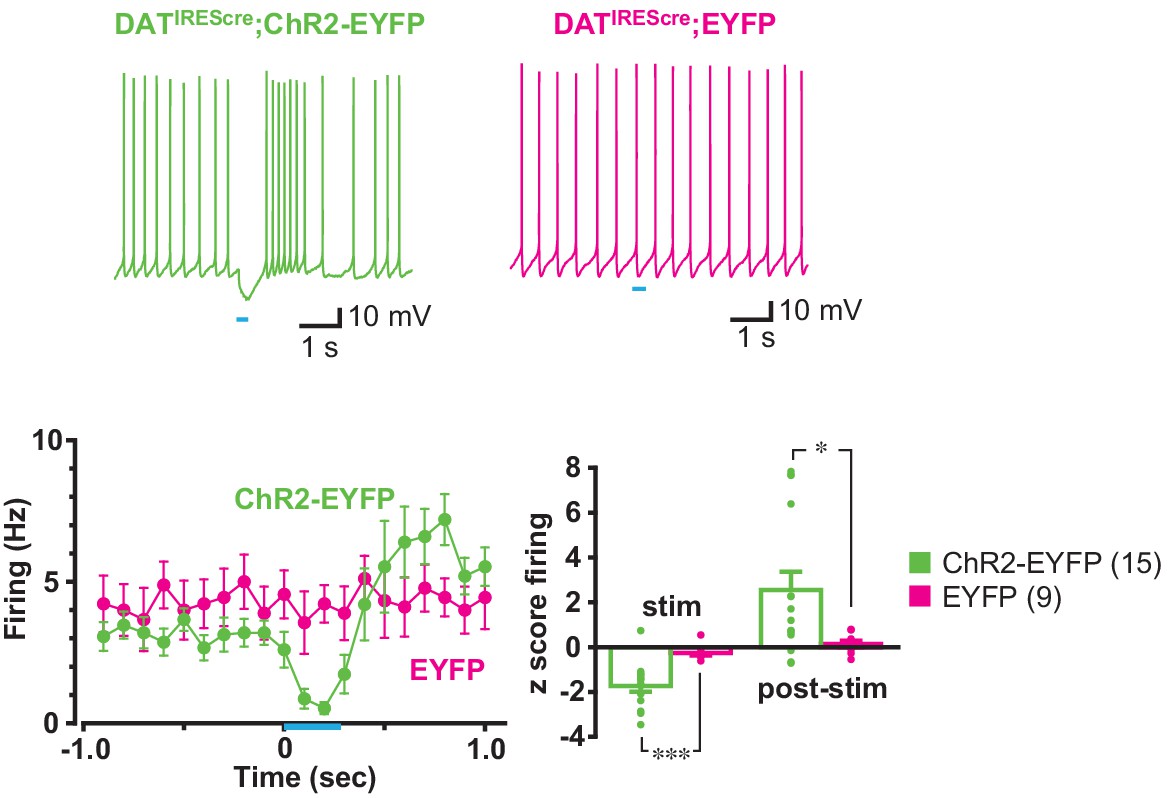
Effects of train photostimulation on firing were dependent on ChR2 expression.
Sample traces were recorded from ldStr ChIs in DATIREScre;ChR2-EYFP mice (ChR2-EYFP; green) and control DATIREScre;R26-stop-EYFP mice (EYFP; magenta), in response to train photostimulation (5 pulses at 20 Hz, starting at 0 s). ChR2-EYFP data are the same as shown in Figure 1. Peristimulus firing frequency was calculated in 100 msec bins, for 10 consecutive traces. The response in ChR2-EYFP mice differed significantly from EYFP mice (p=0.013, F = 3.82, mixed ANOVA). There was no effect of photostimulation in EYFP mice, as shown in firing z scores during (0–0.4 s from train onset) or post photostimulation (0.5–0.9 s from train onset; p=0.000, F = 3.82, mixed ANOVA, post-hoc test during-stim p=0.000, post-stim p=0.011), indicating that the response was not an artifact of blue light stimulation. ChR2-EYFP: 15 cells from nine animals. EYFP: 9 cells from three animals. Numbers of cells recorded are in parentheses. * and *** indicate p<0.05 and p<0.001, respectively.
Figure 1—figure supplement 3
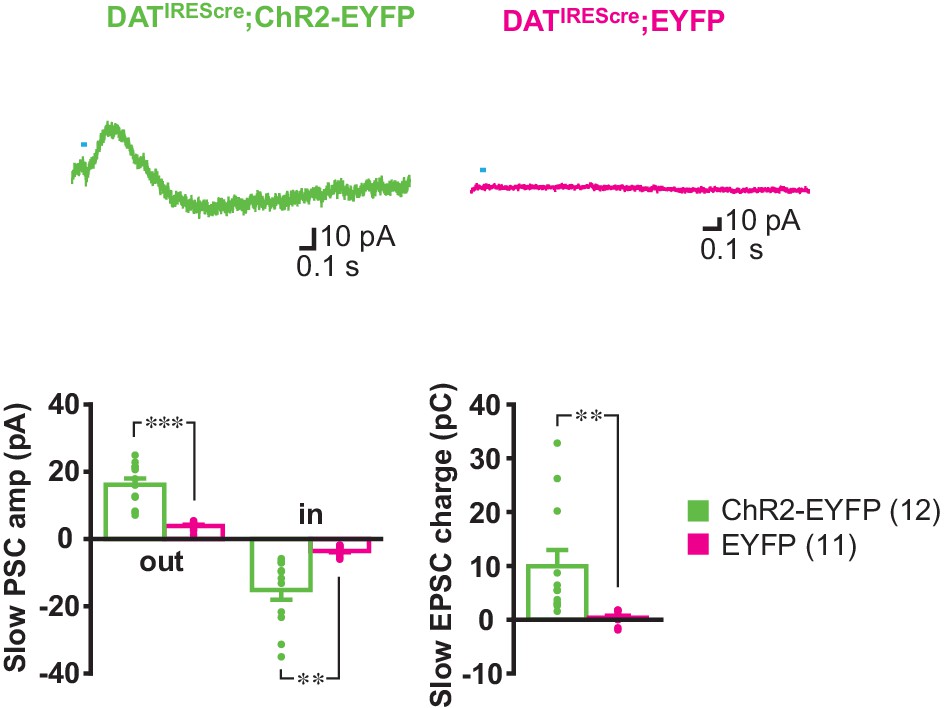
PSCs elicited by single pulse photostimulation were dependent on ChR2 expression.
PSCs were evoked by single pulse photostimulation (at 0.1 Hz) in ldStr ChIs in ChR2-EYFP but not EYFP mice. Averages of 10 consecutive traces are shown. Graphs of average PSC amplitude (outward IPSC; inward EPSC) and charge transfer (measured in a 1 s window) show the lack of a response in EYFP mice (outward p=0.000, inward p=0.002, charge p=0.009, Welch’s t-test). ChR2-EYFP: 12 cells from eight animals, EFYP: 11 cells from three animals. Dots show the average measurement for each recorded cell. Numbers of cells recorded are in parentheses. ** and *** indicate p<0.01 and p<0.001, respectively.
Figure 2
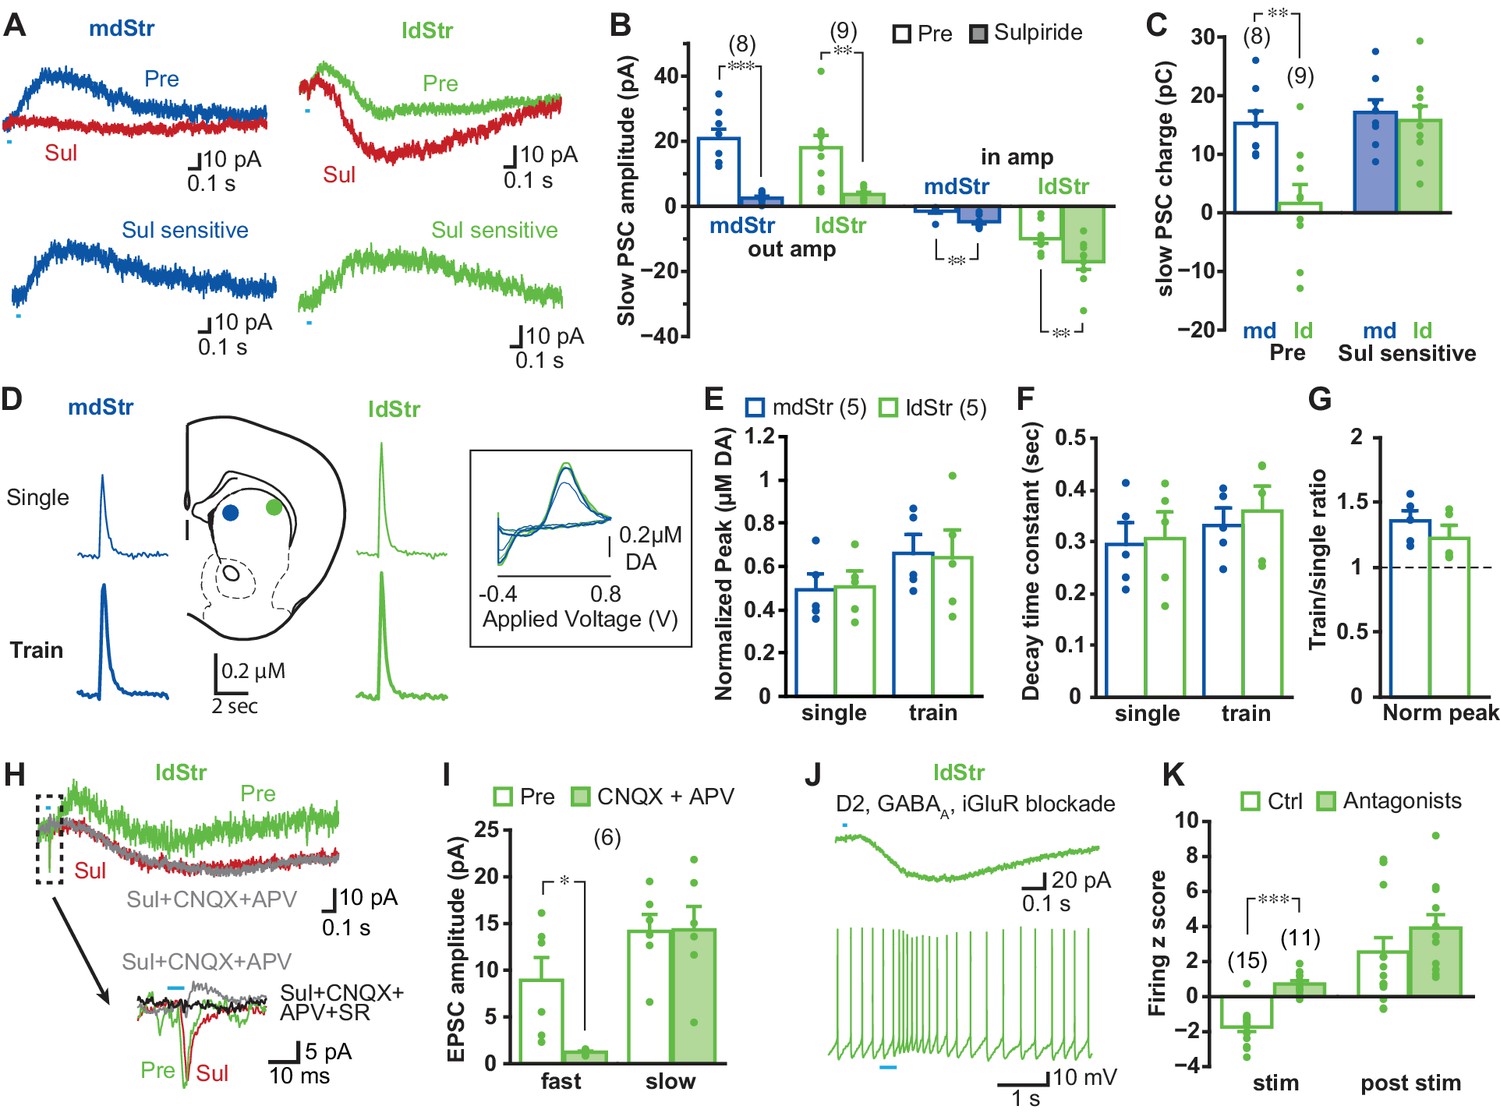
Synaptic currents underlying different ChI responses in the mdStr and ldStr.
(A) PSCs elicited by single pulse photostimulation in the mdStr (blue) and ldStr (green) before (Pre) and after sulpiride application (Sul, red). Subtraction of traces (bottom) revealed the sulpiride-sensitive D2R PSC. (B) Average amplitudes of IPSCs and EPSCs, before and after sulpiride. Comparison between pre and post sulpiride: mdStr IPSC, p=0.000; ldStr IPSC, p=0.003; mdStr EPSC, p=0.004; ldStr EPSC, p=0.006 (paired t-test). mdStr: n = 8 cells from five animals, ldStr: n = 9 cells from six animals. (C) Average PSC charge transfer in the 1.5 s post-stimulus window before sulpiride application, and the sulpiride-sensitive component in the same cells. Comparison between mdStr and ldStr: charge, p=0.003; sulpiride-sensitive component, p=0.67 (Welch’s t-test). (D) DA release was measured with FSCV, in response to single pulse (top, thin traces) and train (bottom, thick traces) photostimulation in the two subregions. Representative cyclic voltammograms are shown in the inset. (E–G) Normalized peak amplitude, decay time constant, and the ratio of train to single stimulation of DA release are plotted. Dots are measurements in single slices. Comparison between mdStr and ldStr: single peak, p=0.83; train peak, p=0.79; single tau, p=0.81, train tau p=0.37, train/single ratio p=0.33, paired t-test. n = 5 slices from five animals. (H) In the ldStr (green), after blocking the D2R component of the slow response with sulpiride (red), CNQX + APV (gray) had no impact on the slow response, but blocked the initial fast inward iGluR component (traces in dashed box are shown on an expanded time scale below); SR69951 blocked the remaining initial fast outward GABAA component (black trace). n = 6 cells from three animals. (I) Average amplitudes of fast and slow EPSCs before and after CNQX + APV, in the continuous presence of sulpiride. Comparison between pre and post iGluR antagonists: fast EPSC, p=0.022; slow EPSC, p=0.90, paired t-test. (J) Isolation of slow EPSC in ldStr ChIs after blockade of D2, GABAA and iGlu receptors, with single pulse photostimulation (at 0.1 Hz; above), and effect of train photostimulation on firing (5 pulses at 20 Hz; bottom). (K) Firing z score during and after train photostimulation, prior to (Ctrl) and after application of a cocktail of D2 + GABAA + iGluR antagonists, recorded from different sets of neurons. Ctrl data are the same as shown in Figure 1C. Ctrl: n = 15 cells from nine animals. Antagonists: n = 11 cells from seven animals. Comparison between pre and post antagonists: during stim p=0.000, post stim p=0.25, independent sample t-test. Numbers in parentheses in B, C, I, K indicate numbers of cells recorded and in E indicate numbers of slices recorded. Dots in bar graphs show the average for each recorded cell. Sample PSC traces are the average of 10 consecutive traces. *, ** and *** indicate p<0.05, p<0.01 and p<0.001, respectively.
Figure 3
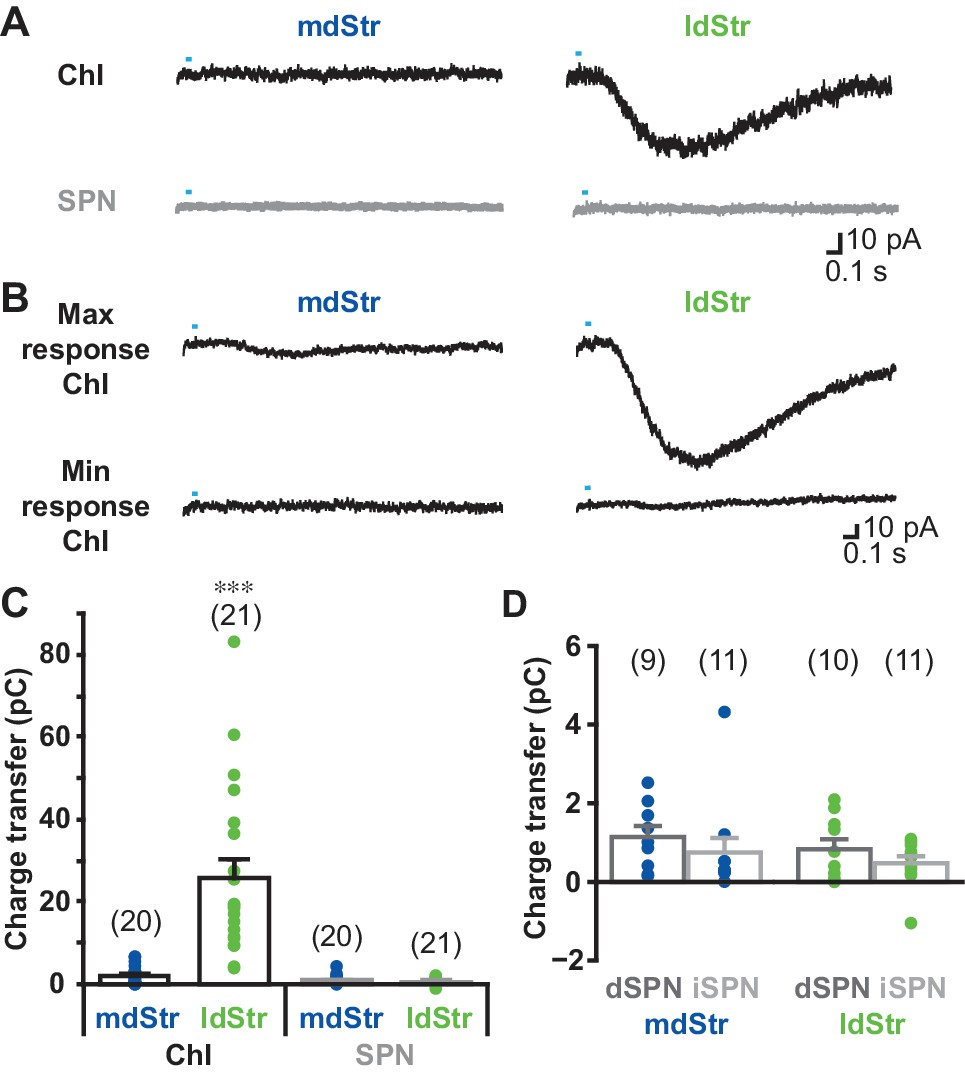
Cell type and regional distribution of slow EPSCs.
(A) Slow EPSCs were isolated with a cocktail of D2 + GABAA + iGluR antagonists, and recorded in ChIs and SPNs in the two dStr regions. Traces shown are the average of 10 consecutive responses (at 0.1 Hz). (B) The maximum and minimum responses are shown. (C) Slow EPSCs were measured as the charge transfer in a 1.5 s post-photostimulation time window. Cell type: F = 32.9, p=0.000; region: F = 26.0, p=0.000; cell type/region interaction: F = 27.3, p=0.000, two-way ANOVA. See Figure 3—source data 1 for result of post-hoc tests. ***p<0.001, ldStr ChIs compared to mdStr ChIs, mdStr SPNs or ldStr SPNs. mdStr ChI: n = 20 cells from eight animals. ldStr ChI: n = 21 cells from 10 animals. mdStr SPN: 20 cells from nine animals. ldStr SPN: 21 cells from nine animals. (D) SPNs responses shown in C are split into dSPNs and iSPNs. SPN type: F = 1.76, p=0.19; region: F = 1.08, p=0.31; SPN type/region interaction: F = 0.005, p=0.95, two-way ANOVA. mdStr dSPN: 9 cells from four animals. mdStr iSPN: 11 cells from five animals. ldStr dSPN: 10 cells from four animals. ldStr iSPN: 11 cells from five animals. Numbers of cells recorded are in parentheses. Dots show the average charge transfer for each cell recorded.
-
Figure 3—source data 1
(statistics for Figure 3C).
- https://doi.org/10.7554/eLife.39786.008
Figure 4 with 1 supplement
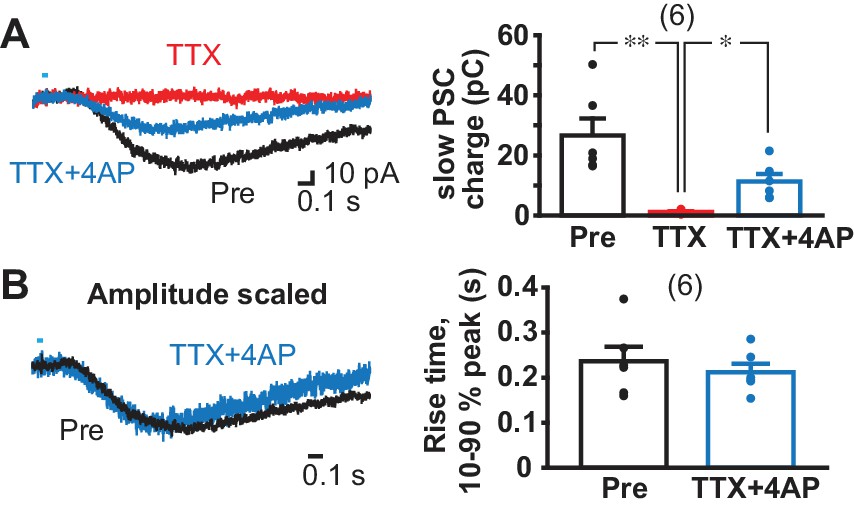
Monosynapticity of slow EPSCs.
(A) Monosynapticity of the slow EPSC was tested by TTX application (1 µM, red) followed by 4-AP (0.5 mM, blue). F = 17.3, p=0.001, one-way repeated-measures ANOVA; post-hoc comparison Pre/TTX p=0.007, TTX/TTX + 4 AP p=0.011, Pre/TTX + 4 AP p=0.014. * and ** indicate p<0.05 and p<0.01, respectively. n = 6 cells from four animals. (B) Scaling traces shown in A to compare EPSC rise time prior to and following TTX + 4 AP (p=0.29, paired t-test), indicating that the second slower component due to polysynaptic transmission was less likely. Dots show the average charge transfer for each recorded cell. Numbers of cells recorded are in parentheses. See also Figure 4—figure supplement 1.
Figure 4—figure supplement 1
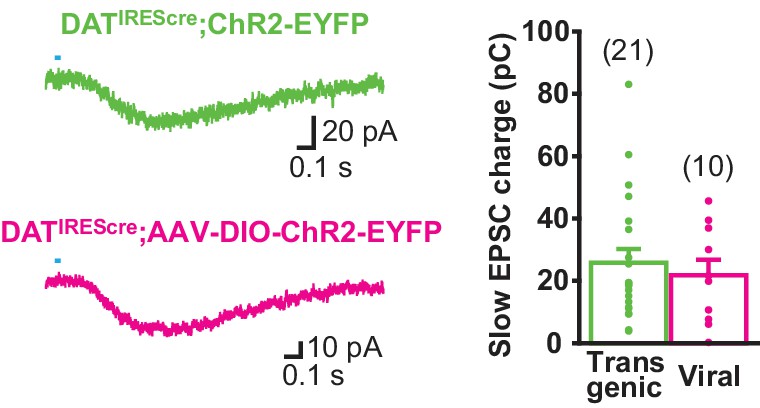
Slow EPSC is mediated by ventral midbrain DA neurons.
To confirm the origin of the slow EPSC, transgenic expression of ChR2 in DATIREScre;ChR2-EYFP mice was compared with viral expression following AAV-DIO-ChR2-EYFP injecting into the ventral midbrain of DATIREScre mice. The slow EPSC was evoked in ldStr ChIs by single pulse photostimulation. Sample traces are the average of 10 consecutive traces, with the pooled data in the graph. The data set for transgenic mice is the same as shown in Figure 3. There was no significant difference, p=0.59 (Welch’s t-test). Transgenic: n = 21 cells from 10 animals. Viral: n = 10 cells from two animals. Numbers of cells recorded are in parentheses.
Figure 5 with 1 supplement
Transmitter receptors mediating slow EPSCs.
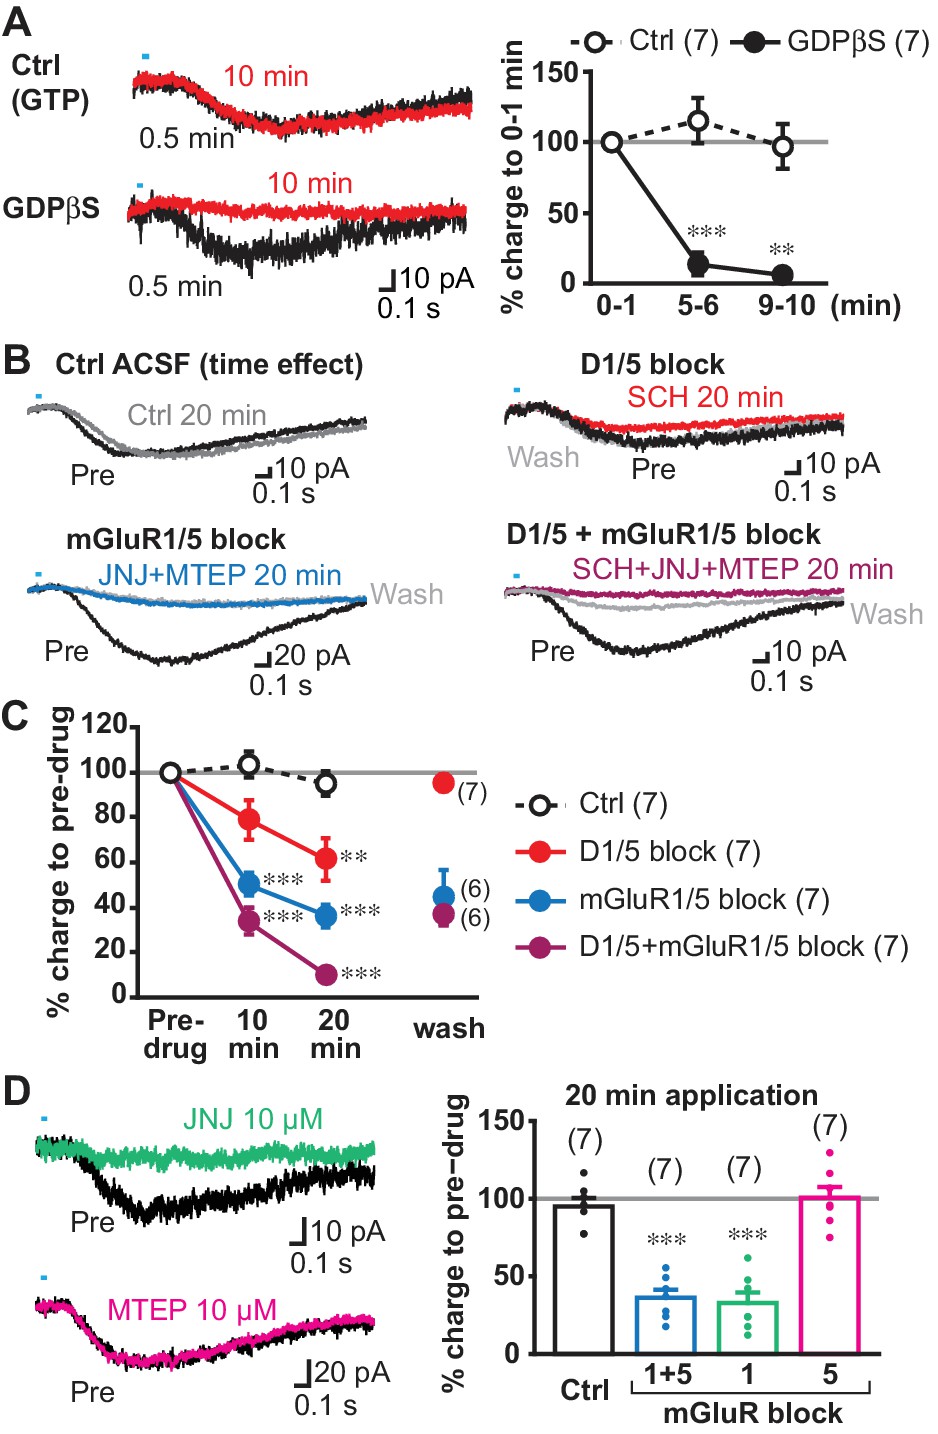
(A) G-protein mediation was tested by comparing recordings with GDPβS or GTP (Ctrl) in the intracellular solution. Sample traces are shown (left) for 0–1 min after achieving whole cell mode (average from six traces, 0.5 min; black), and then after 9–10 min after (10 min; red), allowing time for intracellular dialysis. Time course of GDPβS action is shown (right), with charge transfer normalized to the initial responses (gray line). Time/treatment interaction: F = 24.4, p=0.000 (mixed ANOVA); post-hoc comparison between subject: 5 min p=0.000, 10 min p=0.001. Ctrl: n = 7 cells from four animals, GDPβS: n = 7 cells from four animals. ** and *** indicate p<0.01 and p<0.001, respectively, compared to Ctrl. (B) Pharmacological identification of GPCRs mediating the slow EPSC. Sample traces for pre-drug application (black), and 20 min after continued perfusion of ACSF (Ctrl; top left, gray), SCH23390 (SCH, 10 µM; top right, red), a cocktail of JNJ16259685 (JNJ, 10 µM)+MTEP (10 µM; bottom left, blue) or SCH + JNJ + MTEP (bottom right, purple), and after wash (light gray). (C) Time course of antagonist actions on EPSC charge transfer are shown, followed by a wash, normalized to pre-drug control. The number of cells recorded are given in the legend; the numbers of cells with wash data are indicated on the graph. Time/treatment F = 21.4, p=0.000, mixed ANOVA. See Figure 5—source data 2 for results of post-hoc tests. Ctrl: n = 7 cells from four animals. SCH: n = 7 cells from five animals. JNJ + MTEP: n = 7 cells from four animals. SCH + JNJ + MTEP: n = 7 cells from four animals. ** and *** indicate p<0.01 and p<0.001, respectively, compared to Ctrl. (D) Identification of mGluR Group I receptor subtype. The mGluR1 antagonist JNJ significantly attenuated the slow EPSC, after 20 min (left top, green), while the mGluR5 antagonist MTEP had no effect (left bottom, magenta). Percent reduction in charge transfer is shown for JNJ (mGluR1 blockade, green) and MTEP (mGluR5 blockade, red). For comparison (right), Ctrl and mGluR1/5 20 min data points in C are replotted (white and blue bars, respectively). Comparison to pre-drug (100%) at 20 min: Ctrl p=0.40, mGluR1/5 antagonists p=0.000, mGluR1 antagonist p=0.000, mGluR5 antagonist p=0.93, one-sample t-test. Comparison among treatment at 20 min: F = 35.3, p=0.000, one-way ANOVA. See Figure 5—source data 2 for results of post-hoc tests. JNJ: n = 7 cells from four animals. MTEP: n = 7 cells from five animals. *** indicates p<0.001 compared to 100% level. Dots show the average charge transfer for each recorded cell. Numbers of cells recorded are in parentheses. See also Figure 5—figure supplement 1 and Figure 5—source data 1.
-
Figure 5—source data 1
(individual cell data for line graphs in Figure 5A and C)
- https://doi.org/10.7554/eLife.39786.013
-
Figure 5—source data 2
(statistics for Figure 5C and D).
- https://doi.org/10.7554/eLife.39786.014
Figure 5—figure supplement 1
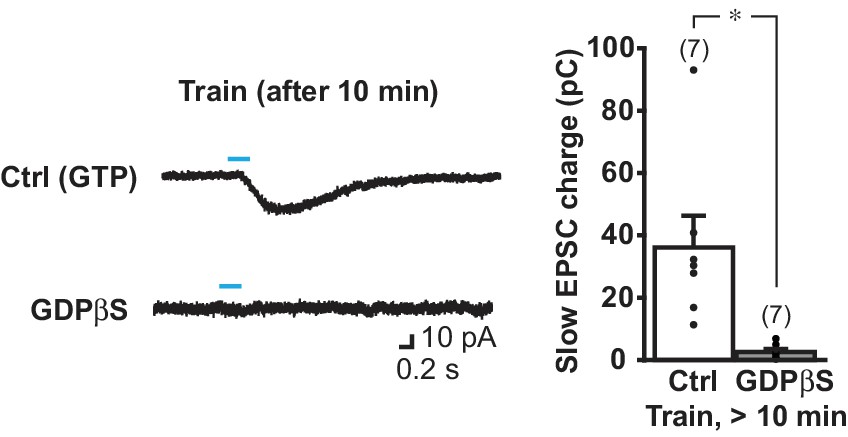
The slow EPSC is blocked completely after 10 min intracellular dialysis of GDPβS.
Slow EPSCs were evoked with train stimulation (5 pulses at 20 Hz), after 10 min recording of single-stimulus evoked responses (shown in Figure 4C). Sample traces were recorded with control pipette solution (with GTP) or with GDPβS pipette solution (bottom). The pooled charge transfer data are shown in the graph. Since train-evoked EPSCs were not recorded immediately after entering whole cell mode, the % change in charge transfer could not be calculated, so absolute charge transfer is shown. There was a significant difference by treatment, p=0.017 (Welch’s t-test). Ctrl: n = 7 cells from four animals. GDPβS: n = 7 cells from four animals. * indicates p<0.05 by independent sample t-test. Dots show the average charge transfer for each recorded cell. Numbers of cells recorded are in parentheses.
Figure 6
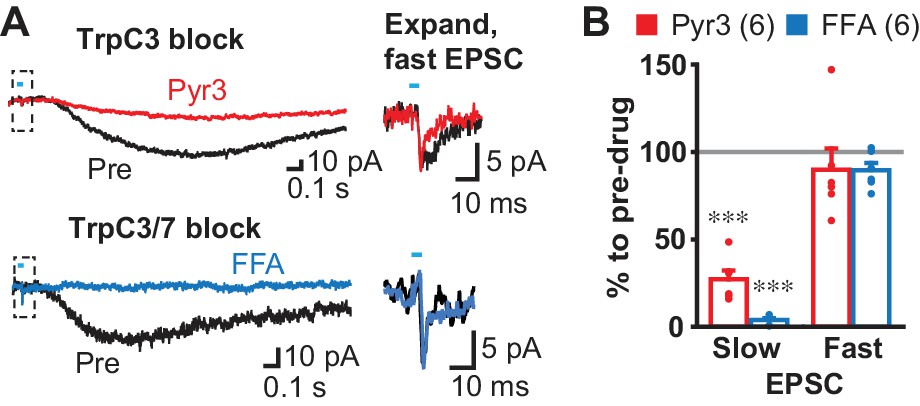
Slow EPSC effector channels.
(A) Identification of ion channels coupled to G-protein coupled receptors. D2 and GABAA antagonists were used to isolate fast and slow EPSCs. The TrpC3 selective antagonist Pyr3 (20 µM; left top, red) or TrpC3/7 antagonist FFA (100 µM, left bottom, blue) each significantly attenuated the slow EPSC. Fast EPSCs were unaffected (dashed boxes, left), as shown on an expanded time scale in right. Sample traces are the average of 10 consecutive traces. (B) Summary of drug responses. Comparison to pre-drug (100%): Pyr3 slow p=0.000, FFA slow p=0.000, Pyr3 fast p=0.44, FFA fast p=0.056, one sample t-test. Pyr3: n = 6 cells from four animals. FFA: n = 6 cells from three animals. Dots show the average charge transfer for each recorded cell. Numbers of cells recorded are in parentheses. *** indicates p<0.001 compared to 100% level. A gray line in graph indicates the pre-drug charge transfer (100%).
Figure 7
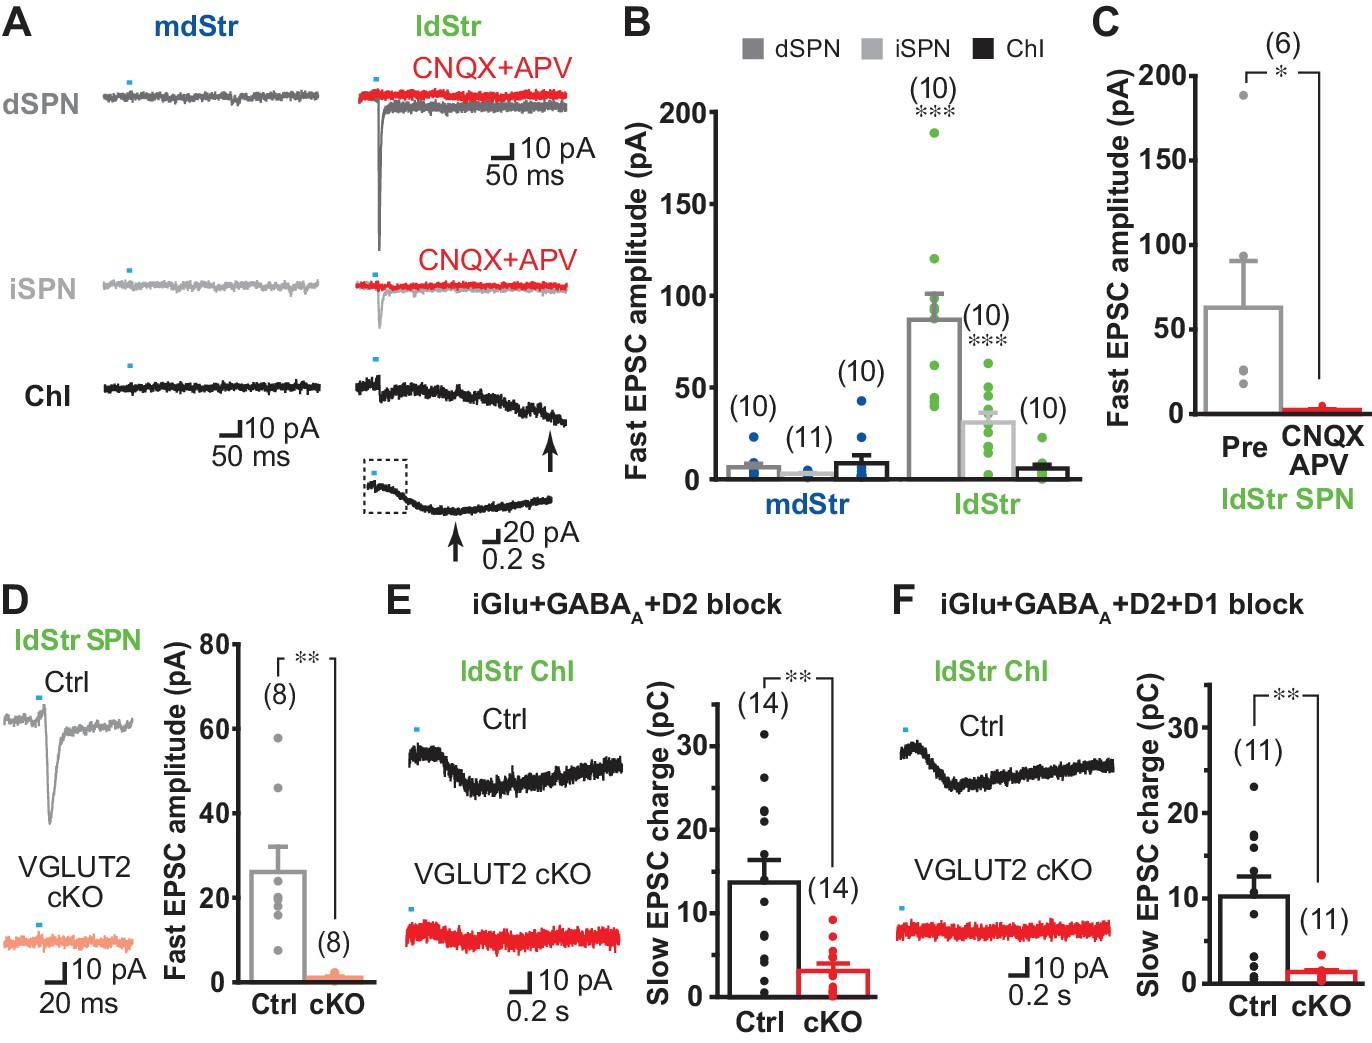
DA neuron glutamate cotransmission in the lateral dStr.
(A) Recording from dSPNs, iSPNs and ChIs in the mdStr and ldStr revealed fast EPSCs in ldStr SPNs that were blocked by CNQX + D APV (red traces). Glutamate EPSCs were pharmacologically isolated. The slow EPSC in the ldStr ChI (arrow) is shown below on a slower time scale (with the time span of the fast trace indicated by a dashed rectangle). (B) Mean amplitudes of fast EPSC are shown by cell type and subregion. Cell type: F = 19.4, p=0.000; region: F = 43.4, p=0.000; cell type/region interaction F = 20.4, p=0.000, two-way ANOVA. Post-hoc comparison between regions: dSPN p=0.000, iSPN p=0.000, ChI p=0.56. mdStr dSPN: n = 10 cells from four animals. mdStr iSPN: n = 11 cells from three animals. mdStr ChI: n = 10 cells from three animals. ldStr dSPN: n = 10 cells from four animals. ldStr iSPN: n = 10 cells from three animals. ldStr ChI: n = 10 cells from four animals. *** indicates p<0.001 compared to mdStr. (C) Fast EPSCs were blocked completely by CNQX + APV. Comparison to pre-drug (100%): p=0.000, one-sample t-test. n = 6 cells from three animals. (D–F) Fast and slow EPSCs in the ldStr recorded from mice with DA neuron selective VGLUT2 KO (cKO). (D) Fast EPSCs in ldStr SPNs are shown (left) and the average amplitude (right). Comparison between genotype: p=0.004, Welch’s t-test. n = 8 cells from two animals. (E) Slow EPSCs in ldStr ChIs isolated by application of iGluR + GABAA + D2 antagonists (p=0.001, Welch’s t-test) and (F) after addition of a D1 antagonist (p=0.003, Welch’s t-test). Ctrl (E): n = 14 cells from three animals. cKO (E): n = 14 cells from three animals. Ctrl (F): n = 11 cells from three animals. cKO(F): n = 11 cells from three animals. Dots show the average charge transfer for each recorded cell and bars the mean and S.E.M. for all recorded cells. Sample traces are the average of 10 consecutive traces. Dots show the average measurement for each recorded cell. Numbers of cells recorded are in parentheses. ** indicates p<0.01 for comparison between genotypes.
Figure 8 with 1 supplement
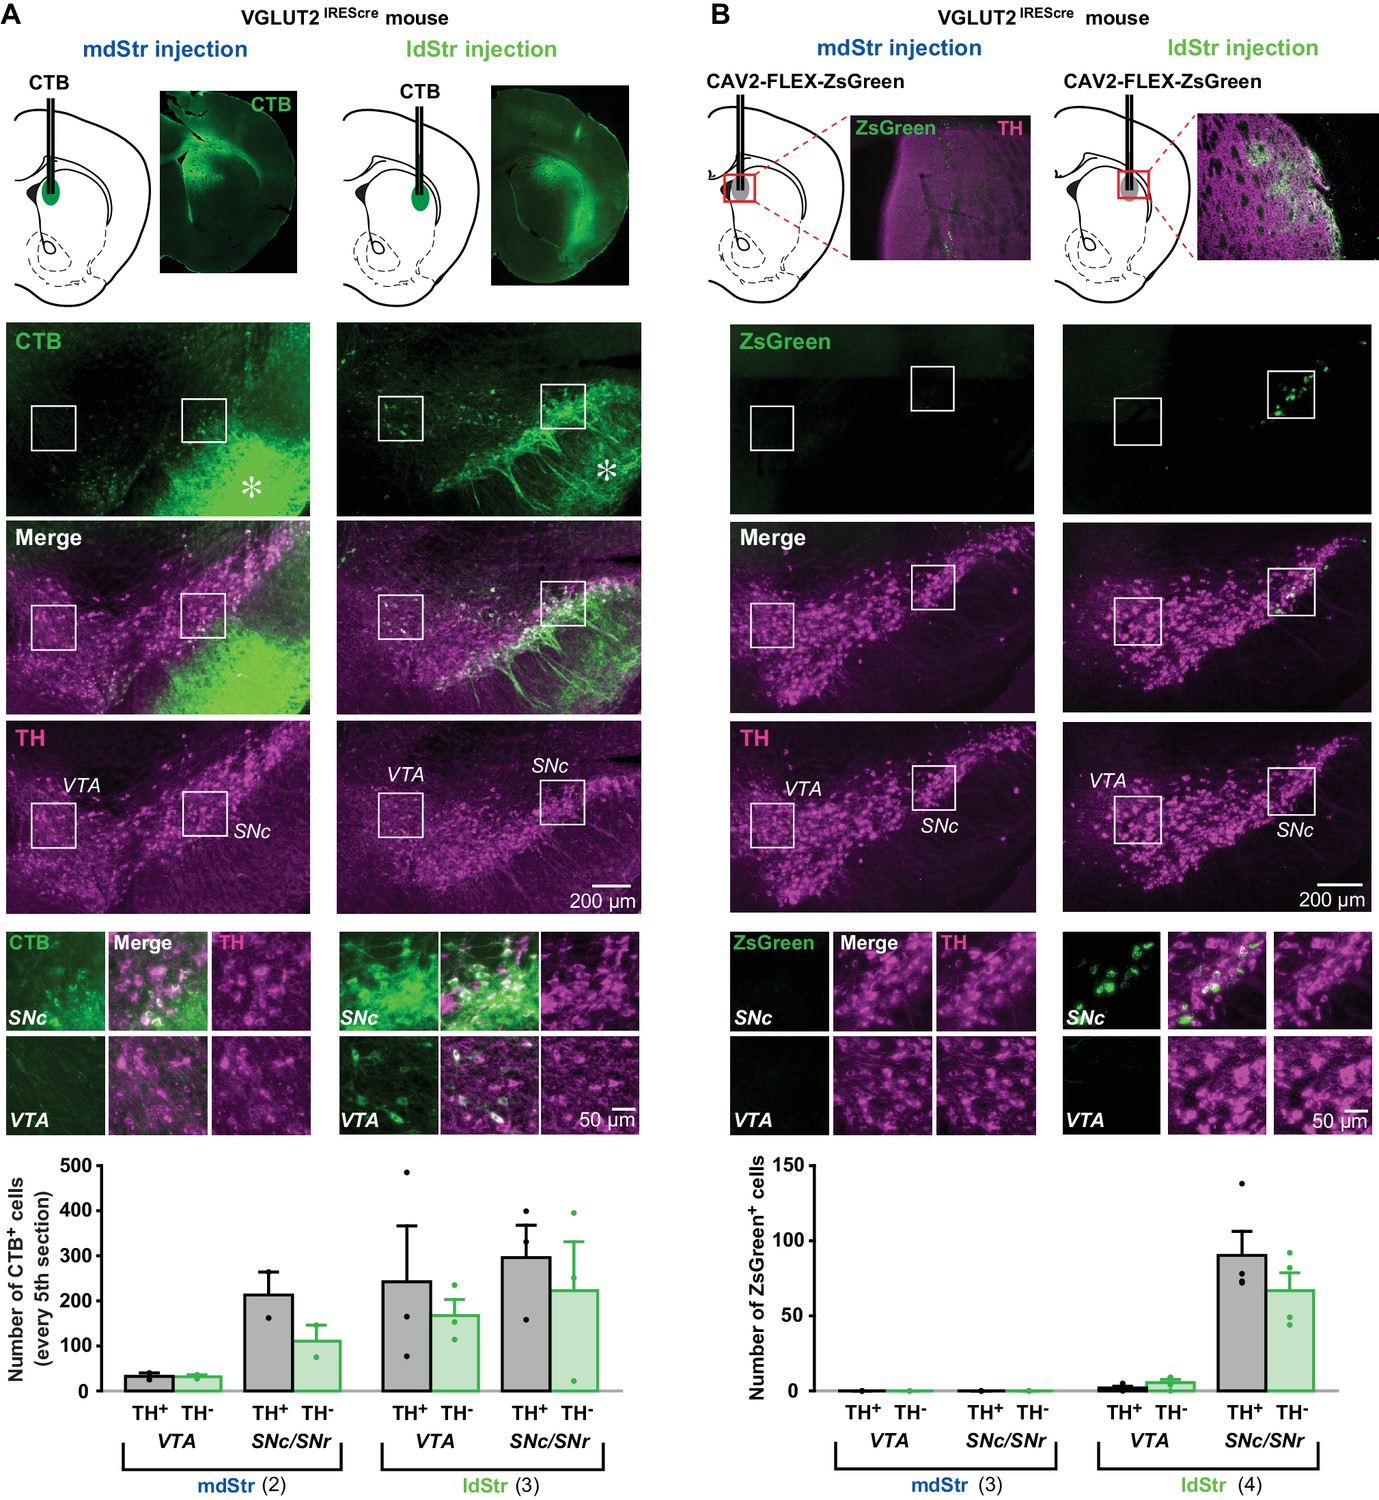
Substantia nigra DA neurons mediate glutamate cotransmission in the ldStr.
Retrograde tracer injections in the dStr of VGLUT2IREScre mice. (A) Top row shows CTB injection sites (schematics) and CTB immunostaining in the Str. The bright green diffuse staining surrounding the injection site reflects CTB uptake by locally connecting Str neurons, which are filled in their entirety. Middle three rows show low magnification images of CTB (green) and TH (magenta) staining in the VTA and SN, with merge images in between. Robust anterograde labeling of Str neuron projections is seen in the SNr (asterisks). White squares outline regions shown at higher magnification in the bottom row. (B) Top row shows CAV2-FLEX-ZsGreen injection sites and ZsGreen fluorescence of transduced VGLUT2+ neuron terminals in the Str. TH immunostaining (magenta) was done as a counterstain to show Str boundaries. Middle three rows show low magnification images of ZsGreen fluorescence (green) and TH immunostaining in the VTA and SN (magenta), with merge images in between. White squares outline regions shown at higher magnification in the bottom row. All images are in the same orientation as the schematics. Graphs show cell counts in the VTA and SN (SNc and SNr combined) for CTB and CAV2-FLEX-ZsGreen. CTB counts were made from every fifth section; ZsGreen counts were made from all sections. White bars indicate numbers of TH+/tracer+ cells; green bars indicate numbers of TH–/tracer+ cells. Dots show cell counts for each animal. Cell count for CTB: chi-square 163.0, exact significance 0.000 (Pearson’s chi-square test). Cell count for ZsGreen: injection location/cell body location interaction, F = 20.2, p=0.006 (mixed ANOVA); post-hoc comparison between injection sites: VTA p=0.16, SN p=0.011. Numbers of animals used are in parentheses. For delineation, see Figure 8—figure supplement 1.
Figure 8—figure supplement 1
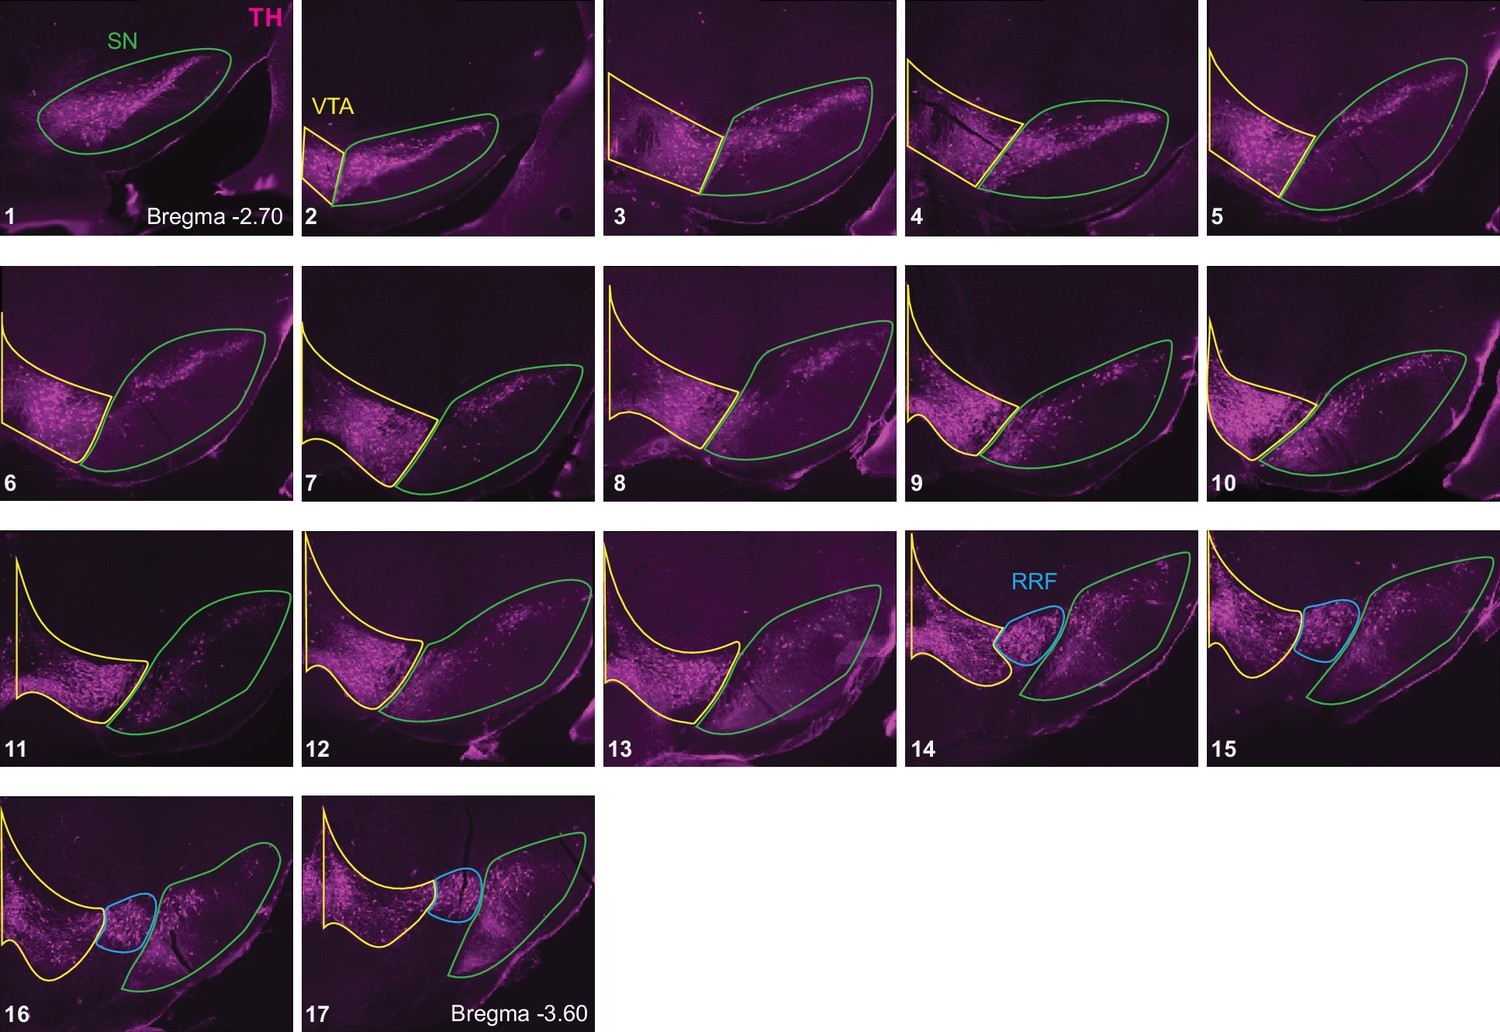
Delineation of ventral midbrain DA neuron groups.
Sequential TH stained coronal sections from one animal are shown (17 in total, numbered from anterior to posterior). SN: substantia nigra (green outline), VTA: ventral tegmental area (yellow outline) and RRF: retrorubral field (blue outline). SN includes both pars compacta and pars reticulata, because separation of these two areas in the caudal sections was not clear. There were few retrogradely labeled neurons in the RRF, so it was not included in the counts.
Figure 9
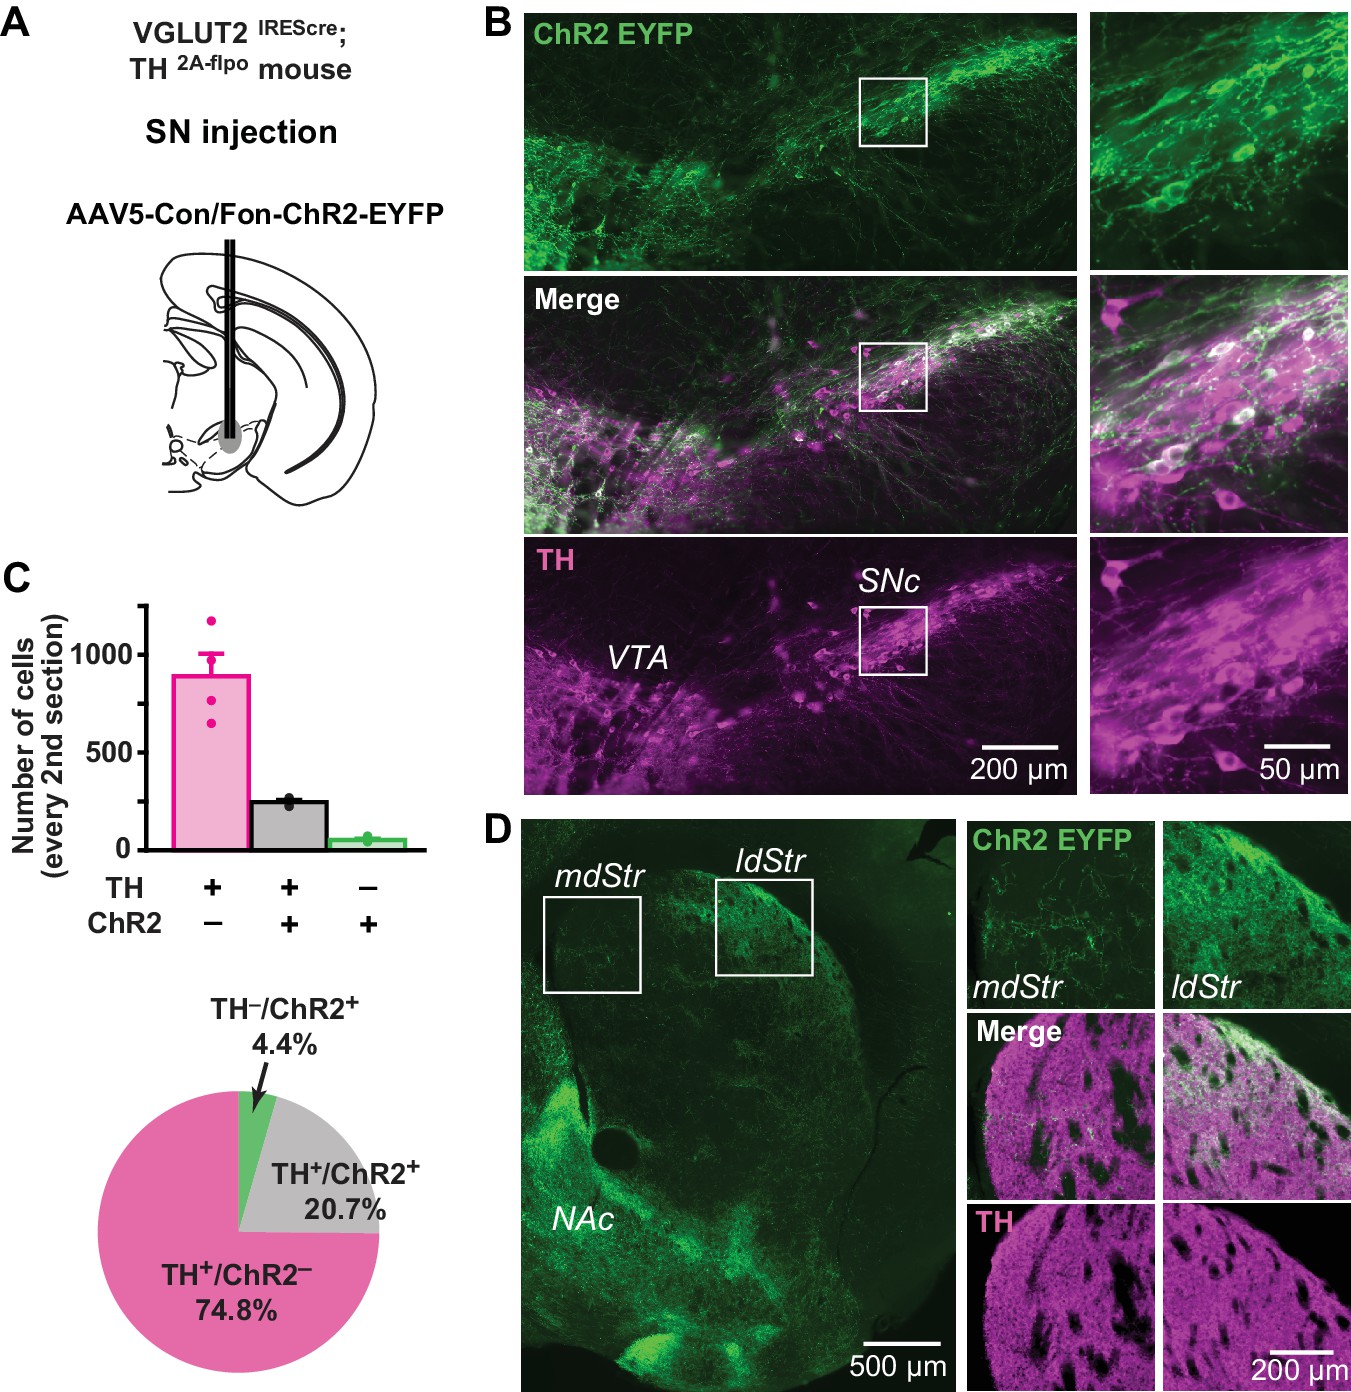
Distribution of TH and VGLUT2 coexpressing substantia nigra neurons.
(A) To visualize projections from TH/VGLUT2 coexpressing neurons, AAV-Con/Fon-ChR2-EYFP was injected in the SN of VGLUT2IREScre; TH2A-flpo double hemizygous mice. Dashed lines outline the SN and VTA. (B) Low magnification images of ChR2 (green) and TH (magenta) staining in the SN (injection site), with merge images in between. White squares outline regions shown at higher magnification on the right. (C) Top panel shows cell counts in the SN for TH+/ChR2–, TH+/ChR2+ and TH–/ChR2+ cells. Cell counts were made from every second section. Dots show cell counts for each animal. Pie chart shows the ratio of TH+/ChR2–, TH+/ChR2– and TH–/ChR2+ cells in all immunopositive cells, calculated from counts in all four animals. (D) An image of ChR2+ projection fibers (green) in the dStr, showing dense projections of TH+/VGLUT2+ fibers in the ldStr, and very sparse projections in the mdStr. Dense fibers on the bottom left are projections to the NAc, where the most prominent glutamate cotransmission is observed. White squares outline regions shown at higher magnification on the right.
Figure 10 with 1 supplement
Expression of slow EPSC mediators in ChIs.
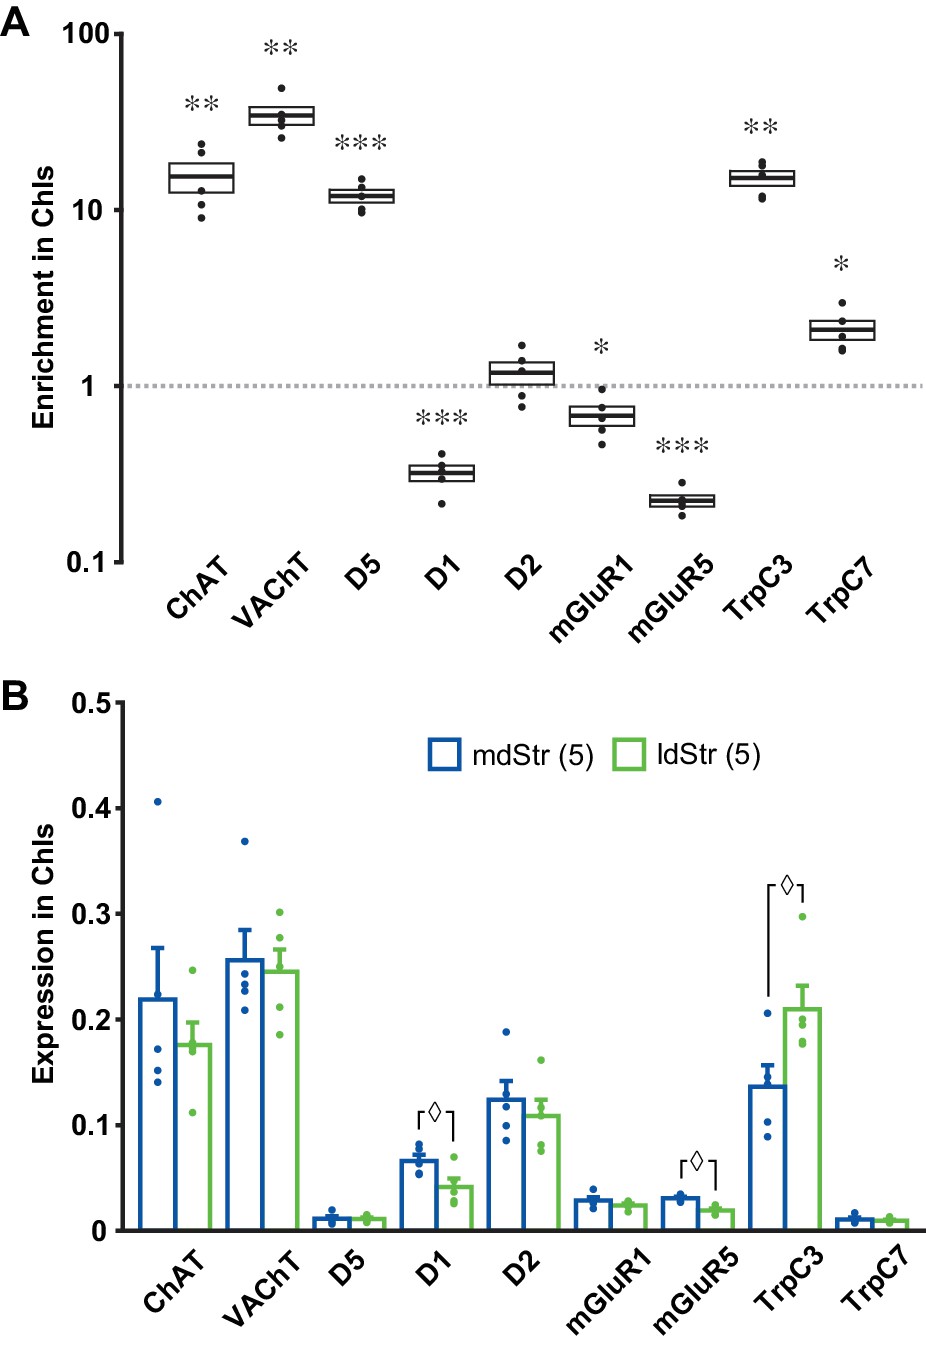
qPCR measurements of ChAT, VAChT, DA receptors, mGluR1/5 and TrpC 3/7 expression in dStr ChIs. (A) Enrichment in ChIs is shown relative to whole Str RNA (input sample). A ratio of 1 indicates that expression is the same in ChIs and all dStr cells. In box plot, the middle lines and horizontal outlines of boxes indicate means and SEM, respectively. Statistical significance was examined with one-sample t-test to 1 (no enrichment). See Figure 10—source data 1 for exact p values for each gene. *, ** and *** indicate p<0.05, p<0.01 and p<0.001, respectively, for differences from a ratio of 1. n = 5 replicates (three animals per replicate). (B) Subregional differences in expression in ChIs in the mdStr (blue) and ldStr (green) are shown, relative to a housekeeping gene (GAPDH). Regional differences were examined using a general linear model multivariate analysis. See Figure 10—source data 1 for exact F values and p values. ◊ indicates p<0.05 for comparison between the mdStr and ldStr. n = 5 replicates (shown in parentheses). Dots show the result for each replicate. See also Figure 10—figure supplement 1.
-
Figure 10—source data 1
(statistics for Figure 10).
- https://doi.org/10.7554/eLife.39786.022
Figure 10—figure supplement 1
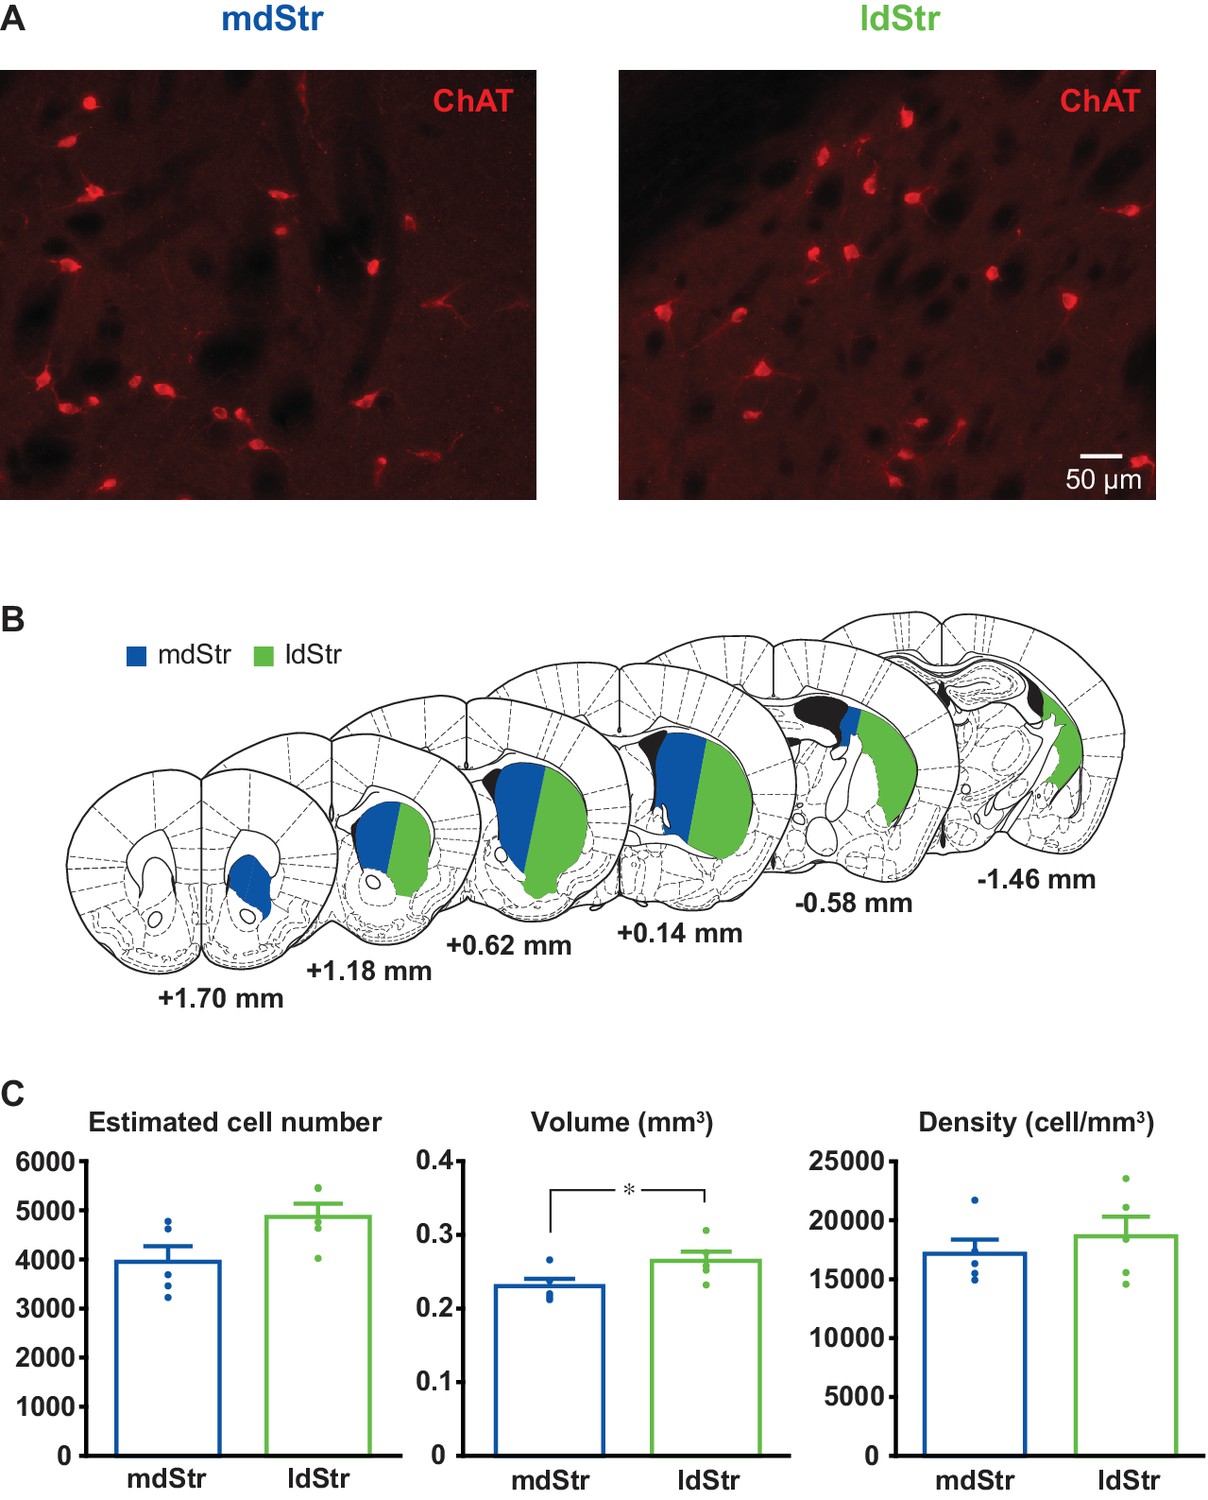
Estimation of ChI density in the mdStr and ldStr.
(A) ChIs were visualized by ChAT immunostaining. Regions of interest in the mdStr and ldStr from one section are shown. (B) Delineation of the mdStr and ldStr is shown in six coronal section outlines. (C) Unilateral stereological estimates of ChI numbers did not differ between the mdStr and ldStr. The estimated volume of the ldStr was significantly larger; however, ChI density did not differ significantly between the regions. Dots show the average measurement for each animal. n = 5 animals. Regional comparison: cell number, p=0.16; volume, p=0.032; density, p=0.61(paired t-test). * indicates p<0.05.
Figure 11

Summary of DA neuron excitatory synaptic responses in the dStr.
Transmitter release sites are shown for one presynaptic terminal per postsynaptic Str cell type. Receptors distant from postsynaptic sites have little involvement in the synaptic transmission; modulatory effects of DA and glutamate are not shown. DA neurons evoke DA signals at all their synaptic connections in both the mdStr (outlined in blue) and ldStr (outlined in green), while they evoke glutamate signals only in the ldStr. mGluR1 activates cell signaling pathways in ldStr ChIs (wavy arrows) that trigger ion flux through TrpC channels (red arrows). The present results do not distinguish between DA and Glu release from the same or different vesicles or boutons.
Tables
Key resources table
| Reagent type (species) or resource | Designation | Source or reference | Identifiers | Additional information |
|---|---|---|---|---|
| Genetic reagent (M. musculus) | B6.SJL-Slc6a3tm1.1(cre)Bkmn/J | Jackson Laboratories | RRID:IMSR JAX:006660 | henceforth DATIREScre |
| Genetic reagent (M. musculus) | B6.Cg-Gt(ROSA)26 Sortm32(CAGCOP4*H134R/EYFP)Hze/J | Jackson Laboratories | RRID:IMSR JAX:024109 | henceforth Ai32 |
| Genetic reagent (M. musculus) | B6.129 × 1- Gt(ROSA)26Sortm1(EYFP)Cos/J | Jackson Laboratories | RRID:IMSR JAX:006148 | henceforth R26-stop-EYFP |
| Genetic reagent (M. musculus) | B6.Cg-Tg(RP23-268L19- EGFP)2Mik/J | Jackson Laboratories | RRID:IMSR JAX:007902 | henceforth ChAT-eGFP |
| Genetic reagent (M. musculus) | B6.Cg-Tg(Drd1a-td Tomato)6Calak/J | Jackson Laboratories | RRID:IMSR JAX:016204 | henceforth D1-tdTomato |
| Genetic reagent (M. musculus) | Tg(Drd2-EGFP) S118Gsat/Mmnc | GENSAT | RRID:MMRRC_000230-UNC | henceforth D2-EGFP |
| Genetic reagent (M. musculus) | B6.129S4-Slc17a6tm1Rpa/J | Jackson Laboratories | RRID:IMSR JAX:007583 | henceforth VGLUT2lox |
| Genetic reagent (M. musculus) | Slc17a6tm2(cre)Lowl/J | Jackson Laboratories | RRID:IMSR JAX:016963 | henceforth VGLUT2IREScre |
| Genetic reagent (M. musculus) | TH2A-flpo | PMID:30104732 | ||
| Genetic reagent (M. musculus) | B6.FVB(Cg)-Tg(Chat-cre)GM60Gsat/Mmucd | GENSAT | RRID:MMRRC_030869-UCD | henceforth ChATcre |
| Genetic reagent (M. musculus) | B6N.129-Rpl22tm1.1Psam/J | Jackson Laboratories | RRID:IMSR JAX:011029 | henceforth RiboTag |
| Antibody | anti-TH (mouse monoclonal) | Millipore | RRID:AB_2201528; Cat.#:MAB318 | IHC (1:5000-1:10000) |
| Antibody | anti-CTB (goat polyclonal) | List Biological Laboratories | RRID:AB_10013220; Cat.#:703 | IHC (1:1000) |
| Antibody | anti-EGFP (rabbit polyclonal) | Millipore | RRID:AB_91337; Cat.#:AB3080 | IHC (1:2000) |
| Antibody | anti-ChAT (goat polyclonal) | Millipore | RRID:AB_2079751; Cat.#:AB144P | IHC (1:1000) |
| Antibody | anti-HA.11 Epitope Tag | Biolegend | RRID:AB_2565334; Cat.#:901515 | IP (1:160) |
| Antibody | anti-mouse Alexa Fluor 647 | ThermoFisher | RRID:AB_2535813; Cat.#:A-21245 | IHC, secondary (1:200) |
| Antibody | anti-goat Alexa Fluor 488 | ThermoFisher | RRID:AB_2534102; Cat.#:A-11055 | IHC, secondary (1:200) |
| Antibody | anti-goat Alexa Fluor 555 | ThermoFisher | RRID:AB_2535853; Cat.#:A-21432 | IHC, secondary (1:200) |
| Antibody | anti-rabbit Alexa Fluor 488 | ThermoFisher | RRID:AB_2535792; Cat.#:A-21206 | IHC, secondary (1:200) |
| Recombinant DNA reagent | AAV5-EF1a-DIO- hChR2(H134R)-EYFP | Vector Core Facility, University of North Carolina | www.med.unc.edu/genetherapy/vectorcore/in-stock-aav-vectors/deisseroth | |
| Recombinant DNA reagent | AAV-hSyn-Con/Fon hChR2(H134R)-EYFP-WPRE | Vector Core Facility, University of North Carolina | www.med.unc.edu/genetherapy/vectorcore/in-stock-aav-vectors/deisseroth | |
| Recombinant DNA reagent | CAV2-FLEX-ZsGreen | Larry Zweifel (University of Washington) | depts.washington.edu/zweifel/resources.html | |
| Peptide, recombinant protein | TTX (tetrodotoxin) | Ascent Scientific | Cat.#:Asc-055 | |
| Peptide, recombinant protein | CTB (cholera toxin subunit B) | List Biological Laboratories | Cat.#:104 | |
| Peptide, recombinant protein | Dynabeads Protein G | ThermoFisher | Cat.#:10004D | |
| Commercial assay or kit | RNeasy Micro Kit | Qiagen | Cat.#:74004 | |
| Commercial assay or kit | RT2 First Strand Kit | Qiagen | Cat.#:330404 | |
| Commercial assay or kit | RT2 SYBR Green qPCR Mastermix | Qiagen | Cat.#:330504 | |
| Commercial assay or kit | Custom RT2 Profiler PCR Array, 96 well | Qiagen | Cat.#:330171 (CLAM23840) | |
| Commercial assay or kit | Quanti-iT RiboGreen RNA Assay Kit | ThermoFisher | Cat.#:R11490 | |
| Chemical compound, drug | S-(-)-Sulpiride | Tocris | Cat.#:0895 | henceforth Sulpiride |
| Chemical compound, drug | CNQX | HelloBio; Tocris | Cat.#:HB0204; Cat.#:0190 | |
| Chemical compound, drug | APV | HelloBio; Tocris | Cat.#:HB0225; Cat.#:0106 | henceforth D-AP5 |
| Chemical compound, drug | SR95531 | HelloBio; Tocris | Cat.#:HB0901; Cat.#:1262 | henceforth gabazine |
| Chemical compound, drug | 4-aminopyridine | SigmaAldrich | Cat.#:A0152 | henceforth 4-AP |
| Chemical compound, drug | GDPβS | SigmaAldrich | Cat.#:G7637 | |
| Chemical compound, drug | SCH23390 | HelloBio; Tocris | Cat.#:HB1643; Cat.#:0925 | henceforth SCH |
| Chemical compound, drug | JNJ16259685 | Tocris | Cat.#:2333 | henceforth JNJ |
| Chemical compound, drug | MTEP | Tocris | Cat.#:2921 | |
| Chemical compound, drug | Pyr3 | Tocris | Cat.#:3751 | |
| Chemical compound, drug | Flufenamic acid | Tocris | Cat.#:4522 | henceforth FFA |
| Chemical compound, drug | CGP54626 | Tocris | Cat.#:1088 | |
| Chemical compound, drug | Mecamylamine | Tocris | Cat.#:2843 | |
| Chemical compound, drug | Scopolamine | Tocris | Cat.#:1414 | |
| Chemical compound, drug | QX-314 | SigmaAldrich | Cat.#:L5783 | |
| Software, algorithm | pClamp 10 | Molecular Devices | RRID:SCR_011323 | |
| Software, algorithm | Axograph X | Axograph Sciences | RRID:SCR_014284 | |
| Software, algorithm | SPSS 23 | IBM | RRID:SCR_002865 | |
| Software, algorithm | JASP 0.8.6 | JASP team, 2018 | RRID:SCR_015823 | jasp-stats.org |
| Software, algorithm | G*Power 3.1 | Heinrich Heine University Düsseldorf | RRID:SCR_013726 | |
| Software, algorithm | Igor Pro 6 | WaveMetrics | RRID:SCR_000325 | |
| Software, algorithm | MATLAB R2014b | MathWorks | RRID:SCR_001622 |
Additional files
-
Transparent reporting form
- https://doi.org/10.7554/eLife.39786.024
Download links
A two-part list of links to download the article, or parts of the article, in various formats.
Downloads (link to download the article as PDF)
Open citations (links to open the citations from this article in various online reference manager services)
Cite this article (links to download the citations from this article in formats compatible with various reference manager tools)
Dopamine neuron glutamate cotransmission evokes a delayed excitation in lateral dorsal striatal cholinergic interneurons
eLife 7:e39786.
https://doi.org/10.7554/eLife.39786


