A virus-packageable CRISPR screen identifies host factors mediating interferon inhibition of HIV
- Fred Hutchinson Cancer Research Center, United States
Figures
Figure 1 with 2 supplements

The HIV-CRISPR screen identifies gene knockouts that increase and decrease HIV infection.
(A) The deletion in the U3 region of the SIN LTR vector (lentiCRISPRv2) was repaired by inserting the full-length HIV-1LAI LTR sequence to create the HIV-CRISPR construct. (B) The ISG-targeting sgRNA library (15,348 unique sgRNA sequences) was synthesized and assembled into the HIV-CRISPR backbone to create the PIKAHIV (Packageable ISG Knockout Assembly) library. (C) THP-1 cells containing the PIKAHIV CRISPR knockout library were stimulated overnight with 1000 U/mL IFNα and infected with HIV-1LAI in duplicate infections. Viral RNA and genomic DNA were collected 3 days post infection and sgRNA sequences present in virions (vRNA) and genomic DNA (gDNA) were quantified through RT-PCR/PCR and deep sequencing. (D) Average enrichment of sgRNA sequences in the viral RNA (vRNA) was compared to their representation in the sequenced genomic DNA (gDNA) (n = 2). Y-Axis: Log2-normalized Fold Change (log2FC) of vRNA sgRNA sequences as compared to gDNA sgRNA sequences. X-Axis: random order of individual sgRNAs. The 200 non-targeting control (NTC) sgRNAs are shown in gray. The most enriched sgRNA sequences are in cyan (top 500), most depleted in orange (bottom 500). (E) MAGeCK Gene analysis was performed to identify the highest-scoring genes based on sgRNA frequencies for each gene across both replicates. An NTC gene set was created in silico by iteratively binning the 200 Non-Targeting Control sgRNA sequences into NTC Genes. Y-Axis: -log10MAGeCK Gene Score (positive). The type I IFN pathway genes IFNAR1, IRF9, STAT1 and STAT2 are shown in magenta. Non-Targeting Controls (NTCs) are in gray. Candidate Hits are cyan. The top 20-scoring genes across replicate screens are shown.
-
Figure 1—source data 1
PIKAHIV source ISGs.
Gene Symbol. Ensembl Gene ID. Gene Synonyms. Gene Info.
- https://doi.org/10.7554/eLife.39823.006
-
Figure 1—source data 2
PIKAHIV sgRNA sequences.
id.gene. guide.
- https://doi.org/10.7554/eLife.39823.007
-
Figure 1—source data 3
logFC sgRNA enrichment in wt THP-1 PIKAHIV HIV-1LAI screen.
sgRNA. gene. logFC.
- https://doi.org/10.7554/eLife.39823.008
-
Figure 1—source data 4
MAGeCK.
Gene Analysis (Positive Scores) of wt THP-1 PIKAHIV HIV-1LAI screen. Id. num. pos|score. pos|p-value. pos|fdr. pos|rank. pos|goodsgrna. pos|lfc.
- https://doi.org/10.7554/eLife.39823.009
Figure 1—figure supplement 1
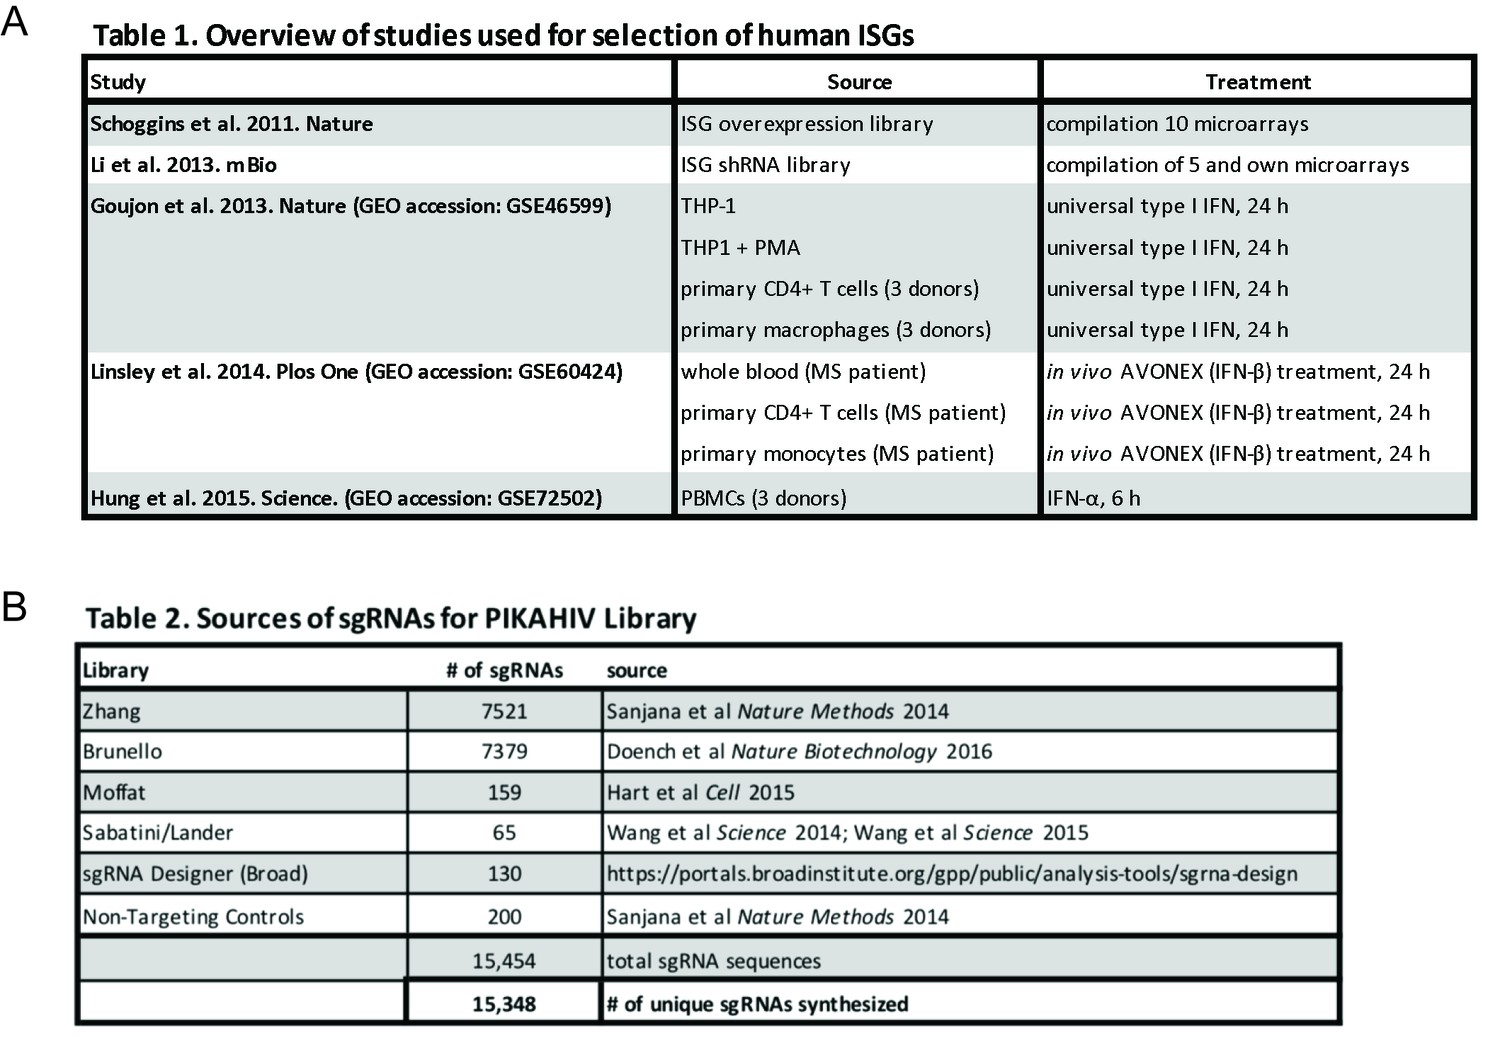
PIKAHIV ISG library gene and sgRNA selection.
(A) ISG study, source and treatment conditions for ISGs selected for inclusion in the PIKAHIV library. (B) Sources for sgRNA sequences included in the PIKAHIV library.
Figure 1—figure supplement 2
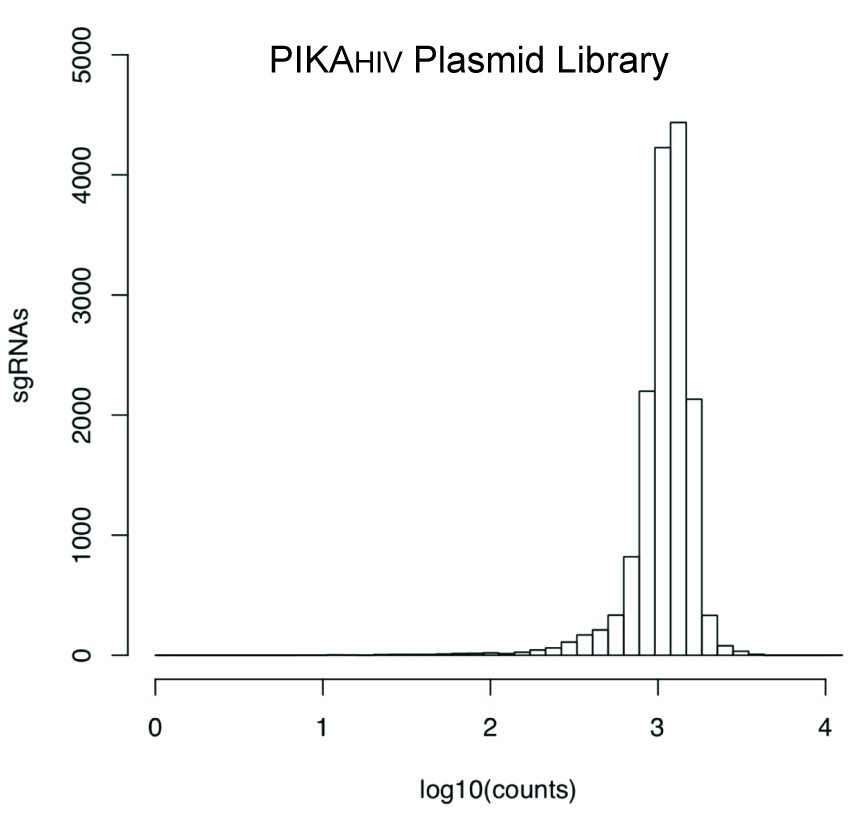
sgRNA read counts for the sequenced PIKAHIV Plasmid Library.
Individual 20bp sgRNA sequences were binned and the distribution of read counts is displayed along the X-Axis.
Figure 2 with 1 supplement
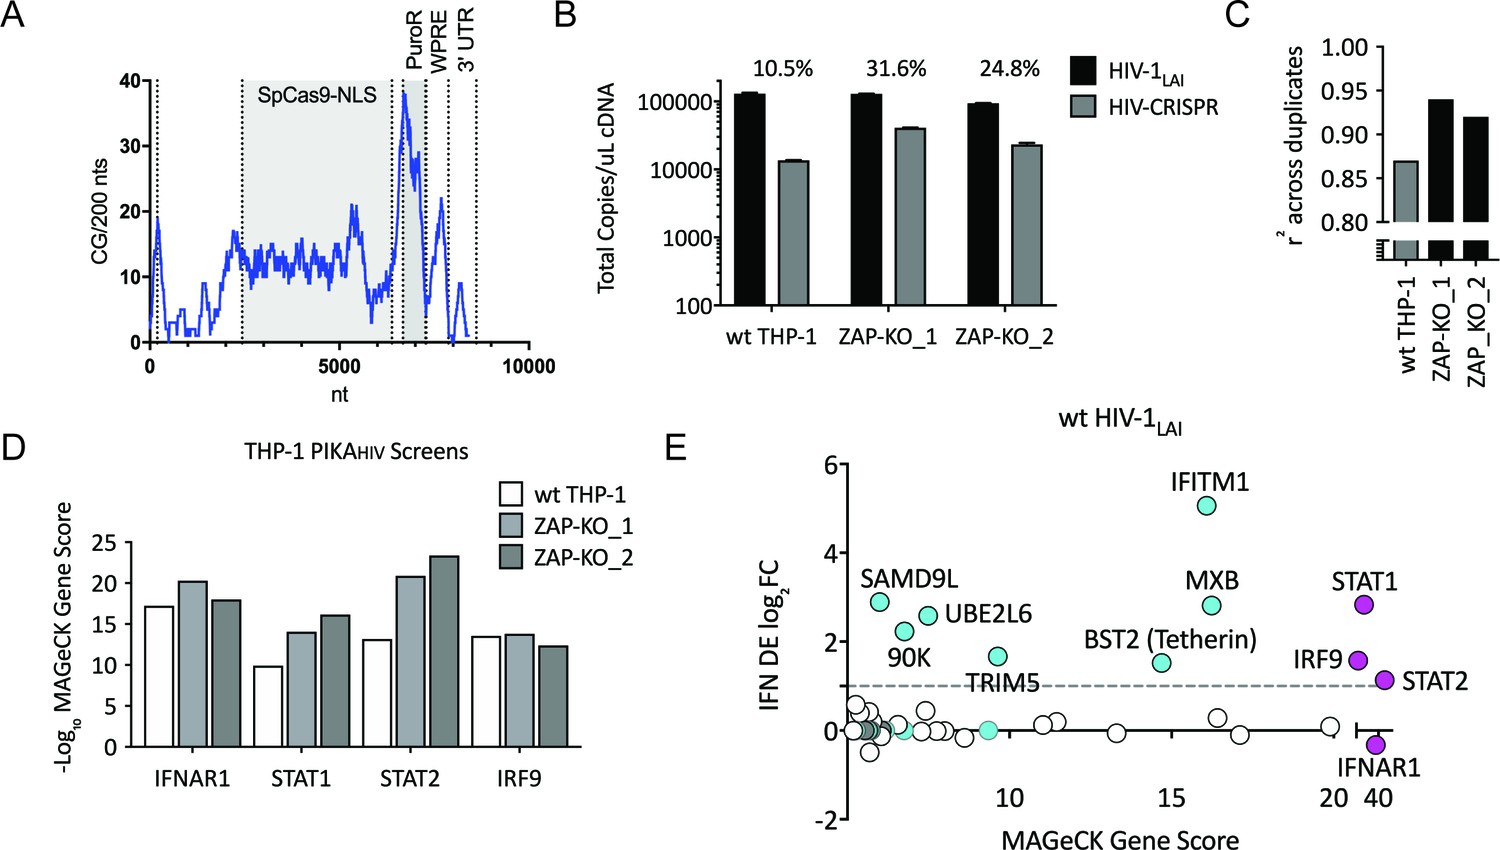
Iterative screening in ZAP-KO THP-1 cells Identifies IFNα-induced Inhibitors of HIV Replication.
(A) Sliding window analysis of CG dinucleotide content per 200 nucleotides of the HIV-CRISPR construct (blue line). The Cas9 and Puromycin coding regions are shaded gray. (B) Total copies of wt HIV genomic RNA (HIV-Pol – black bars) and HIV-CRISPR genomic RNA (cPPT-U6 – gray bars) released from wild type THP-1 cells as compared to two clonal ZAP-KO THP-1 lines (ZAP-KO_1 and ZAP-KO_2) were assayed by ddPCR using primers specific for each vector template. ddPCR on cDNA from each infection was performed in duplicate. (C) PIKAHIV screen in IFNα-treated THP-1 cells with and without endogenous ZAP expression. Data for all sgRNAs in duplicates were compared to generate an overall r2 value. Correlation of read counts across duplicate screens in each cell type (gray = wild type THP-1 cells; black = ZAP KO THP clonal lines). (D) MAGeCK Gene Scores for the type I IFN pathway genes (IFNAR1, STAT1, STAT2, IRF9) across screens in wild type THP-1 (white bars) and in two ZAP-KO clonal THP-1 lines (gray bars). (E) MAGeCK Gene Scores for Hits Identified in the THP-1 ZAP-KO cells. Positive MAGeCK Gene Scores for the results from both ZAP-KO screens was multiplied to generate a ZAP-KO MAGeCK Gene Score. Y-Axis: IFN induction (log2FoldChange) in THP-1 cells calculated from GSE46599. X-Axis: Combined MAGeCK Gene Scores for top 40 Hits in both ZAP-KO screens. Magenta: IFN pathway genes (IFNAR1, STAT1, STAT2, IRF9). Cyan: highly-IFN induced, high-scoring candidate Hits. White: other high-scoring hits which were not IFN-induced (full list in Figure 2—source data 1). High-scoring genes with no information on IFN induction in THP-1s are plotted as IFN DE log2FC = 0 but shown in Cyan with a gray outline.
-
Figure 2—source data 1
THP IFN gene induction and MAGeCK Gene Analysis (Positive Scores) of ZAP-KO THP-1 PIKAHIV HIV-1LAI screens.
TargetID. log2FC IFN. ZAPKO11_uIFN-ZAPKO11_THP.gDNA.pos.score. ZAPKO46_uIFN-ZAPKO46_THP.gDNA.pos.score. ZAPKO x2 uIFN. NegLog10.
- https://doi.org/10.7554/eLife.39823.012
Figure 2—figure supplement 1
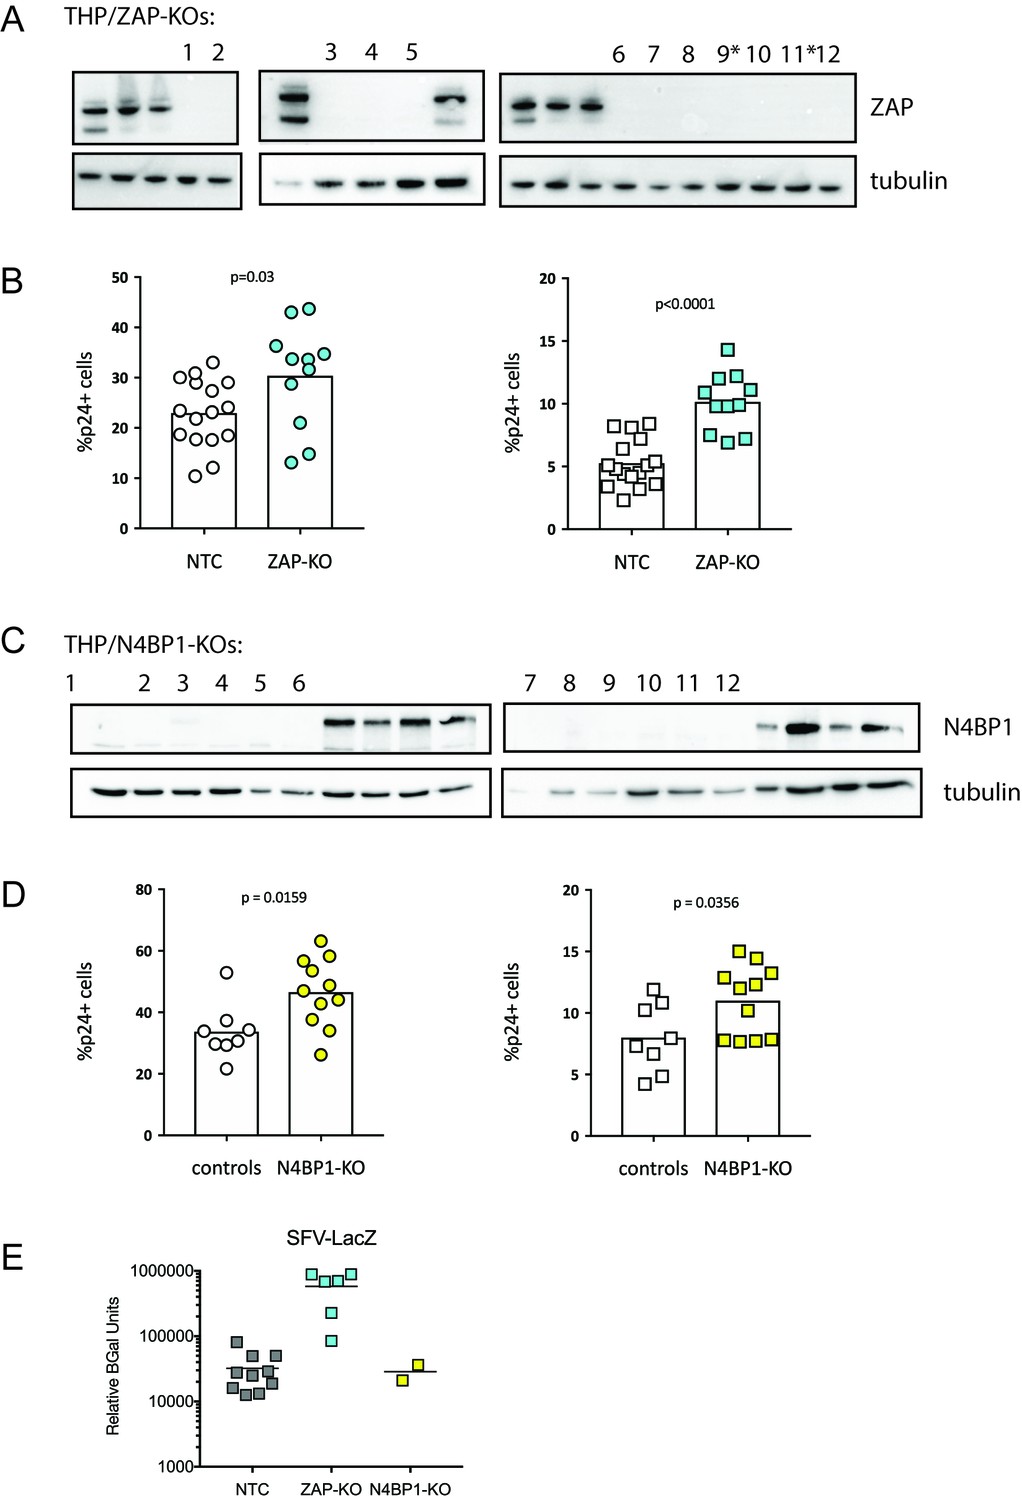
ZAP and N4BP1 are modest inhibitors of HIV infection.
(A) Western blot confirming KO of ZAP in THP-1 clonal lines. *indicates clonal line used in PIKAHIV ZAP-KO screening (Figure 2B–E). (B) Control (gray) and ZAP-KO (cyan) clonal THP-1 cell lines were infected and %p24 +cells was measured 2 days post-infection. Left (circles): no IFN. Right (squares): pretreatment with 200 U/mL IFNα. (C) Western blot confirming KO of N4BP1 in THP-1 clonal lines. (D) Control (gray) and N4BP1-KO (yellow) clonal THP-1 cell lines were infected and %p24 +cells was measured 2 days post-infection. Left (circles): no IFN. Right (squares): pretreatment with 200 U/mL IFNα. (E) Clonal control (NTC - gray), ZAP-KO (cyan) or N4BP1-KO (yellow) THP-1 lines were infected with SFV-LacZ and assayed for beta-galactosidase expression the following day. *unpaired t-test.
Figure 3
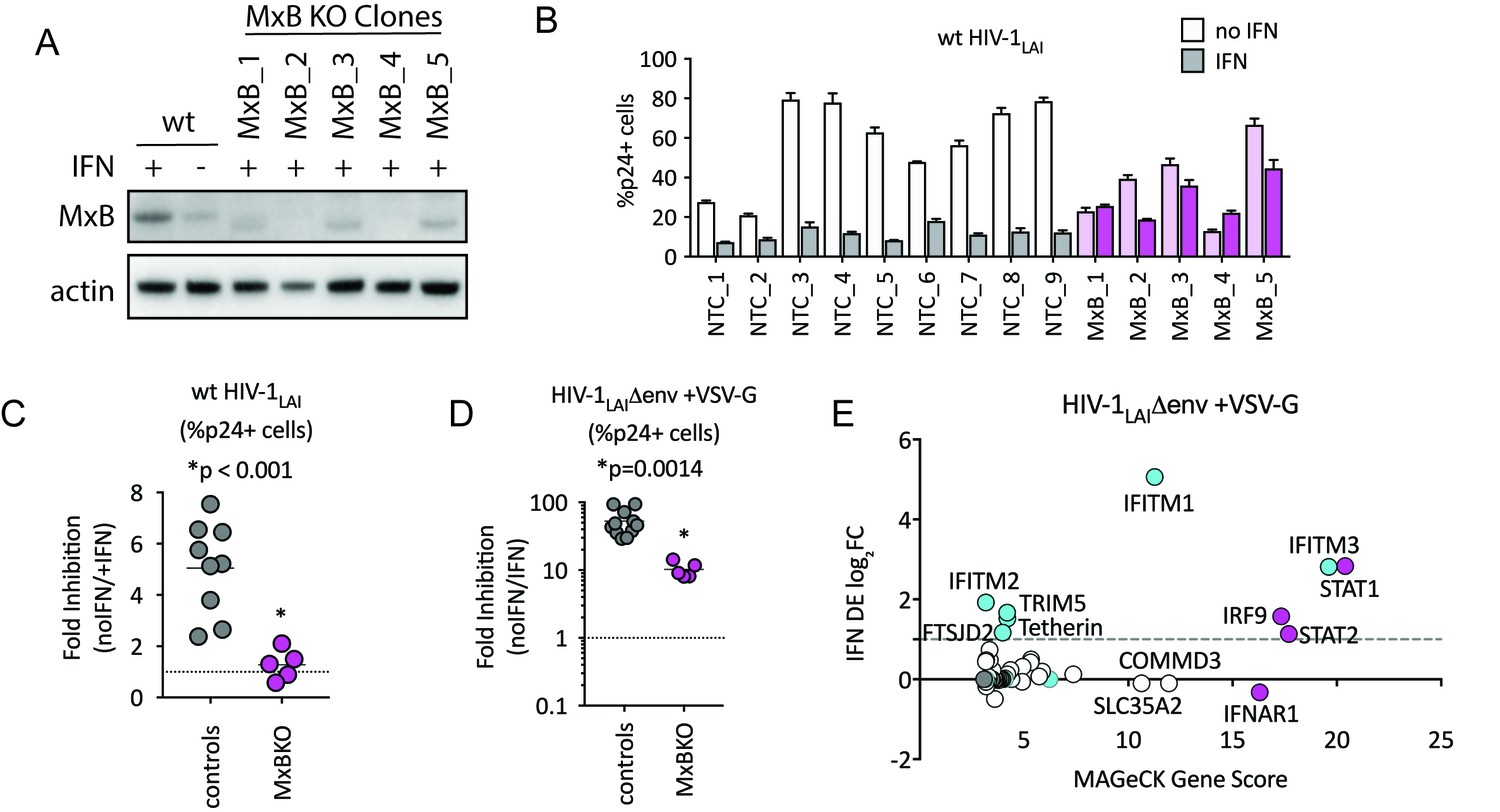
MxB is a dominant, early-acting ISG whose activity is masked by other ISGs when HIV entry is mediated by VSV-G.
(A) Clonal MxB-KO THP-1 lines generated by transducing with an MxB-targeting sgRNA/lentiCRISPRv2 construct, selection and single-cell sorting. Western blot for MxB expression with and without IFNα stimulation overnight is shown for wild type (wt) THP-1 cells; MxB-KO clones were all IFNα treated overnight. Note: the lower molecular weight band in some lanes results from initiation at an internal Met codon that would not be predicted to have anti-HIV activity (Goujon et al., 2015; Matreyek et al., 2014). (B) Nine individual clonal THP-1 lines (white/gray bars) along with five clonal THP-1 MxB-KO lines (pink bars) were pre-treated with IFNα overnight and infected with wt HIV-1LAI. The percentage of cells expressing HIV p24gag was assayed 2 days post-infection by intracellular staining and flow cytometry (n = 3). Light bars = no IFN; Dark bars = overnight IFNα treatment prior to infection. (C) The Fold Inhibition (%p24 +cells without IFN/%p24 +cells with IFNα) calculated for each clonal line for wt HIV-1LAI infections from the data in Panel B. Controls = gray; MxB-KO = magenta. Dotted line at a Fold Inhibition of 1 = no IFN inhibition. (D) Individual clonal control THP-1 lines (gray) along with MxB-KO clonal lines (magenta) were infected with VSV-G pseudotyped HIV both with and without IFNα pretreatment (n = 3). Fold Inhibition was calculated as in C. Dotted line: Fold Inhibition of 1 = no IFN inhibition. *p = 0.0014 (unpaired t test). (E) The PIKAHIV screen was performed in triplicate in ZAP-KO THP-1 cells. Y-Axis: IFN induction as determined by Differential Expression Analysis of microarray data in THP-1 cells (log2FoldChange). X-Axis: MAGeCK Gene Scores for Top 25 Hits. Magenta: IFN pathway genes (IFNAR1, STAT1, STAT2, IRF9). Cyan: highly-IFN induced, high-scoring candidate Hits. White: non-IFN induced genes including ZAP, N4BP1, and SLC35A2. High-scoring genes with no information on IFN induction in THP-1s are plotted as IFN DE log2FC = 0 but shown in Cyan with a gray outline.
-
Figure 3—source data 1
MAGeCK Gene Analysis (Positive) of ZAP-KO THP-1 PIKAHIV HIV-1LAI/VSVG Screen.
pos|score sort: id. num. pos|score. pos|p-value. pos|fdr. pos|rank. pos|goodsgrna. pos|lfc. pos|score(-log10).
- https://doi.org/10.7554/eLife.39823.014
Figure 4
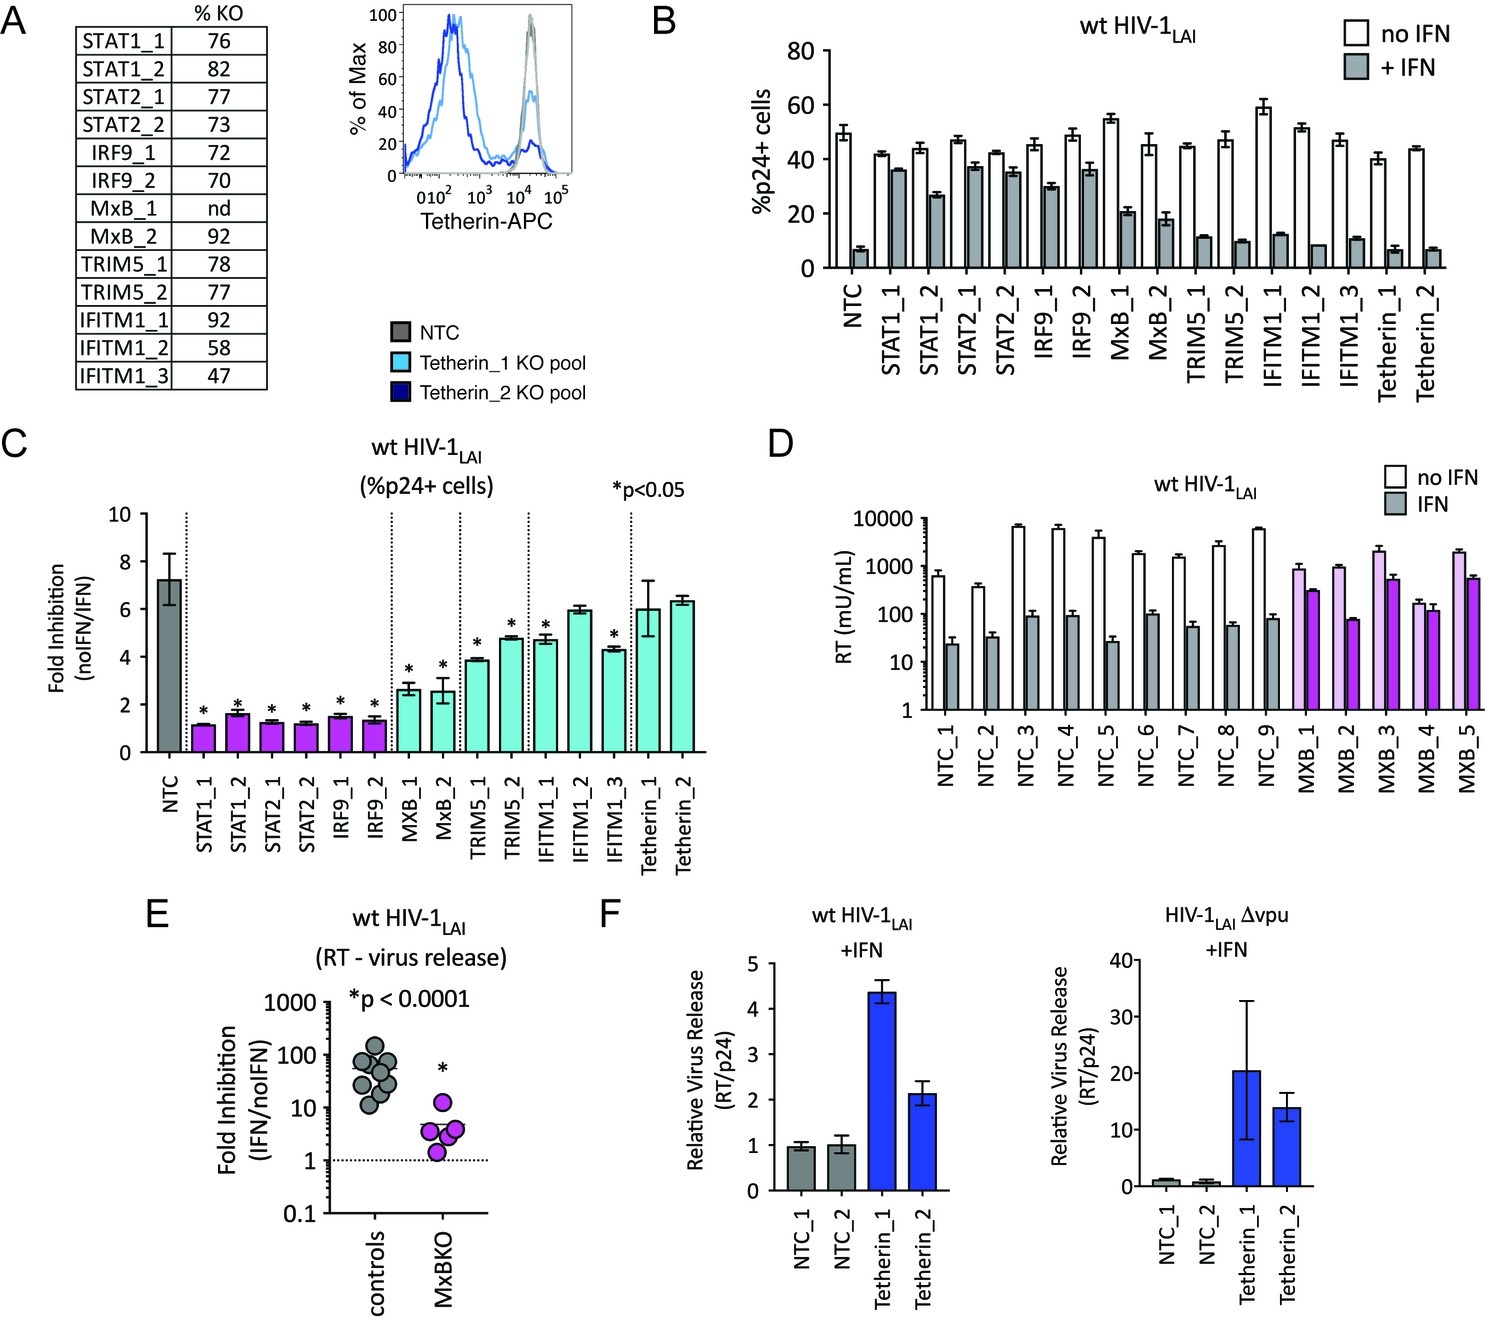
TRIM5alpha, IFITM1 and Tetherin are additional ISGs that contribute to the IFN block.
(A) KO efficiencies in lentiCRISPRv2-edited THP-1 cells as determined by ICE analysis (left) or flow cytometry (right – pretreated with 1000 U/mL uIFN). (B) THP-1 cell pools edited for gene targets of interest were created by transducing wild type THP-1 cells with lentiCRISPRv2 sgRNA constructs (two different sgRNAs - for STAT1, STAT2, IRF9, MxB, TRIM5alpha and Tetherin, and three for IFITM1), selected for 2 weeks to allow gene knockout (see Figure 4—source data 1Supplemental file 1 for analysis of gene knockout efficiency) and infected with HIV-1LAI with and without IFNα pretreatment in triplicate (white bars = no IFNα, gray bars =+IFNα). The percentage of cells expressing HIV p24gag was assayed 2 days post-infection by intracellular staining and flow cytometry. NTC n = 9. MxB_2 n = 6. All other pools n = 3. (C) The Fold Inhibition (%p24 +cells without IFN/%p24 +cells with IFNα) is shown for each KO pool. Control (NTC) = gray; IFN pathway genes = magenta. MxB, TRIM5alpha, IFITM1 and Tetherin = Cyan. Cells pools with significantly reduced Fold Inhibition as compared to the NTC pools *p < 0.05 (unpaired t test). (D) Virus release from the clonal NTC (white/gray) or MxB-KO clones (pink) from Figure 3 as measured with a viral RT assay at 3 days post-infection with HIV-1LAI with and without IFNα (light bars = no IFN; dark bars = IFNα). (E) The Fold Inhibition (RT mU/mL without IFN/RT mU/mL with IFNα) calculated for each clonal line. Controls = gray; MxB-KO = magenta. Dotted line: Fold Inhibition of 1 = no IFN inhibition. (F) THP-1 cell pools (NTC_1 and NTC_2 = gray; Tetherin-KO pools = blue) created by transduction with lentiCRISPRv2 lentiviral vectors were infected in triplicate with Vpu-deficient HIV (HIV-1LAIΔvpu) or wild type HIV (wt HIV-1LAI). The HIVLAIΔvpu contains a frameshift mutation in Vpu upstream of the env open reading frame. IFNα was added 16 hr post-infection and T-20 fusion inhibitor was added 24 hr post-infection. The amount of reverse transcriptase (RT) activity released into the supernatant was then normalized to the percentage of p24 +cells in order to directly quantify virus release per infected cell in the presence of IFN (RT mU/mL/%p24 +cells in culture).
-
Figure 4—source data 1
ICE KO Editing Analysis.
name. r^2. ICE KO score.
- https://doi.org/10.7554/eLife.39823.016
Figure 5
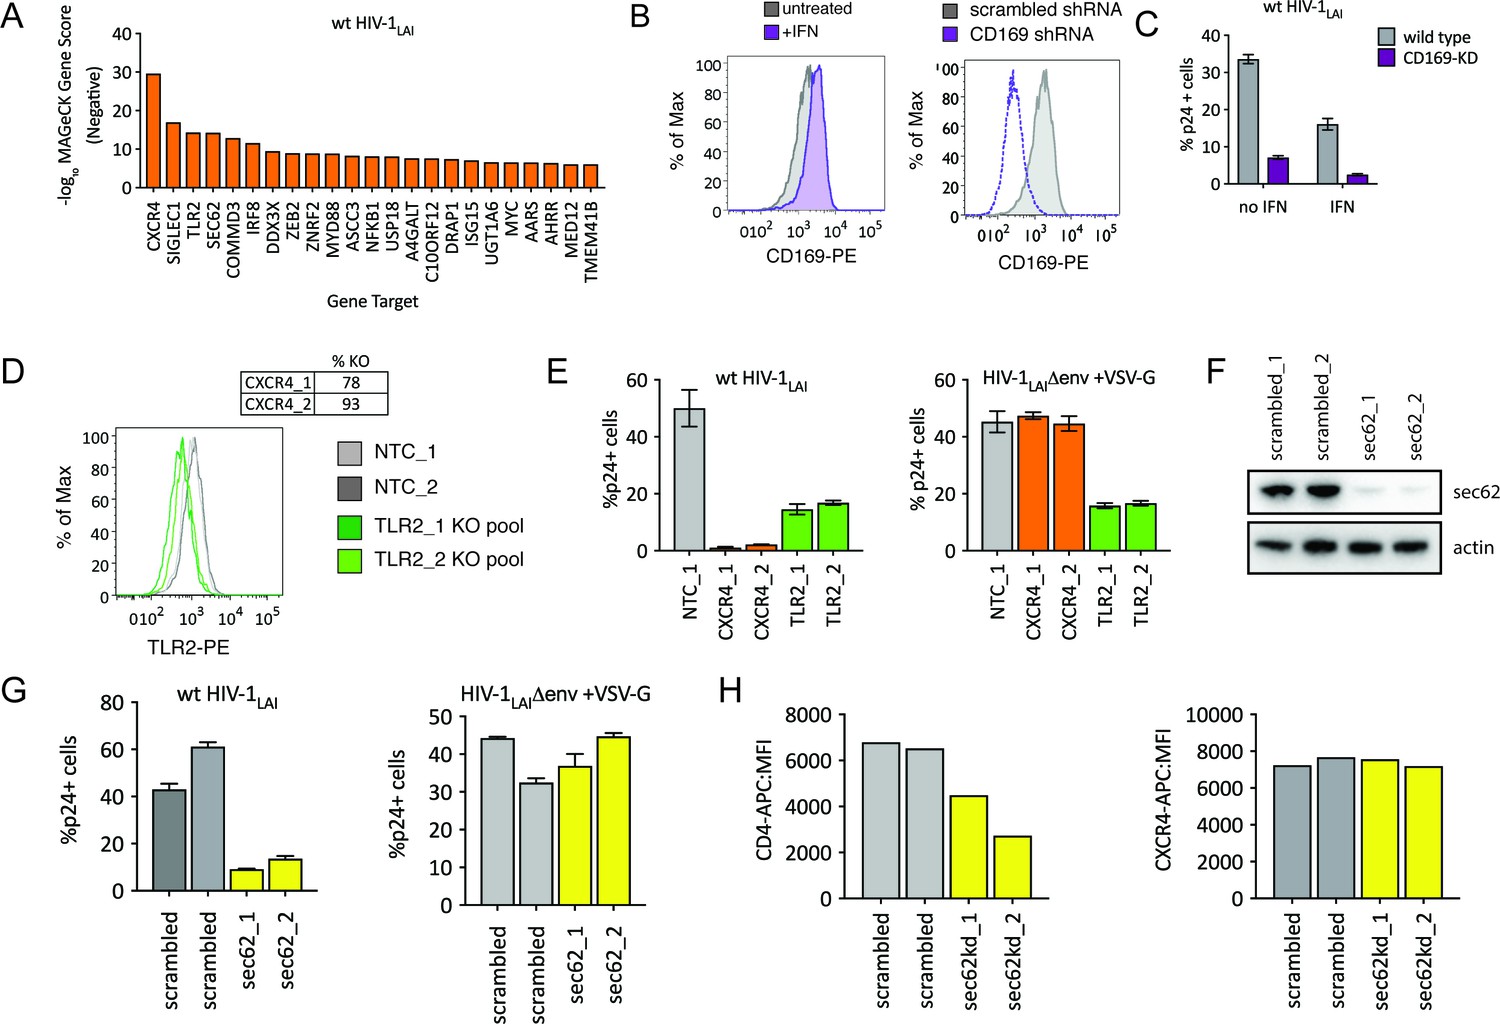
HIV-CRISPR Screening Identifies HIV Dependency Factors.
(A) Negative MAGeCK Gene Scores across both ZAP-KO Screens ranked from most depleted genes on the X-axis. Only the top 25 hits are shown. (B) Left: THP-1 cells were stimulated overnight with IFNα and assayed for cell surface SIGLEC1/CD169 expression by flow cytometry. Right: Control (scrambled - gray) THP-1 cells andTHP-1 cells transduced with a SIGLEC1/CD169-targeting shRNA construct (dotted purple line) were assayed for cell surface SIGLEC1/CD169 expression after overnight IFNα treatment. (C) Infection of control (gray – wild type) and SIGLEC1/CD169 knockdown THP-1 (purple - CD169-KD) with and without IFNα (1000 U/mL u IFNα) and assayed by intracellular p24gag 2 days after infection (D) KO efficiency as determined by ICE analysis (CXCR4) or flow cytometry (TLR2). (E) Infection of control (gray – NTC), CXCR4-KO pools (orange) and TLR2-KO pools (green) were assayed for the % of cells expressing HIV p24gag 2 days post-infection by intracellular staining and flow cytometry. Left: wt HIV-1LAI (n = 3). Right: HIV-1LAIΔenv + VSV G (n = 3). (F) SEC62 knockdown after transduction with two LKO SEC62 shRNA constructs. Western blot of the sec62-targeting shRNA cell lines is shown together with two control (scrambled in gray) cell lines. Loading control = actin. (G) Infection of SEC62-KD (yellow) and control (scrambled in gray) with wt HIV-1LAI (left panel) or HIV-1LAIΔenv + VSV G (right panel). The % of cells expressing HIV p24gag 2 days post-infection is shown. (H) The mean fluorescence intensity (MFI) of CD4-APC (left panel) and CXCR4-APC (right panel) cell surface staining of control (scrambled in gray) and SEC62-KD (yellow) THP-1 cell pools.
-
Figure 5—source data 1
MAGeCK Gene Analysis (Negative Scores) of ZAP-KO THP-1 PIKAHIV HIV-1LAI screens.
TargetID. log2FC IFN. ZAPKO11_uIFN-ZAPKO11_THP.gDNA.neg.score. ZAPKO46_uIFN-ZAPKO46_THP.gDNA.neg.score. ZAPKO x2 uIFN NEG. ZAPKO x2 uIFN NEG -log10.
- https://doi.org/10.7554/eLife.39823.018
Figure 6 with 1 supplement
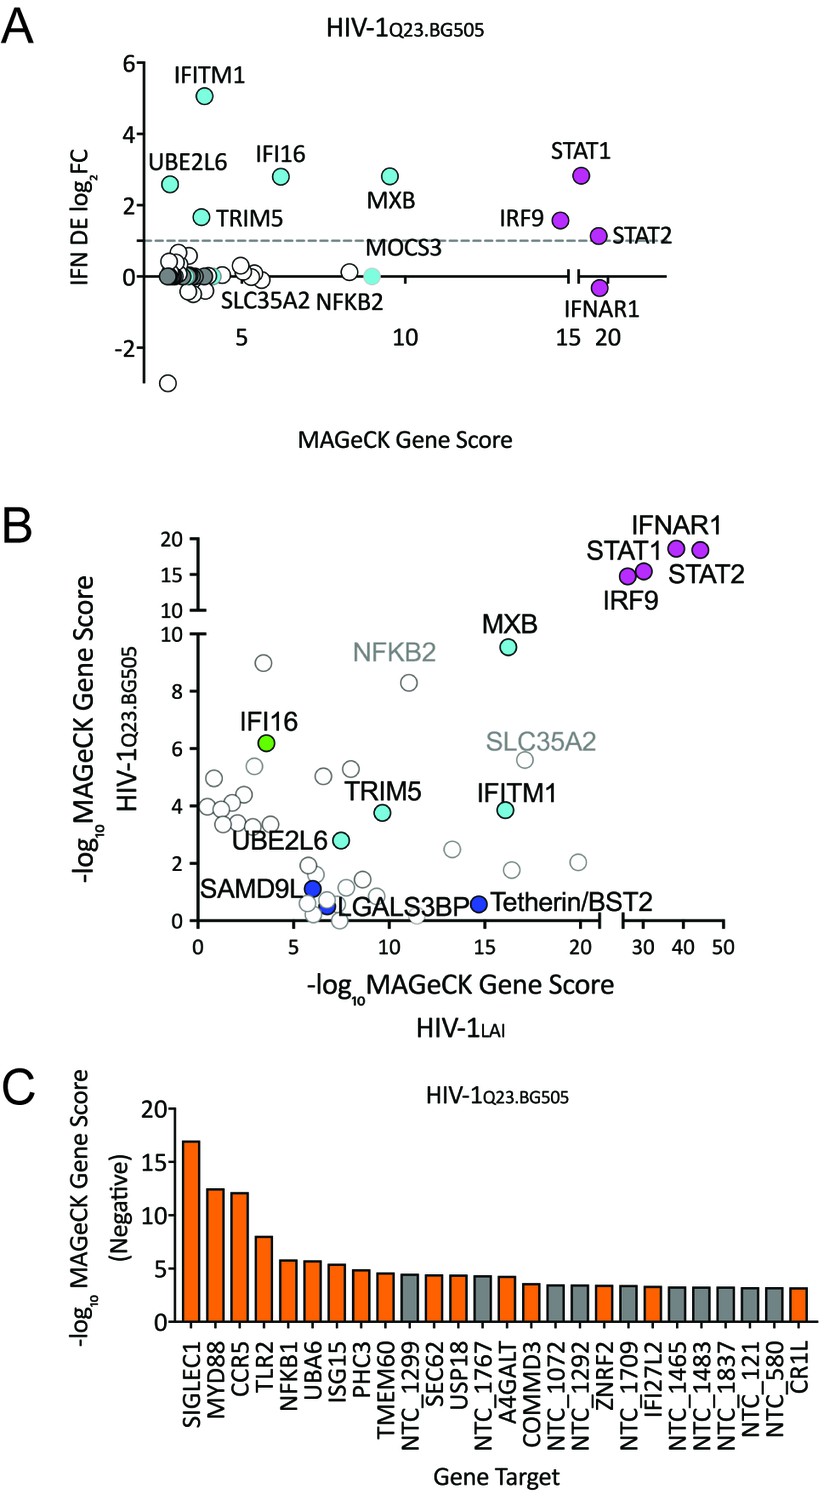
HIV-CRISPR Screen of an R5-tropic Clade 1 Isolate (HIV-1Q23.BG505).
(A) The PIKAHIV screen was performed in duplicate in ZAP-KO THP-1 cells with HIV-1Q23.BG505. Y-Axis: IFN induction as determined by Differential Expression (DE) Analysis of microarray data in THP-1 cells (IFN DE log2FC). X-Axis: MAGeCK Gene Scores for Top 50 Hits. Magenta: IFN pathway genes (IFNAR1, STAT1, STAT2, IRF9). Cyan: highly-IFN induced, high-scoring candidate Hits. White: non-IFN induced genes. High-scoring genes with no information on IFN induction in THP-1s are plotted as IFN DE log2FC = 0 but shown in Cyan with a gray outline. (B) Comparison of the top 30 gene hits from either the HIV-1LAI screen (X-axis) or the HIV-1Q23.BG505 screen (Y-axis). Magenta: IFN pathway genes. Cyan: highly-IFN induced, high-scoring genes for both viruses. Green: highly-IFN induced and high-scoring for HIV-1Q23.BG505. Dark Blue: highly-IFN induced and high-scoring for HIV-1LAI. Gray outlines are genes that are not significantly upregulated by IFN. (C) Negative MAGeCK Gene Scores for the HIV-1Q23.BG505 PIKAHIV screen. Only the top 25 hits are shown. Gray = NTCs; Orange = previously described or novel candidate HIV dependency factors.
-
Figure 6—source data 1
MAGeCK Gene Analysis (Negative) of ZAP-KO THP-1 PIKAHIV HIV-1LAI/VSVG Screen.
neg|score sort: id. num. neg|score. neg|p-value. neg|fdr. pos|rank. neg|goodsgrna. neg|lfc. neg|score(-log10).
- https://doi.org/10.7554/eLife.39823.021
Figure 6—figure supplement 1
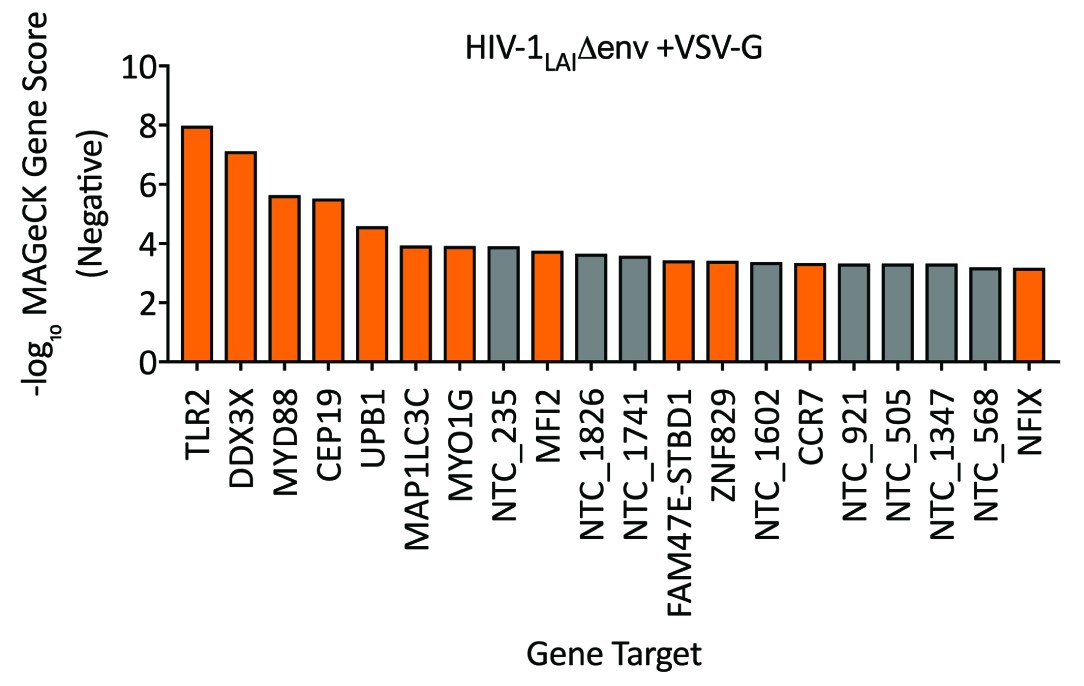
HIV Dependency Factors for VSV-G pseudotyped HIV-1.
Negative MAGeCK Gene Scores for the HIV-1 VSV-G PIKAHIV screen in ZAP-KO THP-1s with uIFN. Only the top 20 hits are shown. Gray = NTCs; Orange = previously described or novel candidate HIV dependency factors.
Tables
Key resources table
| Reagent type (species) or resource | Designation | Source or reference | Identifiers | Additional information |
|---|---|---|---|---|
| Cell line (homo sapiens) | THP-1 | NIH AIDS Reagent Program | 9942; RRID: CVCL_0006 | |
| Cell line (homo sapiens) | THP-1 ZAP-KO | this paper | Progenitor: THP-1 | |
| Cell line (homo sapiens) | THP-1 N4BP1-KO | this paper | Progenitor: THP-1 | |
| Cell line (homo sapiens) | THP-1 MxB-KO | this paper | Progenitor: THP-1 | |
| Cell line (homo sapiens) | 293T | ATCC | CRL-3216; RRID: CVCL_0063 | |
| Cell line (homo sapiens) | TZM-bl | NIH AIDS Reagent Program | 8129; RRID: CVCL_B478 | |
| Antibody | MxB (goat polyclonal) | Santa Cruz Biotechnologies | sc-271527; RRID: AB_10649506 | 1:200 |
| Antibody | ZAP/ZC3HAV1 (rabbit polyclonal) | Proteintech | 16820–1-AP; RRID: AB_2728733 | 1:5000 |
| Antibody | N4BP1 (rabbit polyclonal) | Cohesion Biosciences | CPA2415 | 1:1000 |
| Antibody | SEC62 (rabbit polyclonal) | Abcam | ab168843 | 1:2000 |
| Antibody | actin (rabbit polyclonal) | Sigma | A2066; RRID: AB_476693 | 1:5000 |
| Antibody | tubulin (mouse monoclonal) | Sigma | T6199; RRID: AB_477583 | 1:1000 |
| Antibody | goat anti-rabbit IgG-HRP | Santa Cruz Biotechnologies | sc-2004; RRID: AB_631746 | 1:5000 |
| Antibody | donkey anti-goat HRP | Santa Cruz Biotechnologies | SC-2020; RRID: AB_631728 | 1:5000 |
| Antibody | CD169 (Siglec-1) (mouse monoclonal) | NOVUS | NB600-534; RRID: AB_2189038 | 1:50 |
| Antibody | APC Mouse anti-Human CD4 | BD Pharmingen | 555349; RRID: AB_398593 | 1:50 |
| Antibody | CXCR4 | eBioscience | 17-9999-42; RRID: AB_1724113 | 1:50 |
| Antibody | PE anti-human CD282 (TLR2) | BioLegend | 309707; RRID: AB_314777 | 1:100 |
| Antibody | APC anti-human CD317 (BST2/Tetherin) | BioLegend | 348410; RRID: AB_2067121 | 1:50 |
| Antibody | KC57-FITC | Beckman Coulter | 6604665; RRID: AB_1575987 | |
| Sequence- based reagent | ZAP crRNA (ATGTGGAGTCTTGAACACGG) | IDT | this paper | |
| Sequence-based reagent | tracrRNA | IDT | 1072534 | |
| Recombinant DNA reagent | lentiCRISPRv2 (plasmid) | Addgene | 52961 | |
| Recombinant DNA reagent | HIV-CRISPR (plasmid) | this paper | Progenitors: lentiCRISPRv2; Genscript synthesis | |
| Recombinant DNA reagent | PIKA-HIV (plasmid library) | this paper | Progenitors: PCR (synthesized oligos); HIV-CRISPR | |
| Recombinant DNA reagent | pMD2.G | Addgene | 12259 | |
| Recombinant DNA reagent | psPAX2 | Addgene | 12260 | |
| Recombinant DNA reagent | LKO Sec62 shRNA | Sigma | TRCN0000289739 | |
| Recombinant DNA reagent | LKO Sec62 shRNA | Sigma | TRCN0000289833 | |
| Recombinant DNA reagent | LKO scrambled shRNA | Addgene | 1864 | |
| Recombinant DNA reagent | LKO CD169 shRNA | Sigma | TRCN155147 | |
| Recombinant DNA reagent | pLKO.1neo | Addgene | 13425 | |
| Recombinant DNA reagent | HIV-1 LAI | PMID: 1683726 | ||
| Recombinant DNA reagent | HIV-1 LAI deltaEnv | PMID: 9245614 | ||
| Recombinant DNA reagent | HIV-1 LAI vpuFS | PMID: 11069982 | ||
| Recombinant DNA reagent | Q23/BG505env | PMID: 29590010;10364271 | ||
| Recombinant DNA reagent | pHIV-zsGreen | Addgene | 18121 | |
| Recombinant DNA reagent | pHIV-zsGreen/CCR5 | this paper | Progenitor: pHIV-zsGreen | |
| Recombinant DNA reagent | pSMART-LacZ | PMID: 15326157 | ||
| Recombinant DNA reagent | pSCA-helper | PMID: 9660762 | ||
| Chemical compound, drug | Universal Type I Interferon Alpha | PBL Assay Science | 11200–1 | |
| Chemical compound, drug | Puromycin | Sigma | P8833 | |
| Chemical compound, drug | DEAE-Dextran | Sigma | D9885 | |
| Chemical compound, drug | alpha-Chymotrypsin | Sigma | C4129 | |
| Commercial assay or kit | Agencourt AMPure XP Beads | Beckman Coulter | A63880 | |
| Commercial assay or kit | Qubit dsDNA HS Assay Kit | ThermoFisher | Q32854 | |
| Commercial assay or kit | QIAamp viral RNA Kit | Qiagen | 52904 | |
| Commercial assay or kit | One-Step RT-ddPCR Advanced Kit for Probes | BioRad | 1864021 | |
| Commercial assay or kit | Cas9-NLS | UC Berkeley MacroLab | ||
| Commercial assay or kit | Amaxa SG Cell Line 96-well Nucleofector Kit | Lonza | V4SC-3096 | |
| Commercial assay or kit | Epicentre QuickExtract DNA Extraction Solution | Lucigen | QE09050 | |
| Commercial assay or kit | QIAamp DNA Blood Mini Kit | Qiagen | 51185 | |
| Commercial assay or kit | T-20 (Enfuvirtide) | NIH AIDS Reagent Program | 12732 | |
| Commercial assay or kit | HIV-1 p24 ELISA Kit | ABL inc. | 5421 | |
| Software, algorithm | ICE | Synthego (https://ice.synthego.com/#/) | ||
| Software, algorithm | MAGeCK | https://sourceforge.net/p/mageck/wiki/Home/ | PMID: 25476604 |
Additional files
-
Supplementary file 1
Oligos and Primers.
Tab 1 (sgRNA oligos): oligo name. oligo_seq. sgRNA name. seq. ICE_F oligo. ICE_R oligo. Tab 2 (sequencing primers): oligo_name. sequence.
- https://doi.org/10.7554/eLife.39823.022
-
Transparent reporting form
- https://doi.org/10.7554/eLife.39823.023
Download links
A two-part list of links to download the article, or parts of the article, in various formats.
Downloads (link to download the article as PDF)
Open citations (links to open the citations from this article in various online reference manager services)
Cite this article (links to download the citations from this article in formats compatible with various reference manager tools)
A virus-packageable CRISPR screen identifies host factors mediating interferon inhibition of HIV
eLife 7:e39823.
https://doi.org/10.7554/eLife.39823


