Genomics of 1 million parent lifespans implicates novel pathways and common diseases and distinguishes survival chances
- Paul RHJ Timmers

- Ninon Mounier
- Kristi Lall
- Krista Fischer
- Zheng Ning
- Xiao Feng
- Andrew D Bretherick
- David W Clark
- Xia Shen
- Tõnu Esko
- Zoltán Kutalik
- James F Wilson
- Peter K Joshi
- University of Edinburgh, United Kingdom
- University Hospital of Lausanne, Switzerland
- Swiss Institute of Bioinformatics, Switzerland
- University of Tartu, Estonia
- Karolinska Institutet, Sweden
- Sun Yat-sen University, China
- Broad Institute of Harvard and MIT, United States
Figures
Figure 1
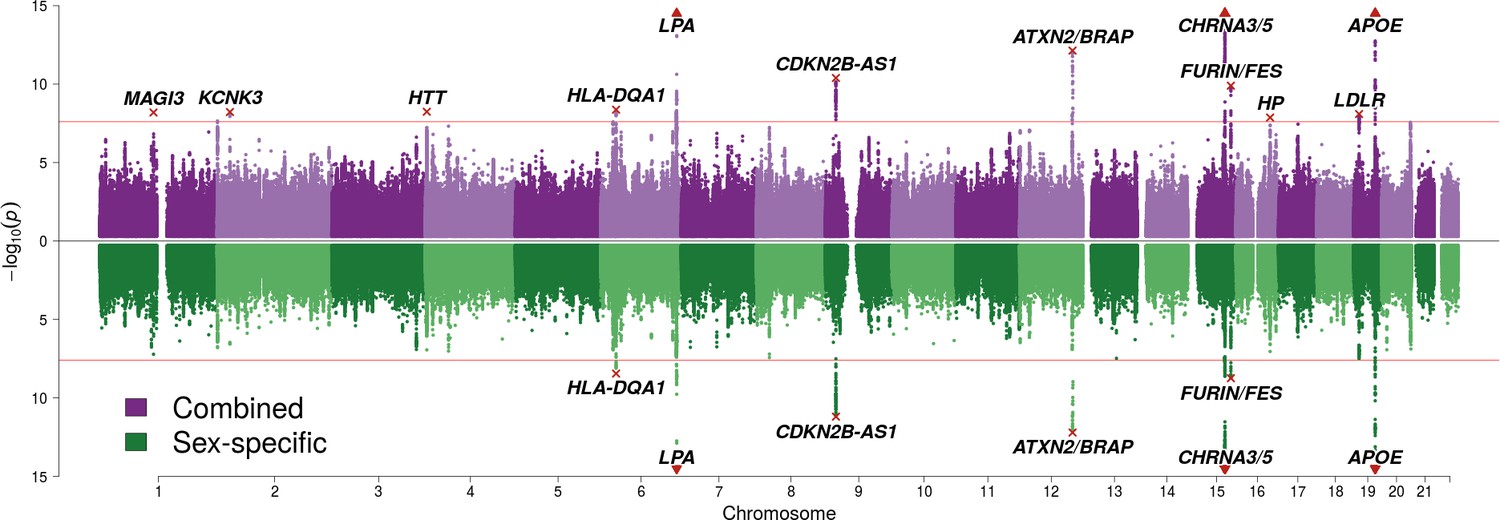
SNP associations with lifespan across both parents under the assumption of common and sex-specific effect sizes.
Miami plot of genetic associations with joint parental survival. In purple are the associations under the assumption of common SNP effect sizes across sexes (CES); in green are the associations under the assumption of sex-specific effect sizes (SSE). P refers to the two-sided P values for association of allelic dosage on survival under the residualised Cox model. The red line represents our multiple testing-adjusted genome-wide significance threshold (p = 2.5 × 10⁻⁸). Annotated are the gene, set of genes, or cytogenetic band near the index SNP, marked in red. P values have been capped at –log10(p) = 15 to better visualise associations close to genome-wide significance. SNPs with P values beyond this cap (near APOE, CHRNA3/5 and LPA) are represented by triangles.
Figure 2 with 1 supplement
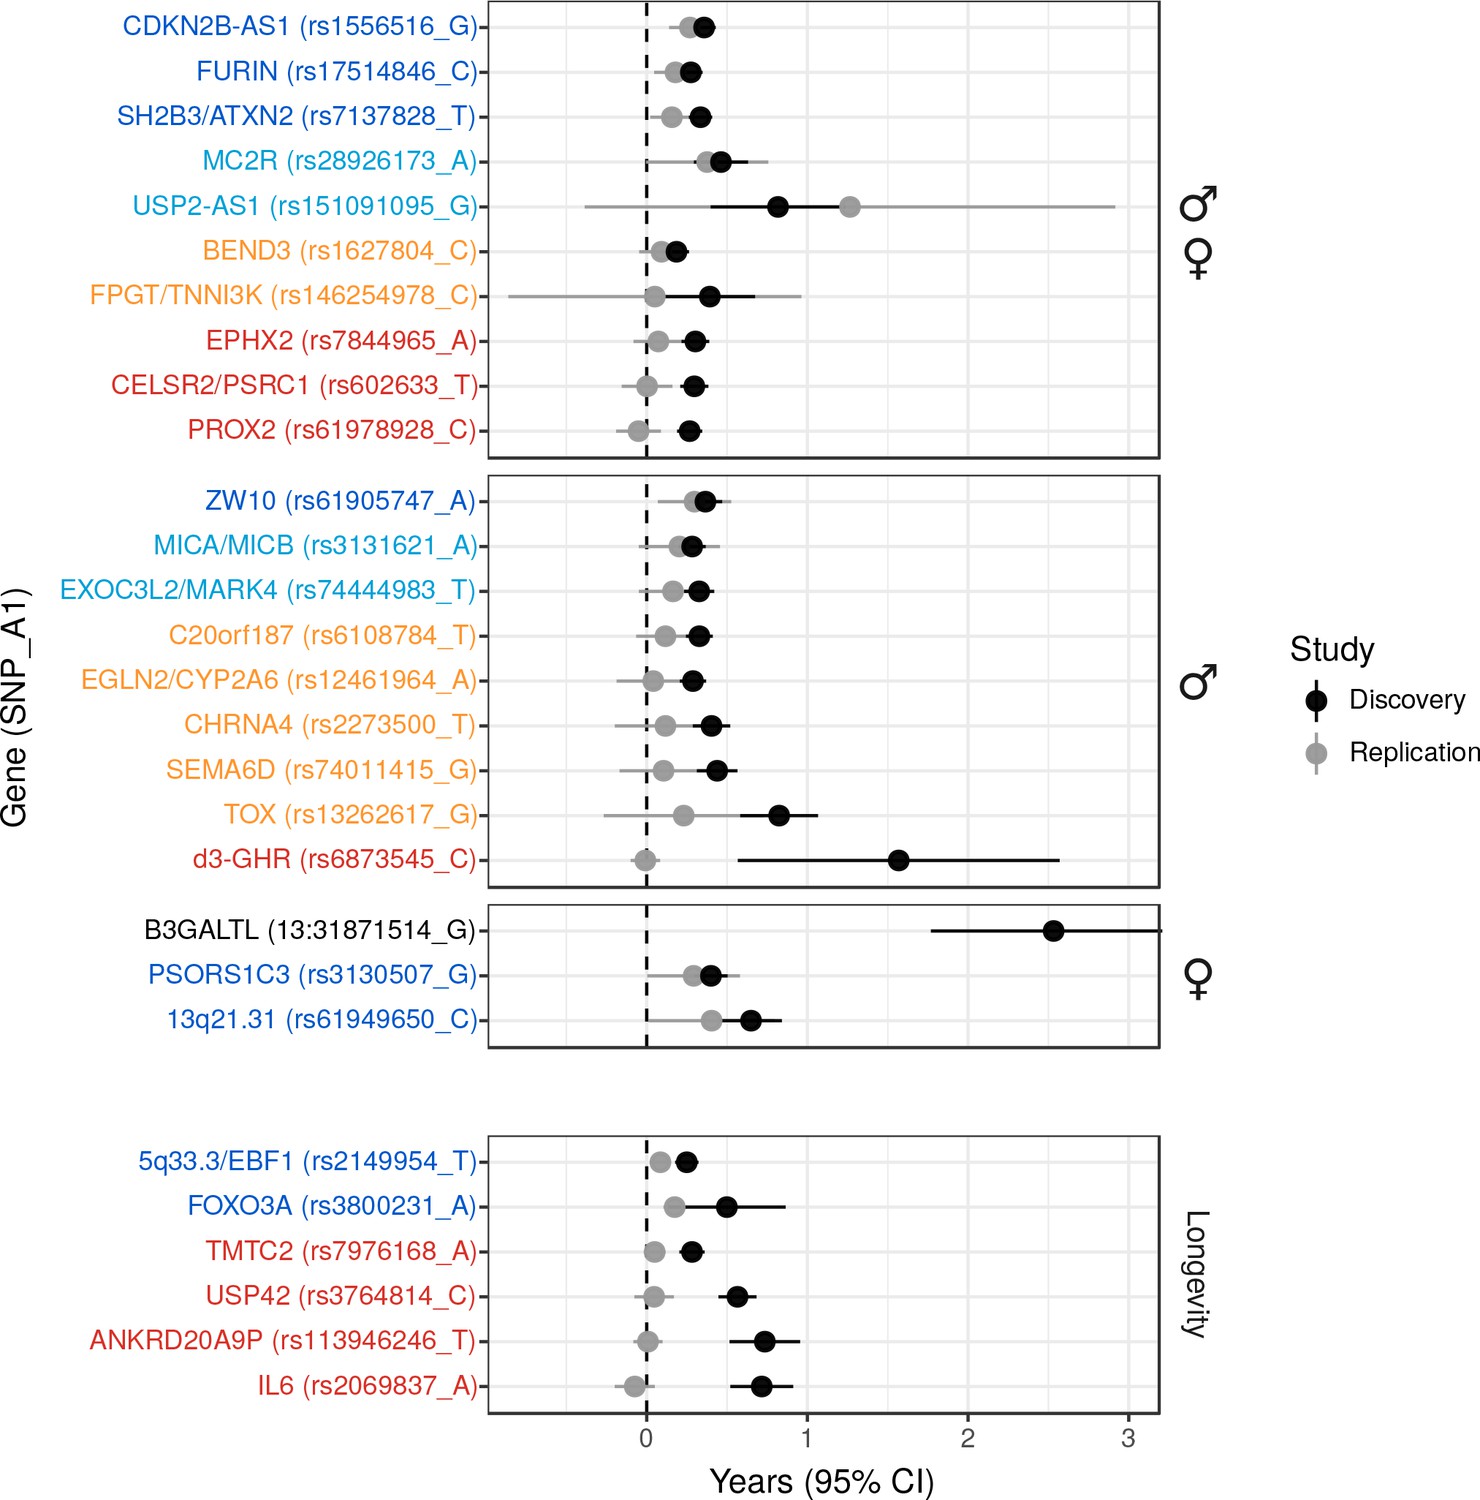
Validation of SNPs identified in other studies using independent samples of European descent.
Discovery – Candidate SNPs or proxies (r2 > 0.95) associated with lifespan (top panels, stratified by sex) and longevity (bottom panel) by previous studies (Zeng et al., 2016; Pilling et al., 2017; Deelen et al., 2014; Flachsbart et al., 2009; Sebastiani et al., 2017; Ben-Avraham et al., 2017). Effect sizes have been rescaled to years of life to make direct comparisons between studies (see Materials and methods and Figure 2—figure supplement 1). Replication – Independent samples, either the LifeGen meta-analysis to replicate Pilling et al. (2017), or the full dataset including UK Biobank. Gene names are as reported by discovery and have been coloured based on overlap between confidence intervals (CIs) of effect estimates. Dark blue – Nominal replication (p < 0.05, one-sided test). Light blue – CIs overlap (Phet > 0.05) and cover zero, but replication estimate is closer to discovery than zero. Yellow – CIs overlap (Phet > 0.05) and cover zero, and replication estimate is closer to zero than discovery. Red – CIs do not overlap (Phet < 0.05) and replication estimate covers zero. Black – no replication data.
-
Figure 2—source data 1
Eight candidate lifespan regions replicate nominally (p < 0.05) in LifeGen or our full sample.
Listed are SNPs or close proxies (r2 > 0.95), which have been previously reported to associate with lifespan or extreme longevity. At or near – Gene, cluster of genes, or cytogenetic band in close proximity to lead SNP; Chr – Chromosome, Position – Base-pair position on chromosome (build GRCh37); A1 – the effect allele, increasing lifespan in discovery; Freq1- Frequency of the A1 allele in the replication sample, or if missing, the discovery sample; Sex – sex of the individuals or their parents used in the discovery and replication; Beta1 – the loge(protection ratio) for carrying one copy of A1 under additive dosage model, inferred for discovery (see Materials and methods); SE – Standard Error, calculated from reported P value and inferred effect estimates for discovery, assuming a two-sided test; Years – Years of lifespan gained for carrying one copy of the A1 allele; P – P value reported by original study for discovery, one-sided P value for the Wald test association between imputed dosage and cox model residual for the replication. For discovery, except Pilling et al’s SNPs (Pilling et al., 2017), where we re-calculated effects directly from individual UKBB data ourselves, effects sizes have been converted to a common scale to enable comparison. Study – original study that identified the candidate SNP; Sample – independent sample used to replicate the results (a = Full dataset, b = LifeGen excluding UK Biobank). Loci showing nominal replication (p < 0.05) are bolded.
- https://doi.org/10.7554/eLife.39856.010
Figure 2—figure supplement 1
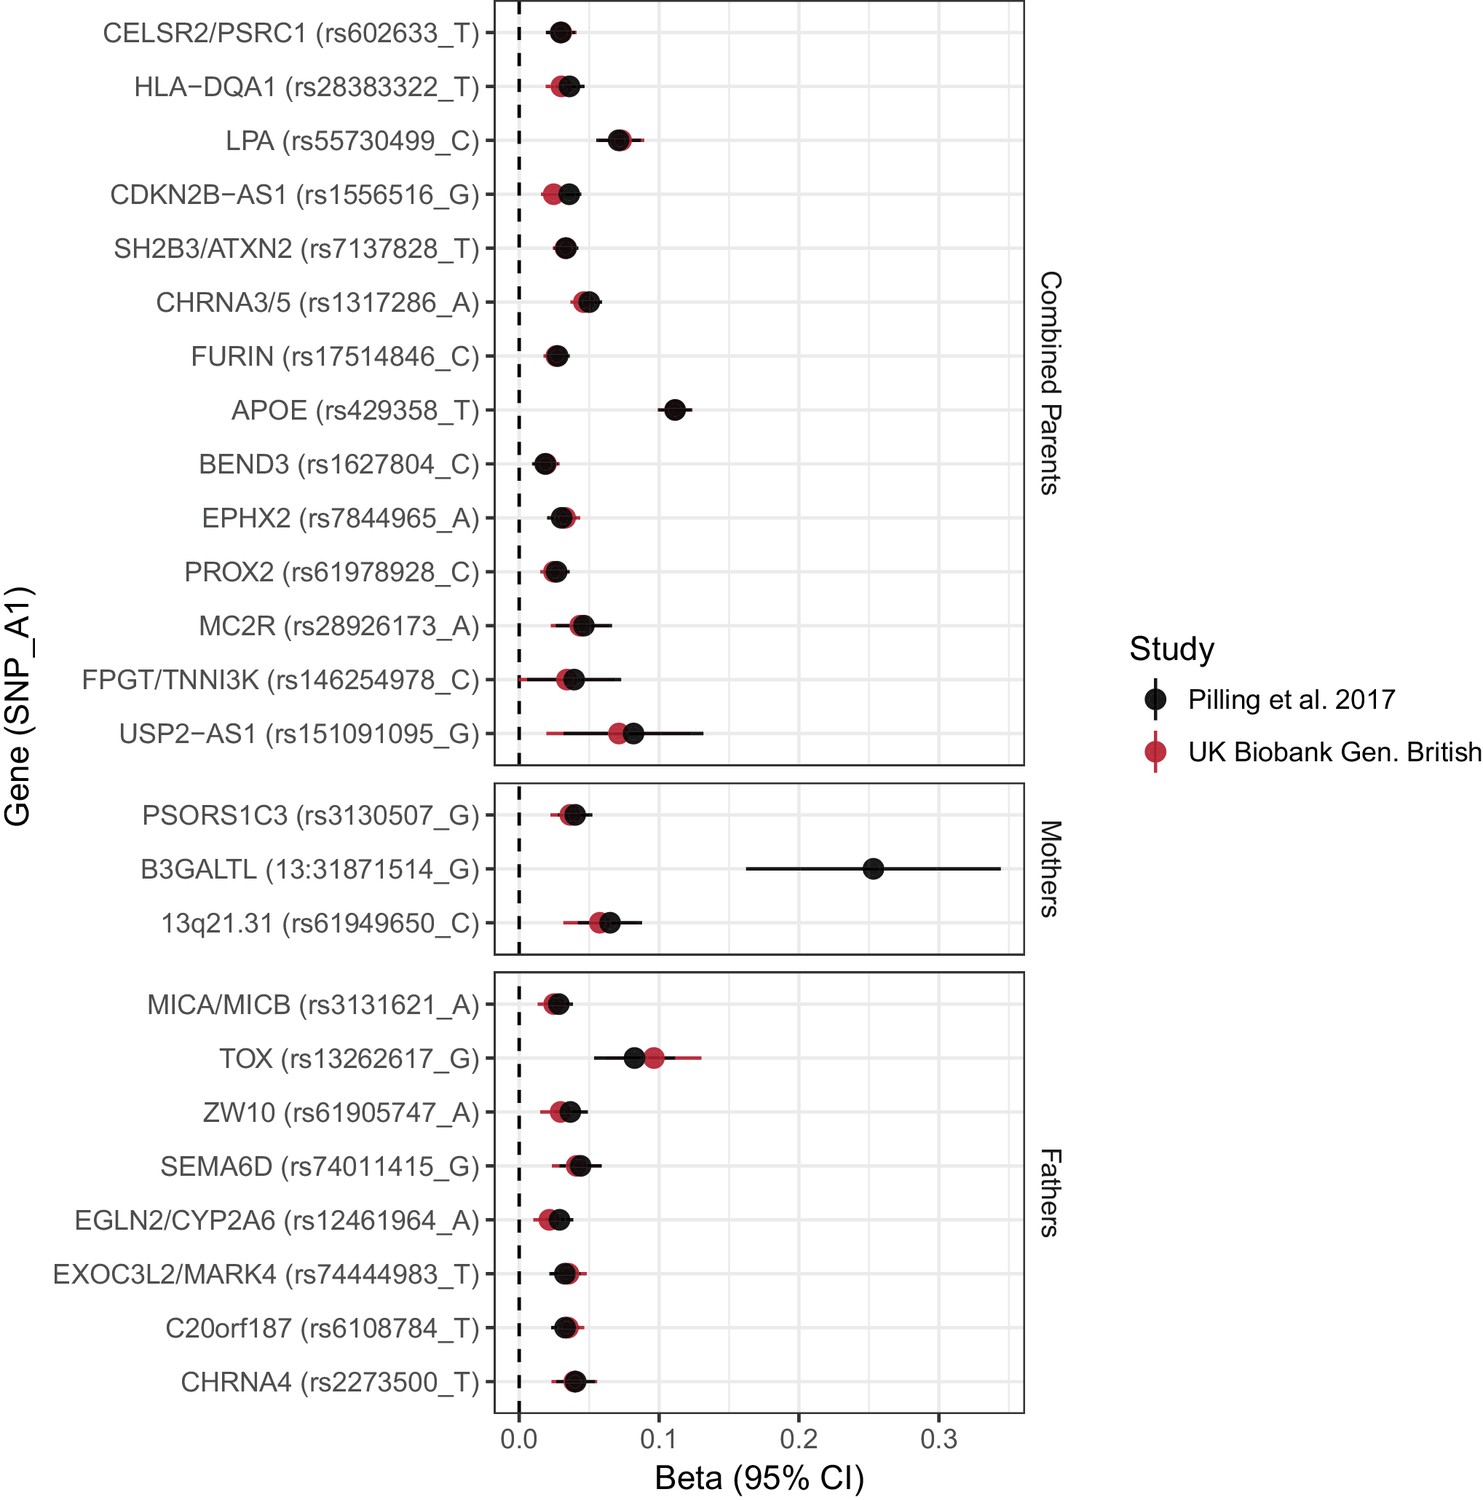
Concordance between inferred effect sizes from Pilling et al. (2017) and our estimated effect sizes in a largely overlapping UK Biobank sample.
Effect estimates from Pilling et al. (2017) were converted to loge(protection ratio) based solely on the proportion dead in individual parental samples, or (for combined parents results) based on an empirical conversion factor from APOE (see Materials and methods). By definition, the inferred effect estimate for APOE in combined parents is identical between the studies; all other estimates provide a measure of concordance between inferred and calculated effects for each locus. Gene names are as reported by discovery. Note, rs161091095 near USP2–AS1 is a proxy (r2 = 1.00) for rs139137459, the SNP reported by Pilling et al. No proxies could be found for 13:31871514_T_G. Gene – Nearby gene(s) as reported by discovery. SNP – rsID of SNP or proxy. A1 – Longevity allele. Beta - the estimated loge(protection ratio) for one copy of the effect allele. CI – Confidence Interval.
Figure 3 with 1 supplement

SNP associations with lifespan across both parents when taking into account prior information on mortality risk factors.
Bayesian iGWAS was performed using observed associations from the lifespan GWAS and priors based on 16 traits selected by an AIC-based stepwise model. As the P values were assigned empirically using a permutation approach, the minimum P value is limited by the number of permutations; SNPs reaching this limit are represented by triangles. Annotated are the gene, cluster of genes, or cytogenetic band in close proximity to the top SNP. The red line represents the genome-wide significance threshold (p = 2.5 × 10⁻⁸). The blue line represents the 1% FDR threshold. Figure 3—figure supplement 1 shows the associations of each genome-wide significant SNP with the 16 risk factors.
Figure 3—figure supplement 1
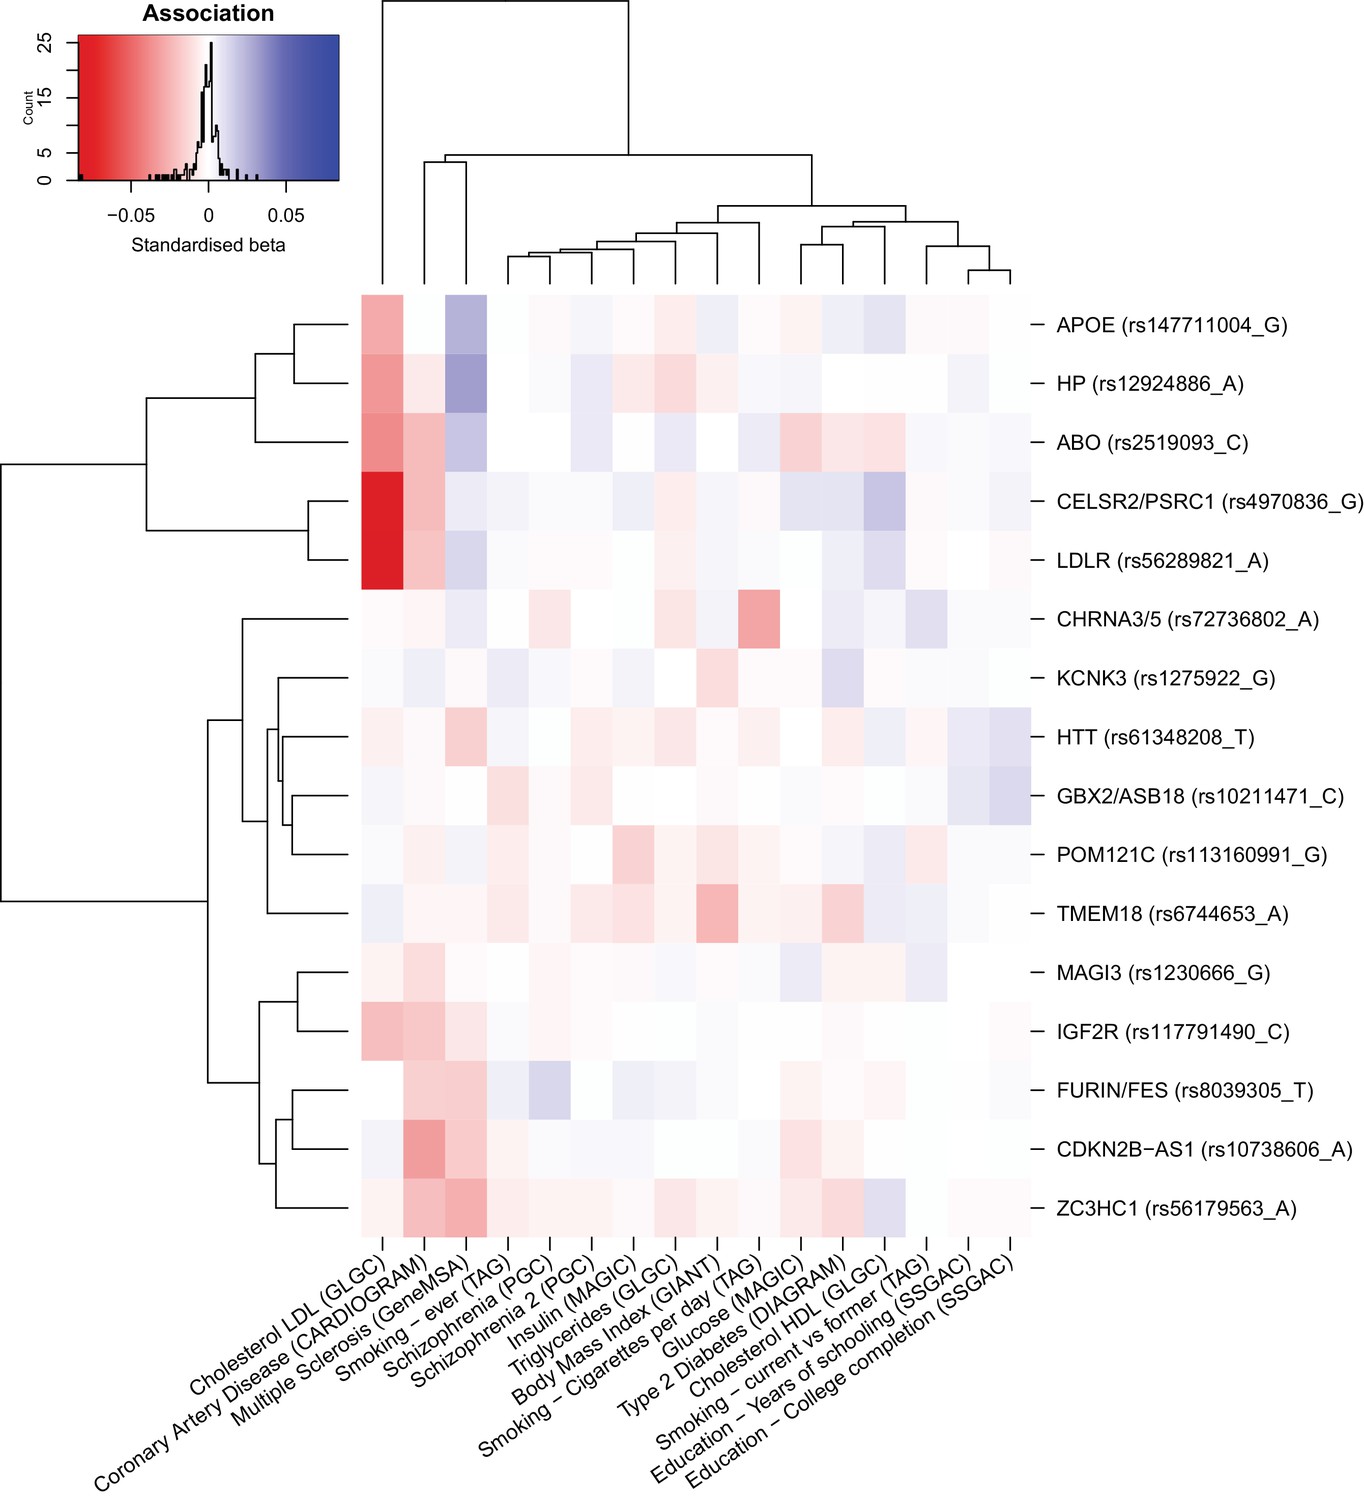
Heat map of the effect of genome-wide significant iGWAS SNPs on the mortality risk factors.
We looked up the effects of lifespan protecting alleles identified by iGWAS in the consortium GWAMA for all risk factors significantly associated with lifespan in univariate analysis (for studies tested see Materials and methods). We kept all traits univariately associated with lifespan to allow for the presence of potentially correlated traits, not significant in the multivariate analysis. In the iGWAS analysis, Z-scores (estimated effect divided by standard error) are used, but for comparison purposes, standardised betas (Z-score divided by square root of the sample size) were calculated for each risk factor at every SNP and represented in this figure. Both SNPs and traits were clustered for similarity. For example, we can see that almost all iGWAS alleles identified as protective for lifespan are exhibiting negative standardized betas in the coronary artery disease (CAD) association study, confirming the hypothesis that CAD is negatively affecting lifespan. We can also notice that some SNPs are strongly associated with some risk factors (APOE and LDR with lipids traits or CDKN2B-AS1 with CAD) and likely influence lifespan through their effect on these traits. However, some other SNPs (KCNK3 and HTT for example) are showing moderate effects on several risk factors and are probably affecting lifespan through pleiotropic effects.
Figure 4
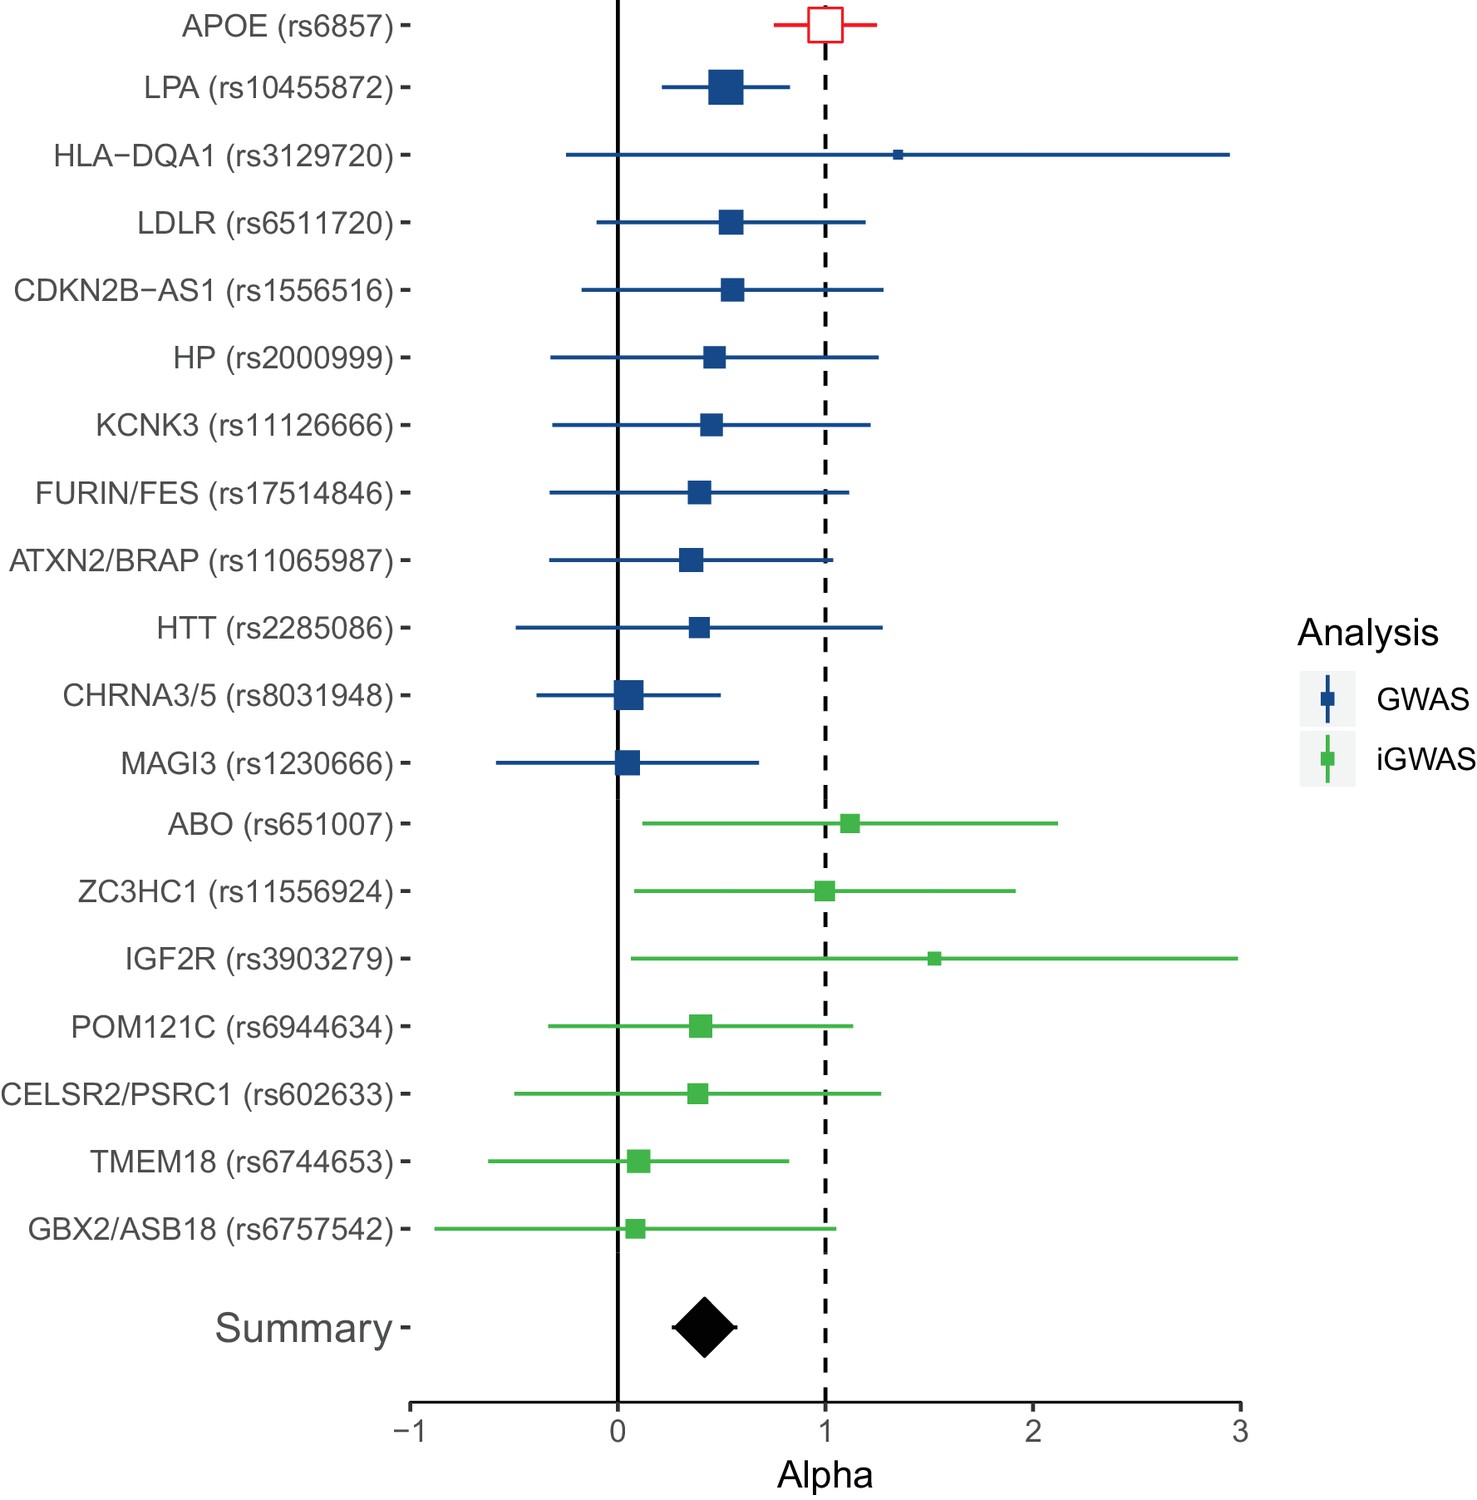
Collective replication of individual lifespan SNPs using GWAMAs for extreme long-livedness shows directional consistency in all cases.
Forest plot of effect size ratios between genome-wide significant lifespan variants from our study and external longevity studies (Broer et al., 2015; Deelen et al., 2014), having converted longevity effect sizes to our scale using APOE as benchmark (see Materials and methods and Figure 4—source data 1). Alpha – ratio of replication to discovery effect sizes on the common scale and 95% CI (reflecting uncertainty in the numerator and denominator; P values are for one-sided test). A true (rather than estimated) ratio of 1 indicates the relationship between SNP effect on lifetime hazard and extreme longevity is the same as that of APOE, while a ratio of zero suggests no effect on longevity. A true ratio between 0 and 1 suggests a stronger effect on lifetime hazard than longevity relative to APOE. SNPs overlapping both 0 and 1 are individually underpowered. The inverse variance meta-analysis of alpha over all SNPs, excluding APOE, is 0.42 (95% 0.23 to 0.61; p = 1.35 × 10⁻⁵) for H0 alpha = 0.
-
Figure 4—source data 1
Replication of lead SNPs associating with lifespan using published longevity GWAS.
At or near – gene, cluster of genes, or cytogenetic band near lead SNP; Proxy – the rsID of the nearest (r2) SNP reported by Deelen et al.; Chr – Chromosome; Position – Base-pair position (GRCh37); A1 – the effect allele, A0 – the reference allele, Freq1 – the frequency of A1 allele; Beta1 – the log hazard ratio (in self) for a carrier of 1 copy of A1; SE – standard error; P – P value for test of association between proxy and lifespan (for IVM replication this is one sided); Discovery – the combined GWAS of UKBB genomically British, UKBB other and LifeGen; Replication – the GWAMAs of Deelen et al. (2014) and Broer et al. (2015), recalibrated (using APOE) to log hazard ratios, combined using inverse-variance meta-analysis, and adjusted for sample overlap; Alpha – the ratio of effect size in replication to discovery (note as this was calibrated on APOE, that result was necessarily 1).
- https://doi.org/10.7554/eLife.39856.017
Figure 5
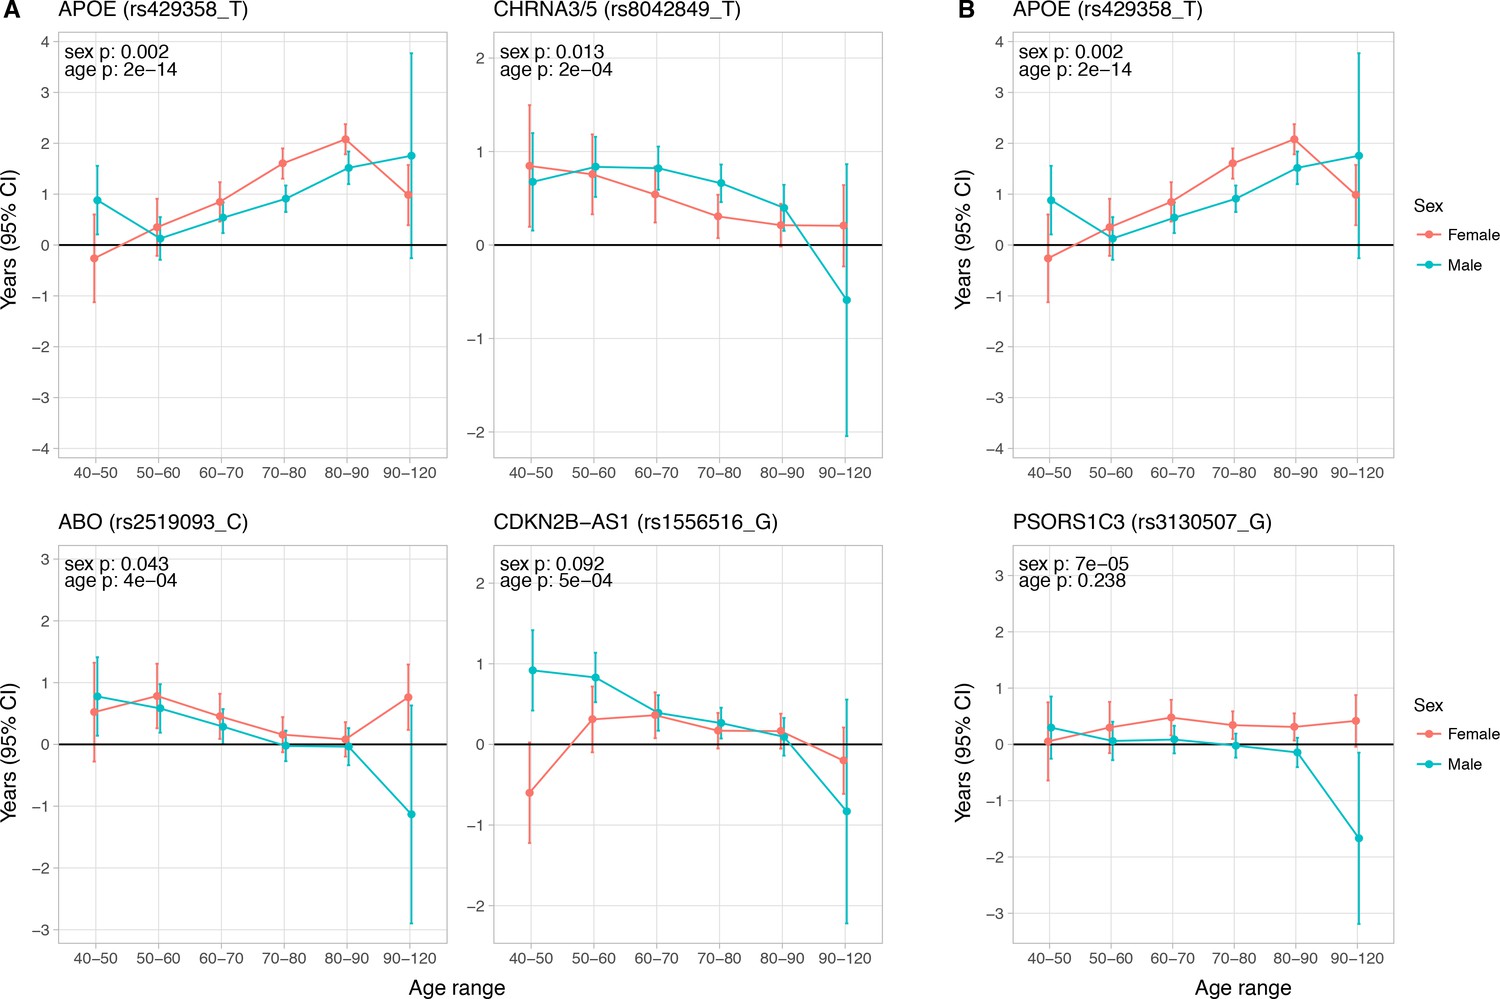
Age and sex specific effects on parent survival for 5 variants showing 5% FDR age- or sex-specificity of effect size from 23 lifespan-increasing variants.
(A) Variants showing age-specific effects; (B) Variants showing sex-specific effects. Panel titles show the gene, cluster of genes, or cytogenetic band in close proximity to the index lifespan variant, with this variant and lifespan-increasing allele in parentheses. Beta – loge(protection ratio) for 1 copy of effect allele in self in the age band (i.e. 2 x observed due to 50% kinship). Note the varying scale of y-axis across panels. Age range: the range of ages over which beta was estimated. Sex p – nominal P value for association of effect size with sex. Age p – nominal P value for association of effect size with age.
-
Figure 5—source data 1
Sex and age stratified effects on survival for 24 lifespan increasing variants.
At or near – Gene, cluster of genes, or cytogenetic band in close proximity to lead variant. Variant – rsID, longevity allele. Parent – Parent. Age range – Lower limit to upper limit of age in analysis. N – Number of lives used for the analysis (e.g. a parent aged 55 contributed to analysis of 40–50 and 50–60, but not 60–70). Deaths – Number of deaths within the age range. Beta – loge(protection ratio) for 1 copy of effect allele in self in the age band (i.e. 2 x observed due to kin cohort method). SE – Standard error. Z – Test statistic for test of H0. P – P value of two sided test of association.
- https://doi.org/10.7554/eLife.39856.019
-
Figure 5—source data 2
Effect sizes of sex and age moderators within fixed-effects with moderators’ model of longevity alleles for 24 SNPs.
At or near – Gene, cluster of genes, or cytogenetic band in close proximity to lead variant. Variant – rsID, longevity allele. Beta – Moderator effect estimate of sex (categorical variable, being male) or age (ordinal variable, mean age in age band) on lead SNP effect on lifespan. SE – Standard error. P – P value for association of SNP lifespan effect size with age or sex. Q – Benjamini-Hochberg FDR-corrected P value. Bolded lines contain sex or age-specific effects passing a 5% FDR threshold.
- https://doi.org/10.7554/eLife.39856.020
Figure 6
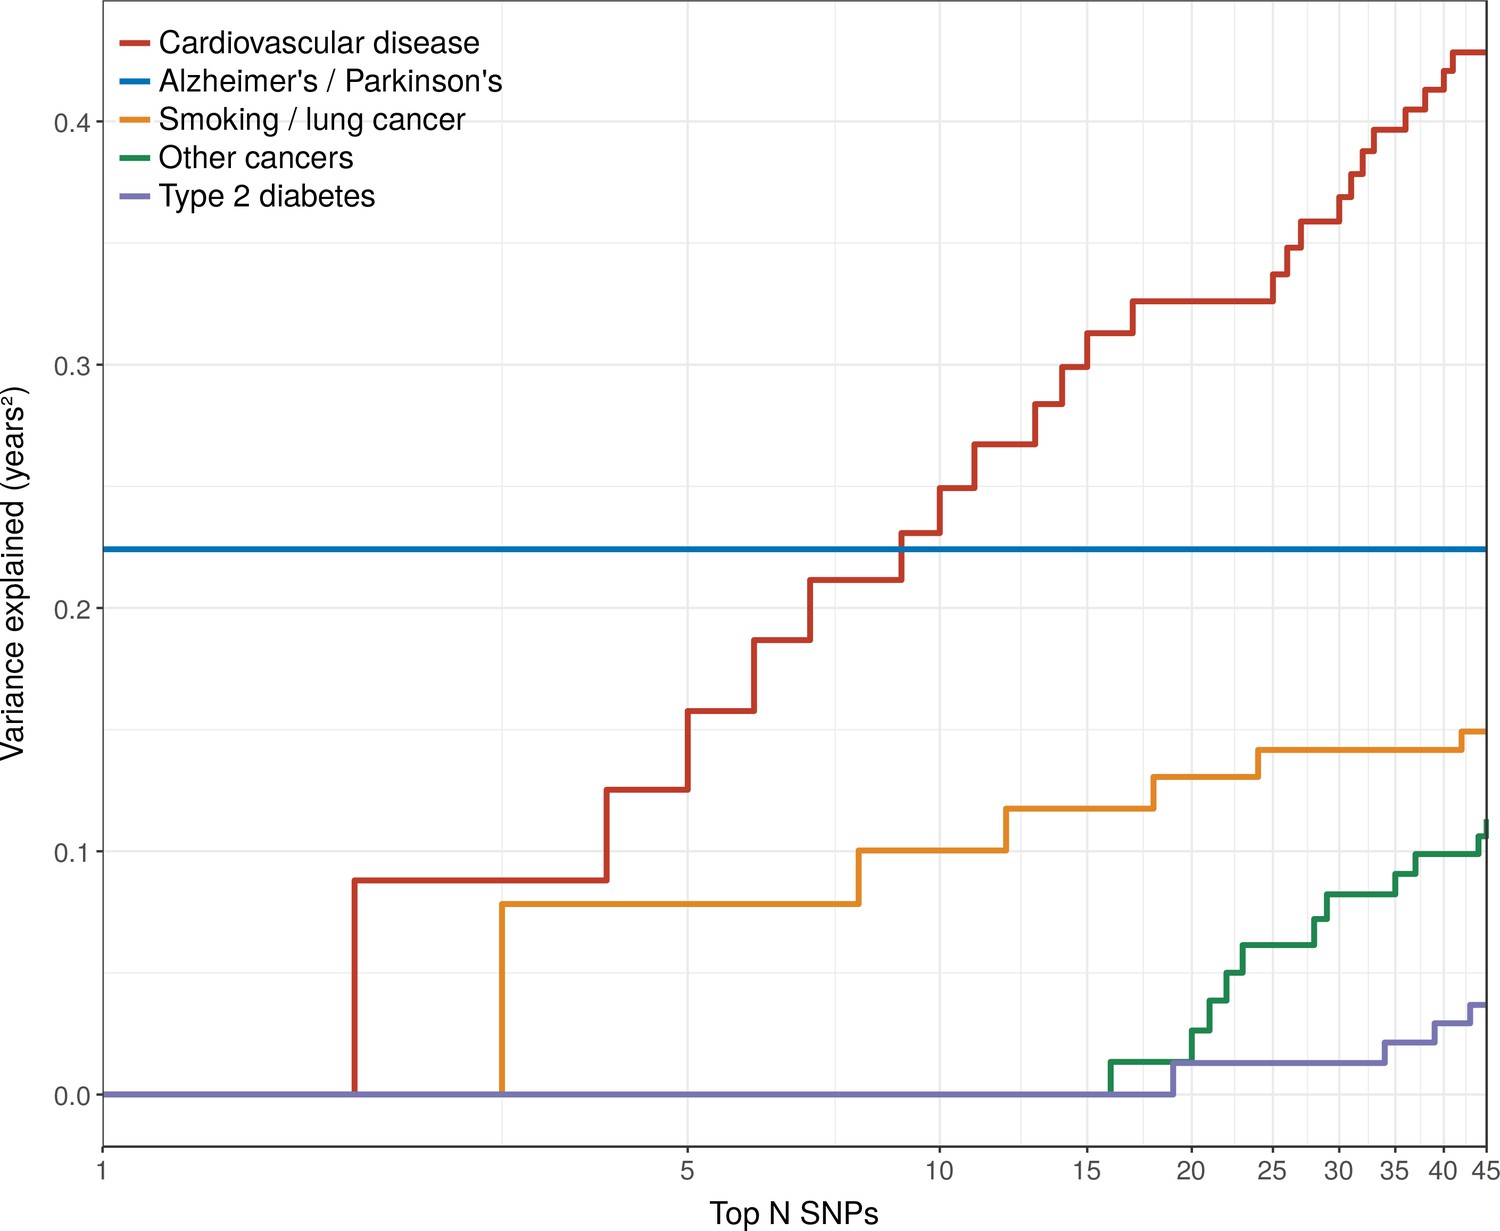
Disease loci explaining the most lifespan variance are protective for neurological disease, cardiovascular disease, and lung cancer.
SNPs reported as genome-wide significant for disease in European population studies, ordered by their lifespan variance explained (LVE), show the cumulative effect of disease SNPs on variation in lifespan. An FDR cut-off of 1.55% is applied simultaneously across all diseases, allowing for one false positive association with lifespan among the 45 independent loci. Note the log scale on the X axis. Cardiovascular disease – SNPs associated with cardiovascular disease or myocardial infarction. Alzheimer's/Parkinson's – SNPs associated with Alzheimer’s disease or Parkinson’s disease. Smoking/lung cancer – SNPs associated with smoking behaviour, chronic obstructive pulmonary disease and lung adenocarcinomas. Other cancers – SNPs associated with cancers other than lung cancer (see Figure 7—source data 1 for a full list). Type 2 diabetes – SNPs associated with type 2 diabetes.
Figure 7
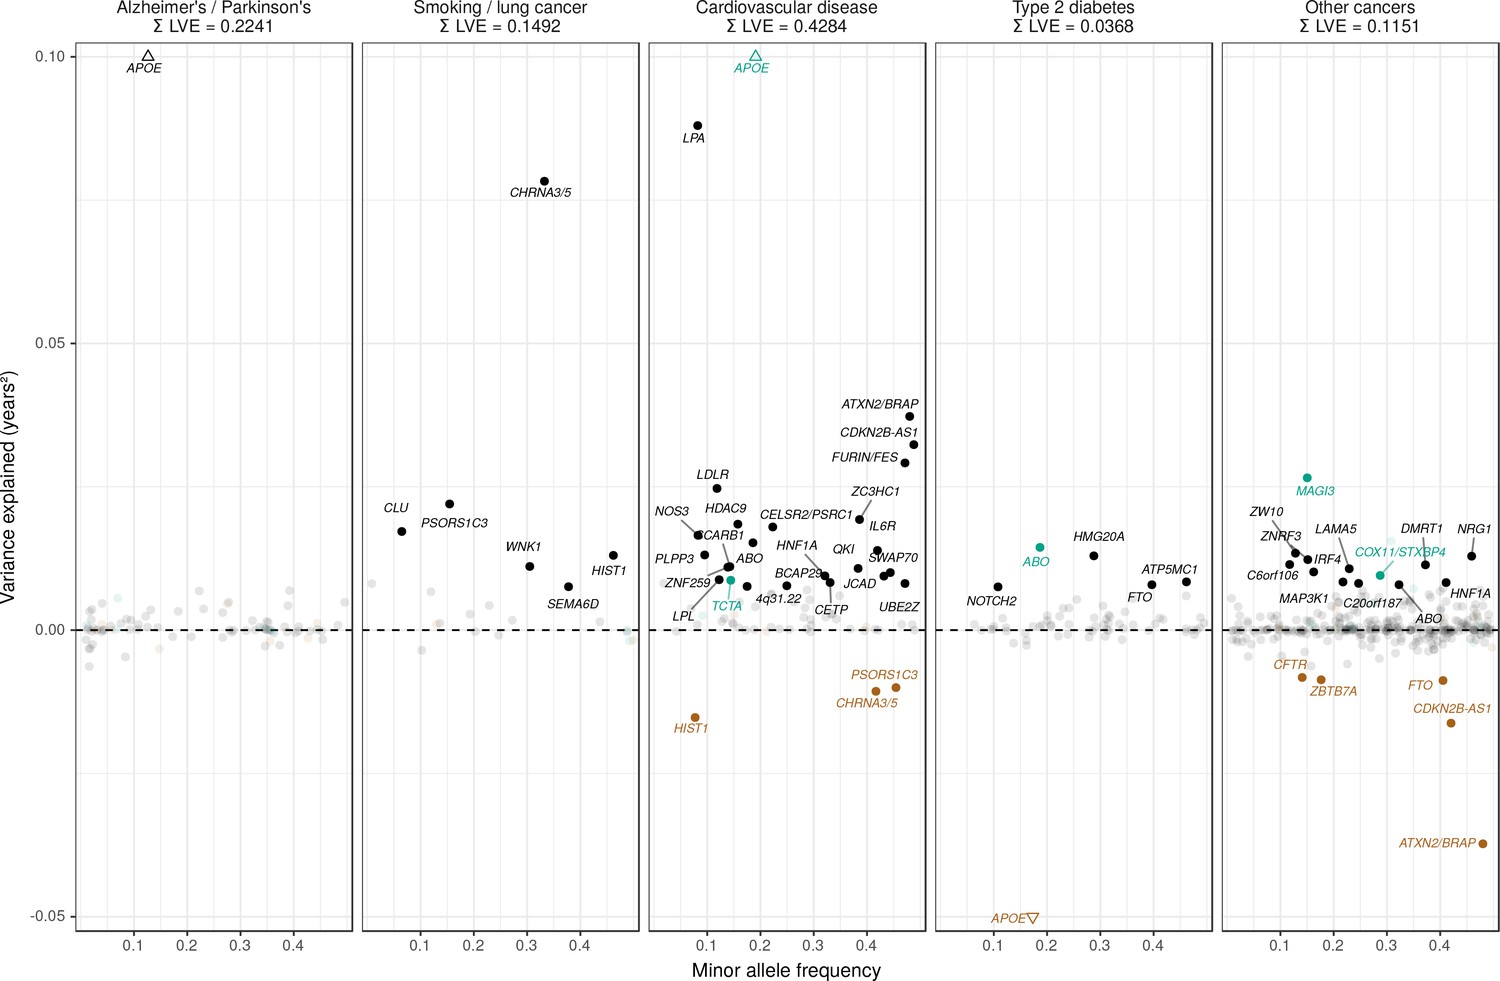
Lifespan variance explained by individual genome-wide significant disease SNPs within disease categories.
Genome-wide significant disease SNPs from the GWAS catalog are plotted against the amount of lifespan variance explained (LVE), with disease-protective alleles signed positively when increasing lifespan and signed negatively when decreasing lifespan. SNPs with limited evidence of an effect on lifespan are greyed out: an FDR cut-off of 1.55% is applied simultaneously across all diseases, allowing for one false positive among all significant SNPs. Secondary pleiotropic SNPs (i.e. those associating more strongly with another one of the diseases, as assessed by PheWAS in UK Biobank) are coloured to indicate the main effect on increased lifespan seems to arise elsewhere. Of these, turquoise SNPs show one or more alternative disease associations in the same direction and at least twice as strong (double Z statistic – see Detailed Materials and methods) as the principal disease, while brown SNPs show one or more significant associations with alternative disease in the opposite direction that explains the negative association of the disease-protective SNP with lifespan. The variance explained by all SNPs in black is summed (∑LVE) by disease. Annotated are the gene, cluster of genes, or cytogenetic band near the lead SNPs. The Y axis has been capped to aid legibility of SNPs with smaller LVE: SNPs near APOE pass this cap and are represented by triangles. See Figure 7—source data 1 for the full list of disease SNP associations.
-
Figure 7—source data 1
List of genome-wide significant disease variants, their association with disease in UK Biobank and their lifespan variance explained.
Genome-wide significant disease SNPs from the GWAS catalog are listed with the amount of lifespan variance explained (LVE), with disease-protective alleles signed positively when increasing lifespan and signed negatively when decreasing lifespan. SNPs with limited evidence of an effect on lifespan are greyed out: an FDR cut-off of 1.55% is applied simultaneously across all diseases, allowing for one false positive among all significant SNPs. Secondary pleiotropic SNPs (i.e. those associating strongly with another one of the diseases, as assessed by PheWAS in UK Biobank) are coloured, as less relevant to the disease in question. Of these, turquoise SNPs show one or more alternative disease associations in the same direction and at least twice as strong (double Z statistic) as the principal disease, while brown SNPs show one or more significant associations with alternative disease in the opposite direction that explains the negative association of the disease-protective SNP with lifespan. Of specific interest is the SNP near MAGI3, which is reported as a breast cancer SNP but associates more strongly with CVD in UK Biobank and shows no evidence of sex-specific effects on lifespan. However, we do not classify it as a CVD SNP as its main effect on lifespan is likely due to protection from autoimmune disease by a nearby missense variant (rs6679677_C, r2 > 0.6, 95% CI log OR type one diabetes –0.74 to –0.46 (Cooper et al., 2008); rheumatoid arthritis −0.66 to −0.50 (Raychaudhuri et al., 2008), and carrying these diseases can reduce life expectancy up to 13 years (Myllykangas-Luosujärvi et al., 1995; Livingstone et al., 2015). Similarly, the HLA-DQA1 locus also associates most strongly with autoimmune disease and is therefore absent from the analysis. At or near – Gene, cluster of genes, or cytogenetic band in close proximity to lead variant. Chr – Chromosome. Position – Base-pair position on chromosome (build GRCh37). A1 – Allele protecting from disease or disease risk factors. Freq1 – Frequency of the disease-protective allele in the discovery + replication sample. Years – Years of lifespan gained for carrying one copy of the A1 allele. P – P value for association with lifespan under CES assumption (left), P value for genome-wide significant association with disease as reported in the GWAS catalog (right). Q – Benjamini-Hochberg FDR-corrected P value for association with lifespan. LVE – Lifespan variance explained, signed positively when A1 increases lifespan and negative when A1 decreases lifespan. Pleiotropic – SNP shows evidence of pleiotropy, see definition above. Trait – Disease trait reported in GWAS catalog. Beta1 – log OR for having the reported disease, or unit increase in risk factors associated with disease, per copy of A1 allele. PMID – PubMed identification number of the study reporting the disease association. Z estimates – Z statistic for association with disease in unrelated, Gen. British UK Biobank samples. Missing statistics indicate the SNP is not present in the CES meta-analysis summary statistics and its LVE has been imputed from the closest proxy (min. r2 > 0.9) or proxies if equally close.
- https://doi.org/10.7554/eLife.39856.023
Figure 8 with 1 supplement
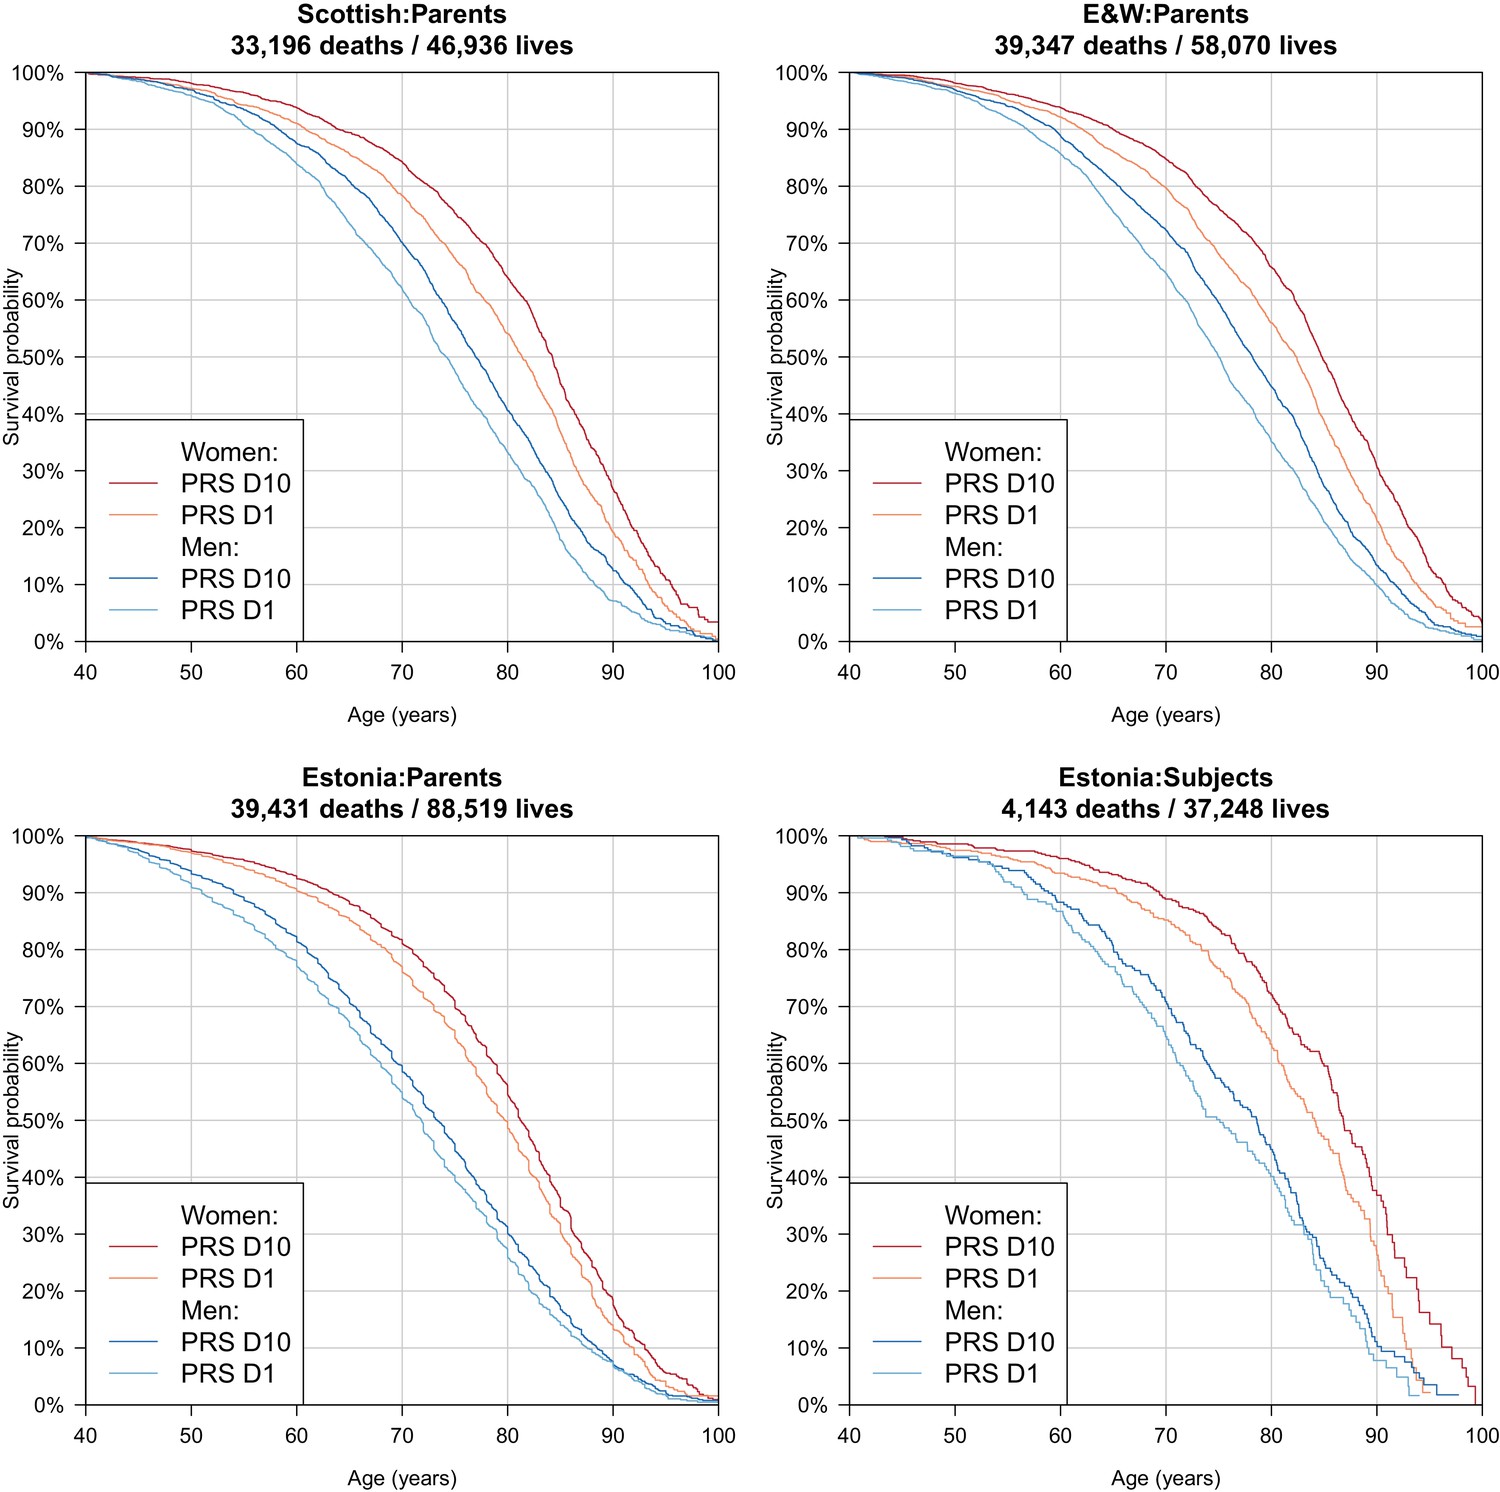
Survival curves for highest and lowest deciles of lifespan polygenic risk score.
A polygenic risk score was made for each subject using GWAS results that did not include the subject sets under consideration. Subject or parent survival information (age entry, age exit, age of death (if applicable) was used to create Kaplan-Meier curves for the top and bottom deciles of score. In this figure (only) no adjustment has been made for the dilution of observed effects due to parent imputation from cohort subjects. Effect sizes in parent, if parent genotypes had been used, are expected to be twice that shown. E and W – England and Wales; PRS – polygenic risk score.
Figure 8—figure supplement 1
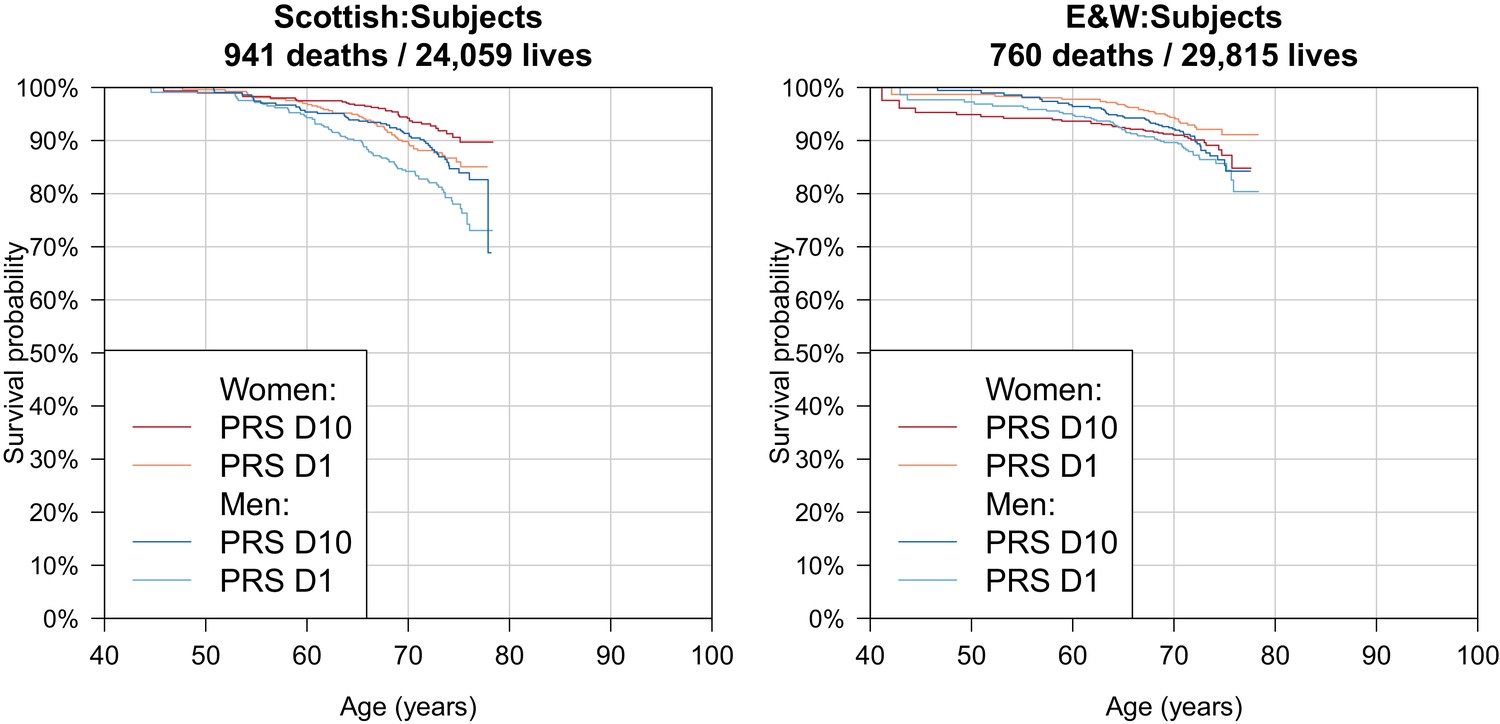
Survival Curves for highest and lowest deciles of lifespan polygenic risk score in UK Biobank subjects.
A polygenic risk score was made for each subject using GWAS results that did not include the subject sets under consideration. Subject survival information (age entry, age exit, age of death (if applicable) was used to create Kaplan-Meier curves for the top and bottom deciles of score. The narrow range of ages and short time since inception means that UK Biobank subject curves are subject to greater uncertainty, particularly at each end, and only cover a shorter interval. E and W – England and Wales; PRS – polygenic risk score.
Figure 9 with 1 supplement
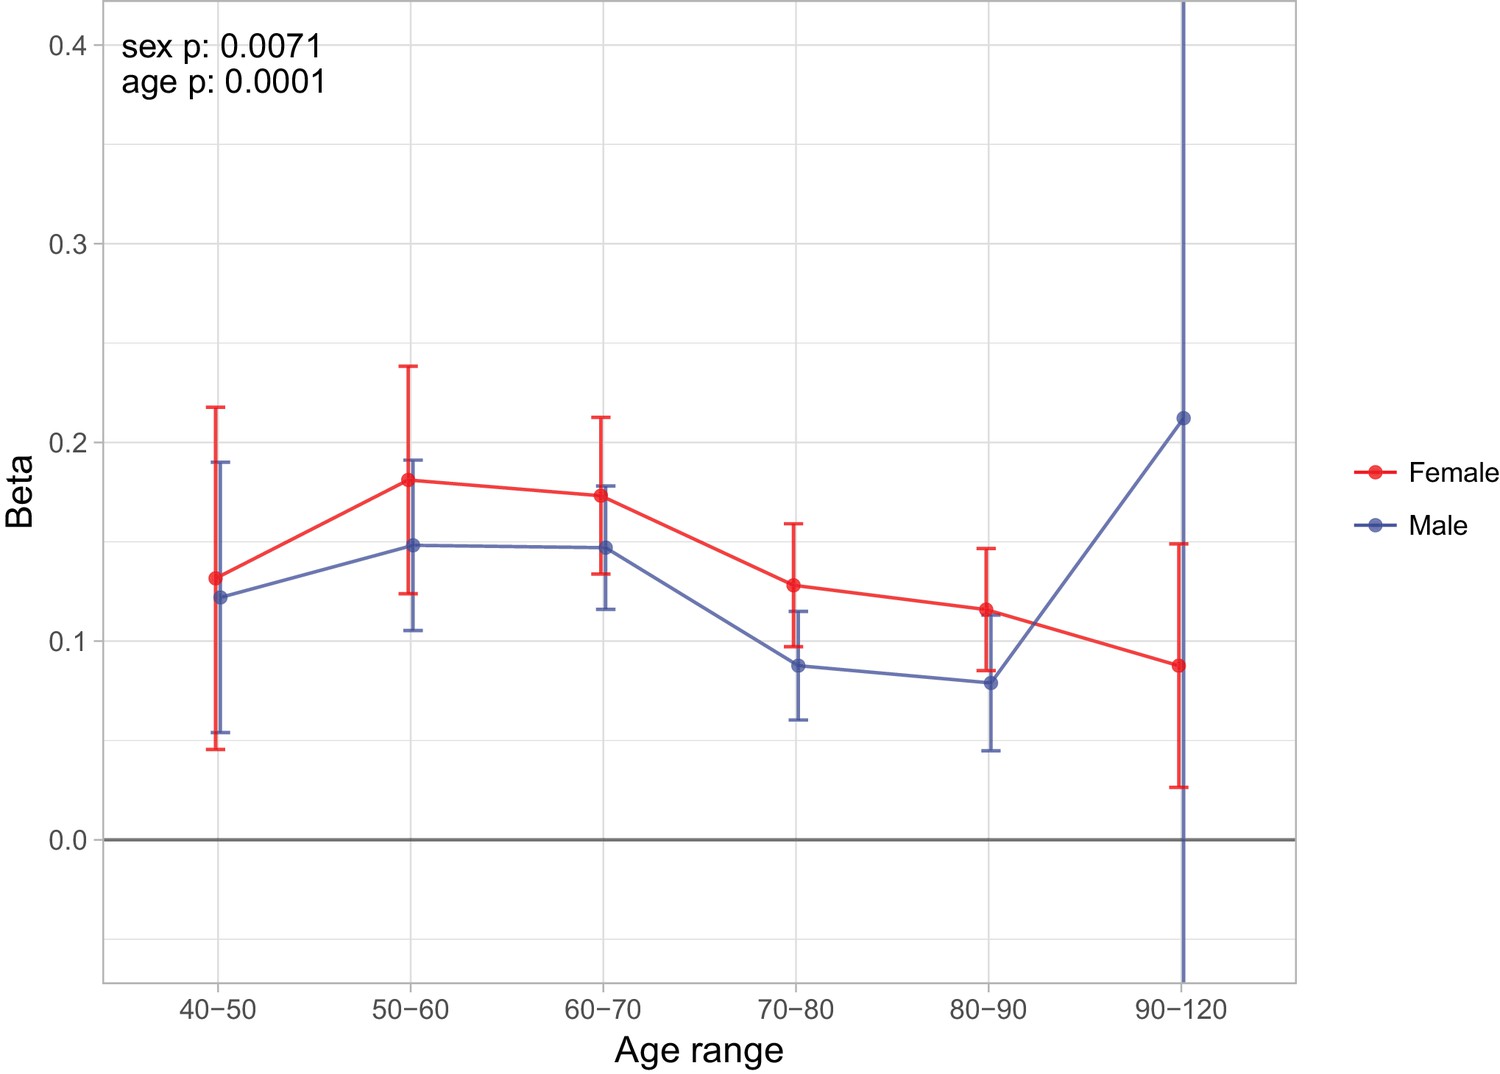
Sex and age specific effects of polygenic survival score (PRS) on parental lifespan in UK Biobank.
The effect of out-of-sample PRS on parental lifespan stratified by sex and age was estimated for Scottish and English/Welsh subsamples individually (see Figure 9—figure supplement 1) and subsequently meta-analysed. The estimate for the PRS on father lifespan in the highest age range has very wide confidence intervals (CI) due to the limited number of fathers surviving past 90 years of age. The beta 95% CI for this estimate is –0.15 to 0.57. Beta – loge(protection ratio) for one standard deviation of PRS for increased lifespan in self in the age band (i.e. 2 x observed due to 50% kinship), bounds shown are 95% CI; Age range – the range of ages over which beta was estimated; sex p – P value for association of effect size with sex; age p – P value for association of effect size with age.
-
Figure 9—source data 1
Sex and age-stratified association of polygenic score on lifespan.
A polygenic risk score was made for each subject using GWAS results that did not include the subject sets under consideration. Parent survival information (age and alive/dead status) was stratified by sex and age. Sample – Out-of-sample subsets of UK Biobank individuals used for PGRS association (E and W: English and Welsh). N – Number of parental lifespans reported by sample individuals and used for the analysis (e.g. a parent aged 55 contributed to analysis of 40–50 and 50–60, but not 60–70). Deaths – Number of parental deaths within the age range reported by sample individuals. Ages – Lower limit to upper limit of age in analysis. Beta – loge(protection ratio) for one standard deviation in polygenic score in self in the age band (i.e. 2 x observed due to kin cohort method). SE – Standard error. P – P value of two sided test of association.
- https://doi.org/10.7554/eLife.39856.029
Figure 9—figure supplement 1
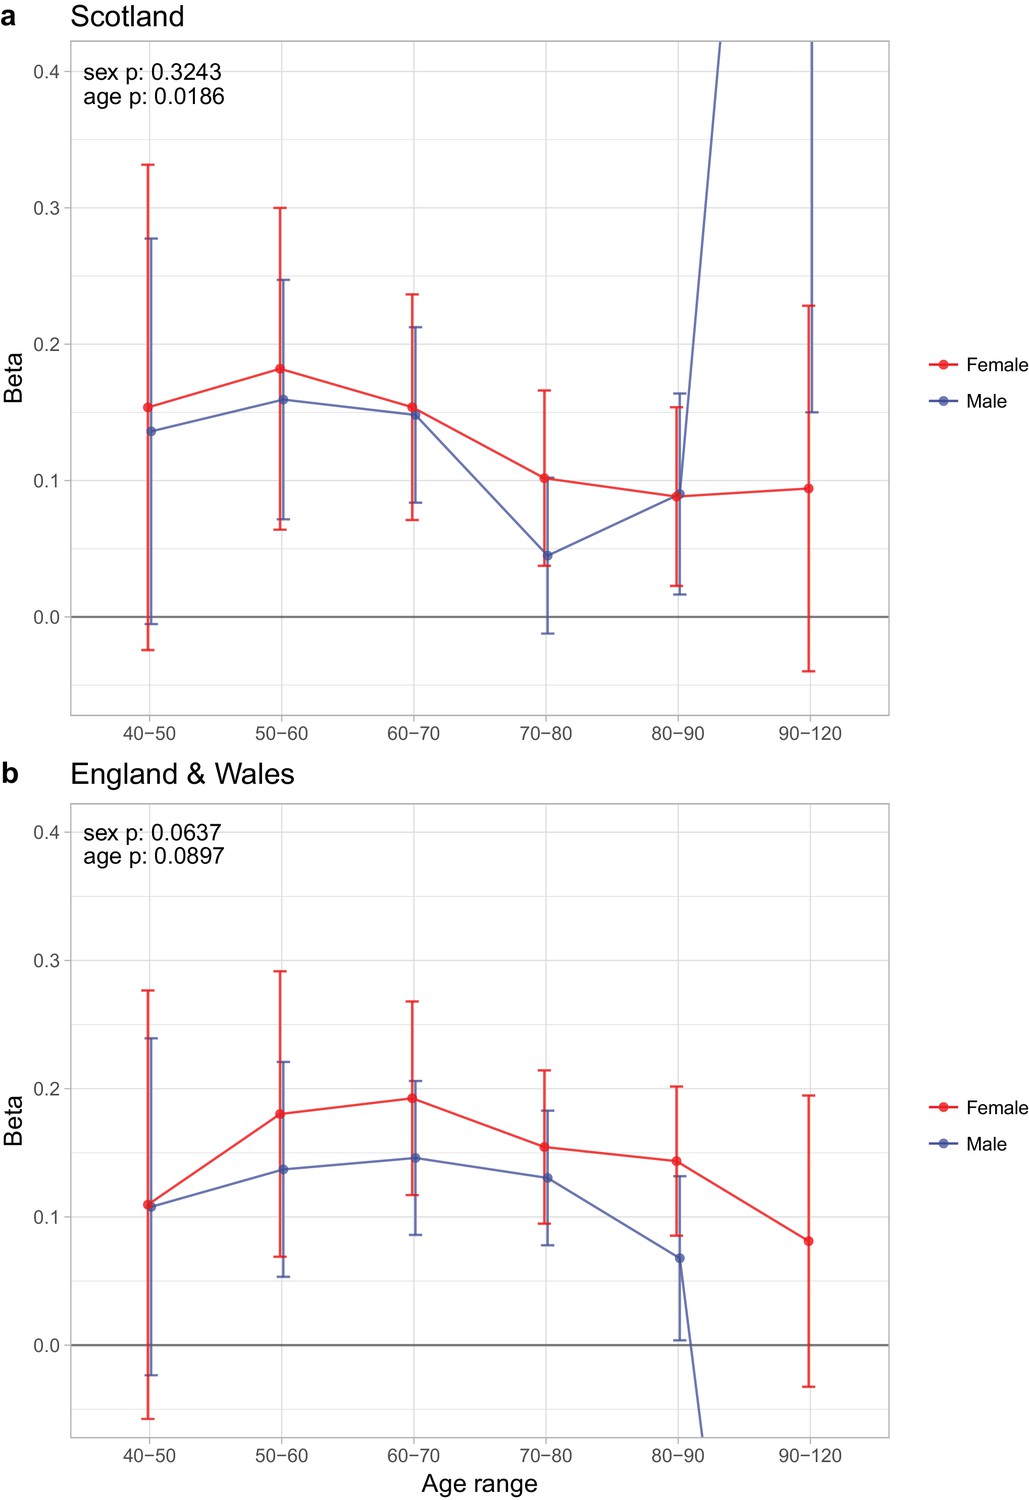
Sex and age specific effects of polygenic survival score (PRS) on parental lifespan of Scottish and English/Welsh subsamples of UK Biobank.
(A) Out of sample Scottish subset of UK Biobank; (B) Out of sample English and Welsh subset of UK Biobank; Estimates for the PRS on father lifespan in the highest age range have very wide confidence intervals (CI) due to the limited number of fathers surviving past 90 years of age. The beta 95% CI for these estimates are 0.15 to 2.20 for Scottish subsamples and –1.34 to –0.16 for English and Welsh subsamples. Beta – loge(protection ratio) for one standard deviation of PRS for increased lifespan in self in the age band (i.e. 2 x observed due to 50% kinship), bounds shown are 95% CI; Age range – the range of ages over which beta was estimated; sex p – P value for association of effect size with sex; age p – P value for association of effect size with age.
Figure 10 with 1 supplement
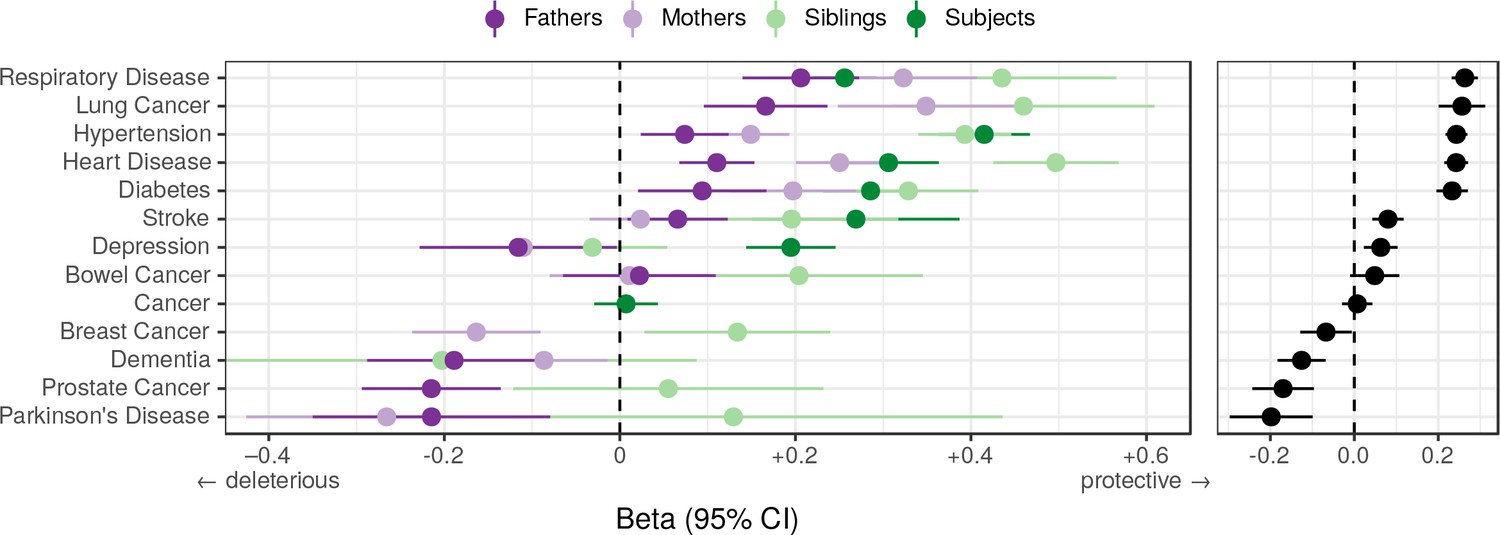
Associations between polygenic lifespan score and diseases of UK Biobank subjects and their kin.
Logistic regression was performed on standardised polygenic survival score (all variants) and 21 disease traits reported by 24,059 Scottish and 29,815 English/Welsh out-of-sample individuals about themselves and their kin. For grouping of UK Biobank disease codes, see Figure 10—source data 1. Displayed here are inverse-variance meta-analysed estimates of the diseases for which multiple sources of data were available (i.e. parents and/or siblings; see Figure 10—figure supplement 1 for all associations). ‘Cancer’ is only in subjects, whilst the specific subtypes are analysed for kin. The left panel shows disease estimates for each kin separately; the right panel shows the combined estimate, with standard errors adjusted for correlation between family members. Diseases have been ordered by magnitude of effect size (combined estimate). Beta – log odds reduction ratio of disease per standard deviation of polygenic survival score, where a negative beta indicates a deleterious effect of score on disease prevalence (lifetime so far), and positive beta indicates a protective effect on disease. Effect sizes for first degree relatives have been doubled. Cancer – Binary cancer phenotype (any cancer, yes/no).
-
Figure 10—source data 1
Grouping of UK Biobank disease codes into diseases and major disease categories.
UKBB phenotypes included 29 self-reported non-cancer disease fields for the participants and each of their parents, which included 474 integer-value coded diseases. These 474 diseases were aggregated and meta-analysed into four major mortality-increasing disease groups, namely CVD, diabetes, neurological and pulmonary disorders. Cancer was the fifth major disease group and was coded as either the occurrence or absence of cancers instances throughout the participant’s lifetime. Codes not shown were excluded from the analysis.
- https://doi.org/10.7554/eLife.39856.032
-
Figure 10—source data 2
Associations of polygenic score with diseases in UK Biobank.
A polygenic risk score was made for each subject using GWAS results that did not include the subject sets under consideration. Disease associations have been identified in the subjects, their siblings, or parents, at FDR 5%. See Figure 10—source data 1 for disease code grouping. Sample –– Out-of-sample subsets of UK Biobank individuals used for PGRS association (E and W: English and Welsh). Kin – Family member for which the disease was reported. Trait – Disease reported by UK Biobank subject. N – Number of individuals tested. Cases – Number of reported individuals or kin carrying the disease. Beta – log OR of NOT carrying the disease per standard deviation of PGRS (i.e. positive beta indicates the PGRS protects from disease). SE – Standard Error. P – Two-sided P value. Q – Benjamin-Hochberg adjusted P value.
- https://doi.org/10.7554/eLife.39856.033
Figure 10—figure supplement 1
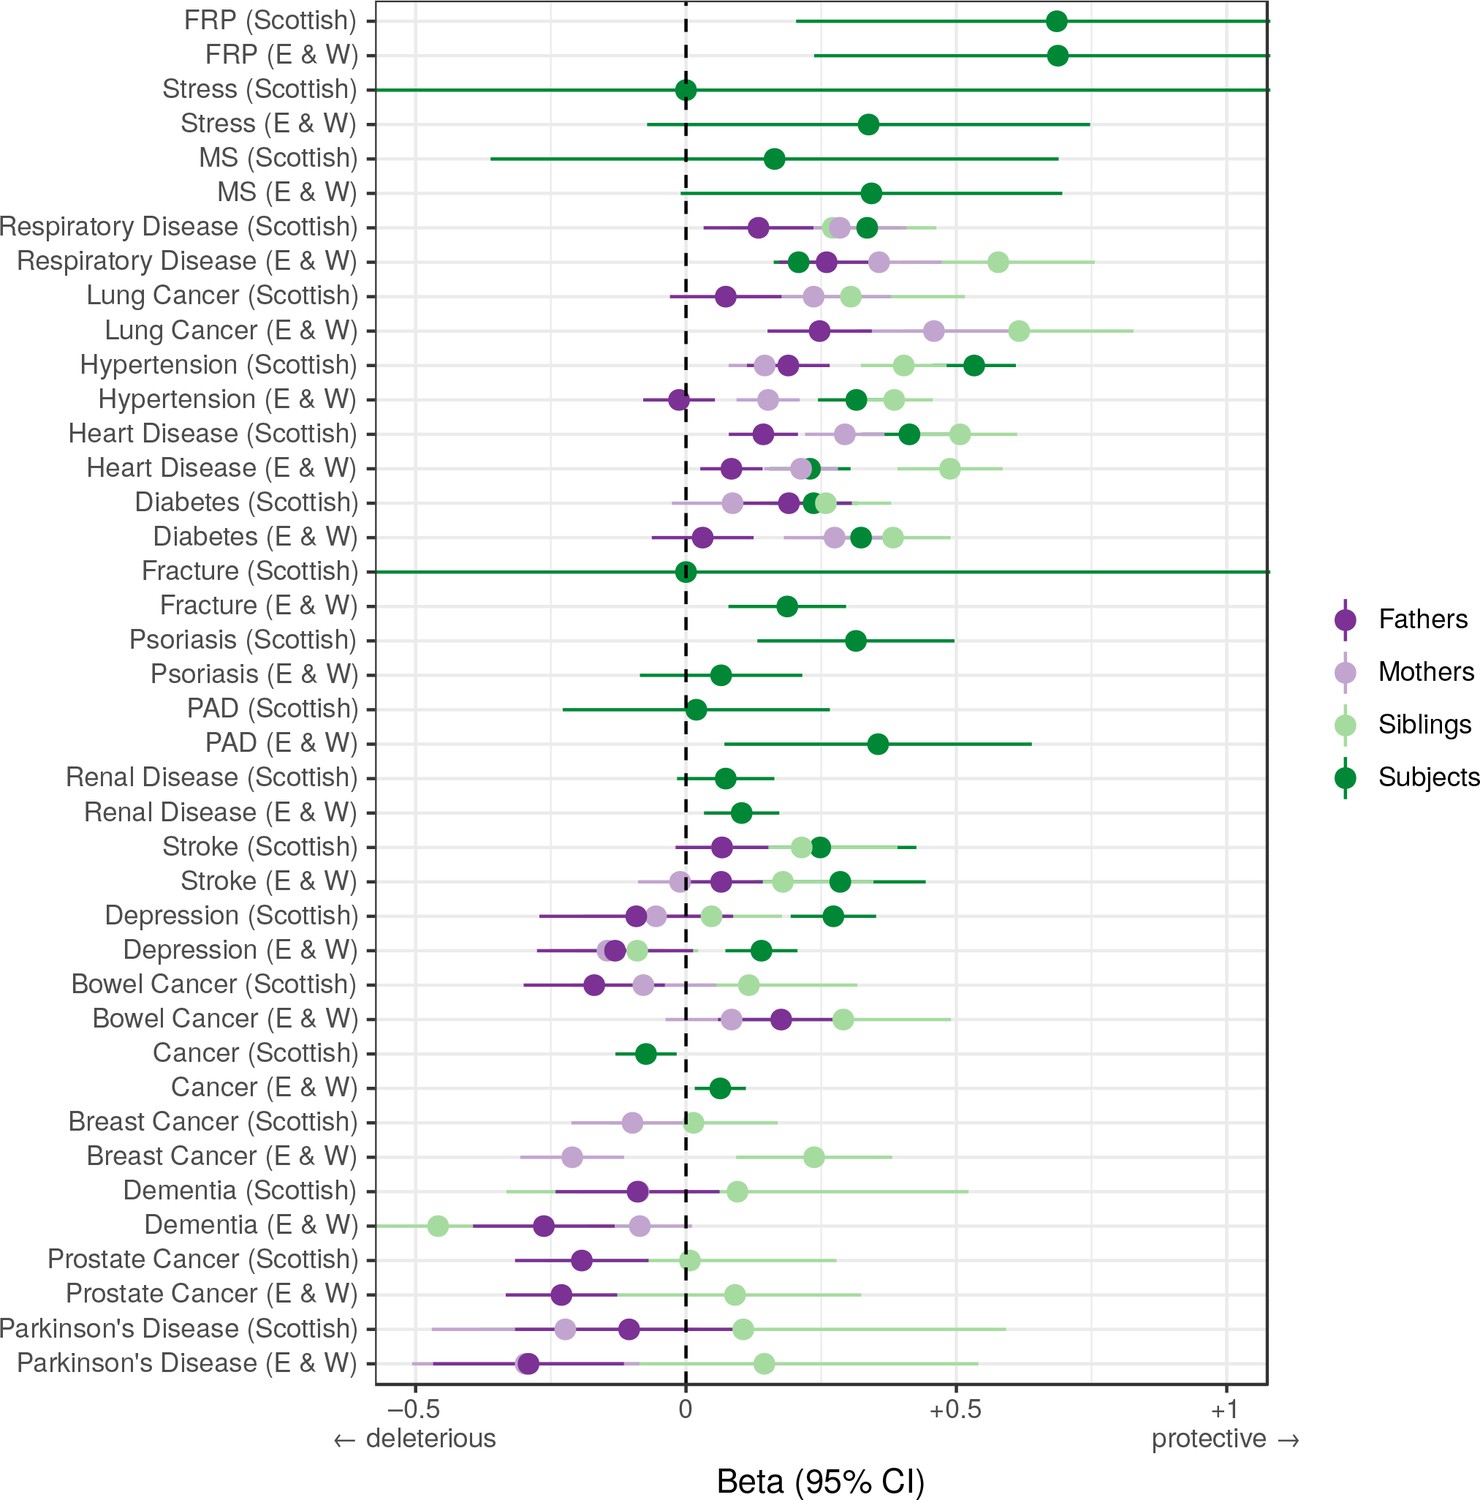
Associations between polygenic survival score and diseases of individuals and their kin from Scottish and English/Welsh subsamples of UK Biobank.
Logistic regression was performed on standardised polygenic survival score (all variants) and 21 traits reported by 24,059 Scottish and 29,815 English/Welsh out-of-sample individuals about themselves and their kin. Diseases have been ordered by magnitude of effect size (meta-analysed between cohorts and kin). Beta – log odds reduction ratio of disease per standard deviation of polygenic survival score, where a negative beta indicates a deleterious effect of score on disease prevalence (lifetime so far), and positive beta indicates a protective effect on disease. Effect sizes for first degree relative have been doubled. Cancer – Binary cancer phenotype (yes/no), FRP – Female Reproductive Problems, MS – Multiple Sclerosis, PAD – Peripheral Artery Disease.
Tables
Table 1
Twelve genome-wide significant associations with lifespan using UK Biobank and LifeGen.
Parental phenotypes from UK Biobank and LifeGen meta-analysis, described in Table 1—source data 1, were tested for association with subject genotype. See Table 1—source data 2 for LD Score regression intercept of each cohort separately and combined. Displayed here are loci associating with lifespan at genome-wide significance (p < 2.5 × 10⁻⁸). At or near – Gene, set of genes, or cytogenetic band nearest to the index SNP; rsID – The index SNP with the lowest P value in the standard or sex-specific effect (SSE) analysis. Chr – Chromosome; Position – Base-pair position on chromosome (GRCh37); A1 – the effect allele, increasing lifespan; Freq1 – Frequency of the A1 allele; Years1 – Years of life gained for carrying one copy of the A1 allele; SE – Standard Error; P – the P value for the Wald test of association between imputed dosage and cox model residual; Disease – Category of disease for known associations with SNP or close proxies (r2 > 0.6), see Table 1—source data 3 for details and references. Despite the well-known function of the HTT gene in Huntington’s disease, SNPs within the identified locus near this gene have not been associated with the disease at genome-wide significance.
| At or near | rsID | Chr | Position | A1 | Freq1 | Years1 | SE | P | SSE P | Disease |
|---|---|---|---|---|---|---|---|---|---|---|
| MAGI3 | rs1230666 | 1 | 114173410 | G | 0.85 | 0.3224 | 0.0555 | 6.4E-09 | 6.1E-08 | Autoimmune |
| KCNK3 | rs1275922 | 2 | 26932887 | G | 0.74 | 0.2579 | 0.0443 | 6.0E-09 | 2.7E-07 | Cardiometabolic |
| HTT | rs61348208 | 4 | 3089564 | T | 0.39 | 0.2299 | 0.0395 | 5.8E-09 | 1.2E-07 | - |
| HLA-DQA1 | rs34967069 | 6 | 32591248 | T | 0.07 | 0.5613 | 0.0956 | 4.3E-09 | 3.6E-09 | Autoimmune |
| LPA | rs10455872 | 6 | 161010118 | A | 0.92 | 0.7639 | 0.0743 | 8.5E-25 | 3.1E-24 | Cardiometabolic |
| CDKN2B-AS1 | rs1556516 | 9 | 22100176 | G | 0.50 | 0.2510 | 0.0386 | 7.5E-11 | 6.4E-12 | Cardiometabolic |
| ATXN2/BRAP | rs11065979 | 12 | 112059557 | C | 0.56 | 0.2798 | 0.0393 | 1.0E-12 | 6.2E-13 | Autoimmune/ Cardiometabolic |
| CHRNA3/5 | rs8042849 | 15 | 78817929 | T | 0.65 | 0.4368 | 0.0410 | 1.6E-26 | 1.9E-30 | Smoking-related |
| FURIN/FES | rs6224 | 15 | 91423543 | G | 0.52 | 0.2507 | 0.0390 | 1.3E-10 | 1.8E-09 | Cardiometabolic |
| HP | rs12924886 | 16 | 72075593 | A | 0.80 | 0.2798 | 0.0493 | 1.4E-08 | 9.1E-08 | Cardiometabolic |
| LDLR | rs142158911 | 19 | 11190534 | A | 0.12 | 0.3550 | 0.0616 | 8.1E-09 | 3.3E-08 | Cardiometabolic |
| APOE | rs429358 | 19 | 45411941 | T | 0.85 | 1.0561 | 0.0546 | 3.1E-83 | 1.8E-85 | Cardiometabolic/ Neuropsychiatric |
-
Table 1—source data 1
Descriptive statistics of the cohorts and lives analysed.
Summary statistics for the 1,012,240 parental lifespans passing phenotypic QC (most notably, parent age > 40). In practice, fewer lives than these were analysed for some SNPs, as a SNP may not have passed QC in all cohorts (in particular LifeGen MAF > 1%). Ancestries in UK Biobank are self-declared, except in the case of Gen. British. Gen. British – Participants identified as genomically British by UK Biobank, based on their genomic profile. LifeGen – A consortium of 26 population cohorts of European Ancestry, with UK Biobank lives removed.
- https://doi.org/10.7554/eLife.39856.004
-
Table 1—source data 2
LD-score regression intercepts for GWAS results.
Regression intercepts (standard error) of the GWAS summary statistics as calculated by LD-score regression, using LD scores from on average 457,407 SNPs from the UK Biobank array. CES – Results under the assumption of common effect sizes across sexes, SSE – Results allowing for sex-specific effects.
- https://doi.org/10.7554/eLife.39856.005
-
Table 1—source data 3
Known associations with genome-wide significant lifespan loci.
Genome-wide significant associations from the GWAS catalog and PhenoScanner are reported for the lead SNP and proxies (r2 > 0.6). Similar associations have been grouped, keeping the most significant association and the shortest trait name (Trait). At or near – Gene or cluster of genes in close proximity to lead SNP; A1 – the effect allele, increasing lifespan; A0 – the reference allele. Freq1- Frequency of the A1 allele in the original study, or if missing, averaged from all associations; Beta1 – the reported effect on the trait for carrying one copy of the A1 allele; SE – Standard Error; P – P value; Disease – the type of lifespan-shortening diseases linked to the trait, or ‘other’ if the link is unclear or multiple disease links exist.
- https://doi.org/10.7554/eLife.39856.006
Table 2
Bayesian GWAS using mortality risk factors reveals seven additional genome-wide significant variants.
At or near – Gene or set of genes nearest to the index SNP; rsID – The index SNP with the lowest P value in the risk factor-informed analysis. Chr – Chromosome; Position – Base-pair position on chromosome (GRCh37); A1 – the effect allele, increasing lifespan; Freq1 – Frequency of the A1 allele; Years1 – Years of life gained for carrying one copy of the A1 allele; SE – Standard Error; CES P – the P value for the Wald test of association between imputed dosage and cox model residual, under the assumption of common effects between sexes. Risk – mortality risk factors associated with the variant (p < 3.81 × 10⁻⁵, accounting for 82 independent SNPs and 16 independent factors). BF P – Empirical P value derived from permutating Bayes Factors. See Table 2—source data 1 for the causal estimate of each risk factor. See Table 2—source data 2 for all SNPs significant at FDR < 1%.
| At or near | rsID | Chr | Position | A1 | Freq1 | Years1 | SE | CES P | Risk | BF P |
|---|---|---|---|---|---|---|---|---|---|---|
| CELSR2/PSRC1 | rs4970836 | 1 | 109821797 | G | 0.23 | 0.2234 | 0.0463 | 1.4E-06 | LDL HDL CAD | 1.6E-09 |
| TMEM18 | rs6744653 | 2 | 628524 | A | 0.17 | 0.2772 | 0.0511 | 5.8E-08 | BMI | 7.0E-10 |
| GBX2/ASB18 | rs10211471 | 2 | 237081854 | C | 0.80 | 0.2401 | 0.0493 | 1.1E-06 | Education | 2.3E-08 |
| IGF2R | rs111333005 | 6 | 160487196 | G | 0.98 | 0.8665 | 0.1577 | 3.9E-08 | LDL CAD | 6.6E-09 |
| POM121C | rs113160991 | 7 | 75094329 | G | 0.78 | 0.2541 | 0.0495 | 2.8E-07 | BMI Insulin | 7.5E-09 |
| ZC3HC1 | rs56179563 | 7 | 129685597 | A | 0.39 | 0.2107 | 0.0406 | 2.1E-07 | CAD | 5.6E-09 |
| ABO | rs2519093 | 9 | 136141870 | C | 0.81 | 0.2244 | 0.0497 | 6.3E-06 | LDL CAD | 1.9E-08 |
-
Table 2—source data 1
Bayesian GWAS - Multivariate effect estimates for the 16 traits chosen by the AIC based stepwise model selection.
The multivariate MR identified 16 traits (58 tested, see McDaid et al., 2017 for an exhaustive list) with significant causal effect on lifespan and used the effect estimates to create the prior assumption of the expected effect size of each variant on lifespan, in the (Bayesian) iGWAS. Effect Estimate – the estimated effect of standardized trait on standardized lifespan, in multivariate model. SE – the standard error of the estimated effect, in multivariate model. P – the P value (two sided) from MR, for testing association between standardized trait and standardized lifespan, in multivariate model.
- https://doi.org/10.7554/eLife.39856.014
-
Table 2—source data 2
82 SNPs significantly associated with lifespan at 1% FDR and the SNP’s associations with risk factors.
Bayesian iGWAS was performed using observed association results from CES GWAS and priors from 16 risk factors selected by AIC based stepwise model selection. Bayes Factors were calculated to compare effect estimates observed in the conventional GWAS to the prior effect computed. Empirical P values were assigned using a permutation approach and further corrected for multiple testing using Benjamini-Hochberg correction. Chr – Chromosome, Position – Base-pair position on chromosome (GRCh37), A1 – Effect Allele, Freq1 – Frequency of the A1 allele (from conventional GWAS), Beta1 (from conventional GWAS), SE – Standard Error of Beta1, Years – Years of lifespan gained for carrying one copy of the A1 allele (from conventional GWAS), P – P value (from conventional GWAS), PriorEffect – Prior effect estimate calculated from the summary statistics data for the 16 risk factors identified, PriorSE – Standard Error of the prior effect estimate, LogBF – Log of the observed Bayes Factor, P_BF – Empirical P value from a permutation approach for the log Bayes Factor. Final columns show the P value of each SNP in the studies used to calculate the prior, if the P value is significant after Bonferroni multiple testing correction (p < 3.81 × 10⁻⁵, 82*16 tests) the cell is shaded green. Counts of these significant associations by SNP/trait are shown in the final column/row.
- https://doi.org/10.7554/eLife.39856.015
Table 3
Polygenic scores for lifespan associate with out-of-sample parent and subject lifespans.
A polygenic risk score (PRS) was made for each subject using GWAS results that did not include the subject sets under consideration. Subject or parent survival information (age entry, age exit, age of death, if applicable) was used to test the association between polygenic risk score and survival as (a) a continuous score and (b) by dichotomising the top and bottom decile scores. Population – Population sample of test dataset, where E and W is England and Wales; Kin – Individuals tested for association with polygenic score; N – Number of lives used for analysis; Deaths – Number of deaths; Beta – Effect size per PRS standard deviation, in loge(protection ratio), doubled in parents to reflect the expected effect in cohort subjects. SE – Standard error, doubled in parents to reflect the expected error in cohort subjects; Years – Estimated years of life gained per PRS standard deviation; P – P value of two-sided test of association; Contrast age at death – difference between the median lifespan of individuals in the top and bottom deciles of the score in year of life (observed parent contrast is again doubled to account for imputation of their genotypes).
| Sample descriptives | Effect of polygenic score | Contrast age at death | |||||||
|---|---|---|---|---|---|---|---|---|---|
| Population | Kin | N | Deaths | Beta | SE | Years | P | Men | Women |
| Scotland | Parents | 46,936 | 33,196 | 0.107 | 0.011 | 1.07 | 4.2E-22 | 5.6 | 5.6 |
| Scotland | Subjects | 24,059 | 941 | 0.085 | 0.033 | 0.85 | 1.0E-02 | - | - |
| E and W | Parents | 58,070 | 39,347 | 0.133 | 0.010 | 1.33 | 7.3E-39 | 6.4 | 4.8 |
| E and W | Subjects | 29,815 | 760 | 0.098 | 0.037 | 0.98 | 7.1E-03 | - | - |
| Estonia | Parents | 61,728 | 29,660 | 0.099 | 0.012 | 0.99 | 2.5E-17 | 3.0 | 2.8 |
| Estonia | Subjects | 24,800 | 2894 | 0.087 | 0.019 | 0.87 | 2.6E-06 | 3.5 | 2.7 |
| Per standard deviation | Top vs. bottom 10% | ||||||||
-
Table 3—source data 1
Polygenic survival scores in independent samples are most associated when including all markers.
A polygenic risk score was made for each subject using GWAS results that did not include the subject sets under consideration. Parent survival information (age and alive/dead status) was used to test the association between survival and several polygenic risk scores with different P value thresholds. Sample – Out-of-sample subsets of UK Biobank individuals used for PGRS association. N – Number of reported parental lifespans by sample individuals. Deaths – Number of reported parental deaths by sample individuals. Threshold – Criteria for SNPs to be included in the polygenic score. Beta – Loge(protection ratio) per standard deviation of polygenic score, doubled to reflect the effect of the score on offspring survival. SE – standard error of the effect estimate. Mean Years – Mean years of life gained per standard deviation in PGRS. P – P value of the effect of the polygenic score on lifespan.
- https://doi.org/10.7554/eLife.39856.025
Additional files
-
Supplementary file 1
Loci with significantly predicted candidate genes using SMR-HEIDI test and two eQTL datasets (blood tissue).
This PDF contains a table and plots of the lifespan GWAS and eQTL signals genes from Westra and CAGE eQTL studies that pass FDR < 5% threshold for the SMR test and p>0.05 threshold for HEIDI test.
- https://doi.org/10.7554/eLife.39856.035
-
Supplementary file 2
Predicted causal elements by SMR-HEIDI using expression and methylation QTL data.
This Excel workbook contains two sheets. The first sheet lists the genes and tissues prioritised by SMR-HEIDI using GTEx expression data, while the second sheet lists the methylation sites prioritised using mQTL data.
- https://doi.org/10.7554/eLife.39856.036
-
Supplementary file 3
Evidence of allelic heterogeneity of the lifespan loci via identification of secondary associations using SOJO.
This Excel workbook contains two sheets. The first sheet is a summary of the number of additional variants identified by SOJO per locus. The second sheet is a detailed list of all variants identified by SOJO per locus, their allele frequencies, and their independent effects.
- https://doi.org/10.7554/eLife.39856.037
-
Supplementary file 4
Cell types enriched for lifespan heritability identified by stratified LD-score regression.
This Excel workbook contains a list of all cell types tested for lifespan heritability enrichment by Stratified LD-score regression and includes a list of coefficients for each cel type.
- https://doi.org/10.7554/eLife.39856.038
-
Supplementary file 5
Gene sets highlighted by VEGAS2Pathway and corresponding results from DEPICT and PASCAL (FDR < 5%).
This Excel workbook contains two sheets. The first sheet lists the gene sets highlighted by VEGAS2Pathway as enriched for lifespan genes at FDR 5%, with corresponding results for DEPICT and PASCAL enrichment analyses. The second sheet lists all VEGAS gene sets significant at FDR < 15%, with a list of genes included in each set.
- https://doi.org/10.7554/eLife.39856.039
-
Supplementary file 6
eQTL SNPs associated with lifespan for genes whose expression varies with age.
This PDF contains a table and figure on the age-related gene expression analysis.
- https://doi.org/10.7554/eLife.39856.040
-
Transparent reporting form
- https://doi.org/10.7554/eLife.39856.041
Download links
A two-part list of links to download the article, or parts of the article, in various formats.
Downloads (link to download the article as PDF)
Open citations (links to open the citations from this article in various online reference manager services)
Cite this article (links to download the citations from this article in formats compatible with various reference manager tools)
Genomics of 1 million parent lifespans implicates novel pathways and common diseases and distinguishes survival chances
eLife 8:e39856.
https://doi.org/10.7554/eLife.39856


