Characterization of a Toxoplasma effector uncovers an alternative GSK3/β-catenin-regulatory pathway of inflammation
- University of Grenoble Alpes, Inserm, CNRS, IAB, France
- CEA, Inserm, BIG-BGE, France
Figures
Figure 1
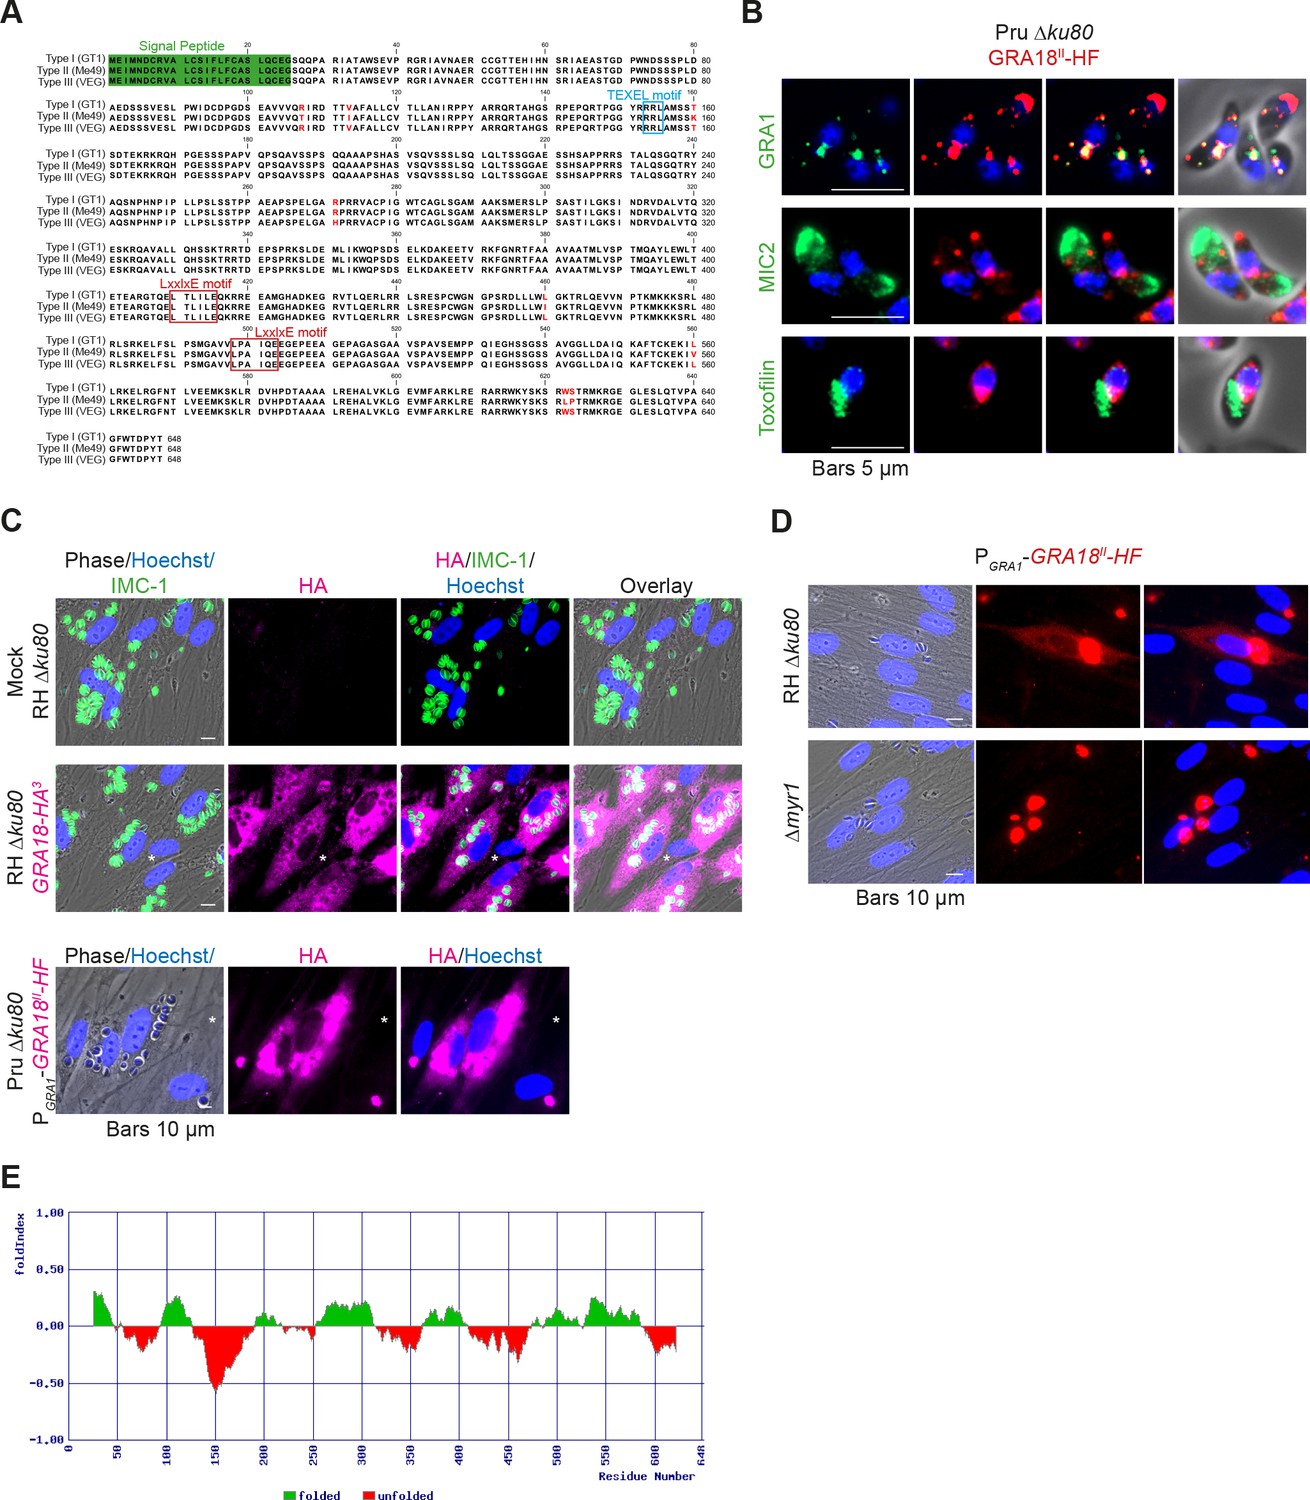
GRA18 is secreted and exported to the host cell cytoplasm.
(A) Alignment of GRA18 alleles from T. gondii strains of types I (TGGT1_288840), II (TGME49_288840), and III (TGVEG_288840). The signal peptide sequence (highlighted in green), the B56 SLiM motifs (LxxLx; boxed in red), and the T. gondii Export Element (TEXEL; RRL motif, boxed in blue) are shown. Single amino acid polymorphisms are indicated by red letters. The alignment was done using ClustalW method. (B) GRA18II-HAFlag in Pru ku80 extracellular parasites is contained in cytoplasmic organelles distinct from the apical micronemes (MIC2) and rhoptries (Toxofilin), and partially co-localizing with the dense granule protein GRA1. (C) GRA18 secretion and export to the host cytoplasm. HFFs were infected with type I RH parasites expressing endogenously tagged GRA18 with hemagglutinin (HA) (upper panel, RHΔku80 GRA18-HA3, in red, Triton X-100 permeabilization) or type II Pru strain ectopically expressing a HAFlag (HF)-tagged copy of GRA18II under the control of the strong promoter of GRA1 (Pru Δku80 PGRA1-GRA18II-HF, ethanol permeabilization). Cells were fixed 18 hr post-infection (hpi) and stained with anti-HA antibodies and Hoechst DNA-specific dye (in blue). The white asterisks indicate uninfected HFF cells. (D) MYR1 is required for GRA18 export in the host cell. HFFs were infected with RH WT or RH Δmyr1 parasites transiently transfected with a vector expressing an HF-tagged GRA18 (PGRA1-GRA18II-HF), and at 18 hpi, the cultures were fixed and stained with antibodies to the HA tag. (E) Schematic representation of GRA18 probability of disorder. Segments with values < 0 are predicted to be disordered (in red), and segments with values > 0 correspond to folded regions (in green).
Figure 2 with 1 supplement

GRA18 binds directly to the host cell proteins β-catenin, GSK3α/β, and PP2A-B56.
(A) Yeast-two hybrid screening of a human placental cDNA library to identify potential host partners for GRA18. Schematic representation of the identified partners having the highest Global PBS scores are shown. Summary of the prey clones that interacted with the GRA18 bait are represented as grey bars. Multiple independent interacting prey clones allowed Selected Interaction Domain (SID, in red) analysis that delineates the shortest fragment that is shared with all the interacting clones, and thus represents a potential region mediating the interaction with GRA18. (B) GRA18 associates with β-catenin, GSK3α/β, and PP2A-B56 in infected host cells. GRA18-associated proteins were purified by Flag affinity chromatography from protein extracts of HFF cells infected with parasites expressing HF-tagged GRA18 (Pru k80, PGRA1-GRA18II-HF). HFFs infected with Pru ku80 parasites were used as a mock. Immunopurified proteins were resolved by SDS-PAGE, followed by colloidal blue staining and mass spectrometry analysis. The identity of the proteins and their respective number of peptides are indicated on the right of the figure. (C) GRA18 associates with GSK3 and PP2A-B56 when delivered to HFFs by type I RH parasites expressing endogenously tagged GRA18 with HA-Flag (RH GRA18-HF). IN, input; IP, immunoprecipitation. (D) Immunofluorescence assay (IFA) of FH-GRA18 ectopically and stably expressed in T-Rex-293 cell line. Cells were either left untreated (-) or treated with 1 μg/mL tetracycline for 12 hr before fixation and staining with anti-HA antibodies (in red) and Hoechst DNA-specific dye (in blue). Scale bar, 10 μm. (E) Size-Exclusion Chromatography (SEC) analysis of the GRA18-associated proteins. FH-GRA18 was immunopurified from tetracycline-induced T-Rex cells (T-Rex-GRA18FL). SEC fractions were analyzed by immunoblot using the indicated antibodies.
Figure 2—figure supplement 1
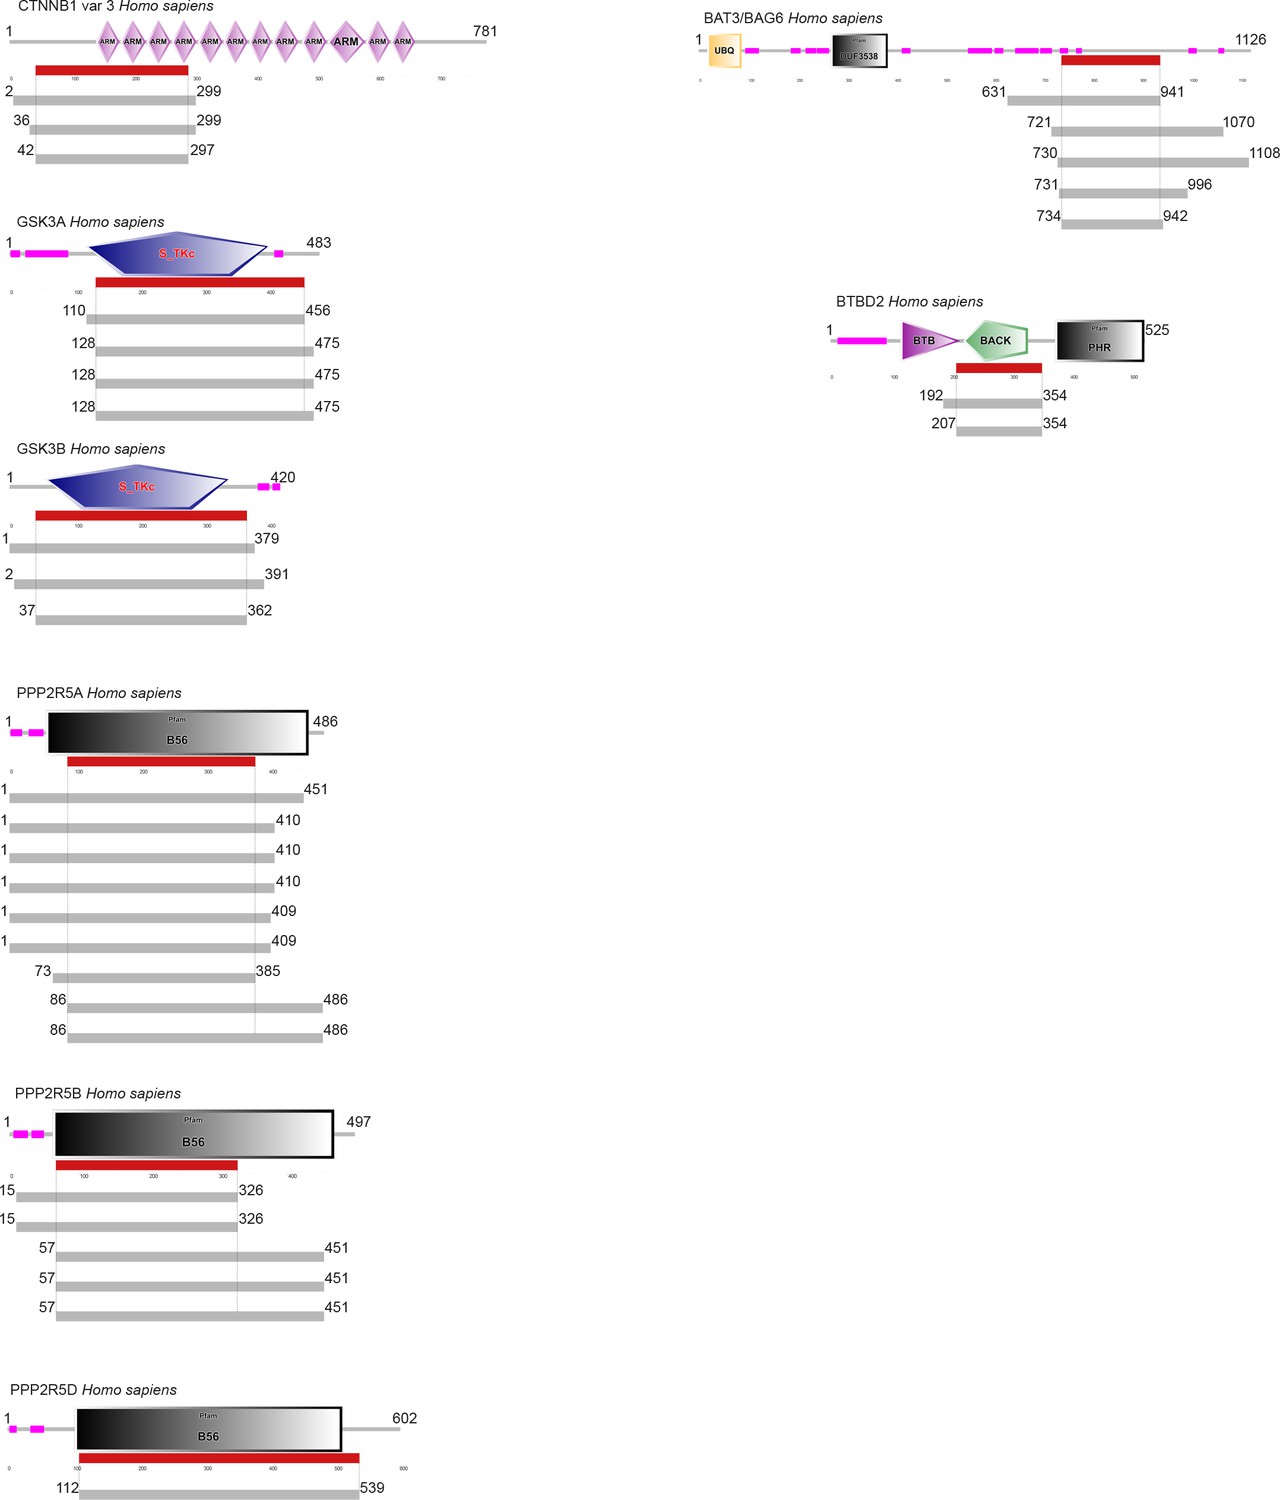
Summary of the hits in the Y2H screen against GRA18.
Each grey line indicates a single hit in the screen, and the red segments indicate the minimal fragment of each protein that is predicted to interact with GRA18.
Figure 3
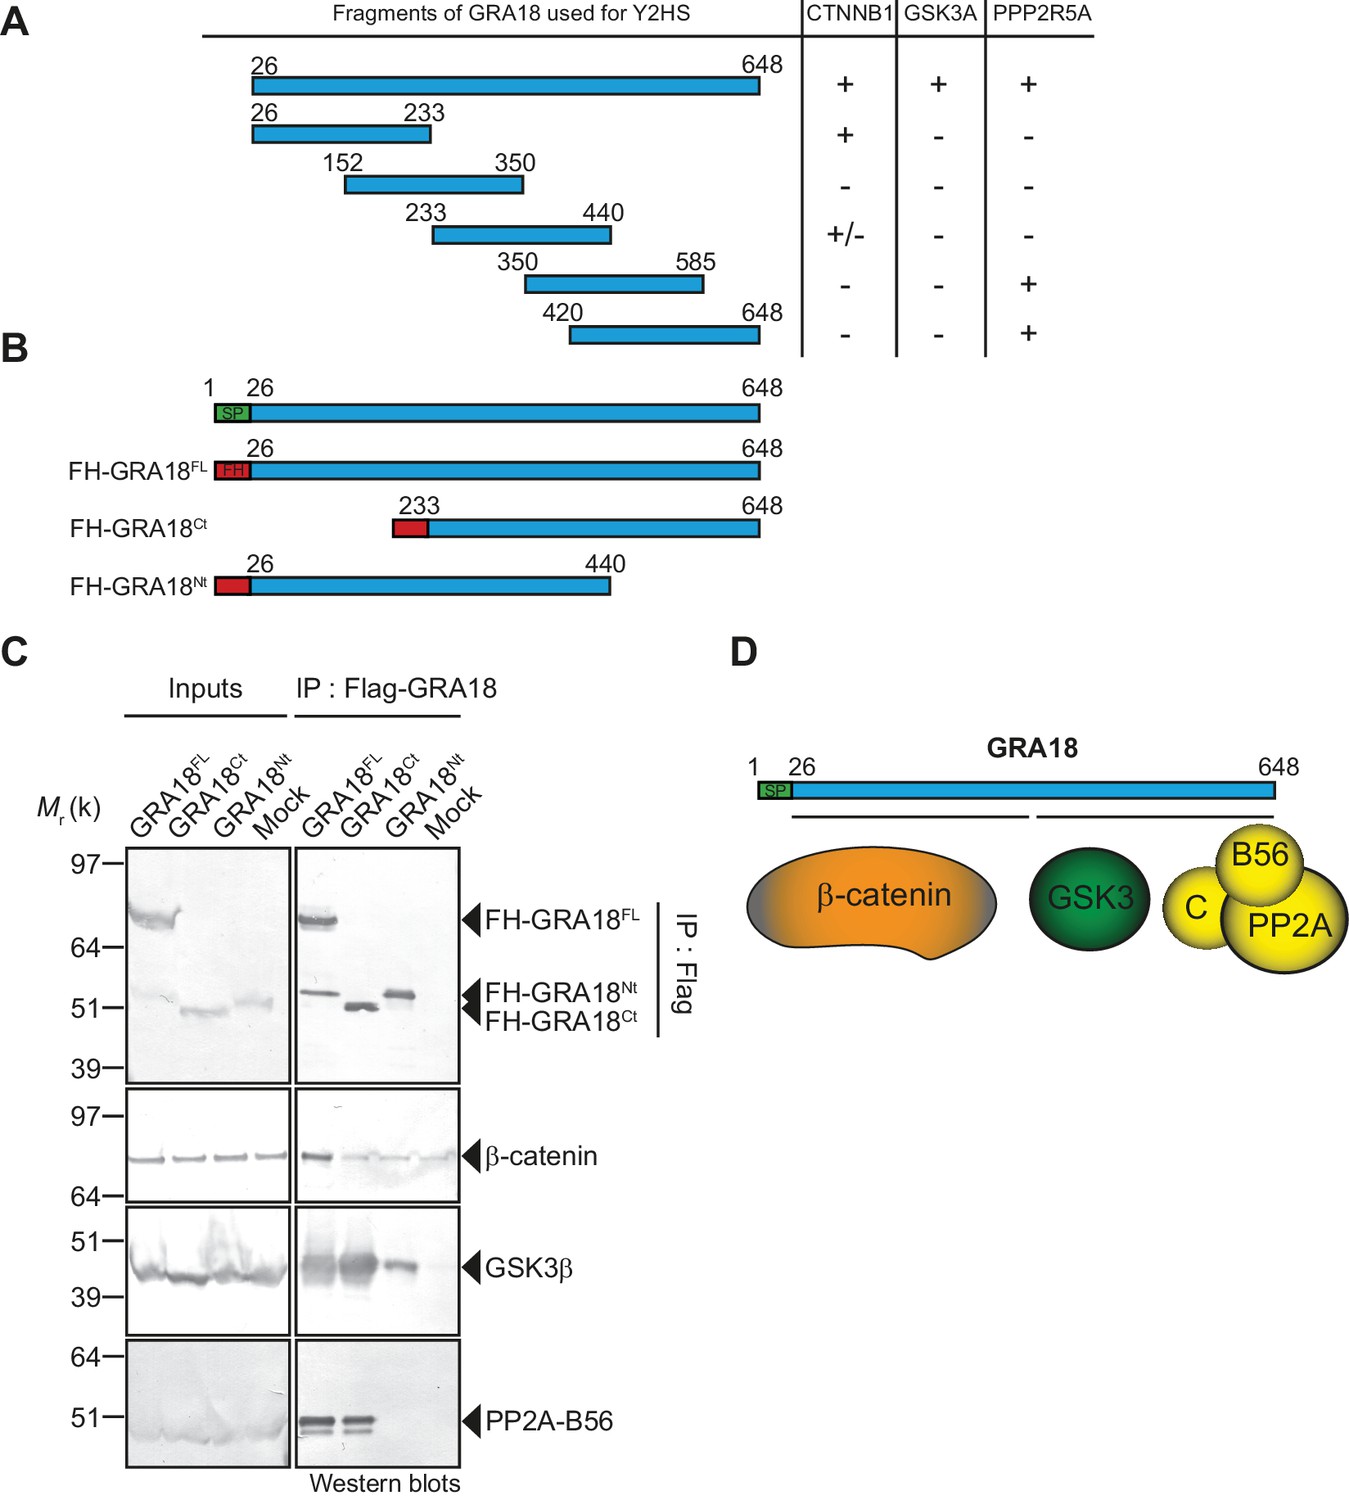
β-Catenin, GSK3, and PP2A-B56 recognize distinct domains of GRA18.
(A) Interaction domain mapping by Y2H assay using the indicated fragments of GRA18 to delineate the interacting domains of GRA18 with CTNBB1 (β-catenin), GSK3A (GSK3α) and PPP2R5A (PP2A-B56α). CTNNB1 interacts with the N-terminus of GRA18, whereas PPP2R5A interacts with the C-terminal fragments. GSK3A interacted with full-length GRA18 (amino acids 26 – 648) but not with any of the GRA18 fragments tested. (B) Schematic representation of full-length (amino acids 26 – 648) and truncated versions of GRA18 (FH-GRA18Nt(aa 26-440) and FH-GRA18Ct(aa 233-648)) proteins stably expressed in T-Rex cells. (C) Cytoplasmic fractions from T-Rex cells presented in (B) were immunoprecipitated with anti-Flag antibodies and analyzed by immunoblotting. Untransfected T-Rex cells were used as a mock. (D) Schematic diagram summarizing the interaction domain mapping of GRA18 obtained from Y2H and biochemical approaches.
Figure 4
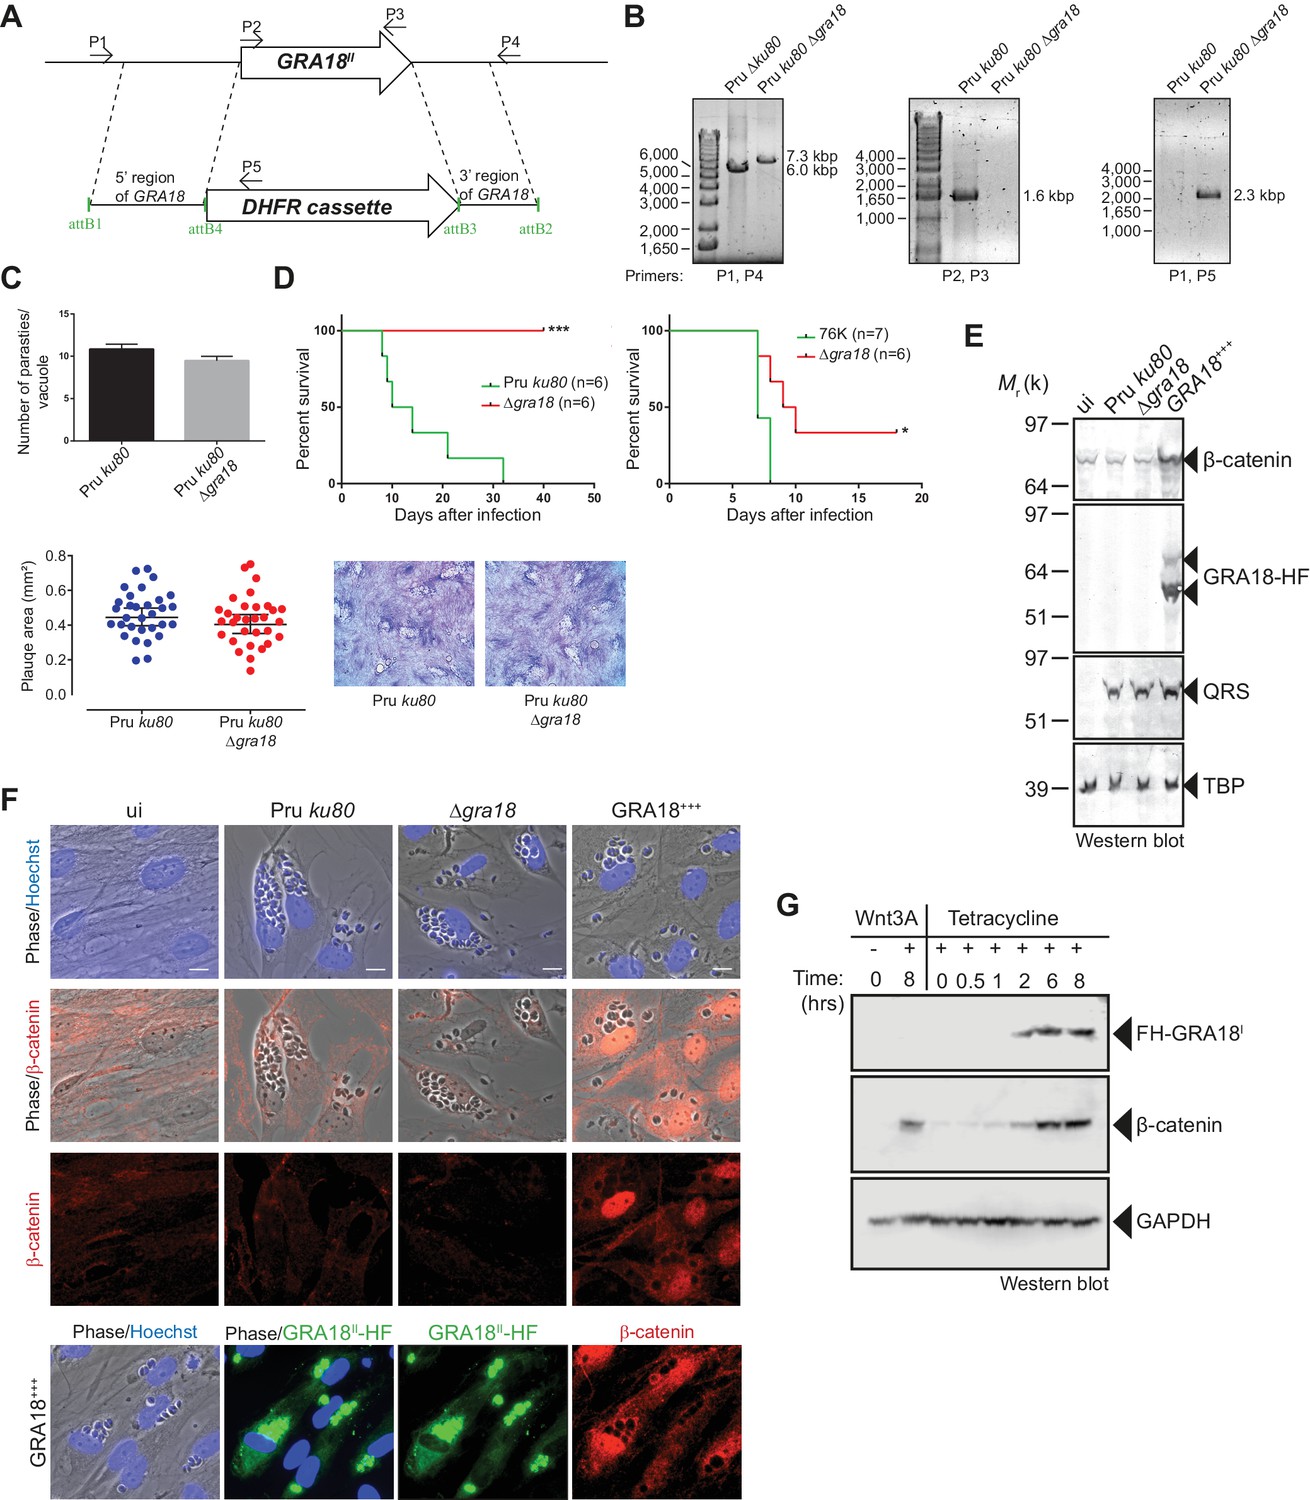
GRA18 is a positive regulator β-catenin.
(A) Generation and confirmation of insertion/deletion of GRA18 in T. gondii type II Pru strain. Schematic representation of the GRA18 locus with the double homologous recombination event between the knockout construct (pDEST14 KO GRA18) and genomic DNA replacing the GRA18 coding sequence with the DHFR cassette used for positive selection. (B) PCR reactions with the indicated primers confirming the deletion/insertion of GRA18 in the mutant parasites. (C) Parasites lacking GRA18 exhibit no growth defect in vitro as determined by fluorescence imaging assays in HFFs and plaque assays. Data are mean value ± s.d. of triplicates from two independent experiments. (D) GRA18 mutants exhibit decreased virulence in mice. Virulence of the type II Pru ku80Δgra18 and 76K Δgra18 strains were compared to the parental strains Pru ku80 and 76K, respectively, in BALB/c mice. Mice were inoculated with 105 tachyzoites of each strain by intraperitoneal injection and survival was monitored. Cumulative results of two independent experiments with at least three mice in each group (n ≥ 6) are shown. Significance was tested using Log-rank (Mantel-Cox) test; *p=0.0162 and ***p=0.0005 when compared to the respective wild-type strain. (E) Effect of GRA18 on β-catenin levels. Murine L929 cells were left uninfected (ui) or infected with wild-type (Pru ku80), Δgra18, or the Δgra18 GRA18+++ complemented (GRA18+++) strains. At 18 hr post-infection, cells were harvested and analyzed by immunoblot using the indicated antibodies. TgQRS was used to control parasite loading. (F) IFA of β-catenin in confluent HFFs left uninfected (ui) or infected with the indicated strains for 18 hr. In the lower panel, IFA was performed using an anti-HA antibody to monitor the HF-tagged version of GRA18 in the GRA18+++ complemented strain. Data are representative of at least three independent experiments. (G) Immunoblot analysis of nuclear fraction of the T-Rex FH-GRA18 cell line left untreated or induced with tetracycline for the indicated periods of time. The Wnt3A ligand was used as a positive control.
Figure 5 with 2 supplements
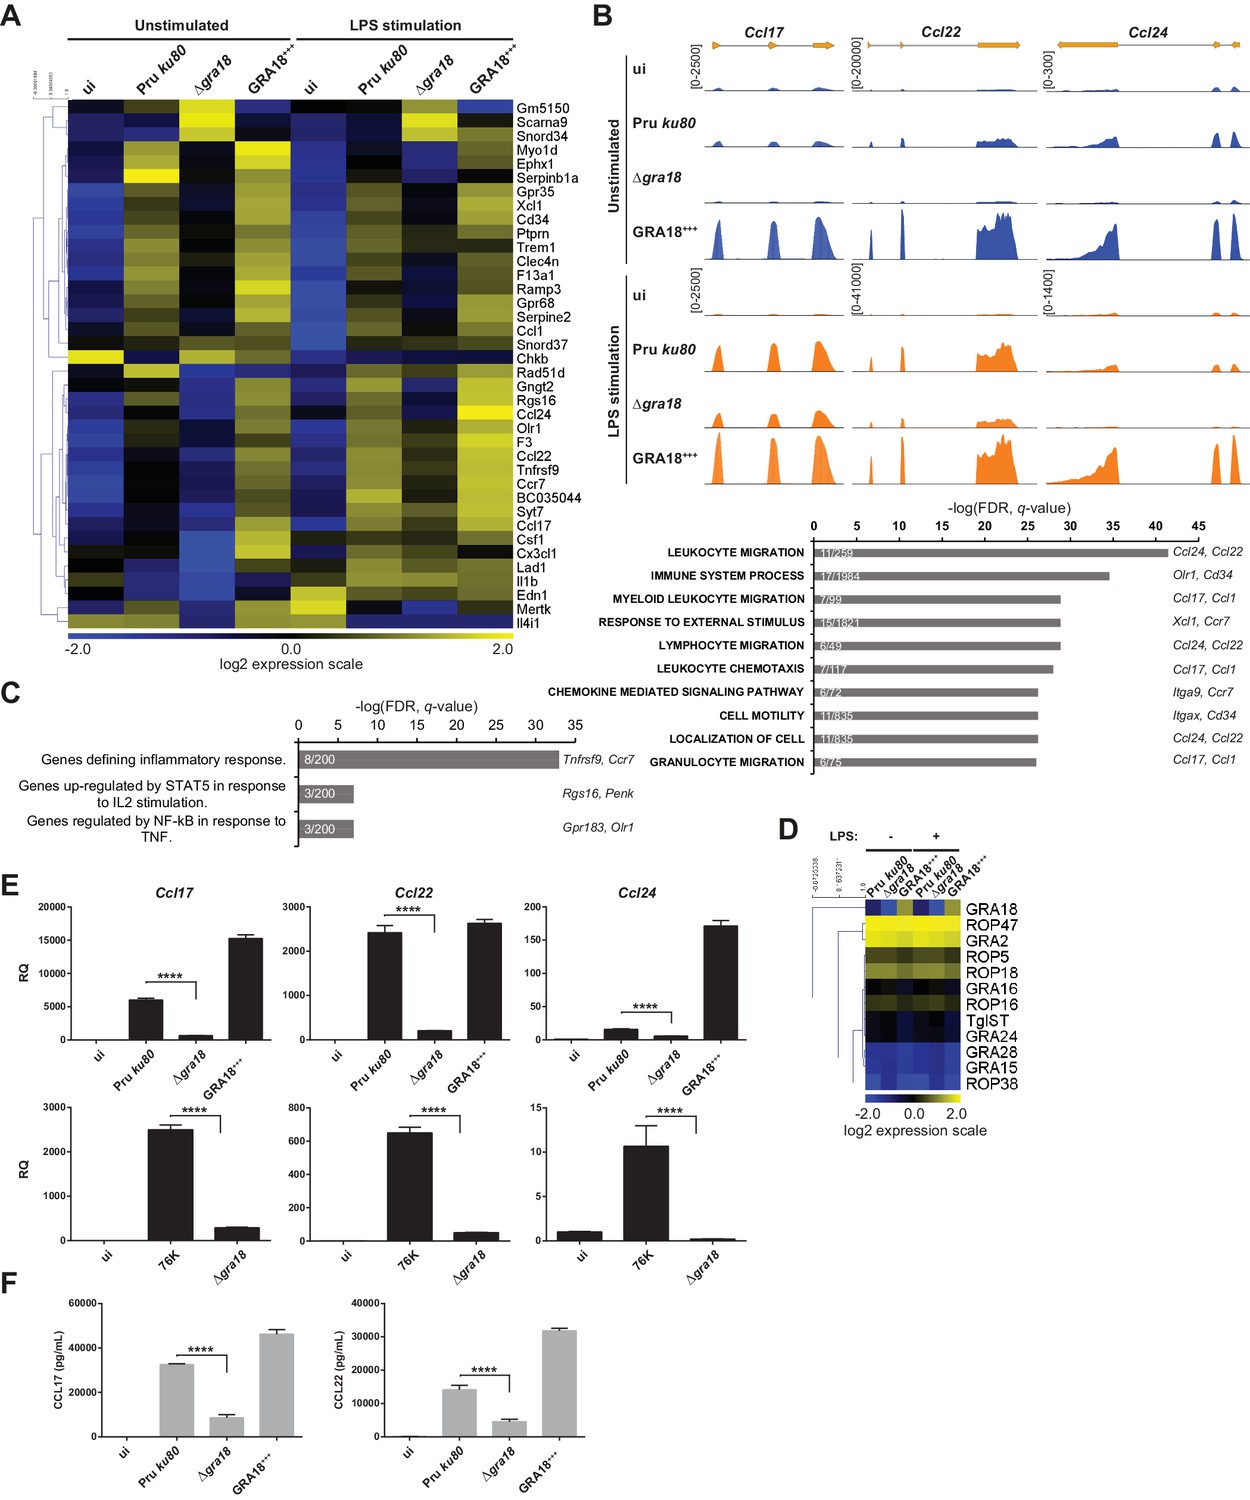
GRA18 alters the host cell transcriptome.
(A) RNA-Seq analysis of BALB/c BMDMs that were left uninfected (ui) or infected with the indicated strains at an MOI of 1:5. At 18 hr post-infection, cells were left unstimulated or stimulated with LPS (100 ng/mL) for 6 hr. Heat map representation of the differentially expressed mouse genes (≥3 fold, RPKM ≥5 in at least one sample) between parental and Δgra18 infected cells in the absence of LPS. RPKM values were log2 transformed, Gene/Row normalized, and mean centered using MeV. (B) Tracks of the BMDMs RNA-Seq reads for Ccl17, Ccl22, and Ccl24 in the indicated samples. (C) Enrichment analysis in functional annotation and GO analysis of the differentially expressed genes defined in Figure 5A using GSEA. Top-scoring pathways regulated in a GRA18-dependent manner, number of genes per pathway, and names of representative genes are shown. (D) Heat map of expression values obtained by RNA-Seq analysis of T. gondii genes from the samples in (A). A selected set of T. gondii ROPs and GRAs are shown. (E) Quantitative chemokine expression was determined by qRT-PCR on BMDMs infected with the wild-type and Δgra18 mutant strains in the type II strains Pru and 76K. Values were normalized to the amount of TATA box binding protein (Tbp) in each sample. Data are mean value ± s.d. of three replicates. The P-values were calculated using two-tailed unpaired Student’s t-test; ****p<0.001. Data are representative of two independent experiments. (F) CCL17 and CCL22 levels were measured by ELISA from supernatants collected 24 hr after BMDM infection with the indicated strains at an MOI of 1:5. Supernatant from uninfected cells was used as a control (ui). Means of four independent experiments are shown. ****, p<0.0001 following one-way ANOVA analysis and multiple-comparison post hoc tests.
Figure 5—figure supplement 1
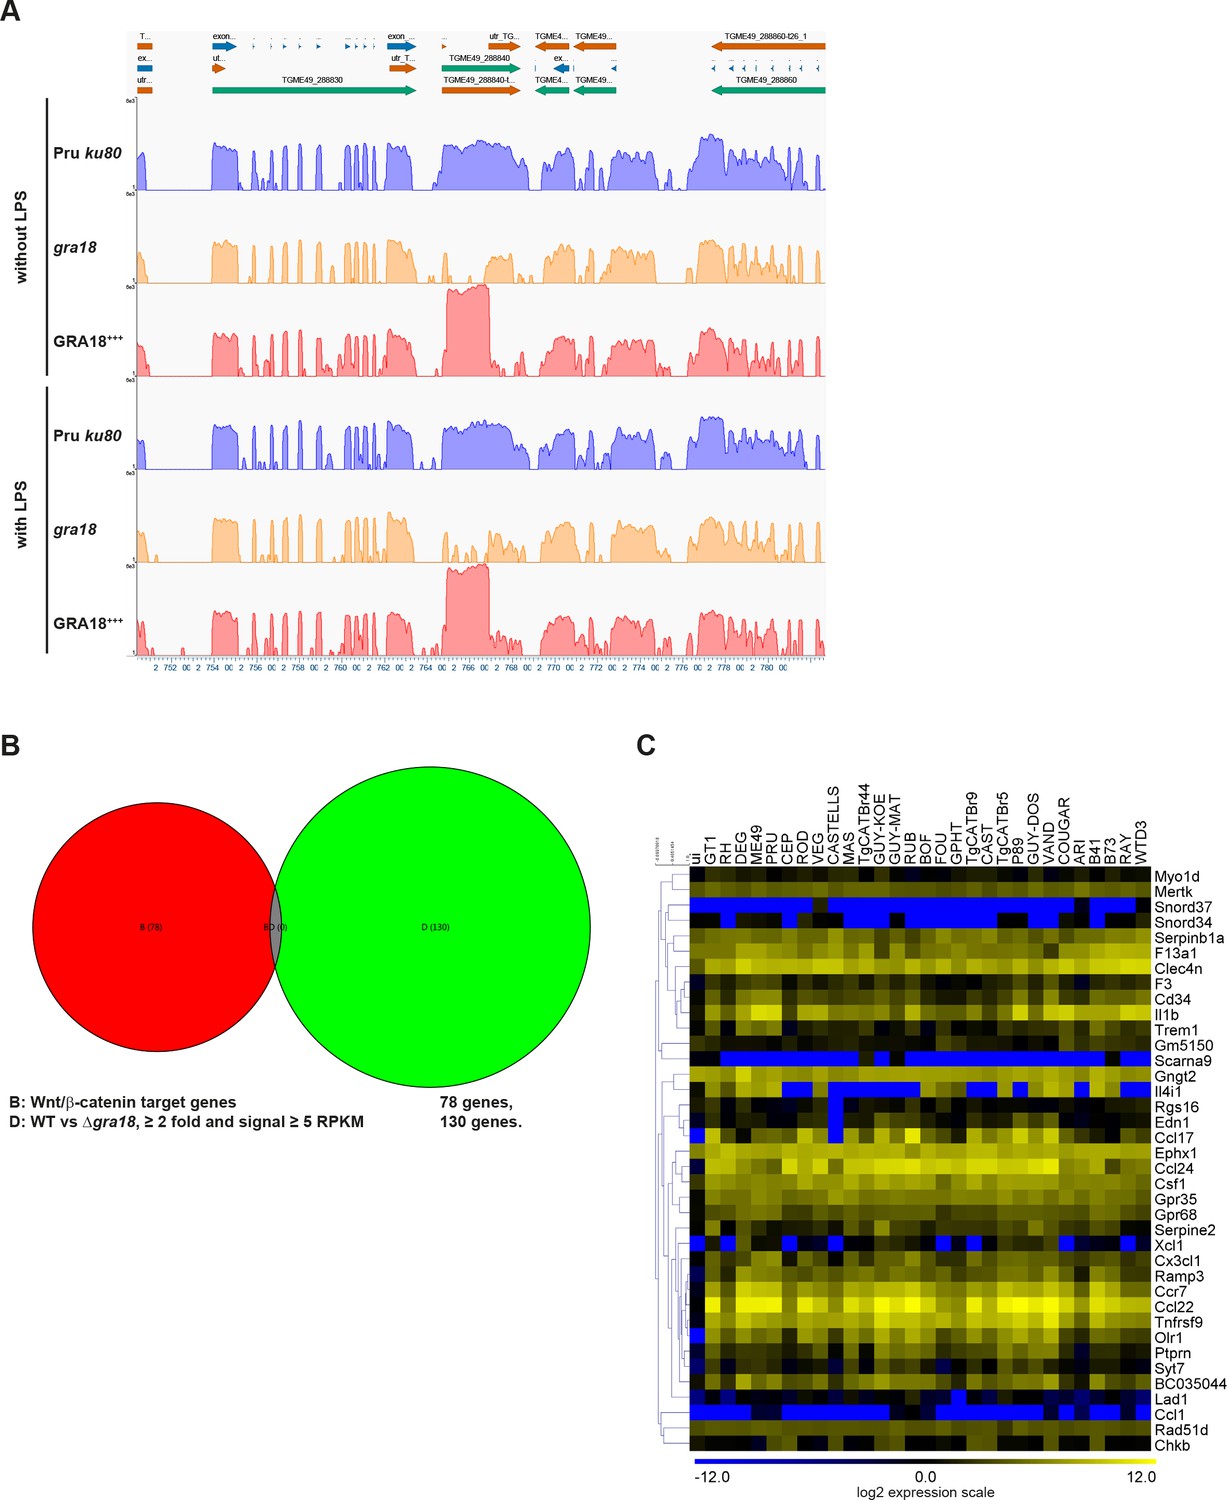
RNA-Seq analysis of mouse and T.
gondii transcripts. (A) T. gondii RNA-Seq analysis at the GRA18 genomic locus. Coverage track of the T. gondii RNA-Seq reads for the indicated samples obtained from GenVision Pro, Lasergene version 14 (DNASTAR, Madison, WI, USA). Assembled RNA-Seq reads were plotted along the T. gondii genomic sequence at the GRA18 locus. The graphs correspond to the depth of sequence coverage for each nucleotide position along the T. gondii genomic sequence. (B) Venn diagram depicting the overlap between the Wnt/β-catenin target genes and those affected in a GRA18-dependent fashion in infected BMDMs. A list of 78 Wnt/β-catenin target genes were obtained from GSEA. The 130 host genes regulated by GRA18 correspond to the differentially expressed mouse genes (≥2 fold, RPKM ≥5 in at least one sample) between BMDMs infected by the wild-type and Δgra18 T. gondii strains in the absence of LPS. (C) Analysis of the GRA18 target genes in BMDMs infected by different T. gondii strains. The GRA18 specific gene set identified in Figure 5A was analyzed in the transcriptomic data obtained from BMDMs infected by different T. gondii strains from (Melo et al., 2013). RAW RNA-Seq data were obtained from the GEO DataSets database and analyzed as described in Materials and methods.
Figure 5—figure supplement 2
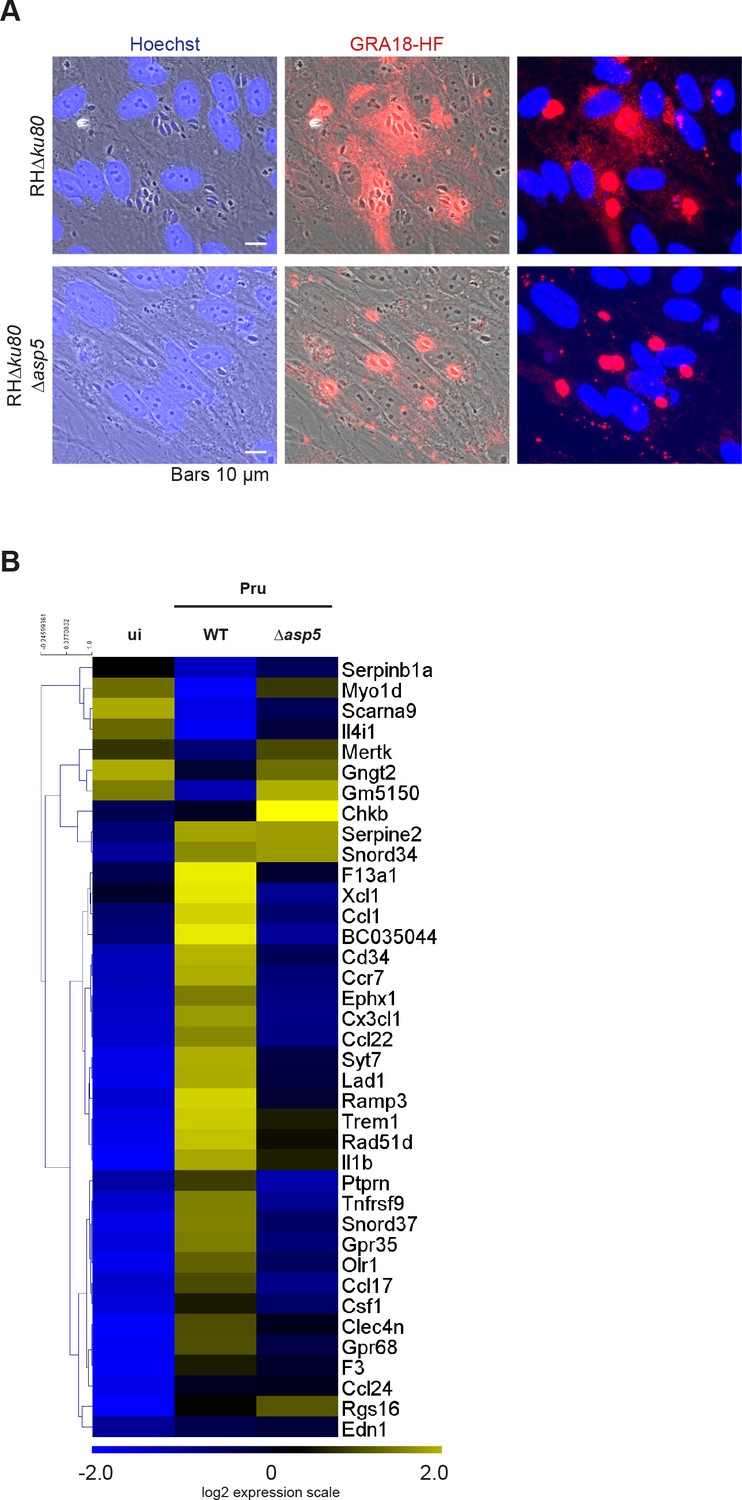
Deletion of the aspartyl protease ASP5 compromises GRA18 export and phenocopies the deletion of GRA18 in promoting host cell gene expression.
(A) In the absence of ASP5, GRA18-HF transiently transfected in type I parasites was no longer exported to the host cytoplasm and instead remained within the PV. (B) In the absence of ASP5, T. gondii parasites failed to induce most of the GRA18-dependent genes of BMDMs. The GRA18 specific gene-set identified in Figure 5A was analyzed in the transcriptomic data obtained from BMDMs infected by Δasp5 mutant parasites (Pru strain) from (Hammoudi et al., 2015). RAW RNA-Seq data were obtained from the European Nucleotide Archive and analyzed as described in Materials and methods.
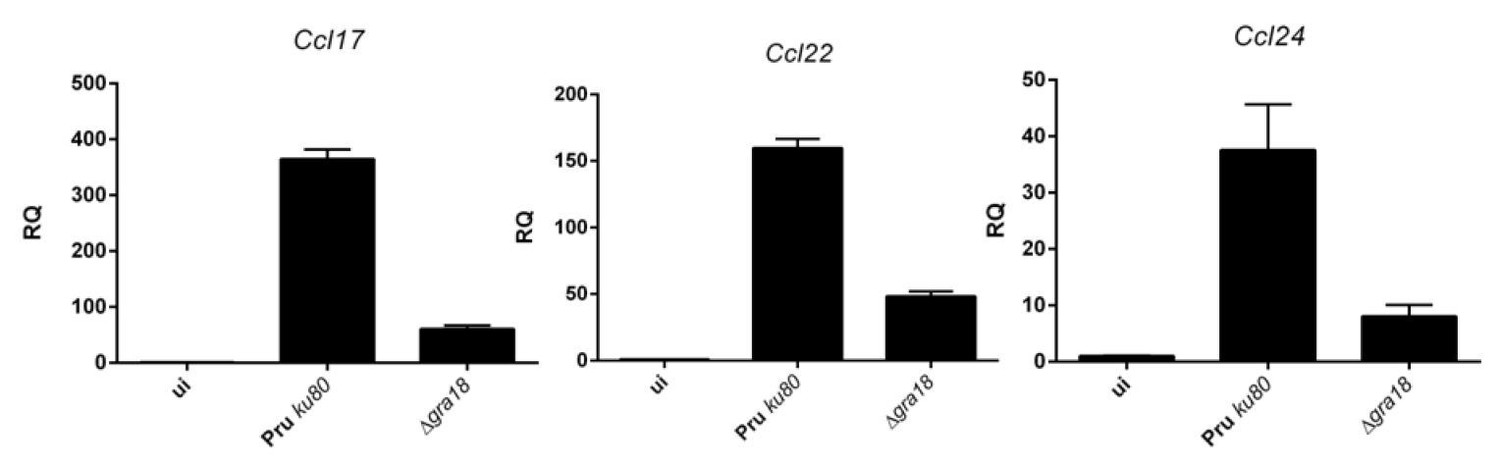
Figure 6
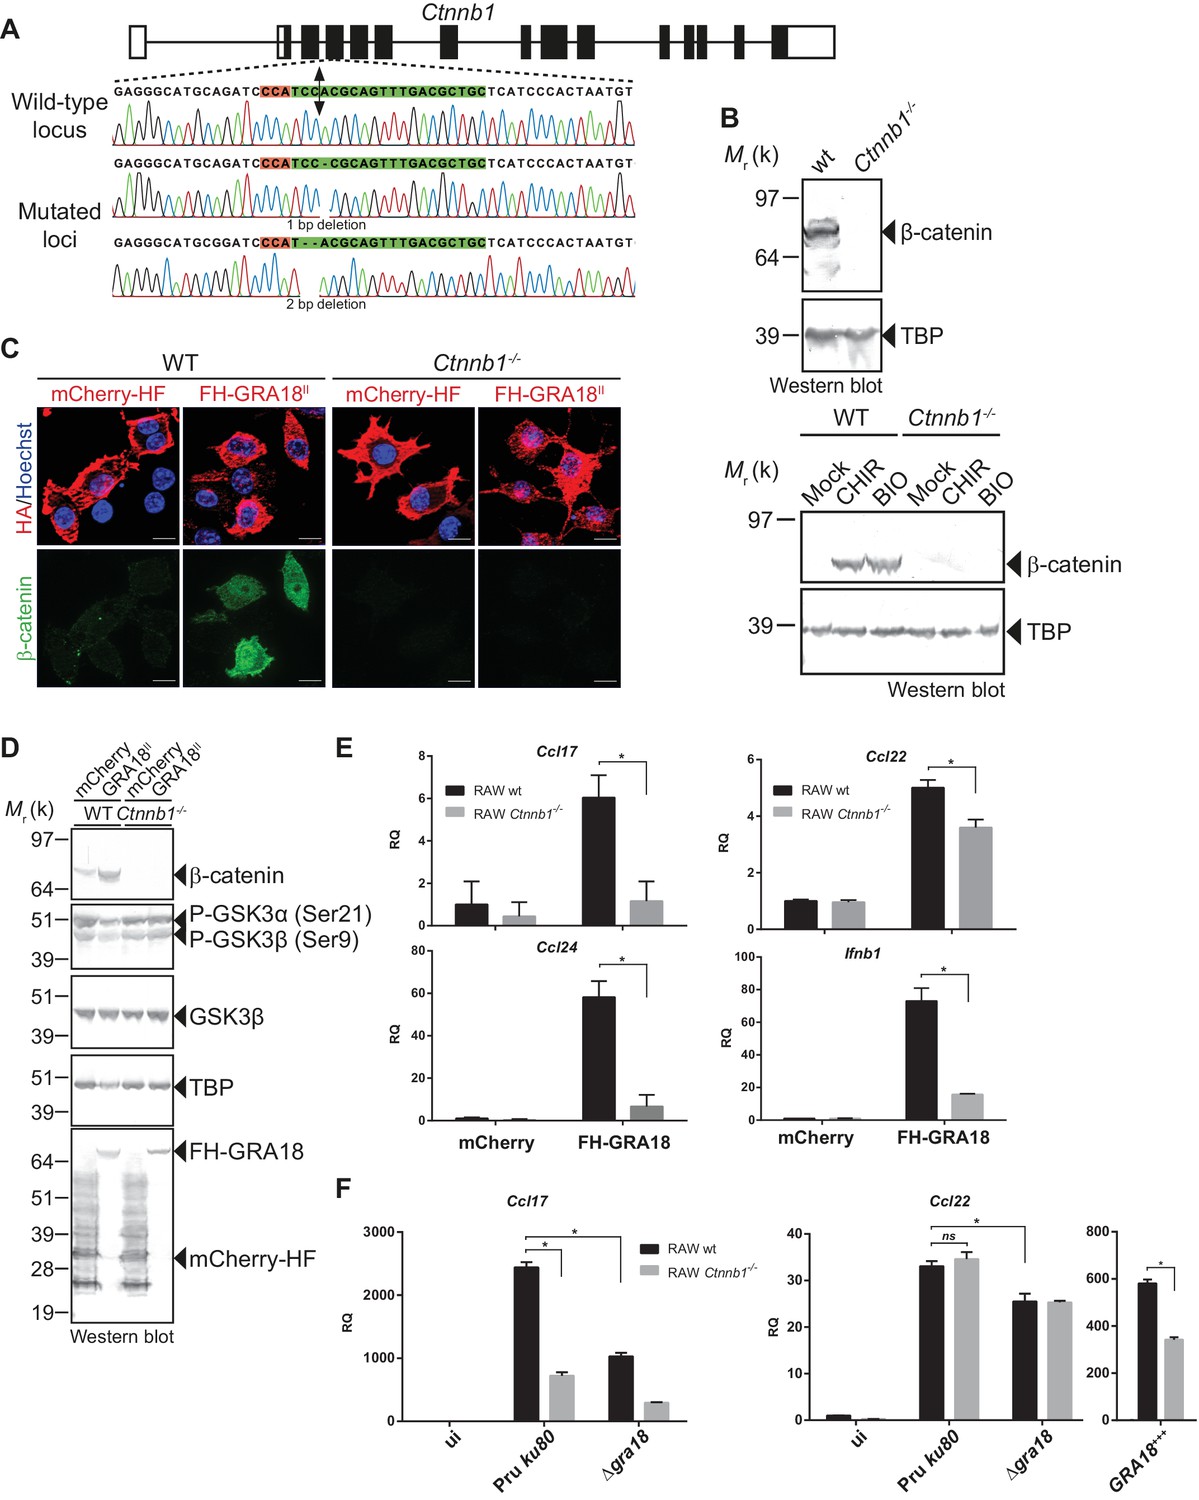
GRA18 promotes Ccl17, Ccl22 and Ccl24 chemokines expression in a β-catenin-dependent fashion.
(A) Schematic diagram of gRNAs targeting the Ctnnb1 locus. The Protospacer Adjacent Motif (PAM) sequence is lined and highlighted in red; the targeting sequences is shown in green. Bi-directional arrow indicates the Cas9 cleavage site. DNA sequences from the wild-type and mutated RAW264.7-derived cell lines were analyzed by DNA sequencing; the identified deletions are indicated with (-). No mutations in control samples were observed. (B) Immunoblot analysis of β-catenin in parental RAW264.7 and the Ctnnb1-/- mutant confirmed the absence of β-catenin expression. As positive controls, cells were treated with 3 mM of BIO or 2 mM of CHIR GSK3 inhibitors for 12 hr. TBP was used as loading control. (C–E) RAW264.7 (WT) and β-catenin-deficient (Ctnnb1-/-) RAW264.7-derived cell lines were transfected with mCherry vector control (pcDNA-mCherry-HF) or the FH-GRA18II expression vector (pcDNA-FH-GRA18FL). At 18 hr after transfection, cells were either (C) fixed for IFA using anti-HA (red) and anti-β-catenin (green) antibodies or (D) cells were harvested and analyzed by immunoblot using the indicated antibodies. Anti-HA was used to detect FH-GRA18 and mCherry-HF. In (E) and (F) transcripts for Ccl17, Ccl22, Ccl24, and Ifnb1 were quantified by qPCR and normalized using Tbp. Data are mean value ± s.d. of three replicates. The P-values were calculated using two-tailed unpaired Student’s t-test or one-way ANOVA with Bonferroni posttests analysis of variance; *p<0.05 and P values greater than 0.05 were considered not significant (ns). In (F) RAW264.7 (WT) and β-catenin-deficient (Ctnnb1-/-) RAW264.7-derived cell lines were either left uninfected or infected with the indicated wild-type and Δgra18 mutant strains at a MOI of 1:6 for 18 hr. Data are representative of two independent experiments.
Figure 7
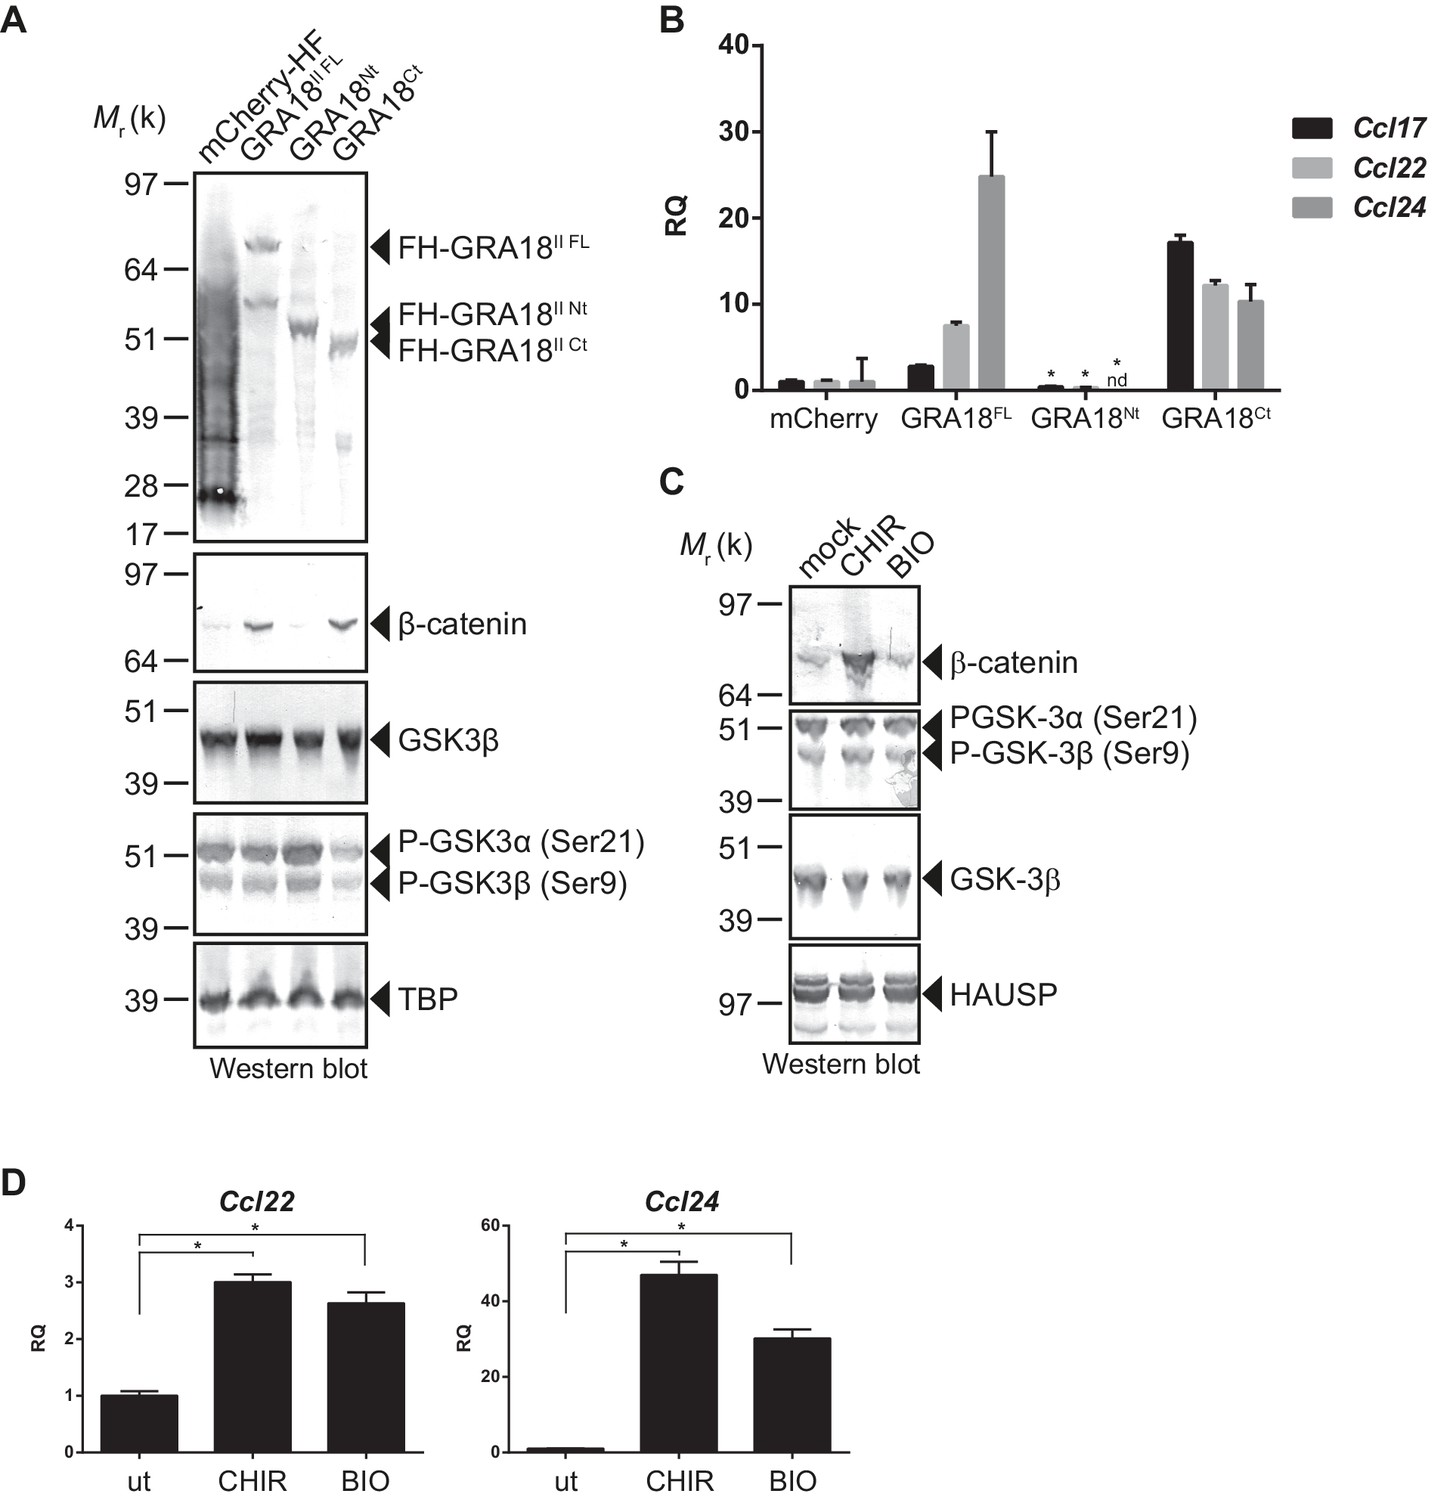
GRA18 activity is dependent on its interactions with GSK3 and PP2A-B56.
(A–B) RAW264.7 cells were transfected with mCherry vector control or the FH-GRA18 expression vectors pcDNA-FH-GRA18FL (GRA18FL), pcDNA-FH-GRA18Nt (GRA18Nt), and pcDNA-FH-GRA18Ct (GRA18Ct). At 18 hr after transfection, cells were harvested and (A) whole cell extracts were analyzed by immunoblot using the indicated antibodies, or (B) quantitative chemokine expression was determined by qRT-PCR as in Figure 6. Asterisks indicate P-values (p<0.05) obtained when comparing GRA18Nt with GRA18FL. (C) Treatment of RAW264.7 cells with the GSK3 inhibitors CHIR and BIO led to β-catenin protein accumulation and Ccl22 and Ccl24 upregulation as determined by qRT-PCR in (D). ut, untreated; nd, not detected. Data are mean value ± s.d. of three replicates. The P-values were calculated using two-tailed unpaired Student’s t-test; *p<0.05. Each data set is representative of two independent experiments.
Figure 8
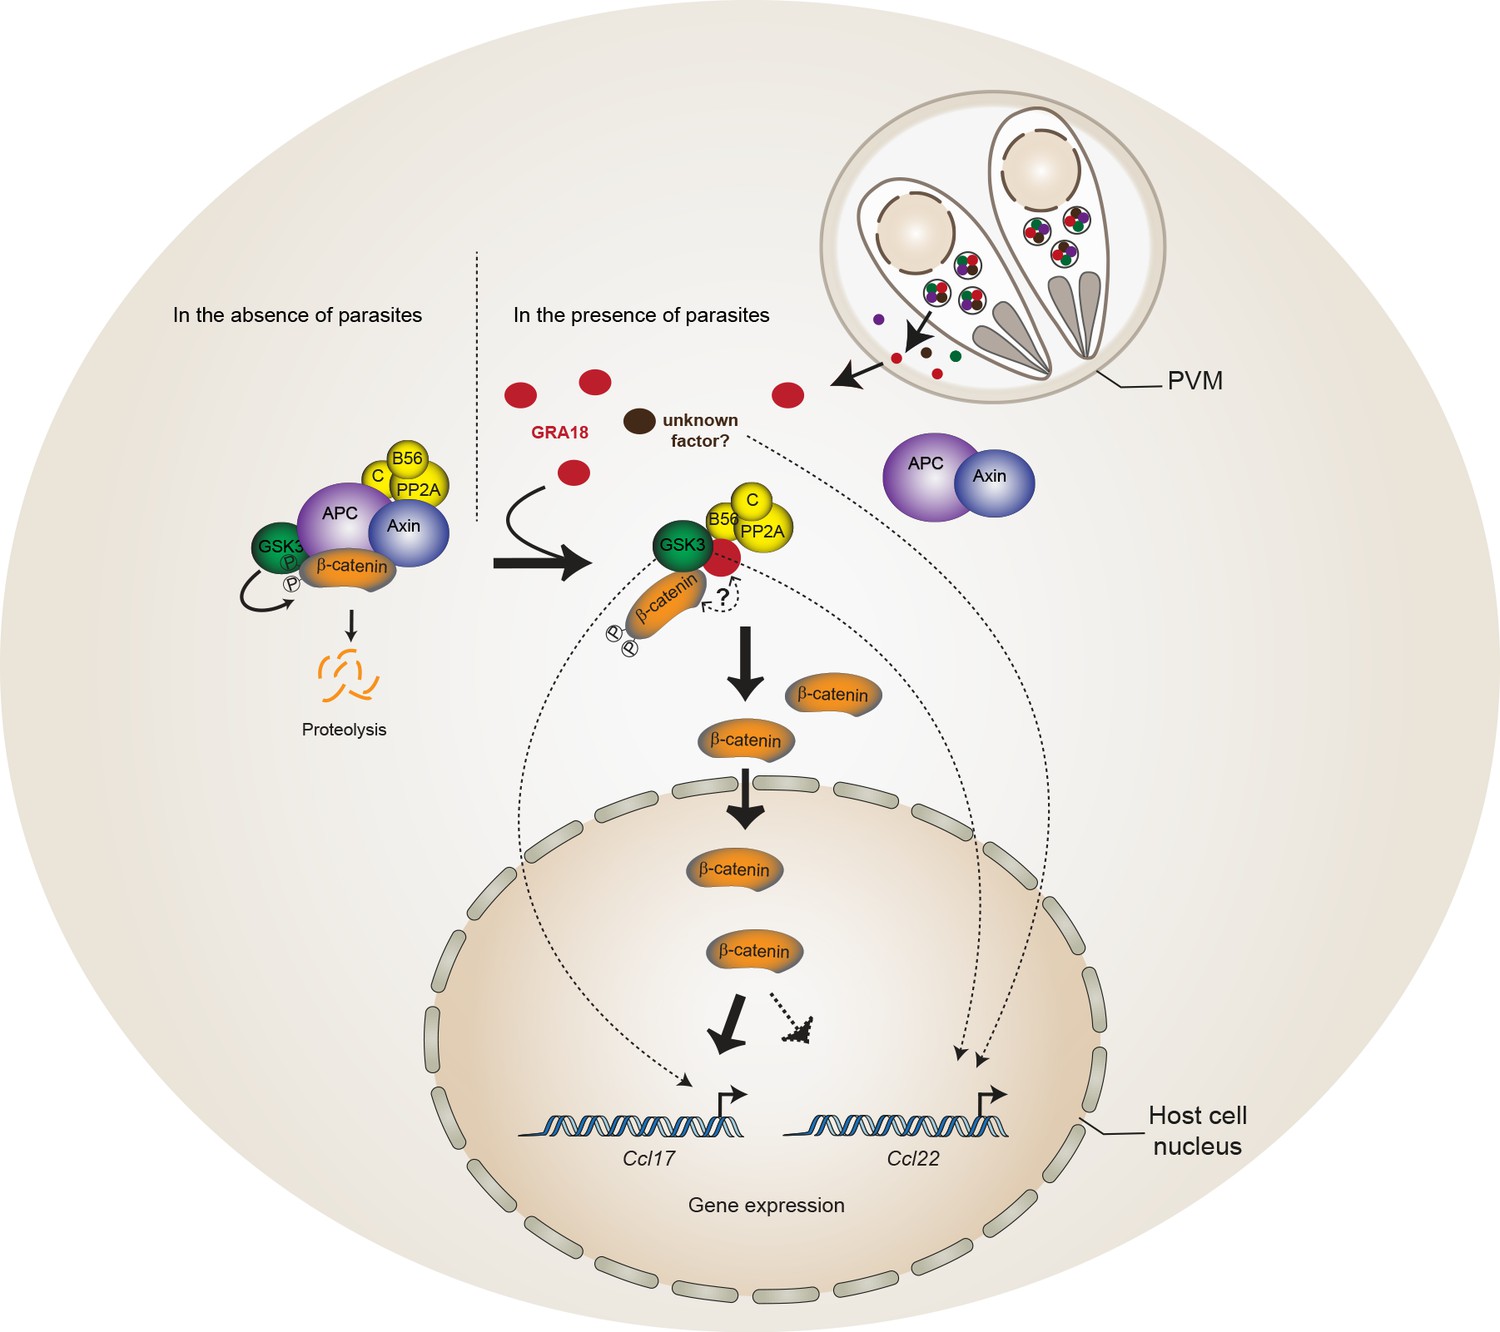
Model for GRA18 mechanism of action.
A model depicting how GRA18 interacts and interferes with the β-catenin destruction complex leading to host cell gene regulation. Possible effect of GRA18 on gene expression through GSK3 but β-catenin-independent or still unidentified T. gondii factor are represented by dashed lines. Question mark indicates the putative direct interaction with β-catenin observed by the Y2H or GRA18 overexpression. See also discussion.
Author response image 1
qRT-PCR analysis of MAF-DKO macrophages (low passages) infected by the indicated strains of T. gondii at a MOI of 1:6.
Author response image 2

qRT-PCR analysis of MAF-DKO macrophages (high passages, after lentiviral transductions) infected by the indicated strains of T. gondii at a MOI of 1:6.
Additional files
-
Supplementary file 1
Strains and Plasmids, Primers and oligonucleotides.
- https://doi.org/10.7554/eLife.39887.013
-
Supplementary file 2
Y2H screen results.
- https://doi.org/10.7554/eLife.39887.014
-
Supplementary file 3
Gene expression profiles in BMDMs and T. gondii with and without LPS stimulation.
RNA-Seq Reads Mouse. Summary of total RNASeq reads and average reads mapped to the mouse genome. RNA-Seq Reads Toxoplasma. Summary of total RNASeq reads and average reads mapped to the Toxoplasma genome. RPKM values for BMDMs. Expression values for all the mouse genes in the indicated samples. RPKM and log2 transformed values are shown. RPKM values for T. gondii. Expression values for all the Toxoplasma genes in the indicated samples. RPKM and log2 transformed values are shown. Pru vs gra18. RPKM values of the BMDM genes differentially regulated between the wild-type (Pru ku80) and gra18 mutant strains. Genes that were modulated with more than three-fold change and having a signal threshold above 5 RPKM in at least one sample when comparing the wild-type and Δgra18 mutant strains are shown. RPKM and log2 transformed values are shown for the indicated samples. ui vs ui_LPS. RPKM values of the BMDM genes differentially regulated between uninfected BMDMs that were left unstimulated (ui) or stimulated with LPS for 4 hr (ui_LPS). Genes that were modulated with more than three-fold change and having a signal threshold above 5 RPKM in at least one sample when comparing the ui and ui_LPS samples are shown. RPKM and log2 transformed values are shown for the indicated samples. β-Catenin target genes. RPKM values of known β-catenin/TCF target genes in the RNA-Seq experiment presented in Figure 5. Some direct target genes defined as those with Tcf binding sites are indicated in red. ui vs Pru. RPKM values of the BMDM genes differentially regulated when comparing BMDM left uninfected (ui) and BMDM infected by wild-type parasites (Pru) in the absence of LPS stimulation. Genes that were modulated with more than three-fold change and having a signal threshold above 5 RPKM in at least one sample when comparing the ui and Pru samples are shown. RPKM and log2 transformed values are shown for the indicated samples.
- https://doi.org/10.7554/eLife.39887.015
-
Transparent reporting form
- https://doi.org/10.7554/eLife.39887.016
Download links
A two-part list of links to download the article, or parts of the article, in various formats.
Downloads (link to download the article as PDF)
Open citations (links to open the citations from this article in various online reference manager services)
Cite this article (links to download the citations from this article in formats compatible with various reference manager tools)
Characterization of a Toxoplasma effector uncovers an alternative GSK3/β-catenin-regulatory pathway of inflammation
eLife 7:e39887.
https://doi.org/10.7554/eLife.39887


