IgE-mediated mast cell activation promotes inflammation and cartilage destruction in osteoarthritis
- VA Palo Alto Health Care System, United States
- Stanford University School of Medicine, United States
- University of Padova, Italy
- Virginia Commonwealth University School of Medicine, United States
Figures
Figure 1 with 3 supplements
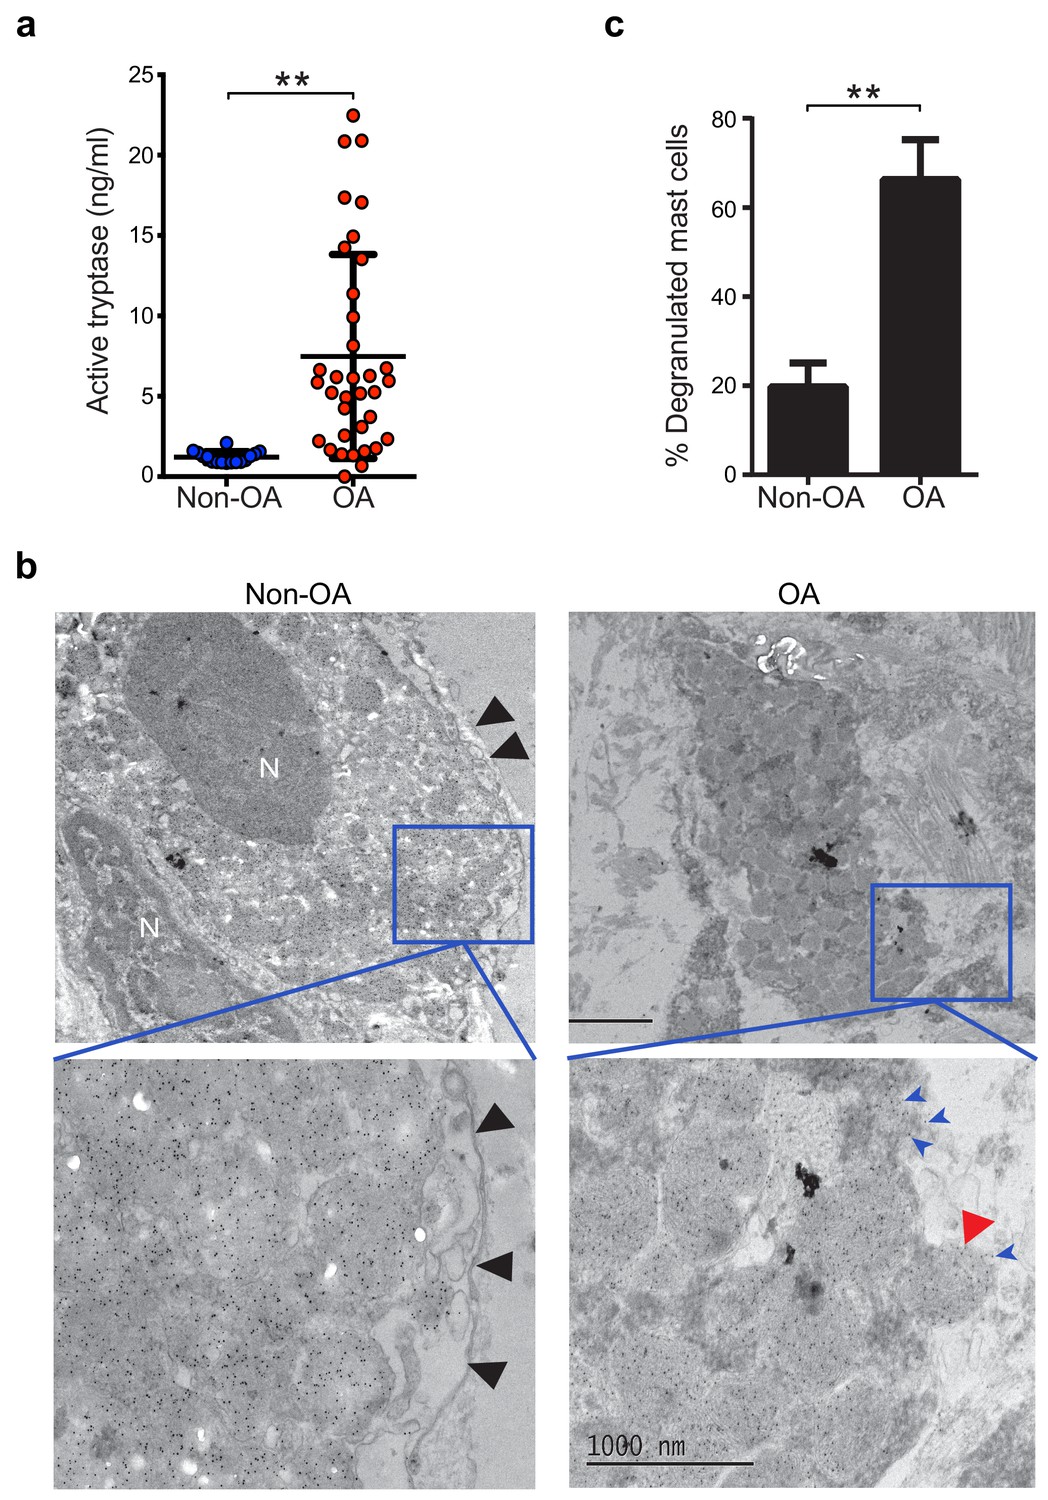
Increased mast cell degranulation and tryptase release in osteoarthritis.
(a) Tosyl-Gly-Pro-Lys-pNA-based quantification of active tryptase in synovial fluids from individuals with osteoarthritis (OA; n = 35) and from individuals with prior joint trauma but no radiographic osteoarthritis (PT non-OA; n = 16). Bars represent mean ± s.d. **p≤0.01 by Mann-Whitney test, and results are representative of the results of three independent experiments performed using two independent sample sets. (b) Representative transmission electron microscopy images of osteoarthritic and non-osteoarthritic synovial tissue sections immuno-labeled with a gold-conjugated anti-tryptase antibody. Left panels: A quiescent mast cell with many cytoplasmic granules exhibiting strong immunoreactivity for tryptase and an intact plasma membrane (black arrowheads) in non-osteoarthritic synovial lining (Non-OA). Right panels: A degranulated mast cell exhibiting an exteriorized granule matrix with tryptase immunoreactivity (red arrowhead) in an osteoarthritic synovial lining (OA). There is also some other tryptase immunoreactivity apparent outside of this cell (blue arrowheads), likely derived from exteriorized granule matrices. Lower panels are higher magnification (8000×) images of area shown in blue box in the corresponding upper panels (1500×). (c) Percentage of degranulated mast cells in synovial tissues obtained from individuals with osteoarthritis (n = 5) and non-osteoarthritis (n = 5). Intact and degranulated mast cells were counted by an examiner blinded to sample group assignment. Data are mean ± s.d. **p<0.01 by Student’s t-test, and are representative of three independent experiments using independent sample sets.
Figure 1—figure supplement 1
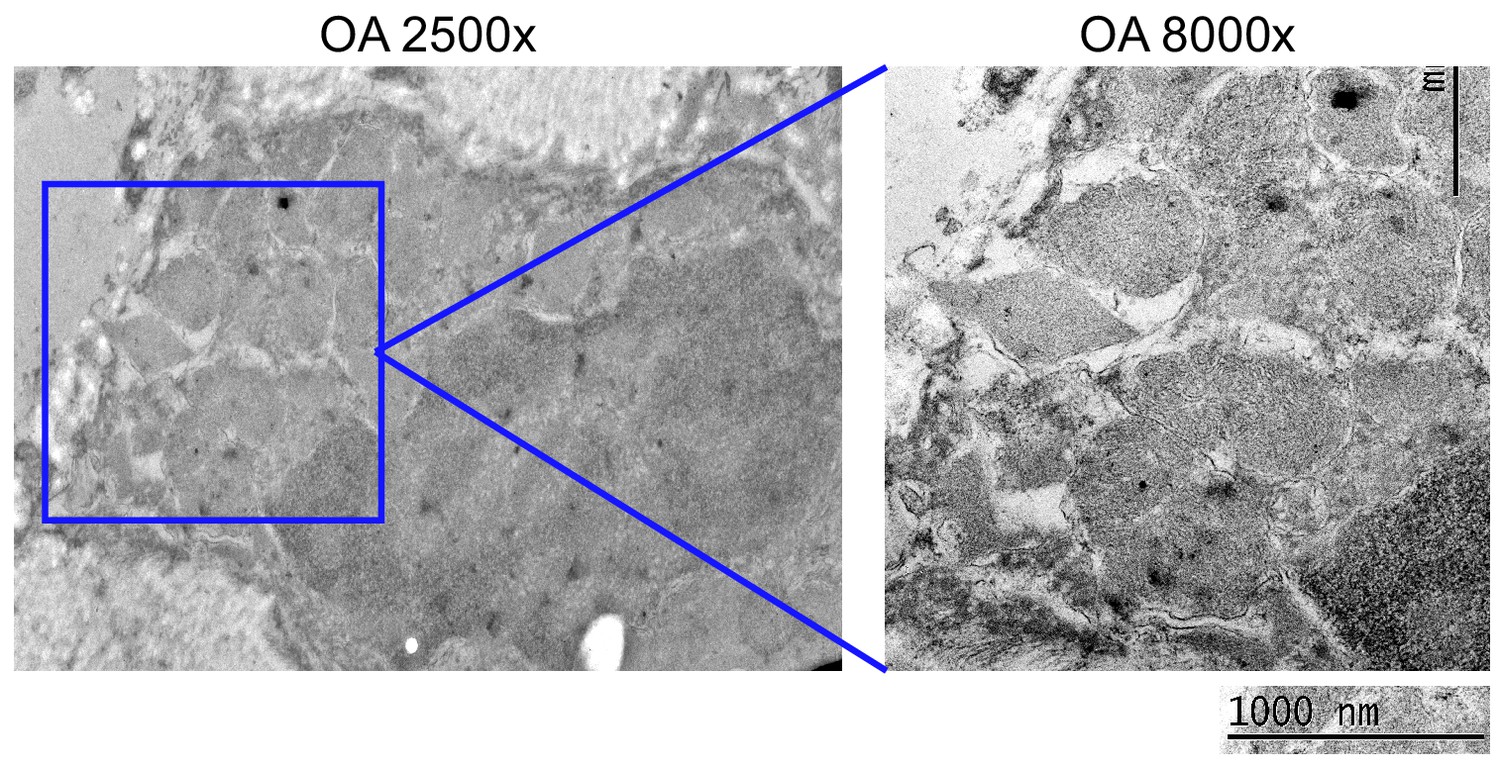
Transmission electron microscopy (TEM) isotype control immuno-labelling analysis.
Representative TEM images of an osteoarthritic synovial lining following immuno-labelling with gold-conjugated isotype-matched control antibody (isotype-matched control for the anti-tryptase antibody in Figure 1b). Presented are a representative 2,500× magnification image (left panel), and an 8,000× magnification image of the area demarcated by the red box (right panel).
Figure 1—figure supplement 2
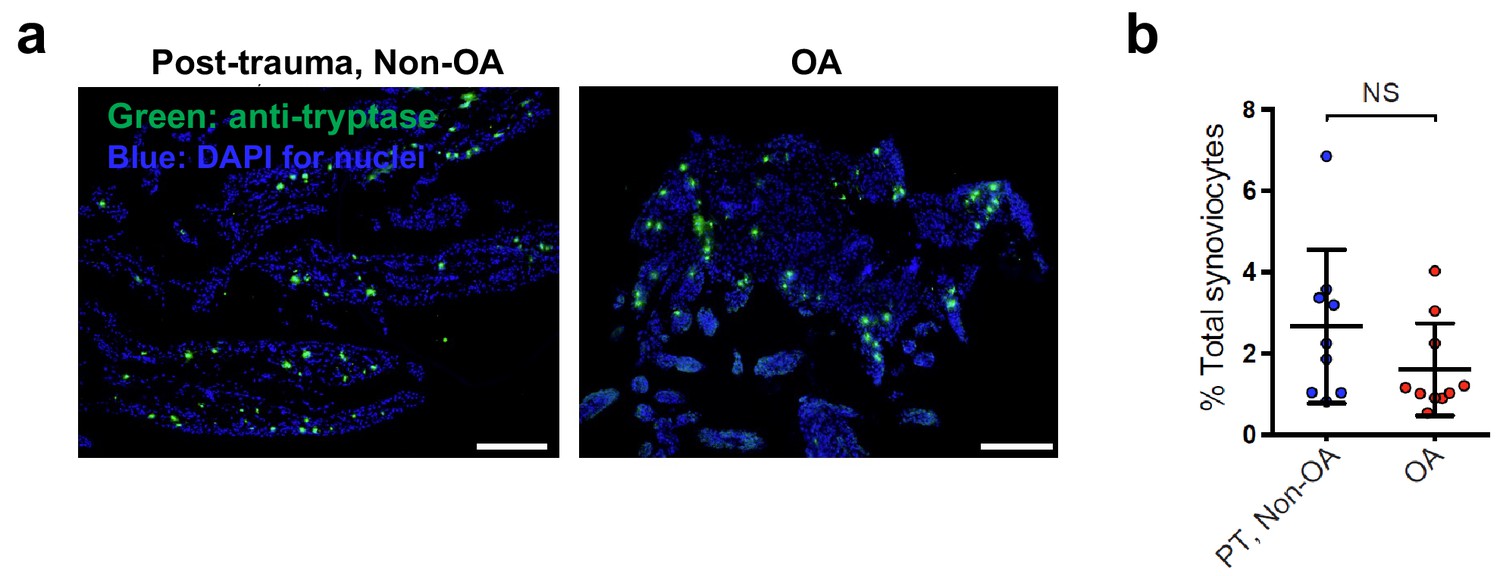
Mast cells are present in human osteoarthritis and post-trauma non-osteoarthritis synovial tissue.
(a) Synovial tissue samples from osteoarthritis (OA) and post-trauma non-OA joints were stained with anti-tryptase antibody to identify mast cells (representative images are provided). (b) Quantification of the number of tryptase+ mast cells per high powered field in each synovial sample. The mean % of total synoviocytes for each synovial sample is displayed. Statistical comparison of the OA vs. PT, Non-OA groups were performed using Student’s t test (NS = non-significant).
Figure 1—figure supplement 3
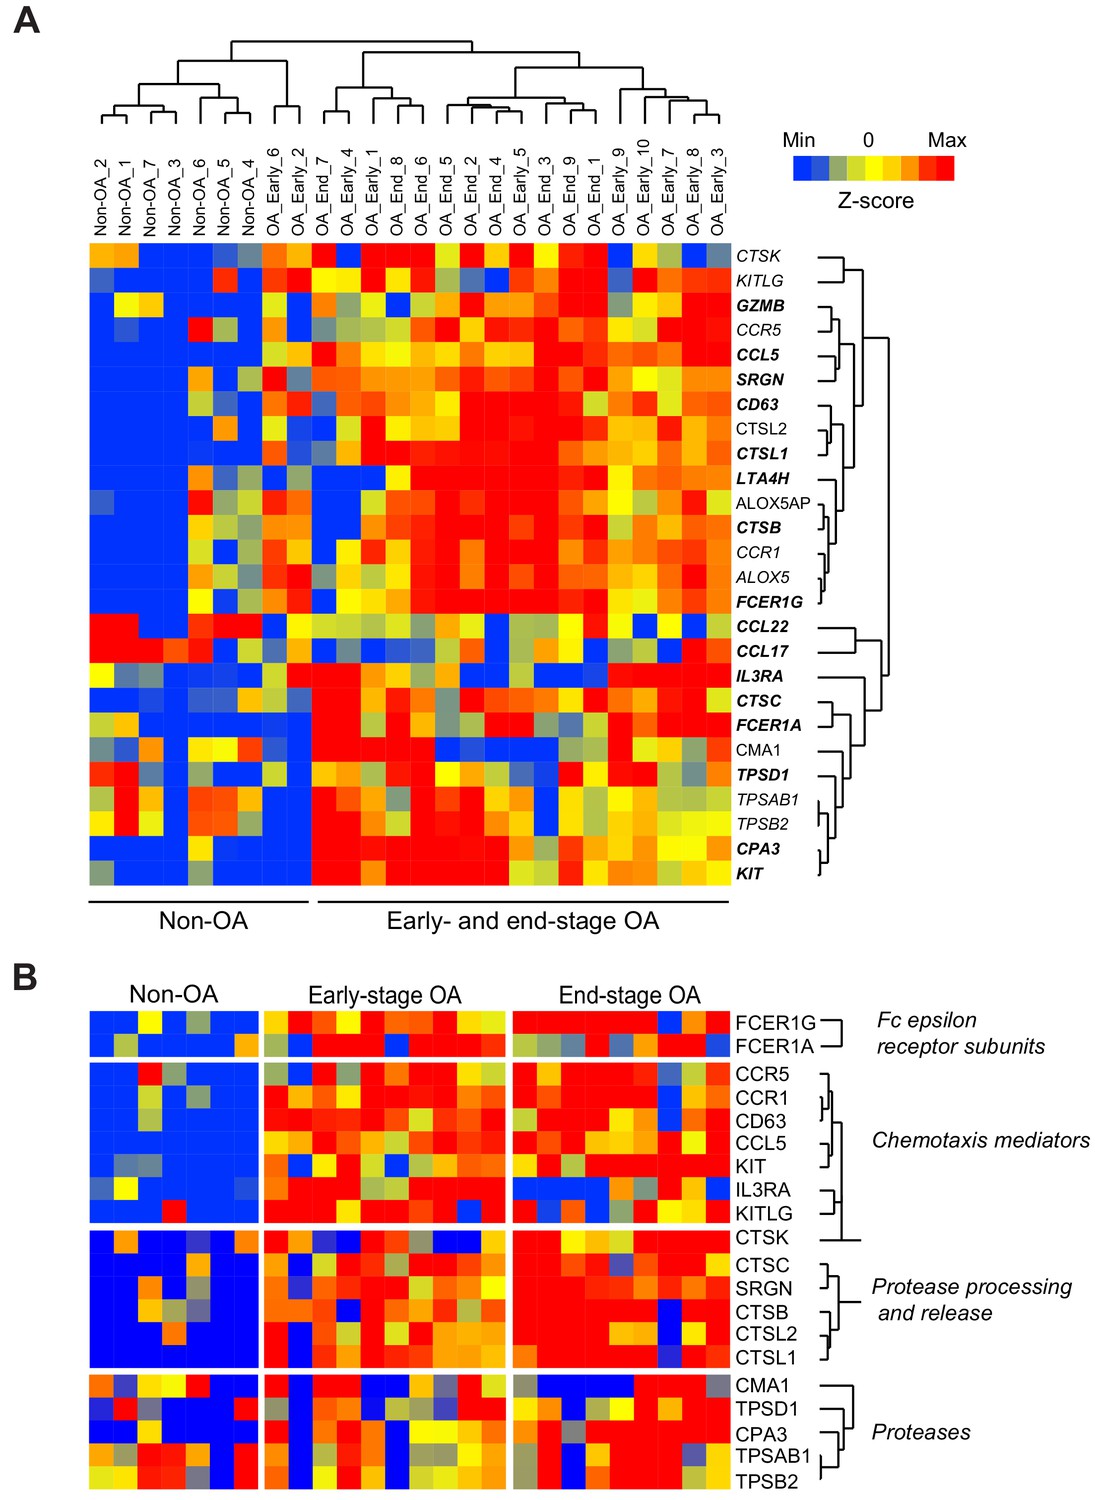
Expression of mast cell mediators in osteoarthritic synovial membranes.
(a) Unsupervised hierarchical cluster analysis of microarray-based gene expression profiles in synovial membranes derived from individuals with early- or end-stage osteoarthritis or healthy synovium (downloaded from NCBI Gene Expression Omnibus, accession code GSE32317), with analyses limited to genes related to mast cell development, survival, function, and activation. (b) Supervised hierarchical cluster analyses of gene expression profiles in microarray datasets from synovial membranes of individuals with early- or end-stage osteoarthritis and healthy control synovium using a set of genes restricted to mast cell differentiation, chemotaxis, and function. Scale represents Z-scores.
Figure 2 with 4 supplements
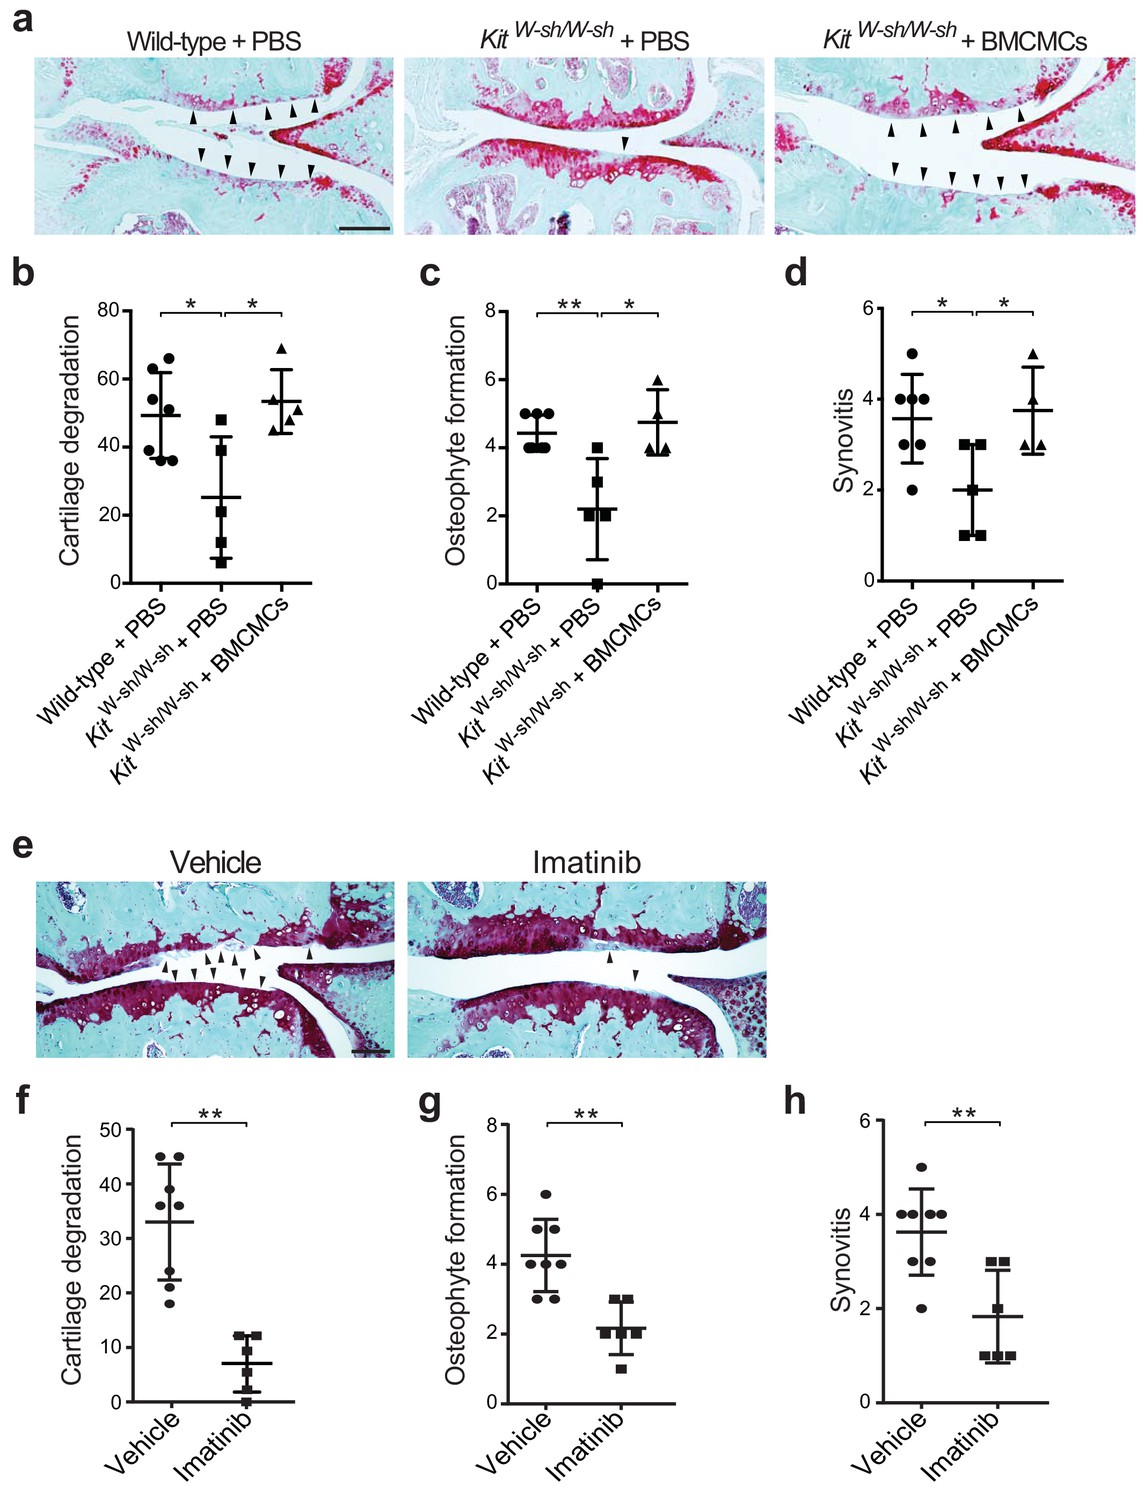
Genetic deficiency or pharmacologic inhibition of mast cells protects against the development of osteoarthritis in mice.
(a–d) Cartilage degradation in medial regions of stifle joints from C57BL/6J mast cell-sufficient mice (Wild-type +PBS; n = 7), mast cell-deficient mice (KitW-sh/W-sh + PBS; n = 5), and mast cell-deficient mice engrafted with BMCMCs (KitW-sh/W-sh + BMCMCs; n = 5) 20 weeks after DMM surgery. Representative Safranin-O-stained sections of medial regions of stifle joints from these mice are shown (a); arrowheads show severe cartilage loss. Cartilage degradation (b), osteophyte formation (c), and synovitis (d) in medial regions of stifle joints from these mice are quantified. (e–h) Cartilage degradation in medial regions of stifle joints from C57BL/6J mice subjected to DMM surgery and then treated by oral gavage with vehicle (n = 8) or imatinib 100 mg/kg/d (n = 6) for 12 weeks. Representative Safranin-O stained medial stifle joint sections from these mice are shown (e); arrowheads show severe cartilage loss. Cartilage degeneration (f), osteophyte formation (g), and synovitis (h) in medial regions of stifle joints from these mice are quantified. Symbols represent scores from individual mice. Bars denote mean ± s.d. *p≤0.05, **p≤0.01, by multiple comparisons one-way ANOVA. Scale bars, 200 μm. Scoring of joint pathologies was done by an investigator blinded to the experimental groups. Results are representative of three independent experiments for imatinib treatment, and two independent experiments for KitW-sh/W-sh deficient mice. PBS, phosphate-buffered saline; BMCMCs, bone marrow-derived cultured mast cells; DMM, destabilization of the medical meniscus.
Figure 2—figure supplement 1
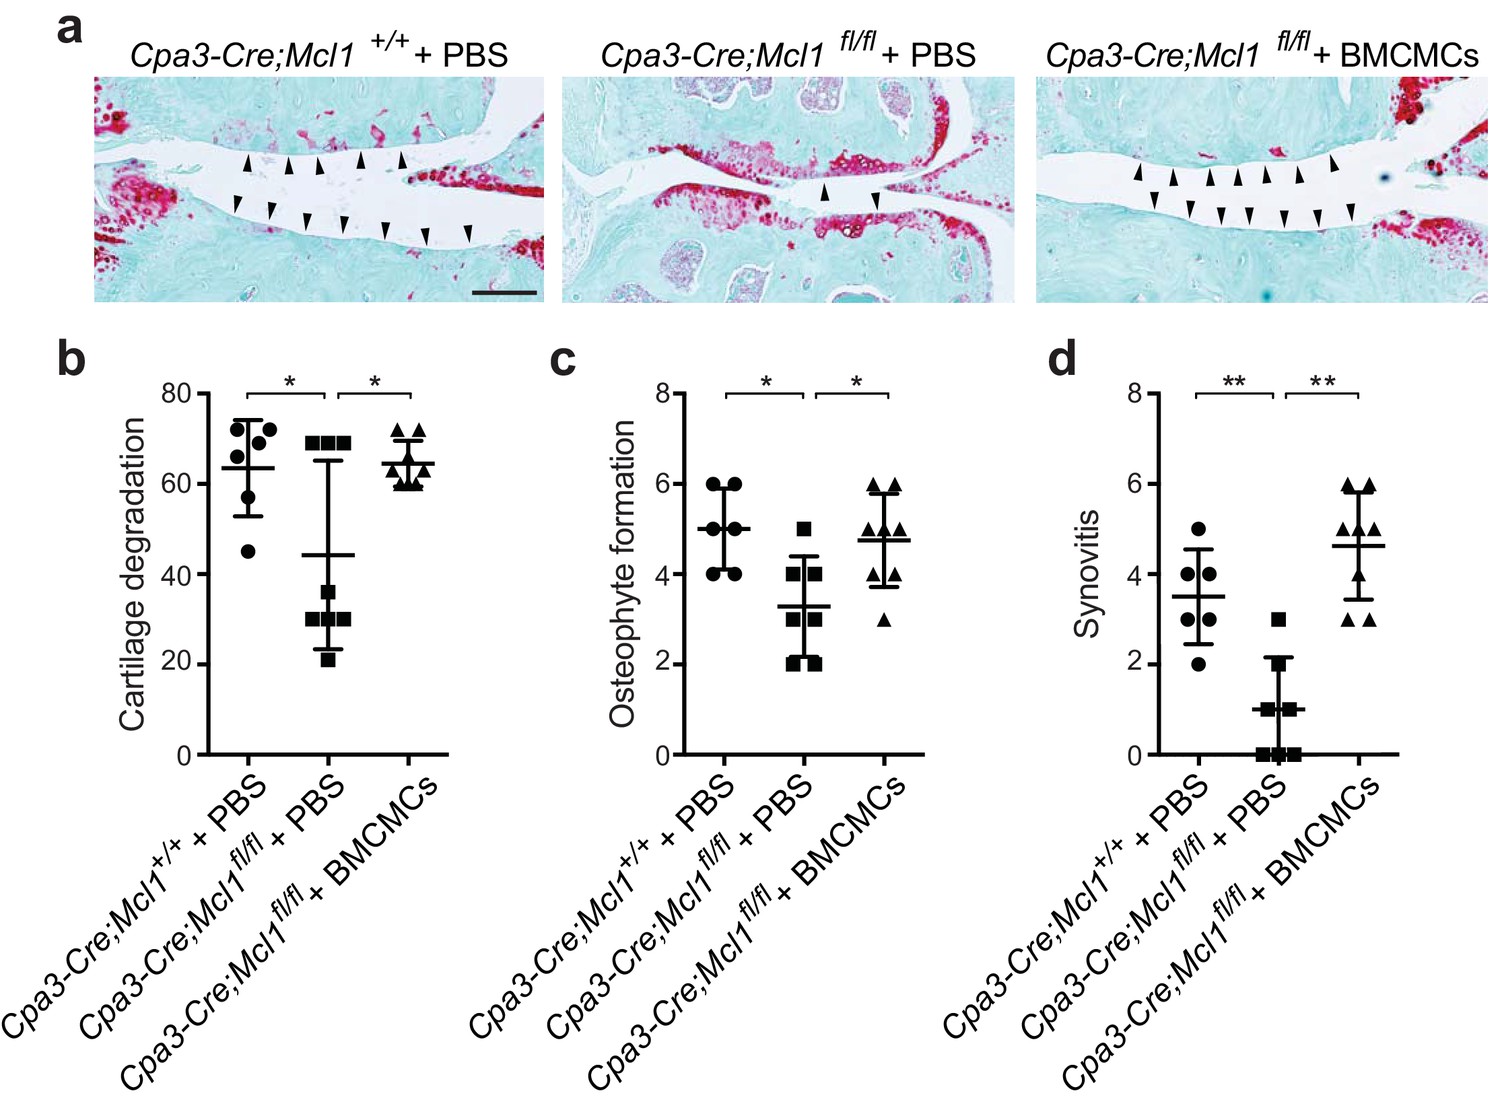
Genetic elimination of mast cells in a c-kit independent mouse model attenuates osteoarthritic development and severity.
(a-d) Cartilage degradation in medial regions of stifle joints from Cpa3-Cre;Mcl1+/+ mast cell-sufficient mice (Cpa3-Cre;Mcl1+/+ + PBS; n=6), cKit-independent (Cpa3-Cre;Mcl1fl/fl) mast cell-deficient mice (Cpa3-Cre;Mcl1fl/fl + PBS; n=7), and Cpa3-Cre;Mcl1fl/fl mice engrafted with BMCMCs (Cpa3-Cre;Mcl1fl/fl + BMCMCs; n=8) 20 weeks after DMM surgery. Representative safranin-O-stained sections of medial regions of stifle joints from these mice are shown (a); arrowheads show severe cartilage loss. Cartilage degradation (b), osteophyte formation (c), and synovitis (d) in medial regions of stifle joints from these mice are quantified. Symbols represent scores from individual mice. Bars denote mean ± s.d. *P≤0.05, **P≤0.01 by multiple comparisons one-way ANOVA. Scale bars, 200μm. Scoring of joint pathologies was done by two investigators blinded to experimental groups. Data are representative of two independent experiments with similar results. PBS, phosphate-buffered saline; BMCMCs, bone marrow-derived cultured mast cells; DMM, destabilization of the medial meniscus.
Figure 2—figure supplement 2

Genetic deficiency of mast cells reduces synovitis and osteophyte formation following DMM.
Representative H&E-stained knee joint of stifle joints from C57BL/6J mast cell-sufficient mice (wild-type + PBS), mast cell-deficient mice (KitW-sh/W-sh + PBS), and mast cell-deficient mice engrafted with BMCMCs (KitW-sh/W-sh + BMCMCs) 20 weeks after DMM surgery. Open arrows indicate synovial inflammation or synovial thickening, yellow arrow indicates osteophyte. Scale bars, 200μm. *P ≤0.05 by Student’s t test.
Figure 2—figure supplement 3
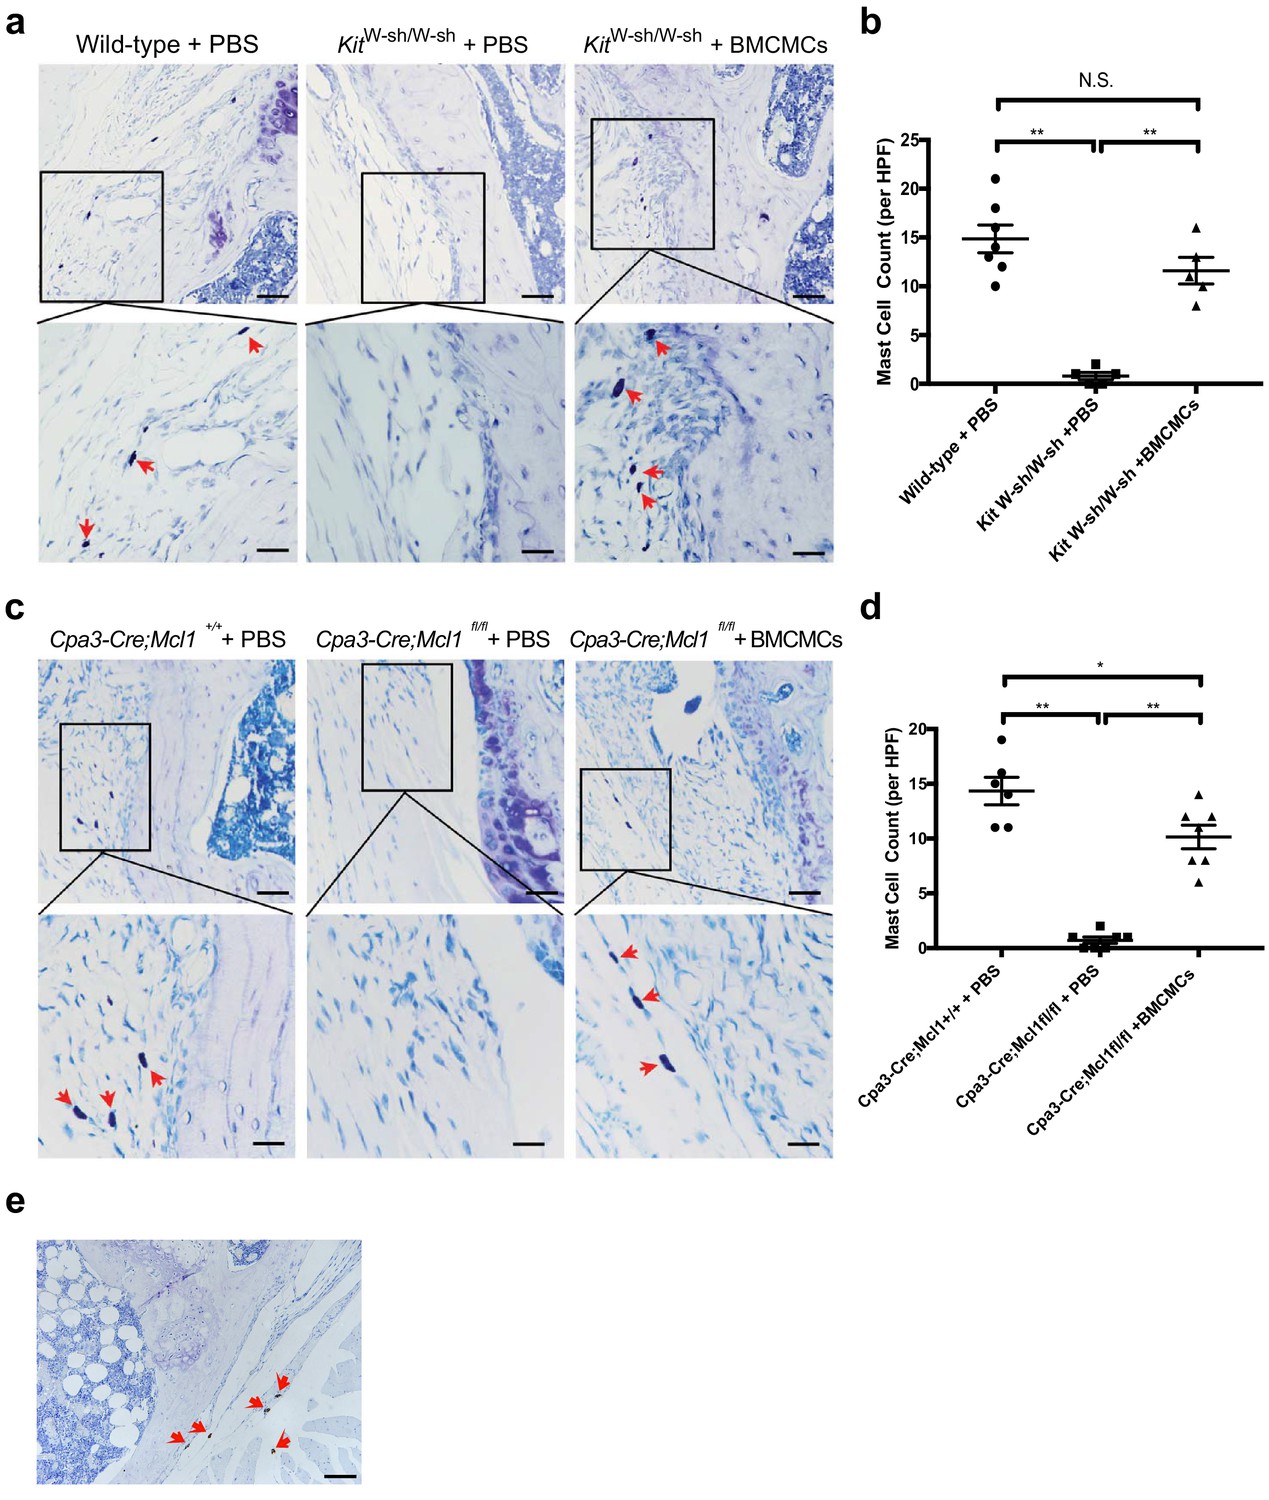
Staining of mast cells in the synovium of mast cell-deficient and mast cell-engrafted mice following DMM.
(a) Representative toluidine blue stained sections of stifle joints from c-kit-dependent mast cell-deficient KitW-sh/W-sh mice (KitW-sh/W-sh + PBS), c-kit-dependent mast cell-deficient mice engrafted with BMCMCs (KitW-sh/W-sh + BMCMCs), and C57BL/6J mast cell-sufficient mice (Wild-type + PBS). Mast cells (red arrows in high magnification images) were present in mast cell-sufficient controls (Wild-type + PBS, left panels) and mast cell-engrafted mice (KitW-sh/W-sh + BMCMCs, right panels), but not in the mast cell-deficient mice (KitW-sh/W-sh + PBS, middle panels). (b) Quantification of toluidine blue-stained mast cells in (a). (c) Representative toluidine blue staining of stifle joint sections from c-kit-independent (Cpa3-Cre;Mcl1fl/fl) mast cell-deficient mice (Cpa3-Cre;Mcl1fl/fl + PBS), Cpa3-Cre;Mcl1fl/fl mice engrafted with BMCMCs (Cpa3-Cre;Mcl1fl/fl + BMCMCs), and Cpa3-Cre;Mcl1+/+ mast cell-sufficient control mice (Cpa3-Cre;Mcl1+/+ + PBS). Mast cells (red arrows in high magnification images) were present in mast cell-sufficient controls (Cpa3-Cre;Mcl1+/+ + PBS, left panels) and mast cell-engrafted mice (Cpa3-Cre;Mcl1fl/fl + BMCMCs, right panels), but not in the mast cell-deficient mice (Cpa3-Cre;Mcl1fl/fl + PBS, middle panels). (d) Quantification of toluidine blue-stained mast cells in (c). (e) To further characterize Cpa3-Cre;Mcl1fl/fl mice that developed cartilage degeneration (Figure 2—figure supplement 1b), anti-tryptase antibody staining was performed on sections of the affected joints. Tryptase-positive mast cells (red arrows) were identified in the joints of most Cpa3-Cre;Mcl1fl/fl mice that developed osteoarthritis. Scale bars are 200μm for the lower magnification images (upper panels), and 50 μm for the higher magnification images (lower panels). DMM, destabilization of the medial meniscus. Statistical comparisons were performed using Tukey’s multiple comparison test (*P <0.05, **P < 0.01). PBS, phosphate-buffered saline. BMCMCs, bone marrow-derived cultured mast cells.
Figure 2—figure supplement 4
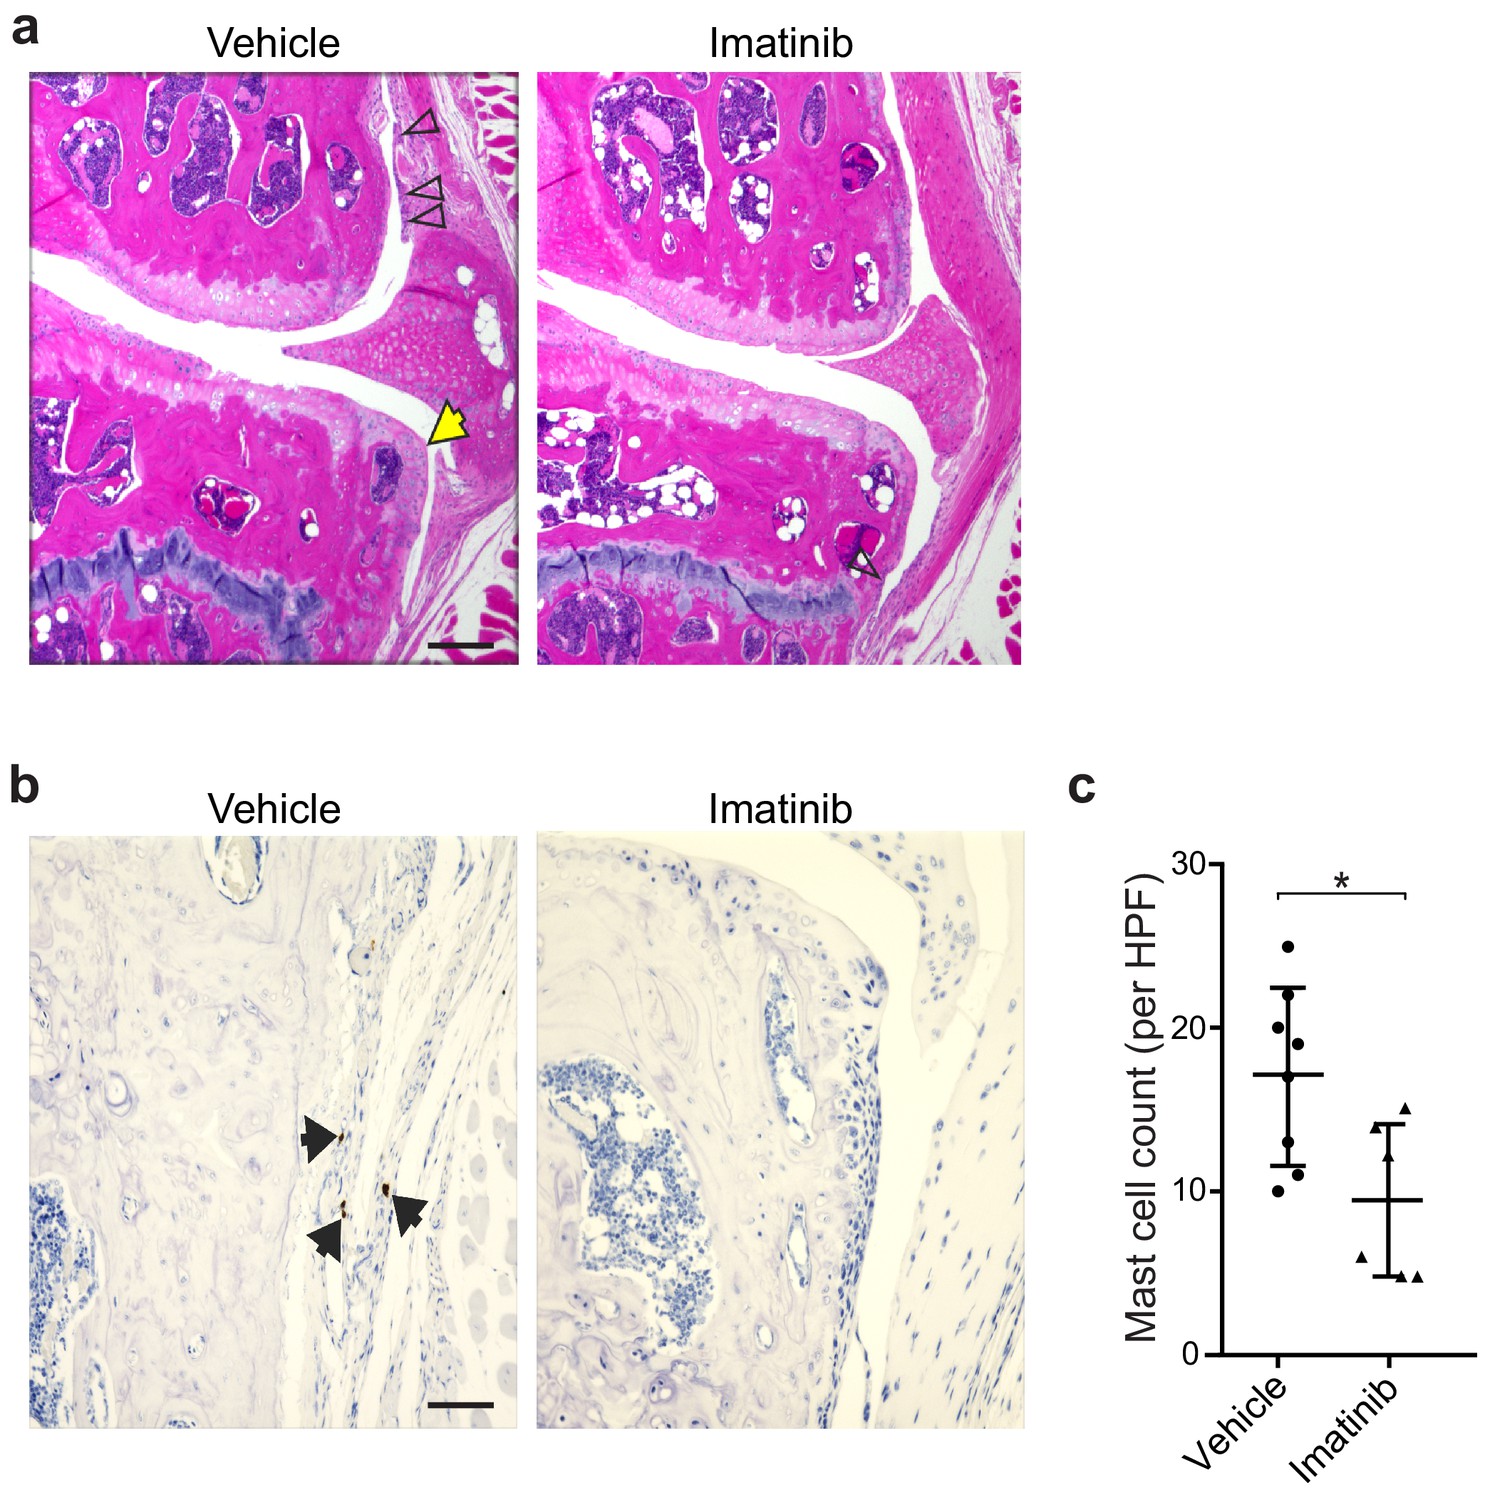
Pharmacologic inhibition of mast cells by imatinib reduces synovitis and osteophyte formation following DMM.
(a) Representative H&E-stained knee joint of stifle joints from C57BL/6J mice treated with vehicle or imatinib for 12 weeks following DMM surgery. (b) Representative immunohistochemical staining with anti-tryptase antibodies of stifle joints from C57BL/6J mice treated with vehicle or imatinib. Black arrows indicate tryptase+ (brown) mast cells. (c) Quantification of tryptase-positive cells in high power field images from knees of mice described in (b). Scale bars, 200μm. *P ≤0.05 by Student’s t test.
Figure 3 with 1 supplement
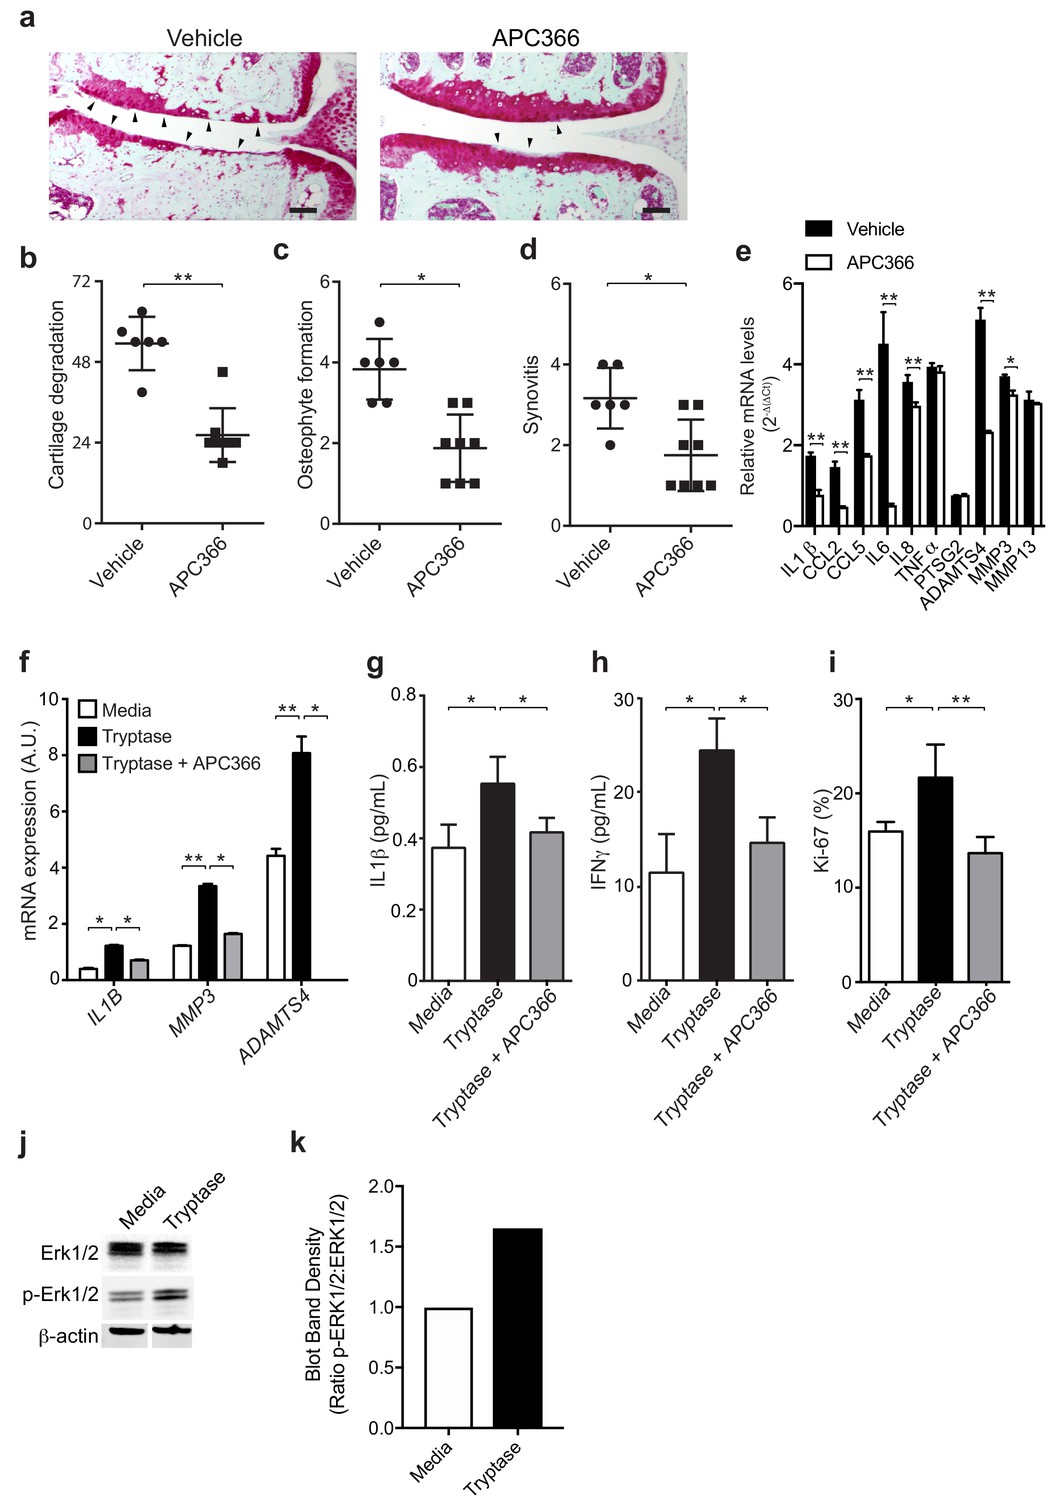
Mast cell-derived tryptases promote osteoarthritis pathology in vitro and in vivo.
(a–e) Cartilage degradation in medial regions of stifle joints from C57BL/6J mice subjected to DMM surgery and then treated orally with the tryptase inhibitor APC366 5 mg/kg/d (n = 5) or vehicle (n = 7) for 12 weeks. Representative safranin-O stained medial stifle joint sections from these mice are shown (a); arrowheads show severe cartilage loss. Cartilage degeneration (b), osteophyte formation (c), and synovitis (d) in medial regions of stifle joints from these mice are quantified. Scoring of joint pathologies were done by two investigators blinded to experimental groups. Data are representative of three independent experiments. Symbols represent scores from individual mice. Bars are the mean ± s.d. for each group. *p≤0.05, **p≤0.01, by Mann Whitney test. Scale bars, 200 μm. (e) Relative mRNA expression of pro-inflammatory/degradative enzyme genes in mouse stifle joints. (f) Relative mRNA expression of inflammatory/degradative enzyme genes in osteoarthritic synovial fibroblasts treated for 24 hr with 0.2 μg/ml tryptase with or without 100 μM APC366. (g–h) Quantification of IL1β (g) and IFNγ (h) secretion by synovial fibroblasts stimulated for 24 hr. (i) Flow cytometric quantification of Ki-67 +synovial fibroblasts treated with media or 0.2 μg/ml tryptase with or without 100 μM APC366 for 72 hr. (j) Western blot analysis of total ERK1/2, phosphorylated ERK1/2 (p-ERK1/2), and β-actin in primary osteoarthritic synovial fibroblasts treated with media or 0.2 μg/ml tryptase for 72 hr. (k) Ratio of densitometry of p-ERK1/2:ERK1/2 bands from western blot in (j) Data in (f–i) are mean ± s.d. of triplicate values. *p≤0.05, **p≤0.01 by Student’s t test. Results are representative of three independent experiments using samples from independent donors.
Figure 3—figure supplement 1
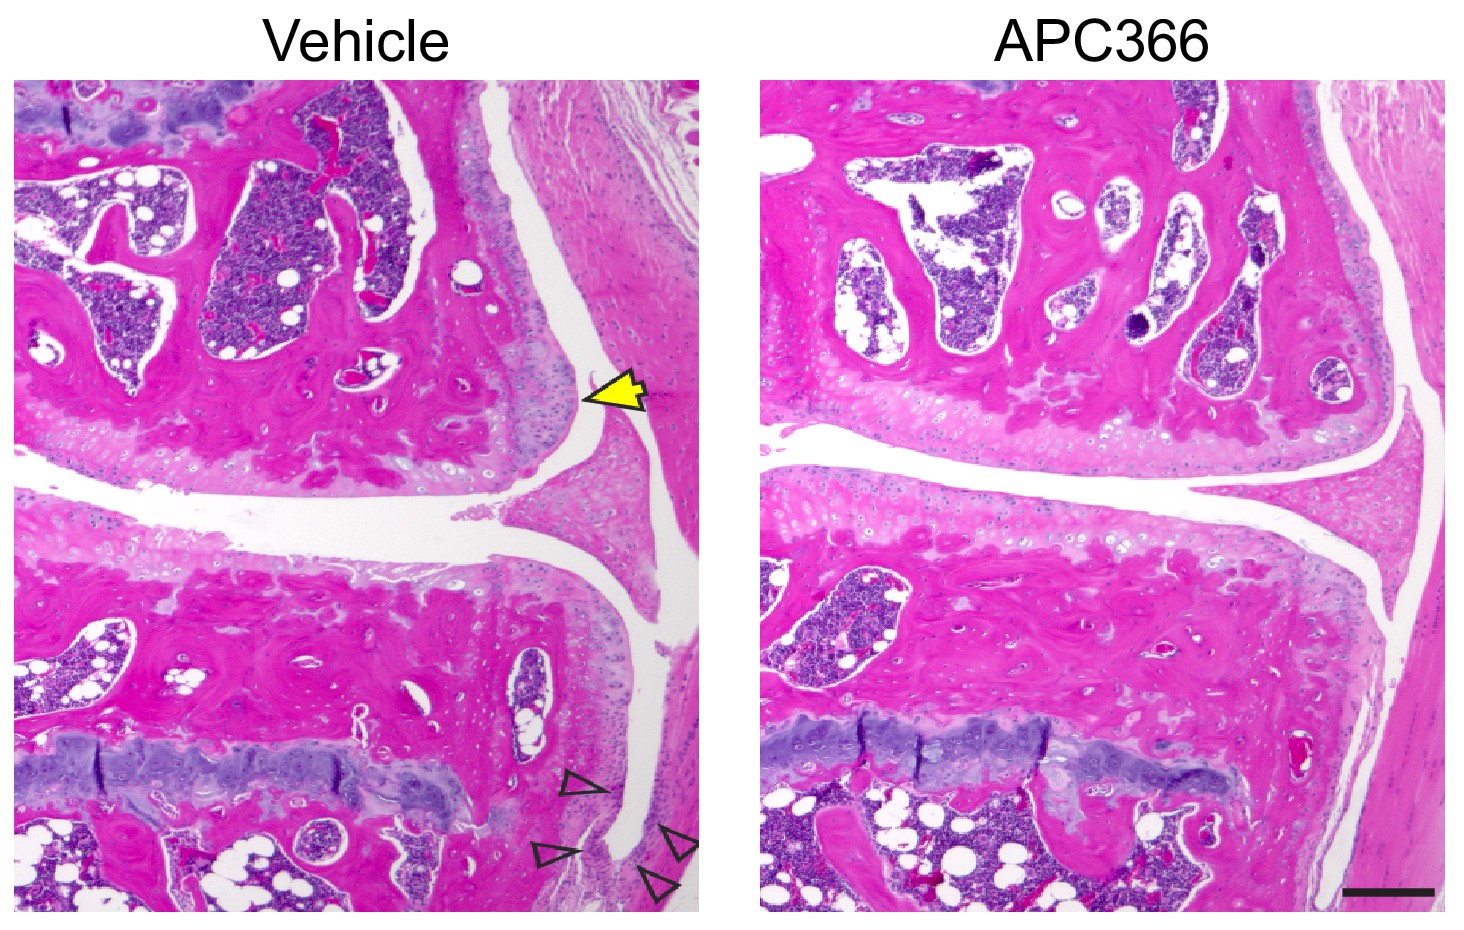
Representative images of osteophyte formation and synovitis in mice treated with the tryptase inhibitor APC366 following DMM.
Representative H&E-stained knee joint sections from C57BL/6J mice treated orally with vehicle (PBS), or the tryptase inhibitor APC366 5 mg/Kg/day every day for 12 weeks following DMM surgery. Osteophytes (yellow arrows) and synovial thickening (open arrows) were prominent in vehicle-treated controls, but not in the APC366-treated mice. Scale bars, 200μm.
Figure 4 with 2 supplements
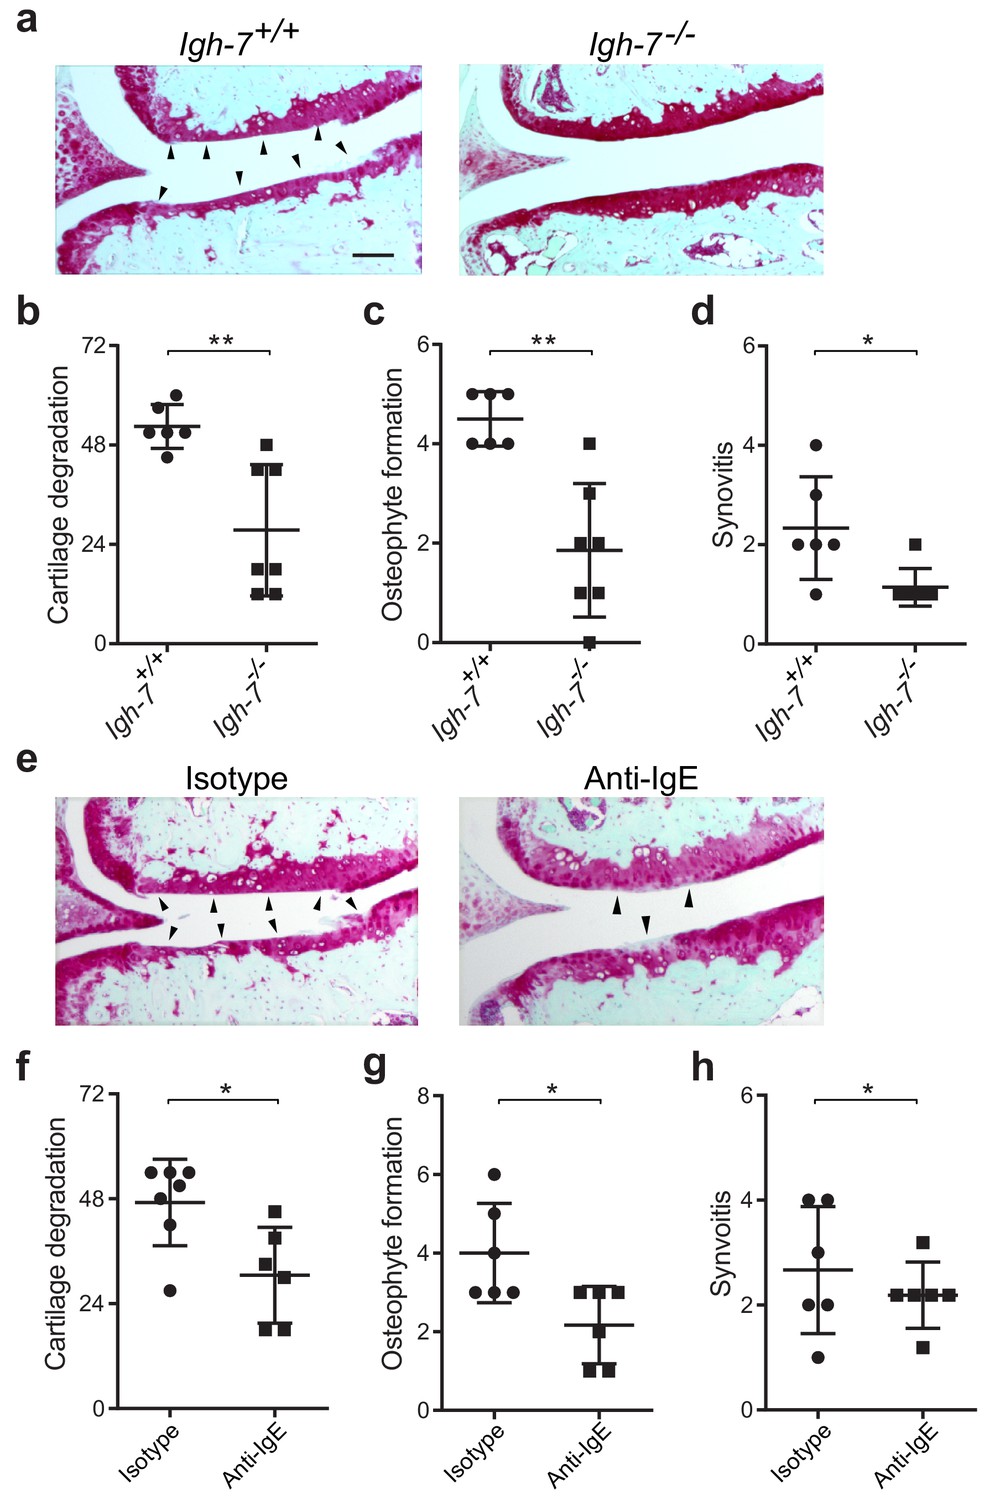
Genetic deficiency or pharmacologic depletion of IgE protects against the development of osteoarthritis in mice.
(a–d) Cartilage degradation in medial regions of stifle joints from C57BL/6J IgE-deficient (Igh7-/-, n = 7) and IgE-sufficient (Igh7+/+, n = 6) mice 20 weeks after DMM surgery. Representative safranin-O stained medial stifle joint sections from these mice are shown (a); arrowheads show severe cartilage loss. Quantification of cartilage degradation (b), osteophyte formation (c), and synovitis (d). (e–h) Cartilage degradation in medial regions of stifle joints from C57BL/6J mice subjected to DMM surgery and then treated i.p. with anti-IgE antibody (n = 6) or isotype-matched control antibody (n = 7) 2.5 mg/kg twice per week for 12 weeks. Representative Safranin-O stained medial stifle joint sections from these mice are shown (e); arrowheads show severe cartilage loss. Cartilage degeneration (f), osteophyte formation (g), and synovitis (h) in medial regions of stifle joints from these mice are quantified. Symbols represent scores from individual mice. Bars denote mean ± s.d. *p≤0.05, **p≤0.01, by Mann Whitney test. Scale bars, 200 μm. Scoring of joint pathologies was performed by an investigator blinded to experimental groups. Data are representative of two independent experiments with similar results.
Figure 4—figure supplement 1
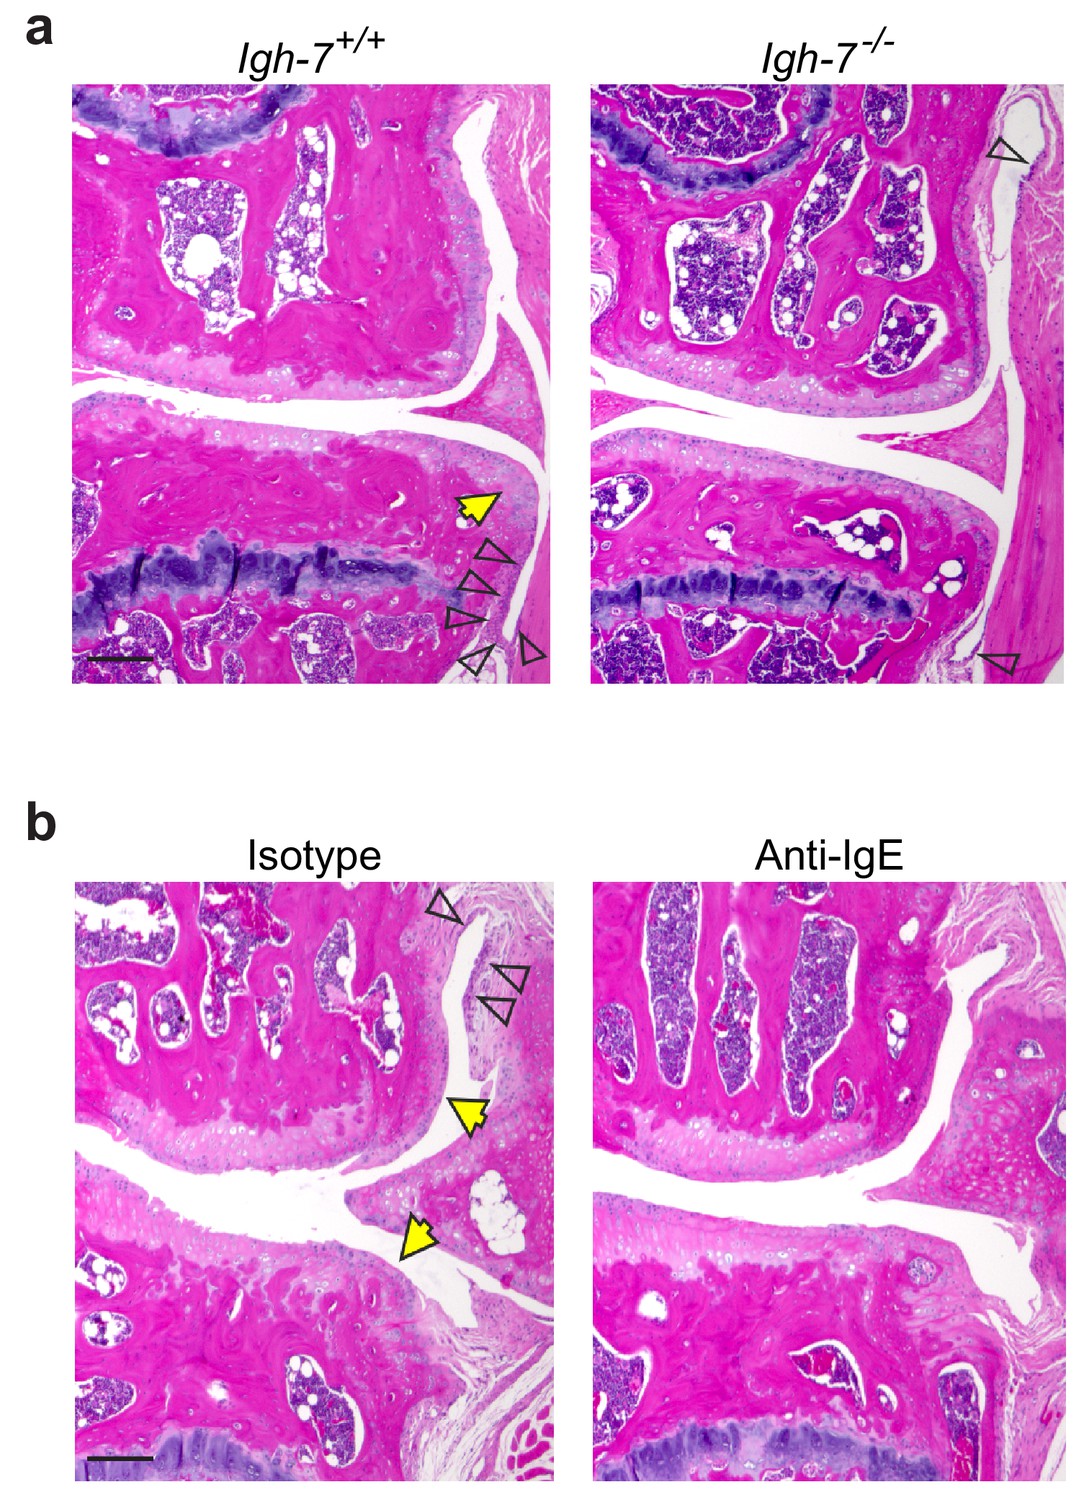
Deficiency of IgE reduces synovitis and osteophyte formation in mice subjected to DMM.
(a) Representative H&E-stained knee joint sections from IgE-sufficient (Igh-7+/+) and IgE-deficient (Igh-7-/-) mice 20 weeks after DMM surgery. (b) Representative H&E-stained knee joint sections from C57BL/6J mice administered with isotype control (IgG1κ), or anti-IgE (2.5 mg/Kg/day) antibodies twice a week for 12 weeks following DMM surgery. Yellow arrows show osteophyte and open arrows show synovial thickening or synovitis. Scale bars, 200μm.
Figure 4—figure supplement 2
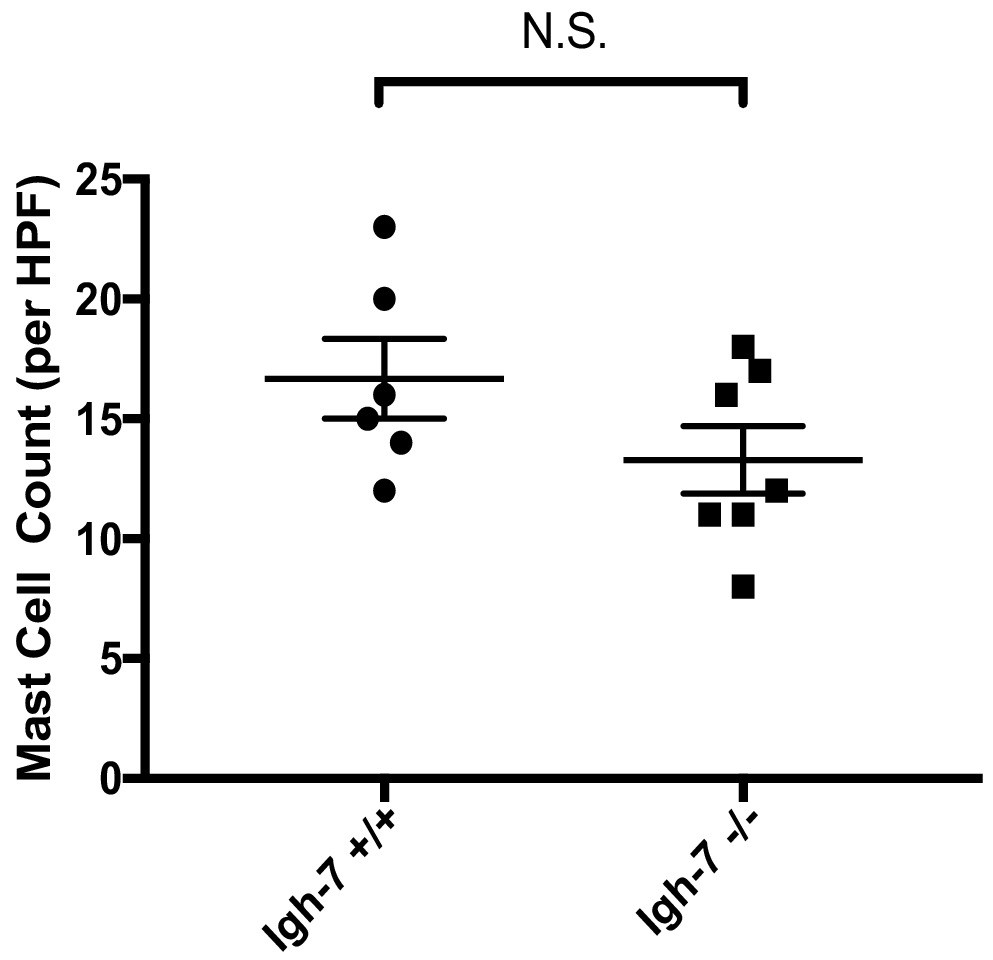
Mast cell numbers in DMM joint tissue in IgE deficient and wild-type mice following DMM.
Quantification of mast cells by toluidine blue staining of joint tissue derived from IgE-sufficient (Igh-7+/+) and IgE-deficient (Igh-7-/-) mice 20 weeks following surgical DMM from Figure 4a. Statistical comparisons were performed using Student’s t test (*P <0.05).
Figure 5 with 1 supplement
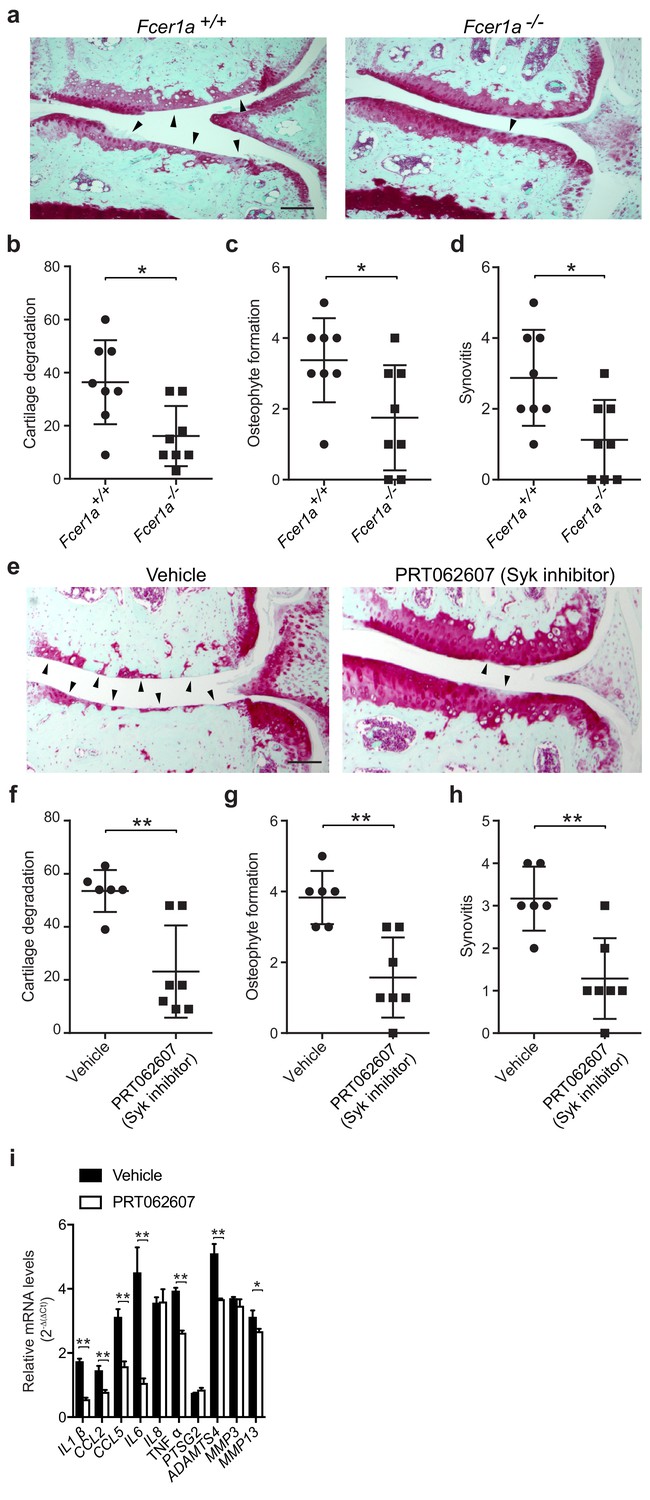
A critical role for IgE-mediated signaling through FcεRI and Syk in osteoarthritis.
(a–d) Cartilage degradation in medial regions of stifle joints from C57BL/6J FcεRIα-sufficient (Fcer1a+/+,n = 8) and FcεRIα-deficient (Fcer1a-/-,n = 8) mice 20 weeks after DMM surgery. Representative safranin-O stained medial stifle joint sections from these mice are shown; arrowheads show severe cartilage loss. Cartilage degradation (b), osteophyte formation (c), and synovitis (d) in medial regions of stifle joints from these mice are quantified. Symbols represent scores from individual mice. Bars denote mean ± s.d. *p≤0.05, **p≤0.01, by Mann Whitney test. Scale bars, 200 μm. Scoring of joint pathologies was done by two investigators blinded to experimental groups. Data are representative of two independent experiments with similar results. DMM, destabilization of the medical meniscus. (e–h) Cartilage degradation in medial regions of stifle joints from C57BL/6J mice subjected to DMM surgery and then orally with vehicle (n = 6) or 75 mg/Kg/day of the Syk inhibitor PRT062607 (n = 7), for 12 weeks. Representative Safranin-O stained medial stifle joint sections from these mice are shown (e); arrowheads show severe cartilage loss. Cartilage degeneration (f), osteophyte formation (g), and synovitis (h) in medial regions of stifle joints from these mice are quantified. Symbols represent scores from individual mice. Bars denote mean ± s.d., **p≤0.01, by Mann Whitney test. Scale bars, 200 μm. Scoring of joint pathologies was done by two investigators blinded to experimental groups. (i) Relative mRNA expression of pro-inflammatory/degradative enzyme genes in mouse stifle joints. Data are representative of two independent experiments with similar results. DMM, destabilization of the medical meniscus.
Figure 5—figure supplement 1

Deficiency in FceR1a or blockade of FcεRIα signaling in mice reduces synovitis and osteophyte formation following DMM.
(a) Representative H&E-stained knee joint sections from Fcer1a-sufficient (Fcer1a+/+) and Fcer1a-deficient (Fcer1a-/-) mice 20 weeks after DMM surgery. (b) Representative H&E-stained knee joint sections from C57BL/6J mice treated orally with vehicle (PBS), or the Syk inhibitor PRT062607 (75 mg/Kg/day) every day for 12 weeks following DMM surgery. Osteophytes (yellow arrows) and synovial thickening (open arrows) were prominent in vehicle-treated controls, but not in the PRT062607-treated mice. Scale bars, 200μm.
Author response image 1
Author response image 2
Author response image 3
Author response image 4
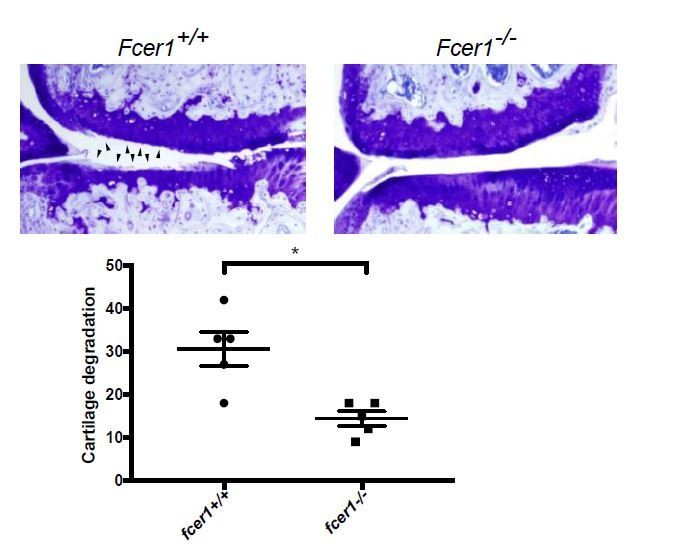
Fcer1-deficient mice are protected against the medial meniscectomy (MM) model of osteoarthritis.
Representative toluidine blue stained medial stifle joint sections from Fcer1-deficient (Fcer1-/-) and wild-type (Fcer1+/+) mice; arrowheads show areas severe cartilage loss (upper panels). Quantification of cartilage degeneration in the medial regions of stifle joints from these mice (lower panel).
Author response image 5
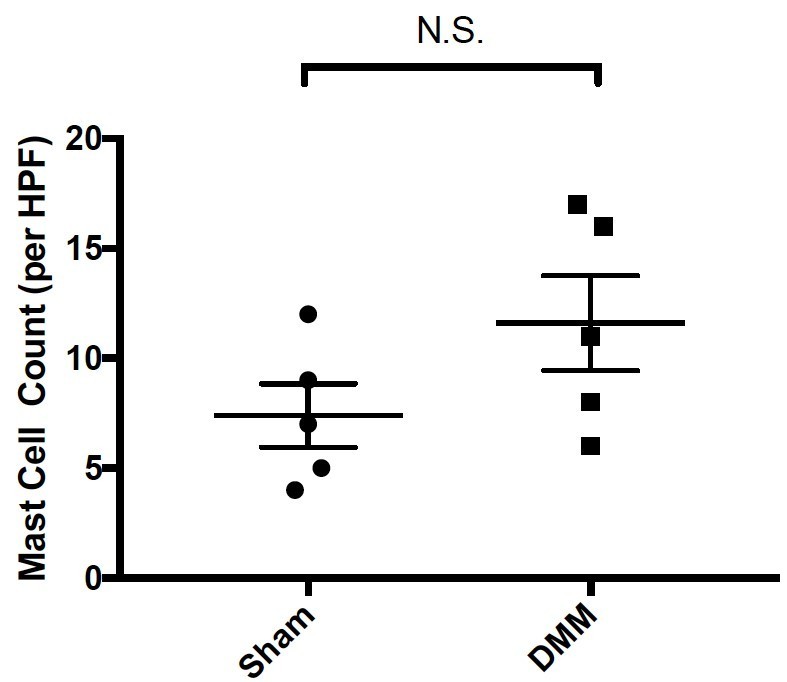
Quantitation of mast cells by toluidine blue staining of joint tissue derived from sham- and DMM-operated wild-type mice 20-weeks following surgical DMM.
Statistical comparisons were performed using Student’s t test (N.S.= not significant).
Tables
Key resources table
| Reagent type (species) or resource | Designation | Source or reference | Identifiers | Additional information |
|---|---|---|---|---|
| Genetic reagent (M. musculus) | KitW-sh/W-sh | The Jackson Laboratory | Stock No. 012861 | |
| Genetic reagent (M. musculus) | Cpa3-Cre;Mcl-1fl/fl | Lilla et al., 2011 | Dr. Stephen Galli (Stanford University) | |
| Genetic reagent (M. musculus) | Cpa3-Cre;Mcl-1+/+ | Lilla et al., 2011 | Dr. Stephen Galli (Stanford University) | |
| Genetic reagent (M. musculus) | Fcer1a-/- | The Jackson Laboratory | Stock No.10512 | |
| Genetic reagent (M. musculus) | C57BL/6J | The Jackson Laboratory | Stock No. 000664 | |
| Antibody | Anti-Mast Cell Tryptase antibody | Abcam | catalog #:ab2378 clone: AA1 | |
| Antibody | Mouse IgG1, kappa Isotype Control | Crown Biosciences | catalog #: c0005 | |
| Antibody | Phospho-p44/42 MAPK (Erk1/2) (Thr202/Tyr204) Antibody | Cell signaling | catalog #: 9101 | |
| Antibody | p44/42 MAPK (Erk1/2) Antibody | Cell signaling | catalog #: 4695 | |
| Antibody | Anti-beta actin antibody | Abcam | catalog #: Ab8227 | |
| Commercial assay or kit | Mast Cell Degranulation Assay Kit, | Millipore | catalog #: IMM001 | |
| Chemical compound, drug | imatinib mesylate | LC Laboratories | catalog #: I-5508 | |
| Chemical compound, drug | APC366 | Tocris | catalog #: 2511 | |
| Chemical compound, drug | PRT062607 | Synnovator | catalog #: 1370261-97-4 |
Additional files
-
Transparent reporting form
- https://doi.org/10.7554/eLife.39905.018
Download links
A two-part list of links to download the article, or parts of the article, in various formats.
Downloads (link to download the article as PDF)
Open citations (links to open the citations from this article in various online reference manager services)
Cite this article (links to download the citations from this article in formats compatible with various reference manager tools)
IgE-mediated mast cell activation promotes inflammation and cartilage destruction in osteoarthritis
eLife 8:e39905.
https://doi.org/10.7554/eLife.39905


