Glucose intake hampers PKA-regulated HSP90 chaperone activity
- National Taiwan University, Taiwan
- Institute of Chemistry, Academia Sinica, Taiwan
- Chang Gung University, Taiwan
- Chang Gung Memorial Hospital, Taiwan
Figures
Figure 1 with 2 supplements

Ids2-S148 phosphorylation influences stress tolerance, growth, and chronological lifespan.
(A) A schematic diagram highlights the steps in candidate screening. (B) Growth curves at 30°C were monitored in triplicate and represented as the mean ±S.E. (standard errors). (C) Tenfold serially diluted cells were grown under heat shock (37°C) in 2% glucose or at 30°C in 3% glycerol. WT and S148D mutants were compared using Student’s t-test. *, p < 0.05. **, p < 0.01. (D) For the chronological lifespan assay, CFU viability was determined. 10-fold serial dilutions were spotted on YEPD plates. Quantitative CLS assay was assessed in triplicate by colony-forming capacity on YEPD plates.
-
Figure 1—source data 1
The list of total phosphopeptides influenced by calorie restriction.
- https://doi.org/10.7554/eLife.39925.005
-
Figure 1—source data 2
Genes and mutation sites for functional screening.
- https://doi.org/10.7554/eLife.39925.006
Figure 1—figure supplement 1
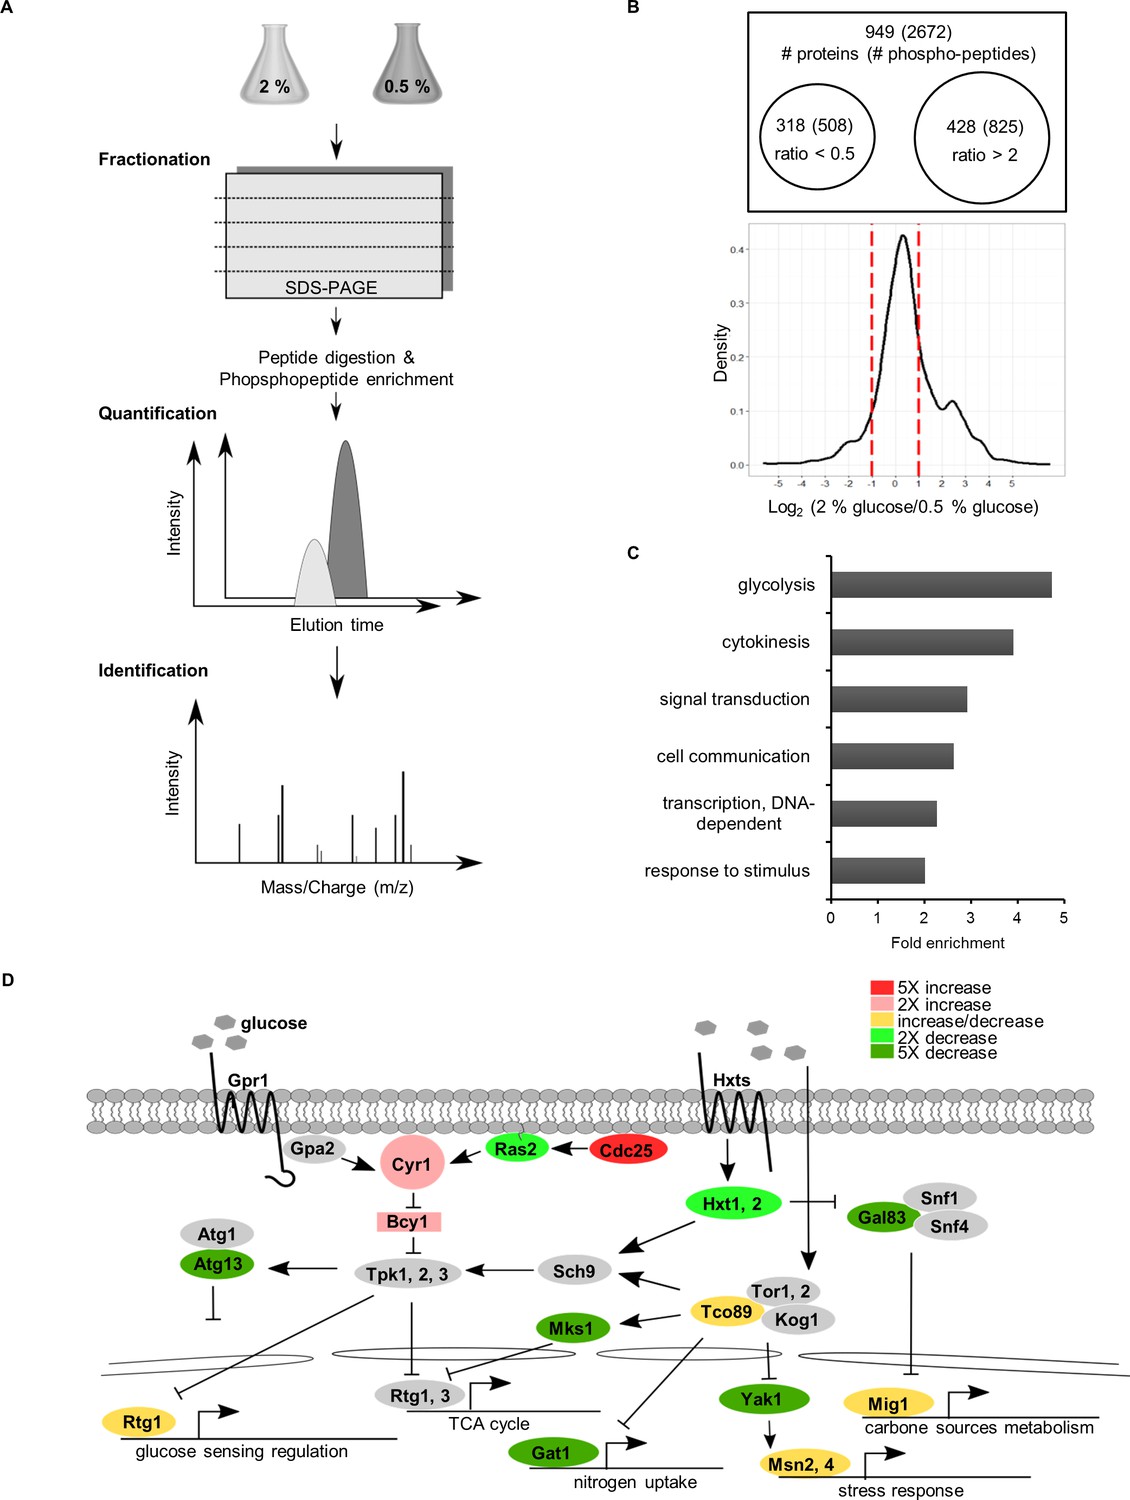
The strategy used for large-scale identification of CR-modulated pathways.
(A) Experimental workflow for quantitative proteomics-identified CR-regulated proteins in yeast. (B) Venn diagrams represent the increased abundance of phosphorylated peptides (proteins) under normal conditions compared to CR by over 50% (log2 >1) or the decreased abundance of phosphorylated peptides (proteins) under normal conditions versus CR treatment by over 50% (log2 < −1). The distribution of log2 (2% glucose/0.5% glucose) ratios for phosphopeptides are illustrated by a density plot. (C) GO term analysis of phosphorylated proteins regulated by CR. The top six enriched biological processes are shown. (D) Some phosphoproteins regulated by CR are factors in the glucose-sensing pathway. The phosphoproteins with a greater than 2-fold change are labeled with different colours to indicate their ratios. The phosphoproteins containing both phosphorylation and dephosphorylation sites under CR are labeled in yellow.
Figure 1—figure supplement 2
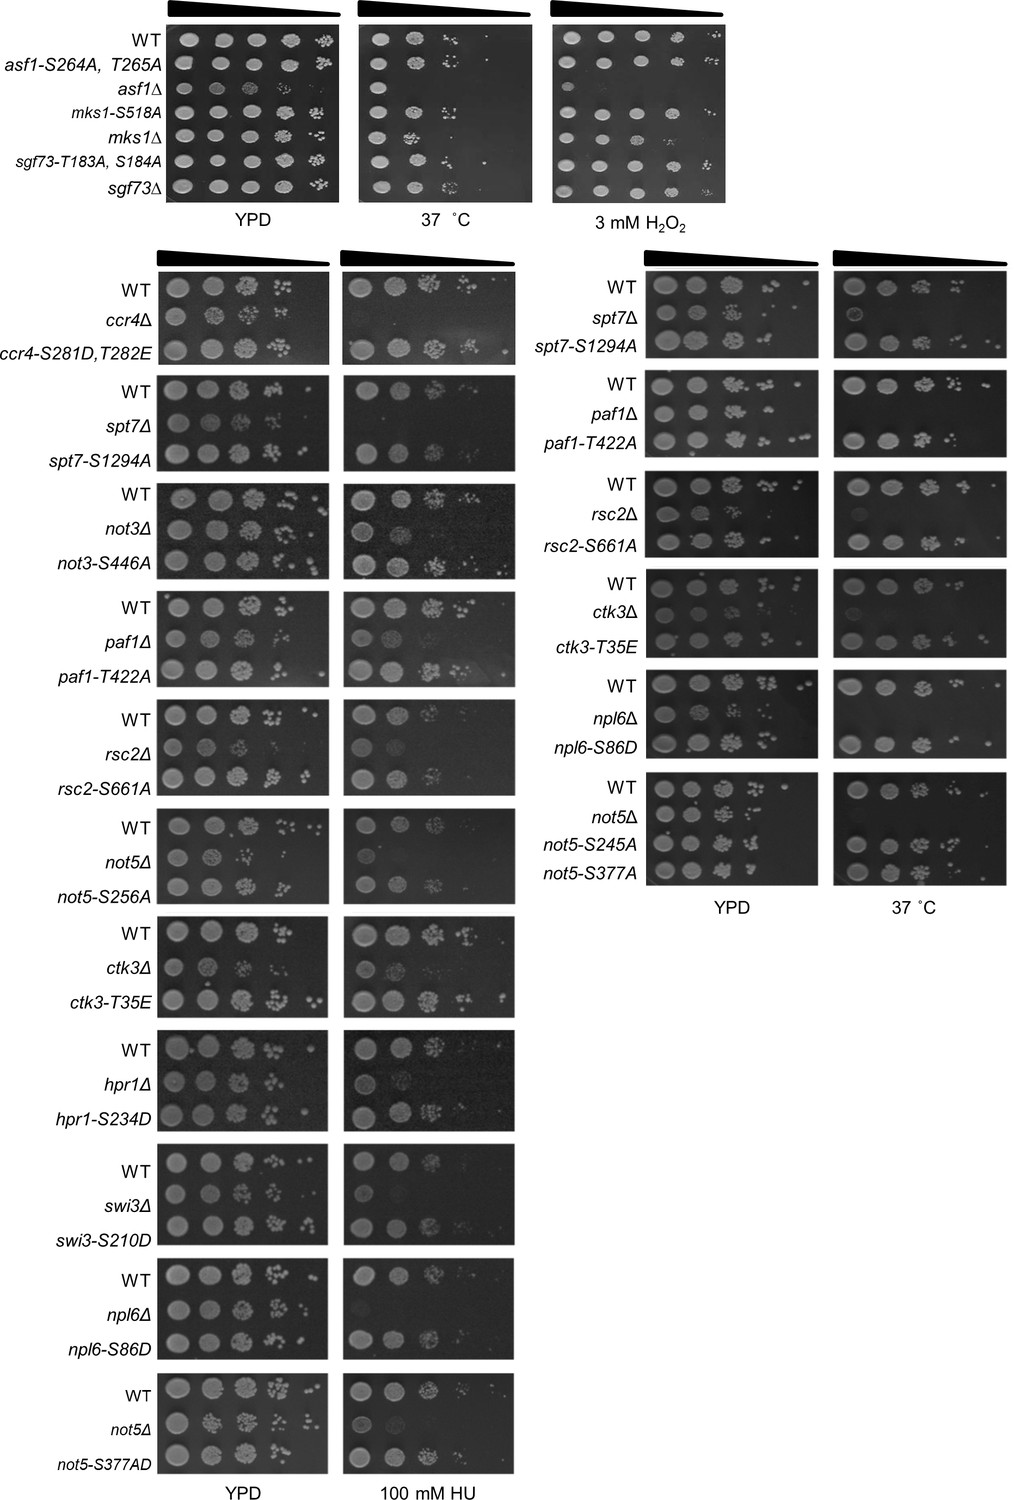
Most phosphorylation site mutants displayed wild-type phenotypes under stress conditions.
Phosphorylation site mutants as indicated were spotted onto YPD plates. Images were taken after 3 days under different stresses. Of the 53 phosphorylation site mutants, only some representative examples are shown here.
Figure 2 with 1 supplement

PKA and PP2C regulate Ids2-S148 phosphorylation.
(A–C, E) Strains were transformed with pRS426-Ids2-Myc13, and lysates were examined by Western blot analysis with the indicated antibodies. The numbers below are the means of the intensity ratios of Ids2-p148/Myc compared with that of WT treated with 2% glucose. (B) Overnight cells were refreshed in medium with different treatments for 3 hr. (D,F) In vitro kinase and phosphatase assays were conducted as described in the Methods section. (G) Cells were spotted in 10-fold dilutions on YEPD or YEPG plates and grown at 30 or 37°C.
Figure 2—figure supplement 1

Characterization of the phosphospecific antibodies against Ids2 S148.
(A) The mass spectrum of the phosphopeptide Ids2 S148 recorded in the linear mode. (B) Lysates of the Ids2-Myc13 strain from 2% and 0.5% glucose cultures were subjected to western blot analysis. The numbers below are the intensity ratios of Myc in 0.5% glucose compared with that in 2% glucose. (C) Peptide spotting showed the specificity of the phospho-Ids2-S148 antibodies. (D) The phosphorylation level of Ids2-S148 under different conditions. The WT strain was transformed with pRS426-Ids2-Myc13 (WT) or pRS426-Ids2-S148A-Myc13 (ids2-S148A). Overnight cultures of these strains were refreshed to OD600 = 0.3 in SC-Ura with 4%, 2%, 1%, 0.5%, 0.25%, and 0.125% glucose for 3 hr. For nitrogen starvation, the overnight culture was refreshed to OD600 = 0.3 in SC-Ura with 2% glucose for 3 hr and then transferred to SC medium lacking nitrogen (SD-N) with 2% glucose for 2 hr. Cell lysates were prepared for Western blot analysis. The numbers below are the intensity ratios of Ids2-p148/Myc compared with those of WT. (E) WT and deletion strains were transformed with pRS426-Ids2-Myc13. Cells were grown in SC medium with 2% glucose, and lysates were prepared for Western blot analysis. (F) In vitro PKA activity was assayed using bovine heart catalytic subunit C (Cb), and the PKA inhibitor PKI 6–22 was used as a negative control. GST-Ids2 and GST-Ids2-S148A served as substrates. Activities were detected by Western blot analysis using the phosphospecific antibody. The total amount of Ids2 protein was detected by a GST antibody.
Figure 3 with 2 supplements
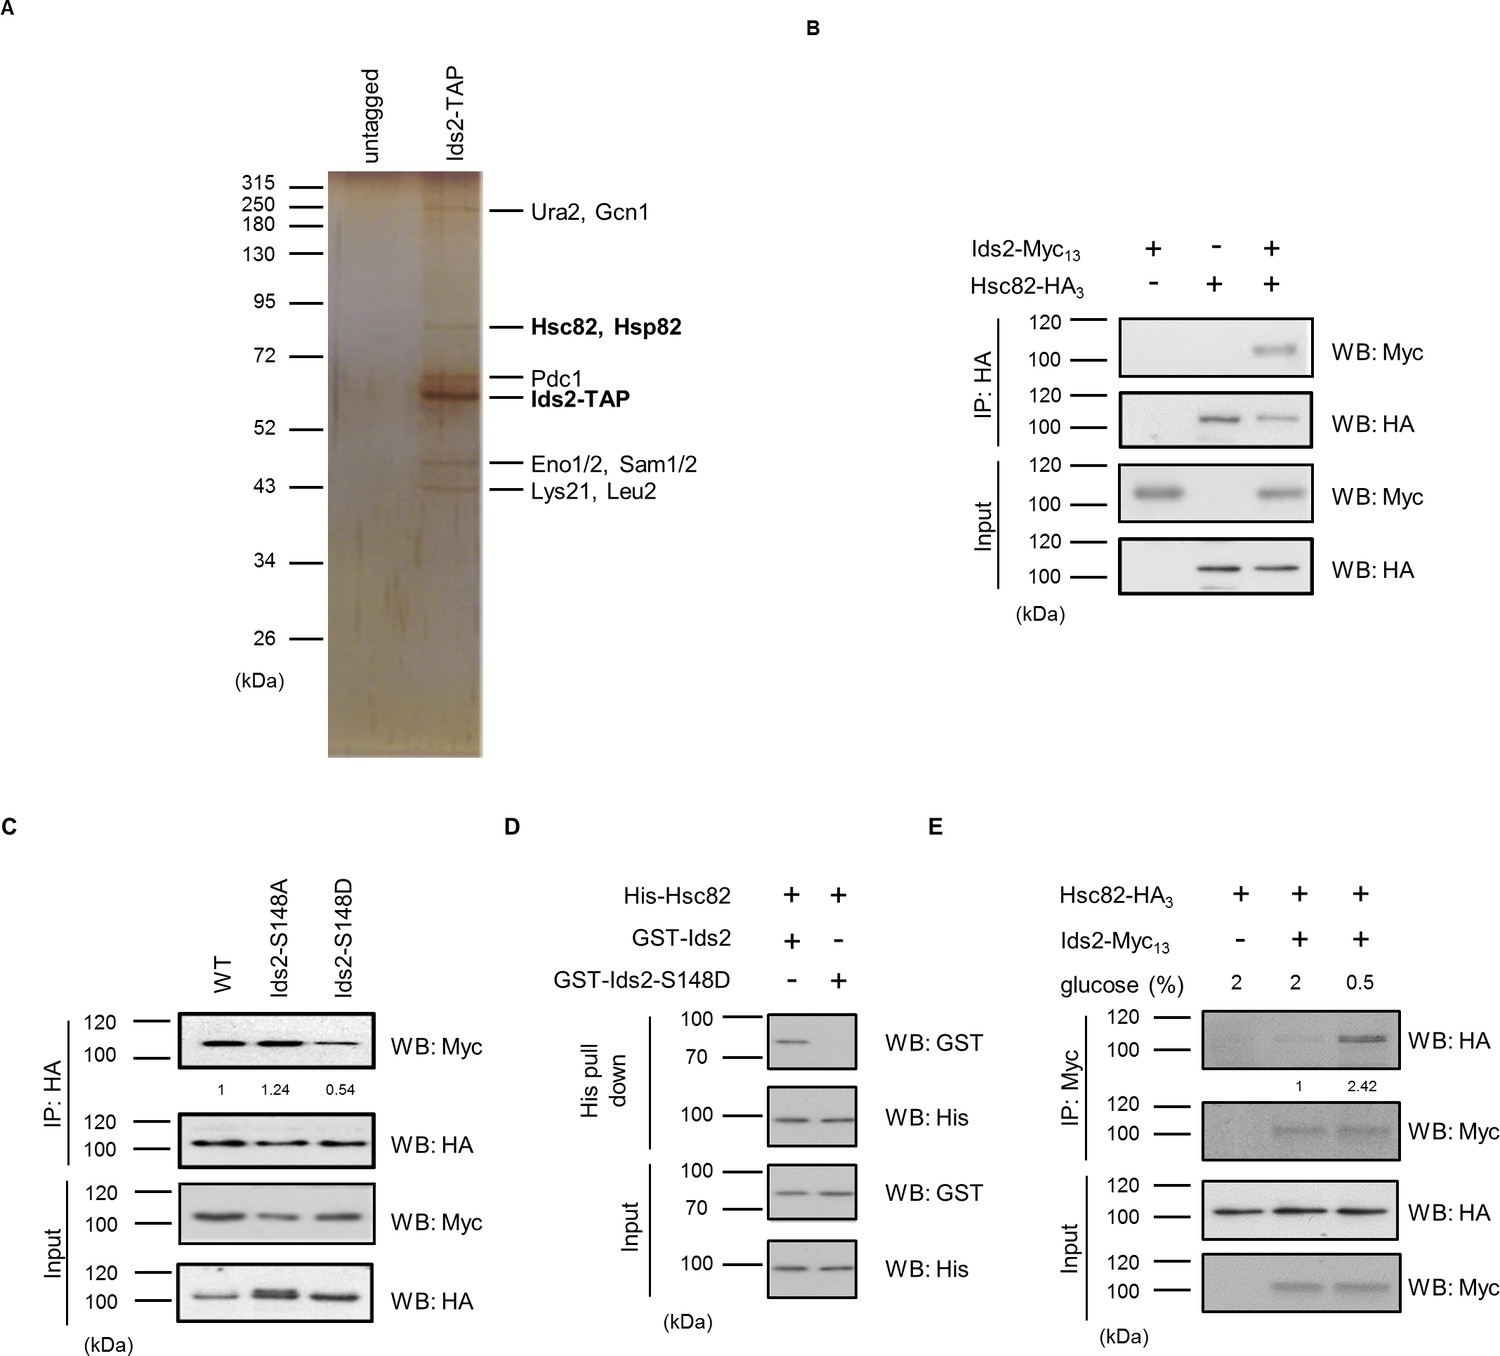
Ids2 interacts with HSP90 families.
(A) A silver-stained gel of the affinity-purified Ids2. Both HSP90 families, Hsc82 and Hsp82, were identified by LC-MS/MS analysis. (B) A co-immunoprecipitation assay was conducted using chromosomal-tagged Ids2-Myc13 and Hsc82-HA3. (C) Co-immunoprecipitation assay between Hsc82 and Ids2 mutants. The levels of signal compared with that of WT are shown below. (D) Purified recombinant GST-Ids2 and His6-Hsc82 proteins were subjected to a His-tagged Metal Affinity Purification assay. (E) Tagged strains were incubated in 2% (normal) or 0.5% (French et al., 2013) glucose. Ids2-Myc13 was used to co-immunoprecipitate Hsc82-HA3. The numbers below are the means of the intensity ratios of HA/Myc compared with that of WT.
-
Figure 3—source data 1
A list of peptides detected from Mass Spectrometry analysis of the Ids2-TAP co-purified proteins.
- https://doi.org/10.7554/eLife.39925.012
Figure 3—figure supplement 1
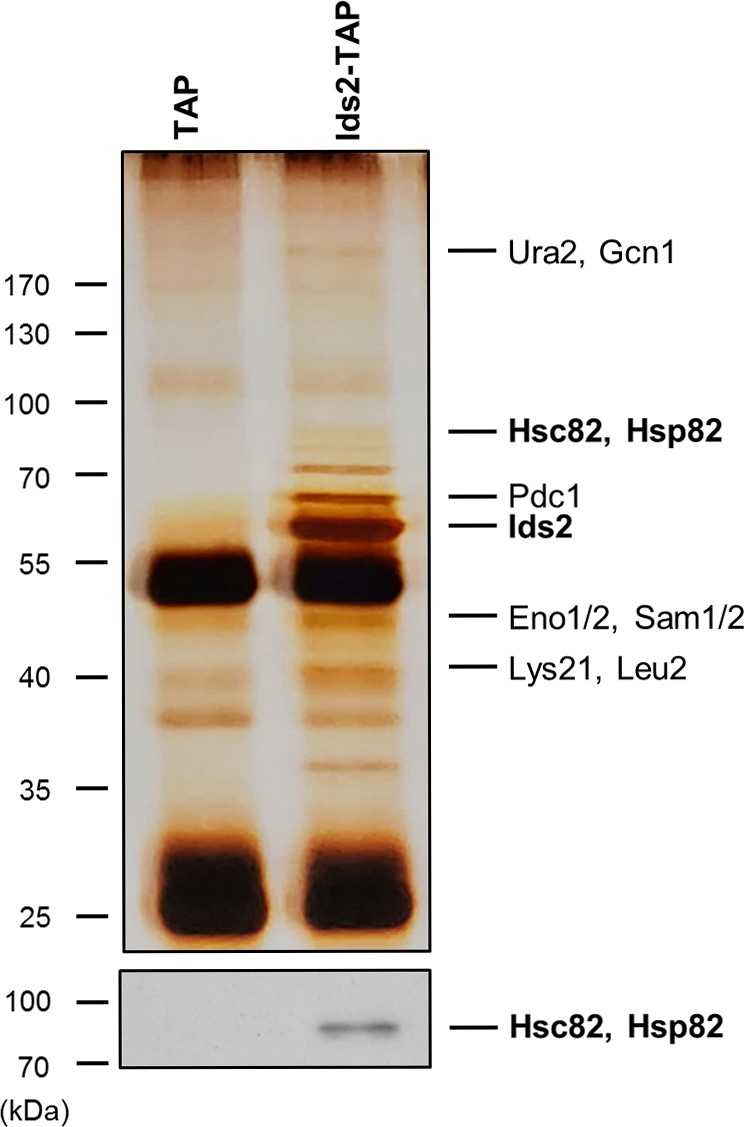
Ids2 formed a protein complex with HSP90.
A silver-stained gel of the affinity-purified Ids2. Cells expressing TAP tag alone were served as a control. The corresponding band of HSP90 was detected by western blot analysis using an HSP90 antibody.
Figure 3—figure supplement 2
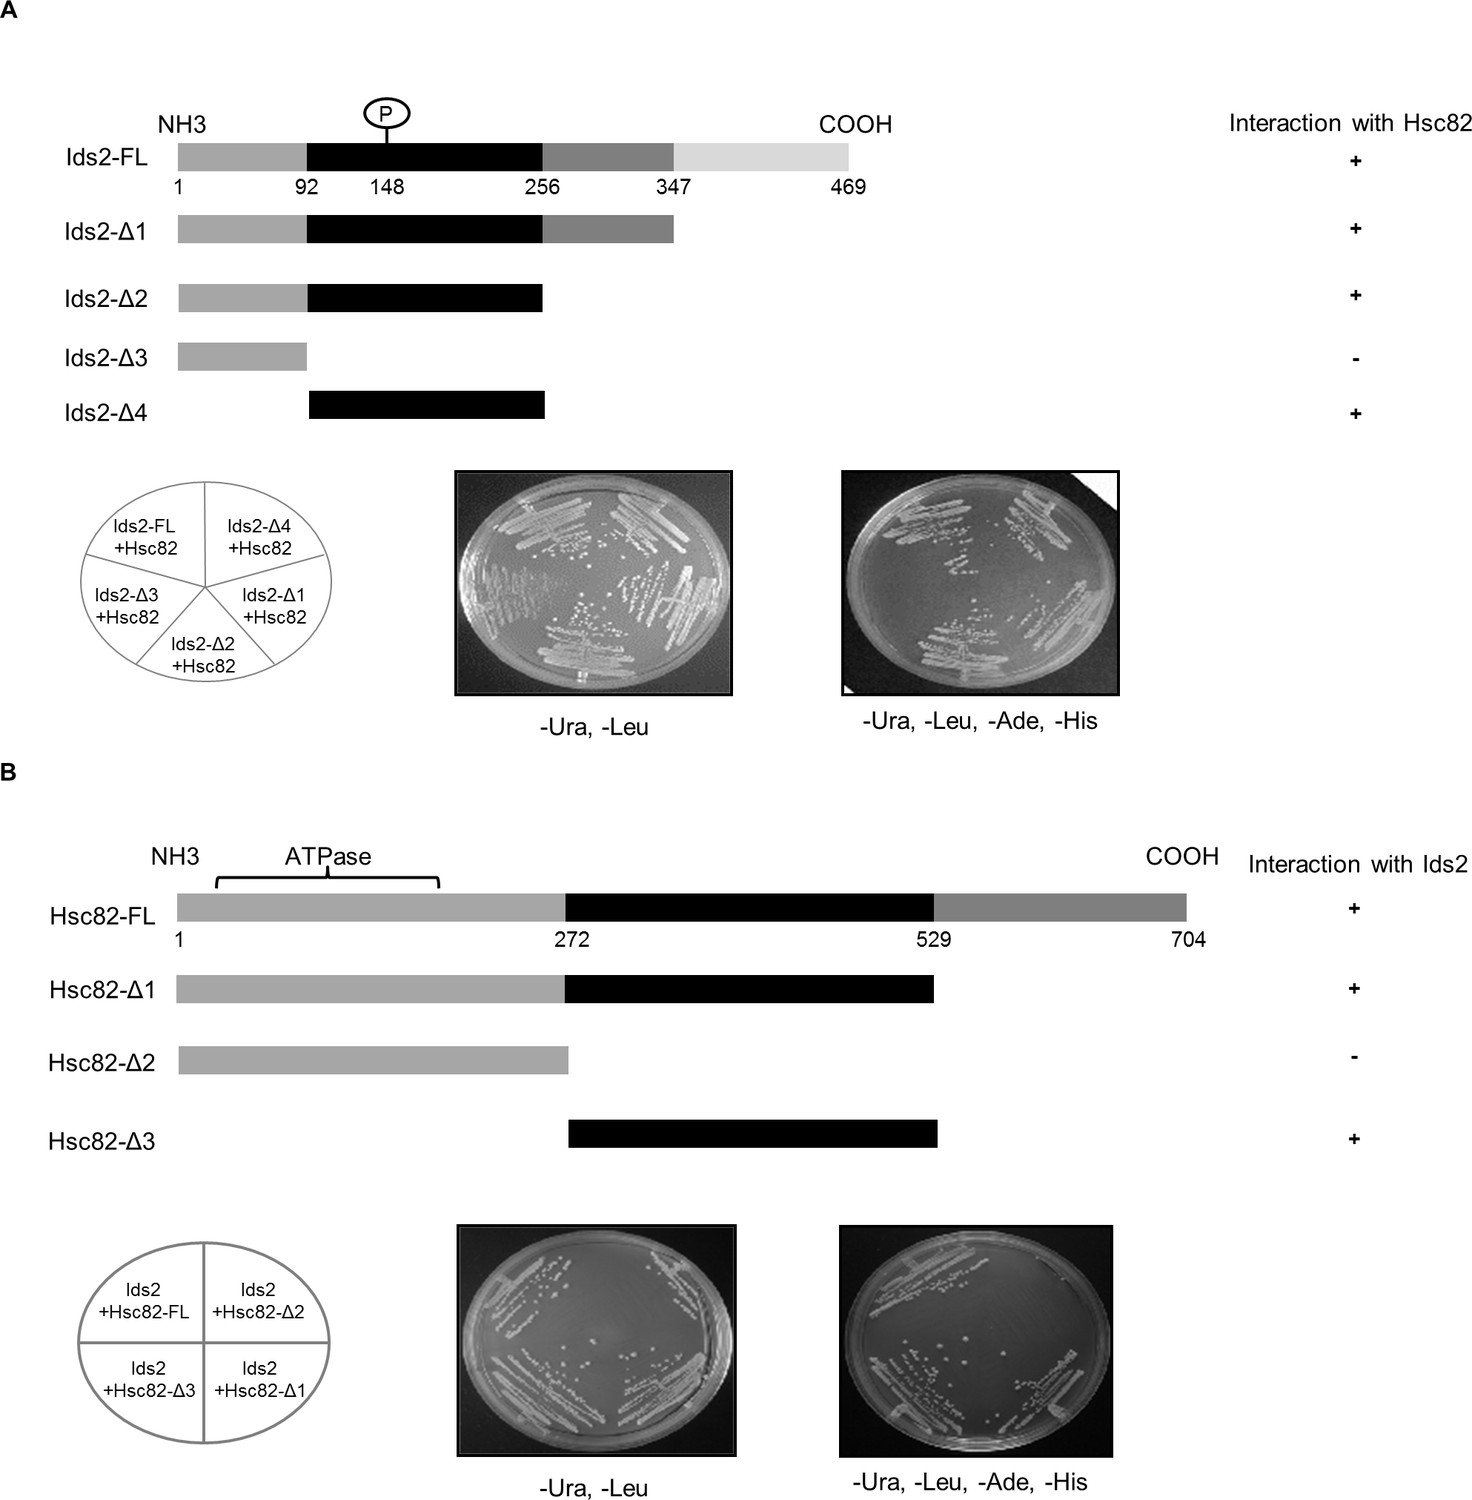
Mapping the interacting domains between Ids2 and Hsc82 by the yeast two-hybrid assay.
(A) The upper panel shows a schematic diagram of various pGBDU-Ids2 truncations. The two-hybrid assay was conducted using various truncated Ids2 proteins as the bait and full-length Hsc82 as the prey. Cells were restreaked onto SC-Leu-Ura-Ade-His glucose plates to investigate the bait-prey reciprocity. (B) The upper panel depicts a schematic diagram of various Hsc82 truncations. The assay was conducted as described in (A) to define the Ids2-Hsc82 interaction domain in Hsc82.
Figure 4 with 2 supplements
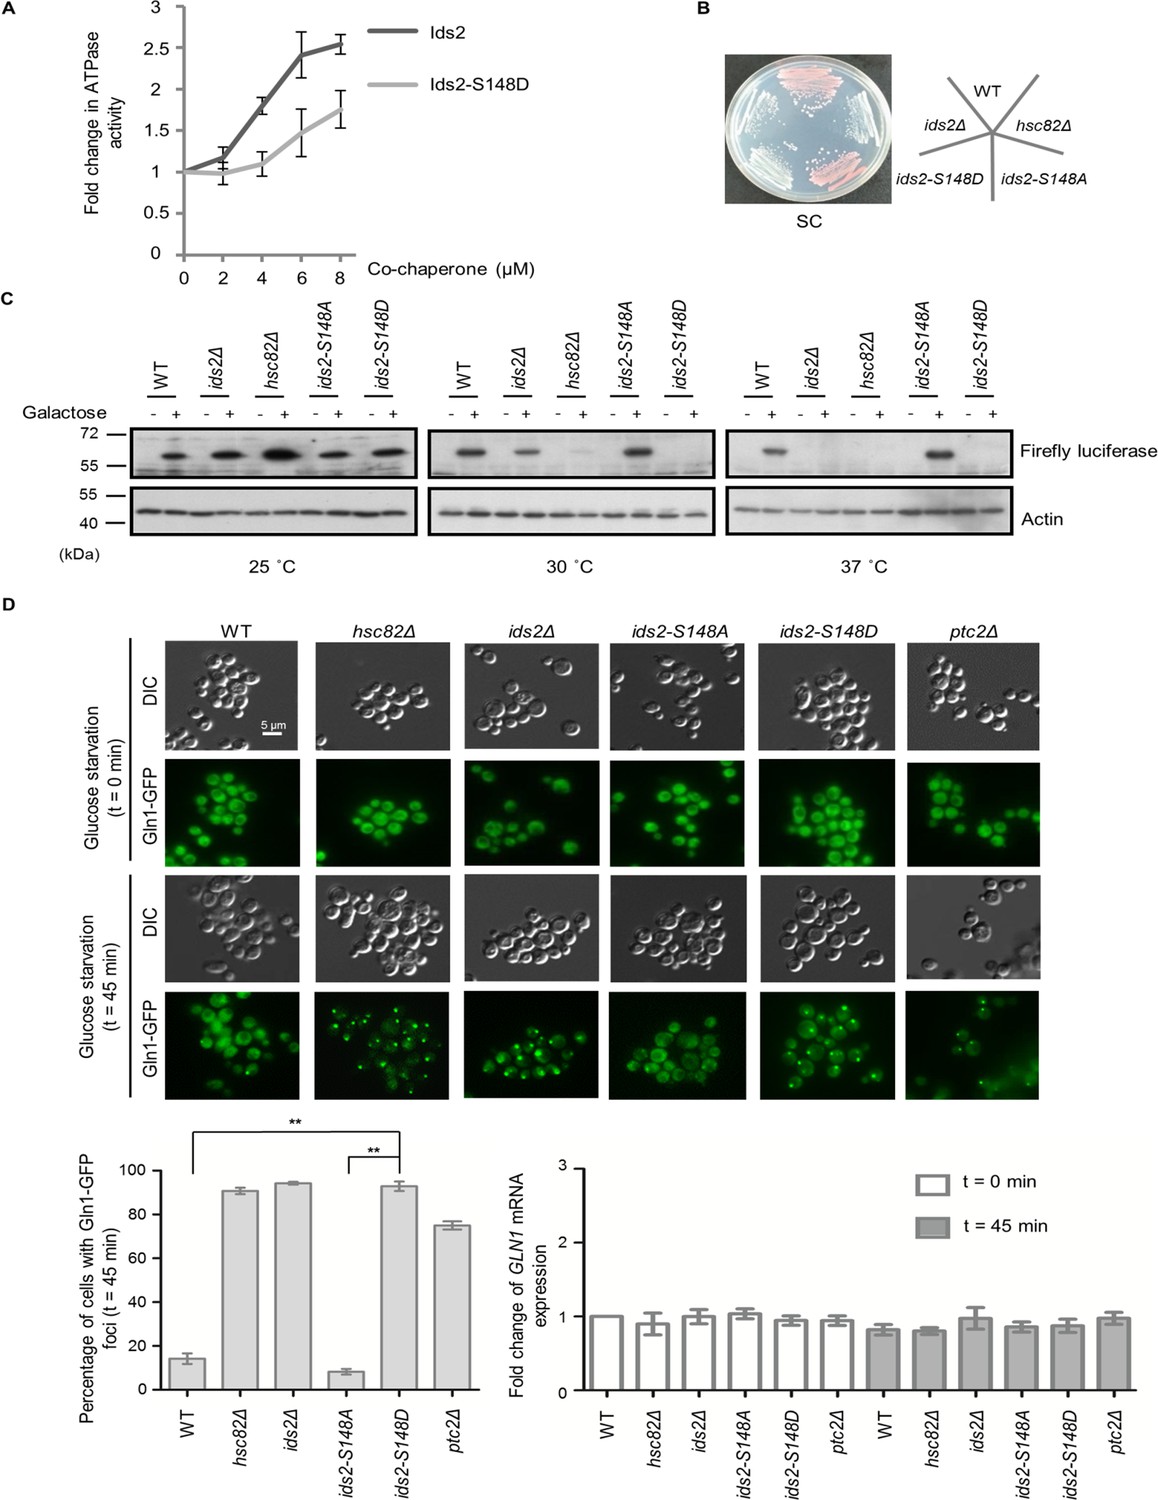
Ids2 participates in the HSP90-regulated protein-folding response.
(A) The purified Hsc82 was mixed with Ids2 or Ids2-S148D, and the ATPase reaction was incubated for 90 min at 37°C. Error bars represent the standard deviation (SD) calculated from three independent experiments. (B) Cells, as indicated, were streaked on SC glucose, and the plate image was captured after 3 days. (C) An in vivo chaperone assay was conducted using an exogenously expressed firefly luciferase, and Western blot analysis was performed. (D) Endogenously expressed Gln1-GFP in WT and mutant cells was measured after 45 min without glucose. At least 200 cells were counted for each strain (**, p < 0.01, Student’s t-test, two-tailed). The mRNA levels of GLN1 were determined by quantitative RT-PCR relative to the housekeeping gene, ACT1. Error bars represent SD for three biological replicates.
Figure 4—figure supplement 1
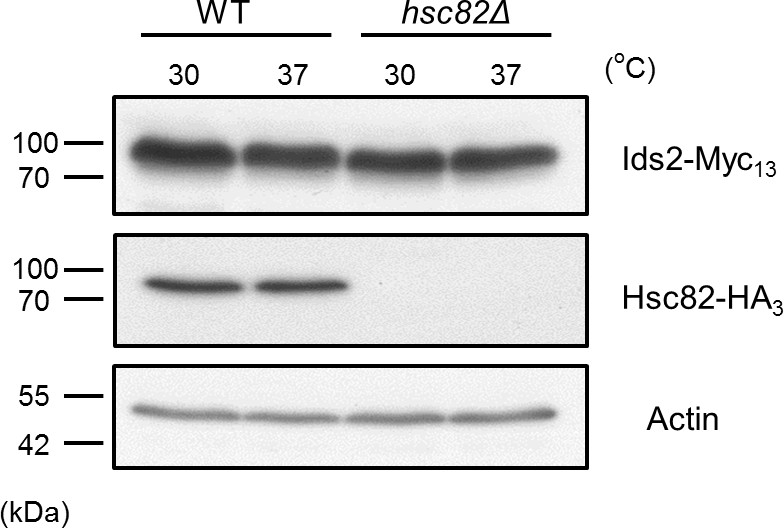
The effect of heat-shock stress or hsc82Δ on the protein levels of Ids2.
Chromosomally tagged Ids2-Myc13 and Hsc82-HA3 strains were cultured under normal (30°C) or heat-shock (37°C) conditions for 3 hr. Cell lysates were examined by Western blot analysis using Myc or HA antibodies. Actin served as a loading control.
Figure 4—figure supplement 2
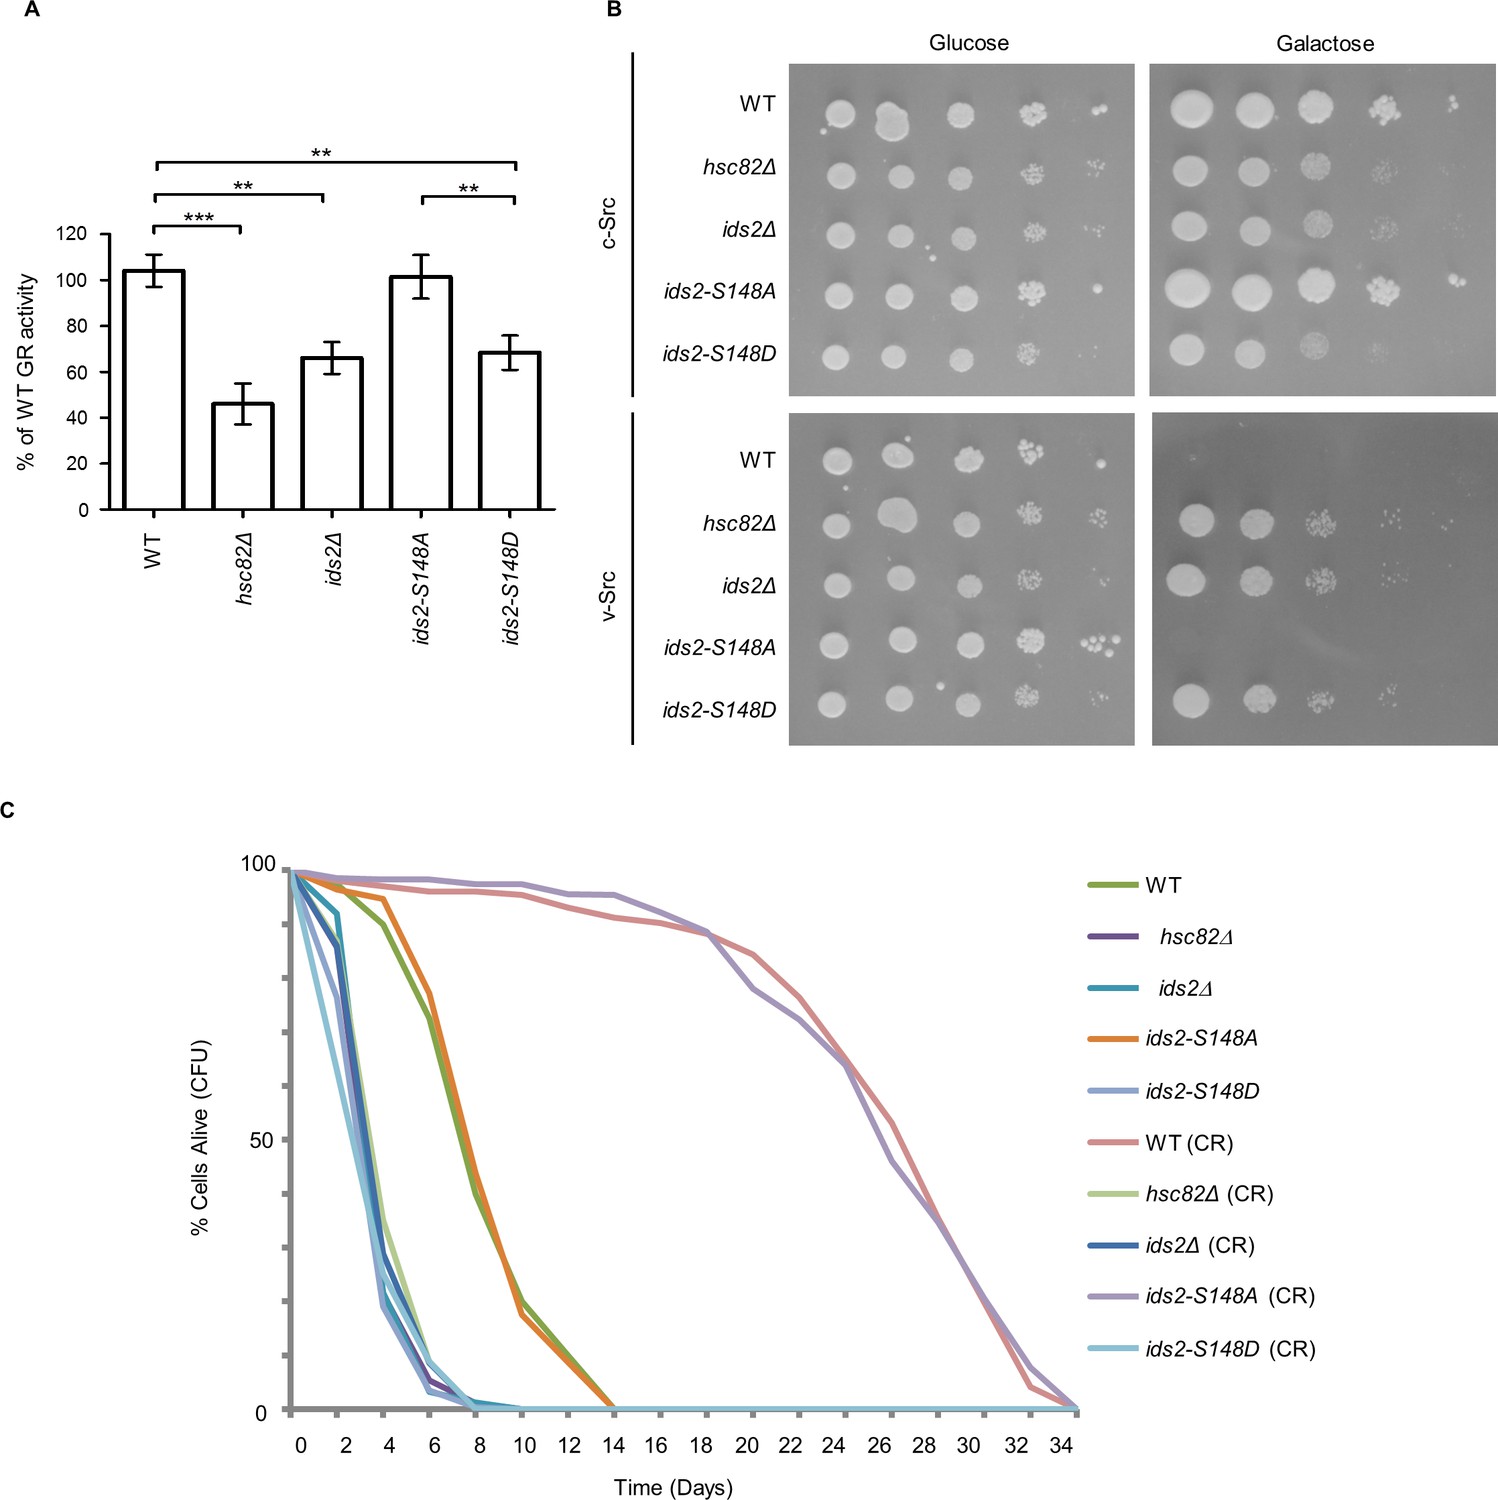
The influences of phosphomimetic Ids2 on the chaperone function of Hsc82 and CLS.
(A) For the GR maturation assay, cells were transformed with plasmids encoding the mammalian GR and the β-galactosidase reporter (Schena and Yamamoto, 1988). After the addition of synthetic hormone to cultures for five hours, β-galactosidase activity was quantified. Results are mean ±SD of three experiments (**, p < 0.01; ***, p < 0.001; one-way ANOVA) (B) Cells containing v-Src or c-Src controlled by a GAL promoter were grown on plates with glucose or galactose. (C) CLS of indicated strains were performed in medium containing 2% glucose or 0.5% glucose (CR). Quantitative CLS assay was assessed by colony-forming capacity on YEPD plates.
Figure 5 with 1 supplement
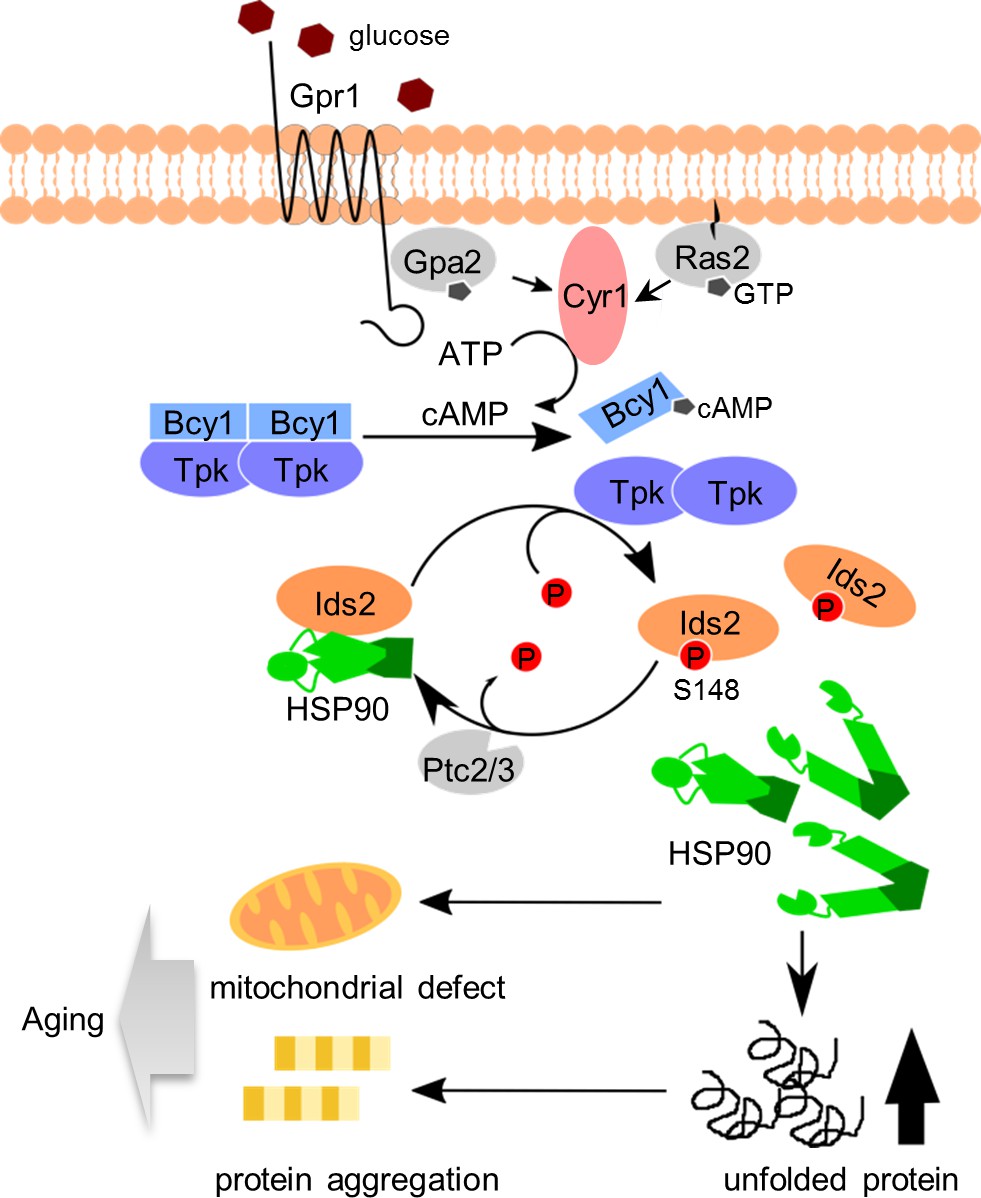
A proposed model to describe how glucose intake down-regulates chaperone activity and leads to aging.
After glucose ingestion, cells convert ATP to cAMP to activate the PKA pathway. Activated PKA phosphorylates co-chaperone Ids2 to dissociate it from the HSP90 chaperone and reduce chaperone function, eventually leading to protein unfolding, mitochondrial dysfunction, and protein aggregation. However, under CR, dephosphorylated Ids2 might be essential for the full function of HSP90 to extend lifespan.
Figure 5—figure supplement 1
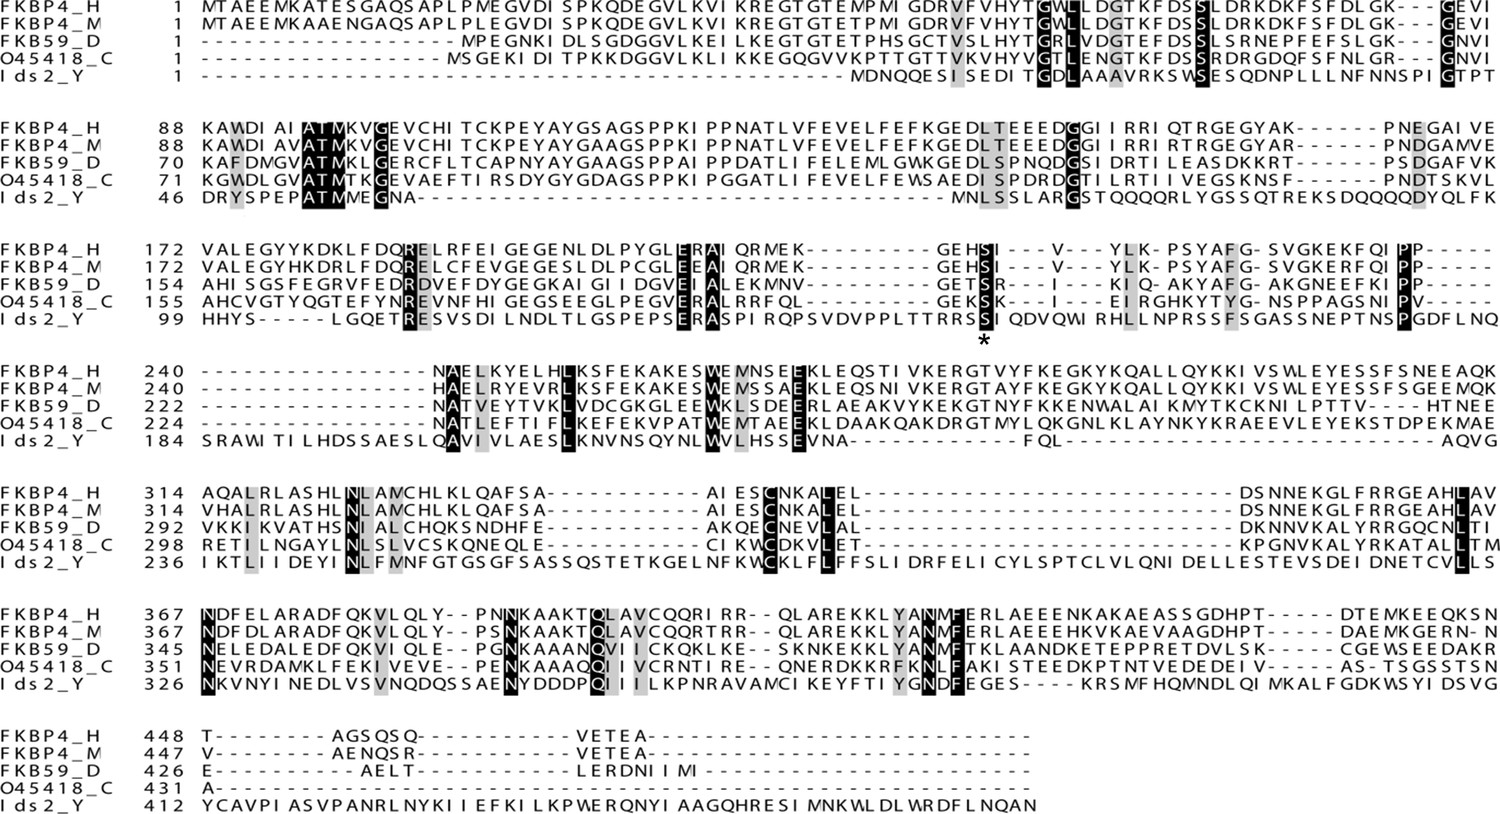
An alignment of Ids2 and its homologs.
Multiple sequence alignment was performed between Ids2 and its predicted homologues by Clustal Omega program (Sievers and Higgins, 2014). S148 of Ids2 is marked with an asterisk. H, Homo sapiens; M, Mus musculus; D, Drosophila melanogaster; C, Caenorhabditis elegans: Y, Saccharomyces cerevisiae.
Tables
Key resources table
| Reagent type (species) or resource | Designation | Source or reference | Identifiers | Additional information |
|---|---|---|---|---|
| Antibody | anti-Myc (mouse monoclonal) | Roche | 11667149001; RRID: AB_390912 | (1:2000) |
| Antibody | anti-HA (12CA5) (mouse monoclonal) | Roche | 11583816001; RRID: AB_514506 | (1:5000) |
| Antibody | anti-ACTIN (rabbit polyclonal) | Sigma-Aldrich | A2066; RRID:AB_476693 | (1:2000) |
| Antibody | anti-Hsp90 (rabbit polyclonal) | PMID: 23434373 | (1:10000) | |
| Antibody | anti-GST (rabbit polyclonal) | GeneTex | GTX110736; RRID: AB_1949427 | (1:2000) |
| Antibody | anti-Pgk1 (mouse monoclonal) | Invitrogen | 459250 | (1:5000) |
| Antibody | anti-(P) S148-Ids2 (rabbit purified polyclonal antibody) | This paper | (1:1000) | |
| Antibody | anti-Firefly Luciferase | GeneTex | GTX125849; RRID: AB_11173184 | (1:5000) |
| Commercial assay or kit | EnzChek phosphate assay kit | Thermo Fisher Scientific | E6646 | |
| Commercial assay or kit | KAPA SYBR FAST qPCR Master Mix Kit | Sigma- Aldrich | KK4600 | |
| Other | Calmodulin Sepharose 4B | GE Healthcare | 17-0529-01 | Affinity resin |
| Other | TALON Superflow | GE Healthcare | 28-9574-99 | Affinity resin |
| Other | IgG Sepharose 6 Fast Flow | Amersham Pharmacia Biotech AB | 17-0969-01 | Affinity resin |
| Other | Glutathione Sepharose 4 Fast Flow | GE Healthcare | 17-5132-01 | Affinity resin |
| Chemical compound, drug | Deoxycorticosterone acetate | Sigma- Aldrich | D7000 | |
| Chemical compound, drug | Protease inhibitor cocktail tablets | Roche | 4693132001 | |
| Chemical compound, drug | PKA, catalytic subunit, bovine heart | Millipore | 539576 | |
| Software | Image J | RRID: SCR_003070 | Image analysis | |
| Software | GraphPad Prism5 | RRID: SCR_002798 | Statistical analysis and graph representation |
Additional files
-
Supplementary file 1
Yeast strains, plasmids, and primer sets used in this study.
- https://doi.org/10.7554/eLife.39925.018
-
Transparent reporting form
- https://doi.org/10.7554/eLife.39925.019
Download links
A two-part list of links to download the article, or parts of the article, in various formats.
Downloads (link to download the article as PDF)
Open citations (links to open the citations from this article in various online reference manager services)
Cite this article (links to download the citations from this article in formats compatible with various reference manager tools)
Glucose intake hampers PKA-regulated HSP90 chaperone activity
eLife 7:e39925.
https://doi.org/10.7554/eLife.39925


