The microtubule polymerase Stu2 promotes oligomerization of the γ-TuSC for cytoplasmic microtubule nucleation
- DKFZ-ZMBH Allianz, Germany
Figures
Figure 1
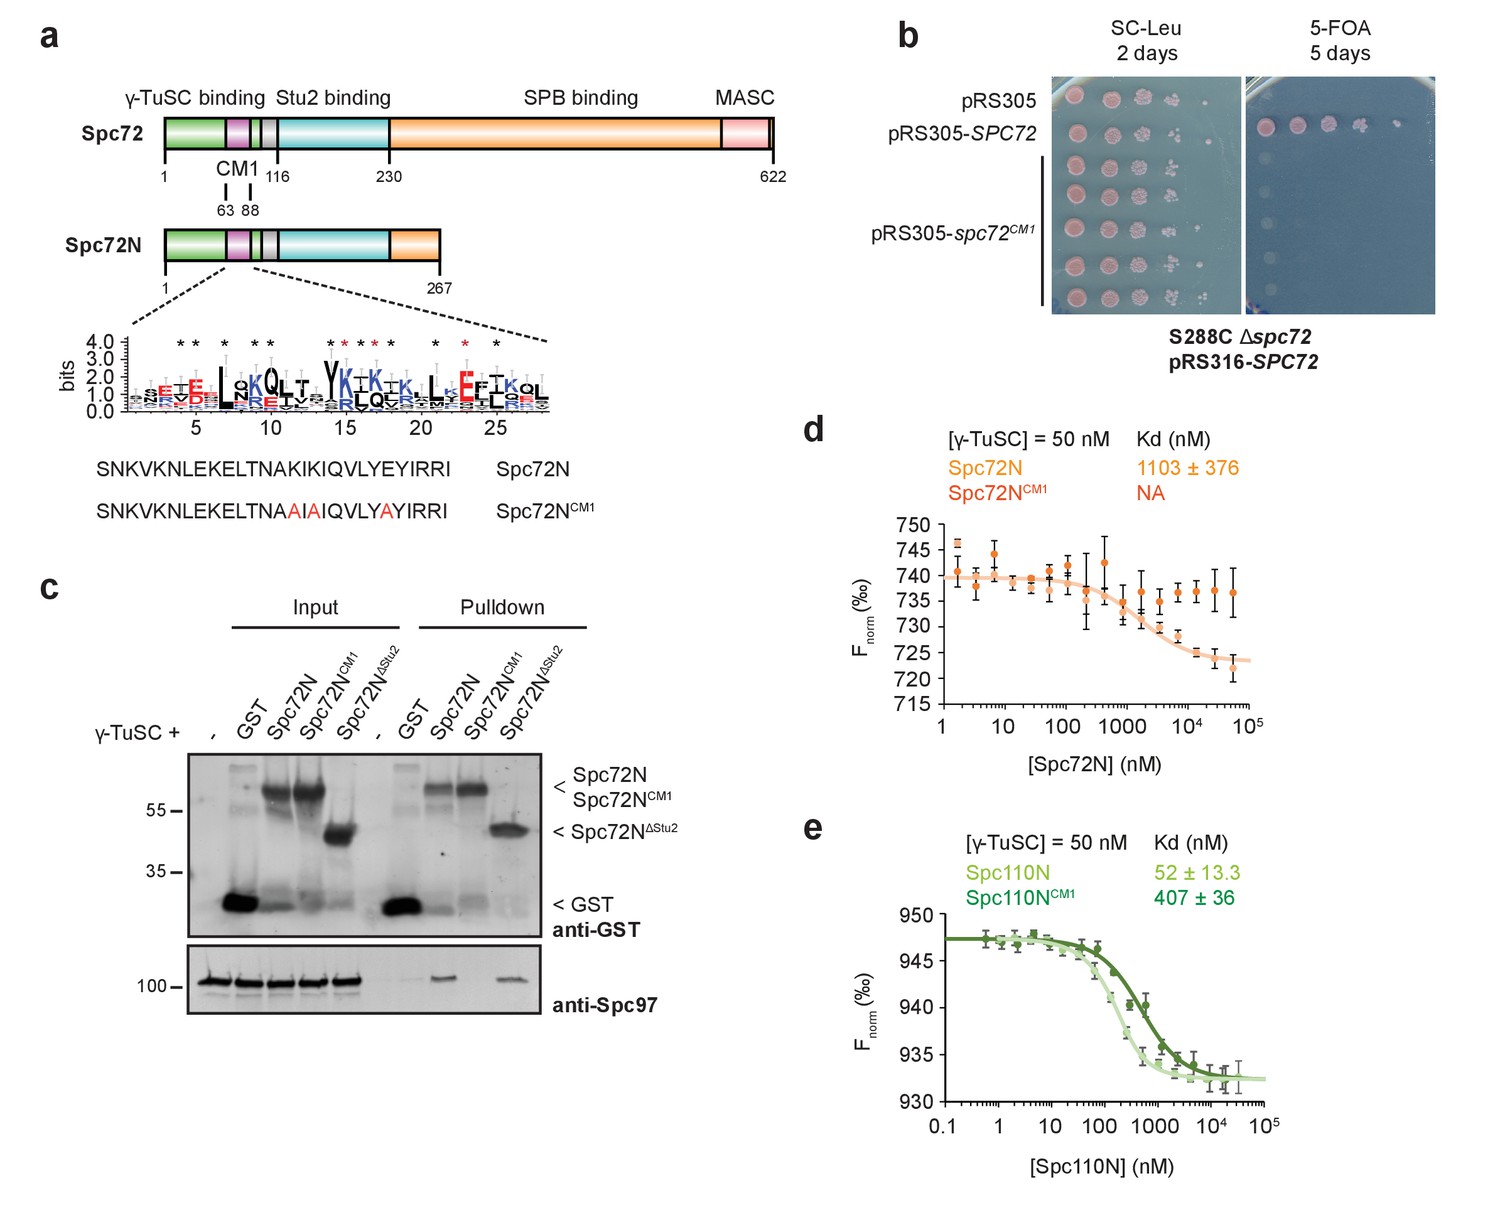
Binding of Spc72 to γ-TuSC.
(a) Substructure of Spc72. An enlargement of the putative CM1-domain of Spc72 is shown (designed with WebLogo 3.5.0; taken from [Lin et al., 2014]). Mutations in Spc72NCM1 are highlighted in red. Abbreviations: CM1, Centrosomin Motif 1; MASC, Mto1 and Spc72p C terminus. (b) Mutations in the CM1 of SPC72 affect the viability of yeast cells. Cells were spotted as 10-fold serial dilutions. (c) In a pulldown experiment, purified Spc72NCM1 failed to bind to γ-TuSC while GST-Spc72N∆Stu2 showed binding. Immunoblots that were developed with anti-GST and Spc97 antibodies are shown. (d) Microscale thermophoresis (MST) measurements of Spc72N and Spc72NCM1 binding to γ-TuSC. Mean ± SD, n = 6; NA, not applicable. (e) MST measurements of the binding of Spc110N and Spc110NCM1 to γ-TuSC. Mean ± SD, n = 3.
Figure 2 with 2 supplements
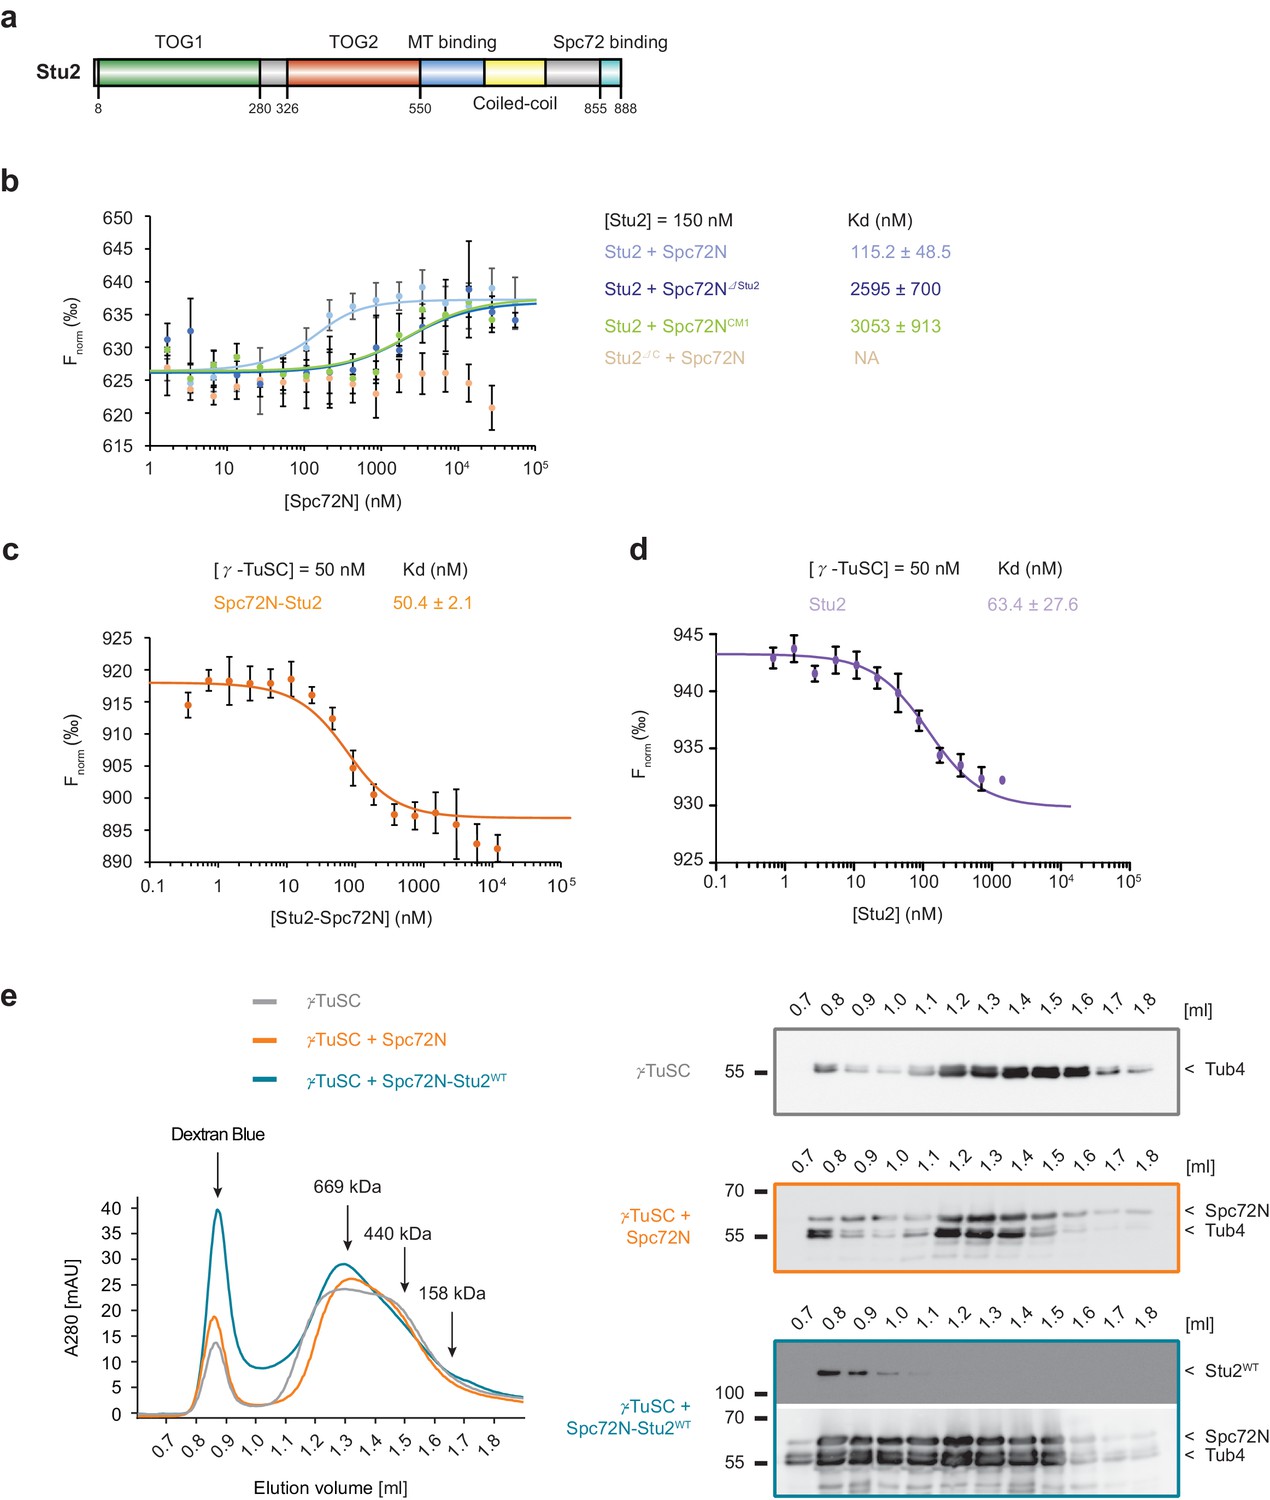
High-affinity binding of the Spc72N–Stu2 complex to γ-TuSC.
(a) Scheme of the Stu2 substructure. Abbreviation: TOG, Tumor Overexpressed Gene. (b) MST measurements of Spc72N binding to Stu2. Mean ± SD, for Stu2 and Spc72ΔStu2, n = 2; all others, n = 3; NA, not applicable. (c) High-affinity binding of Spc72N–Stu2 complexes to γ-TuSC as measured by MST. Mean ± SD, n = 3. (d) High-affinity binding of Stu2 to γ-TuSC as measured by MST. Mean ± SD, n = 3. Note, that the MST assay contained 0.05% Tween-20 to prevent precipitation of Stu2–γ-TuSC. (e) Spc72N–Stu2 induced oligomerization of γ-TuSC. The preassembled Spc72N–Stu2 complex shifted γ-TuSC to earlier elution fractions. The gel filtration profiles are shown relative to marker proteins (of 669, 440, 158 kDa). Dextran blue marks the void fraction of the chromatography column. Sample fractions were analysed by immunoblotting with the indicated antibodies (right). One representative example of three independent experiments is shown.
Figure 2—figure supplement 1
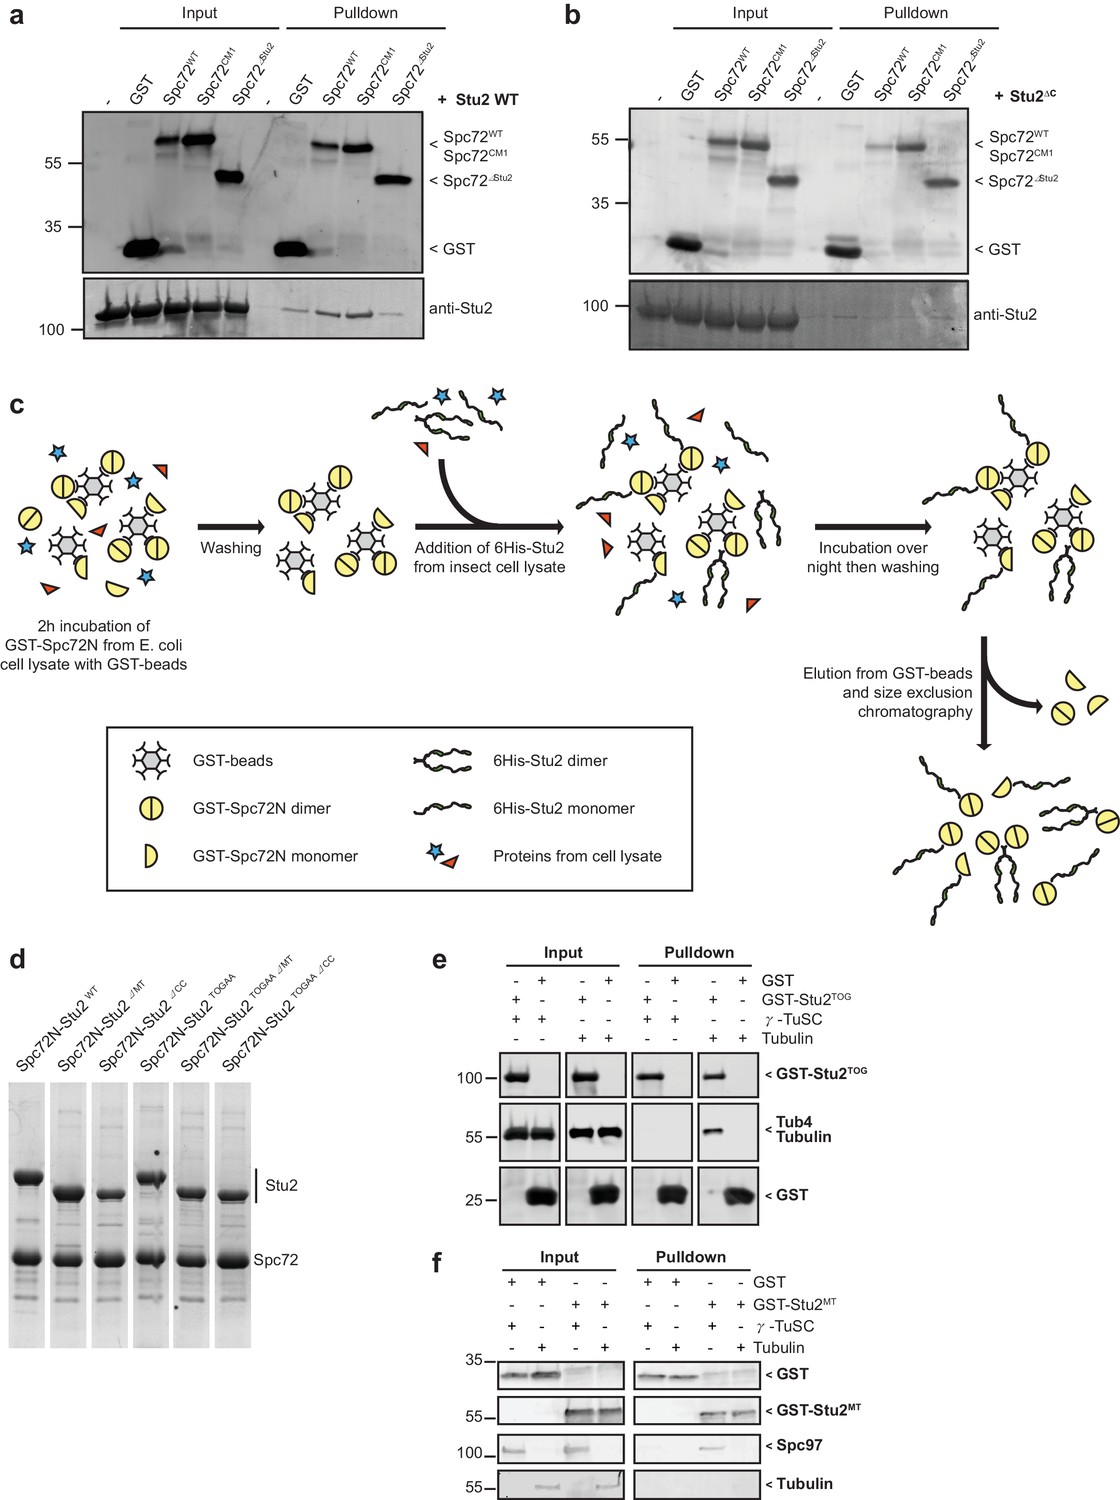
Spc72N but not Spc72N∆Stu2 interacts with full-length Stu2.
(a) In pulldown experiments, recombinant 6His-Stu2 interacts with GST-Spc72N and GST-Spc72NCM1 but not with GST-Spc72NΔStu2. The immunoblot was developed with antibodies against Stu2 and GST. (b) Recombinant 6His-Stu2ΔC does not interact with GST-Spc72N. The immunoblot was developed with antibodies against Stu2 and GST. (c) Scheme for the purification of recombinant Spc72N–Stu2 complexes. Only proteins that interacted with Spc72N were purified. (d) Indicated proteins were co-purified as outlined in (c) and analysed by SDS-PAGE and Coomassie Blue staining. (e) α/β-Tubulin but not γ-TuSC binds to the TOG domains of Stu2 (Stu2TOG). Binding of purified α/β-tubulin or of γ-TuSC to GST or GST-Stu2TOG was analysed by immunoblotting. (f) Binding of γ-TuSC to the MT-binding domain of Stu2. Recombinant GST and GST-Stu2MT (aa 451–684 of Stu2) were incubated with γ-TuSC and α/β-tubulin. After washes, proteins bound to glutathione beads were eluted and analysed by immunoblotting with the indicated antibodies.
Figure 2—figure supplement 2
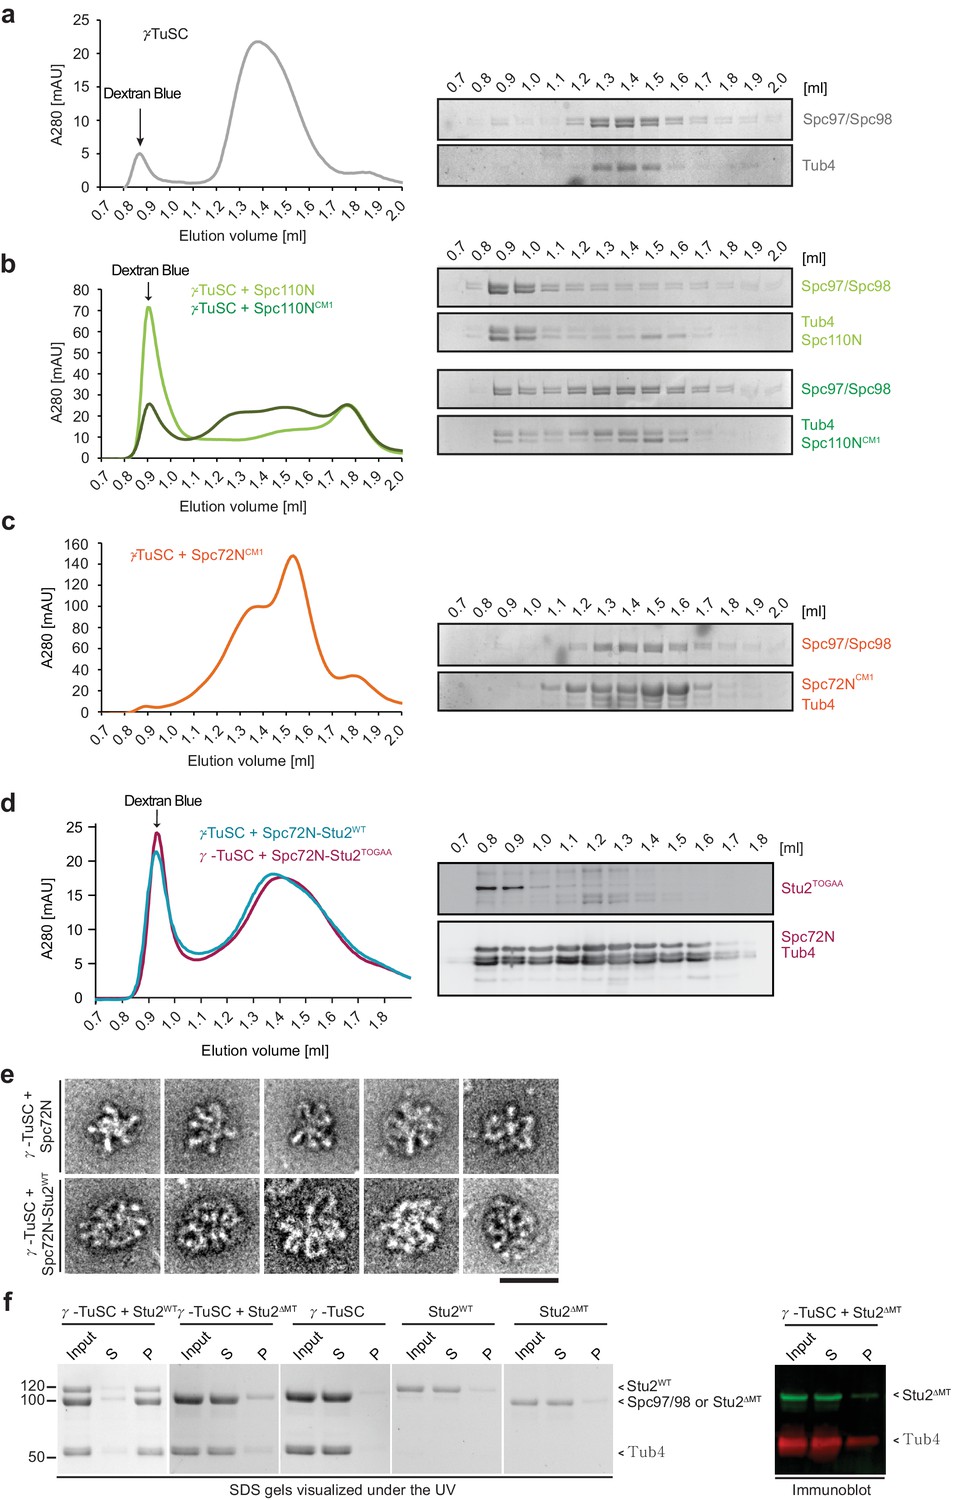
γ-TuSC oligomerisation.
(a) Gel filtration behaviour of γ-TuSC in HB100-50 buffer. Sample fractions were analysed by SDS-PAGE (right). (b) Spc110N but not Spc110NCM1 induces strong oligomerization of γ-TuSC in HB100-50 buffer. Sample fractions were analysed by SDS-PAGE (right). (c) Spc72NCM1 does not shift γ-TuSC in gel filtration in HB100-50 buffer. Sample fractions were analysed by SDS-PAGE (right). (d) The Spc72N–Stu2TOGAA complex shifts purified γ-TuSC to the void volume. Gel filtration profiles of γ-TuSC incubated with Spc72N–Stu2WT (from Figure 2e) and γ-TuSC incubated with Spc72N–Stu2TOGAA. On the left is an immunoblot of the gel filtration fractions of the γ-TuSC/Spc72N-Stu2TOGAA run. (e) Void volume samples from Figure 2e were analysed by negative staining EM. Five representative examples are shown for each condition. Scale bar: 50 nm. (f) Stu2 assembles with γ-TuSC into larger oligomers. Indicated recombinant proteins were incubated in HB100 for 40 min on ice. Samples were then spun for 10 min at 20,000 g. Input, supernatant (S) and pellet (P) were analysed by Coomassie Blue staining. Stu2∆MT migrates on SDS-PAGE as Spc97/Spc98. The immunoblot on the right shows the behaviour of Stu2∆MT in the γ-TuSC + Stu2∆MT experiment.
Figure 3 with 1 supplement

The purified Spc72N–Stu2 complex assembles MT asters.
(a) In vitro MT assembly by purified Spc72N, Stu2 and the Spc72N–Stu2 complex. Representative images are maximum projections. Scale bar: 10 μm. (b) Quantification of aster numbers from (a and d) from 20 acquired regions per condition and a minimum of three independent experiments. Purple dots represent individual values. Values were corrected by the amount of nucleated MTs in the tubulin-only control. Mean ± SD; **p=0.0023, ****p<0.0001; ns, not significant. (c) Stu2-domain organization and mutant Stu2 proteins affecting the TOG1/2 domains (Stu2TOGAA), the MT binding site (Stu2ΔMT), the coiled-coil region (Stu2ΔCC) and the C-terminus (Stu2∆C). (d) In vitro MT assembly by purified Spc72N–Stu2TOGAA, Spc72N–Stu2∆MT and Spc72N–Stu2∆CC complexes. Representative images are maximum projections. Scale bar: 10 μm. (e) Enlargement of representative MT asters from (a and d). Scale bar: 10 μm. (f) Aster density of the indicated complexes was analysed by quantifying the aster intensity from 20 fields of view.
Figure 3—figure supplement 1

MT aster-forming activity of Stu2 mutant proteins.
(a) MT aster-forming ability of purified proteins. The activity was measured as described in Figure 3a. (b) Quantification of the MT nucleation activity shown in (a). (c) Number of MT asters in the samples from (a). (b, c) See Figures 3b and 4b for details. (d, e) TOG domain mutations in Stu2 fail to bind tubulin. (d) Tubulin, 6His-Stu2WT and 6His-Stu2TOGAA were analysed by size exclusion chromatography. Immunoblot and chromatography curves show that Stu2WT binds to tubulin but not to Stu2TOGAA. (e) Tubulin interacts with recombinant 6His-Stu2WT but not with 6His-Stu2TOGAA. The signal intensities from six independent experiments were measured and normalized to the lane containing Stu2WT (see bar graphs of the Stu2WT lane marked with a star). (f) Growth test of the STU2 shuffle strain with the indicated CEN-based plasmids on SC-Leu and 5-FOA plates at different temperatures. Cells were spotted as 10-fold serial dilutions.
Figure 4
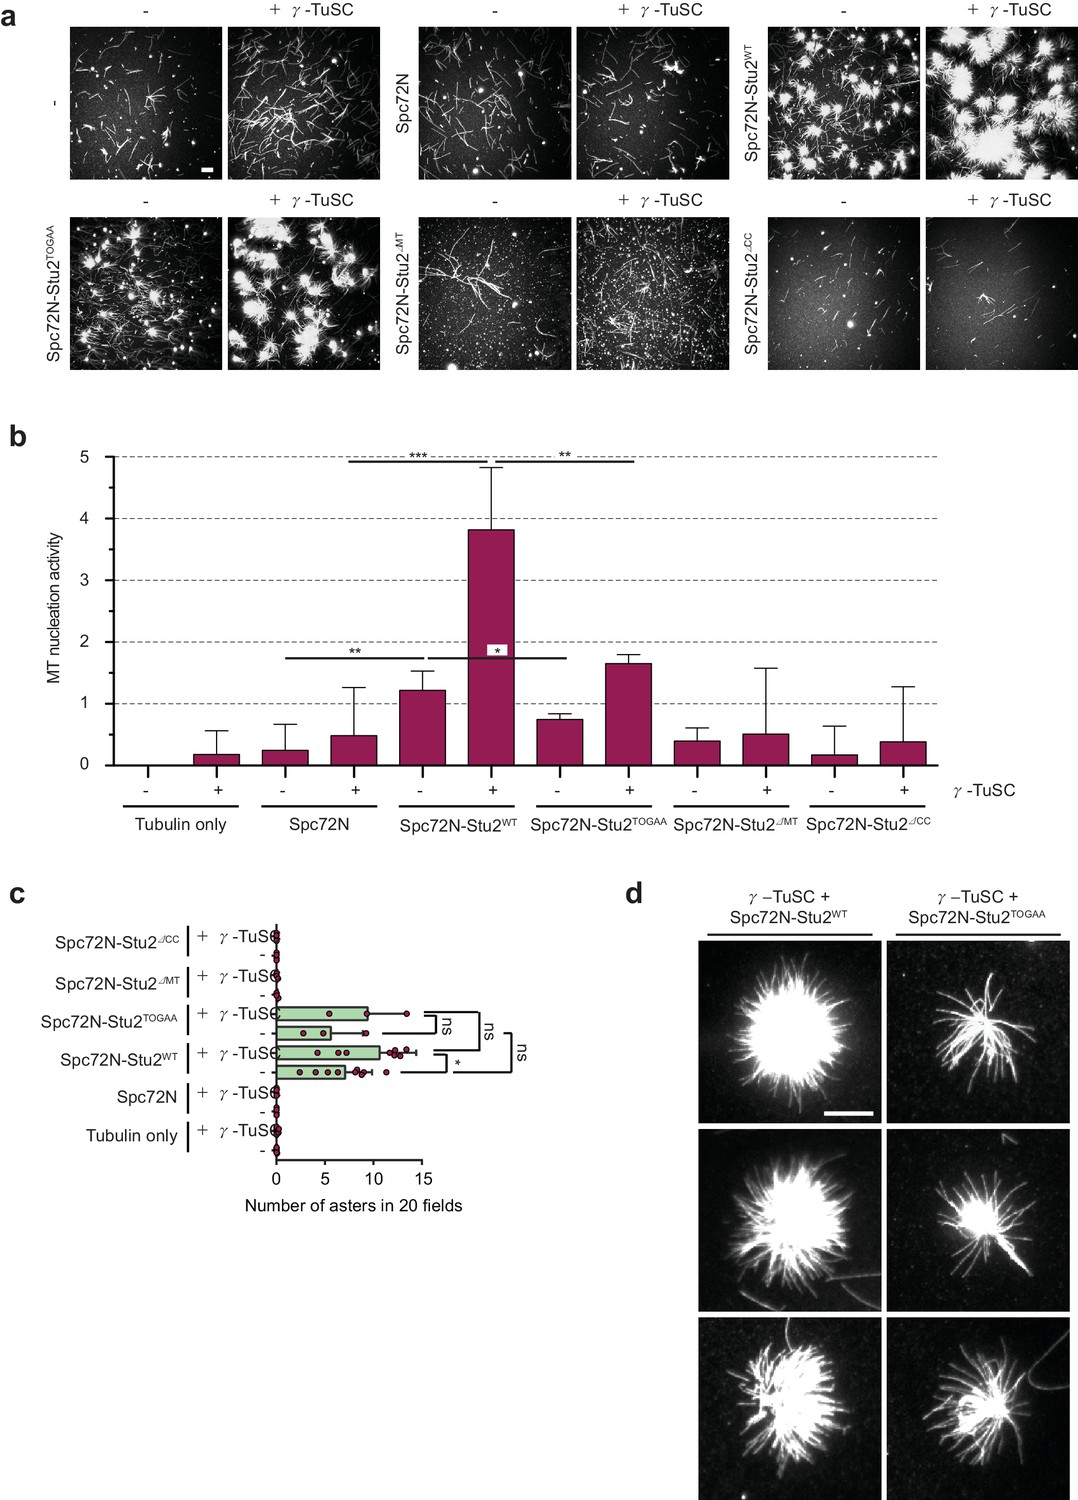
The γ-TuSC together with Spc72N–Stu2 increases aster intensity and number.
(a) In vitro MT assembly reactions as in Figure 3 with the indicated purified proteins. Representative images are maximum projections. Scale bar: 10 μm. (b) Quantification of MT nucleation activity illustrated in (a) as described in the 'Materials and methods'. The tubulin-only background was subtracted from all samples. Three independent experiments; mean ± SD; *p≤0.03, **p=0.01, ****p<0.001. (c) Quantification of the aster number of samples illustrated in (a) from 20 acquired regions per condition in each experiment and a minimum of three experiments. Values were corrected by the number of nucleated MTs in the tubulin-only control. Mean ± SD, purple dots represent the values of individual experiments; *p≤0.0367; ns, not significant. (d) Enlargement of representative MT asters from the samples illustrated in (a). Scale bar: 10 μm.
Figure 5
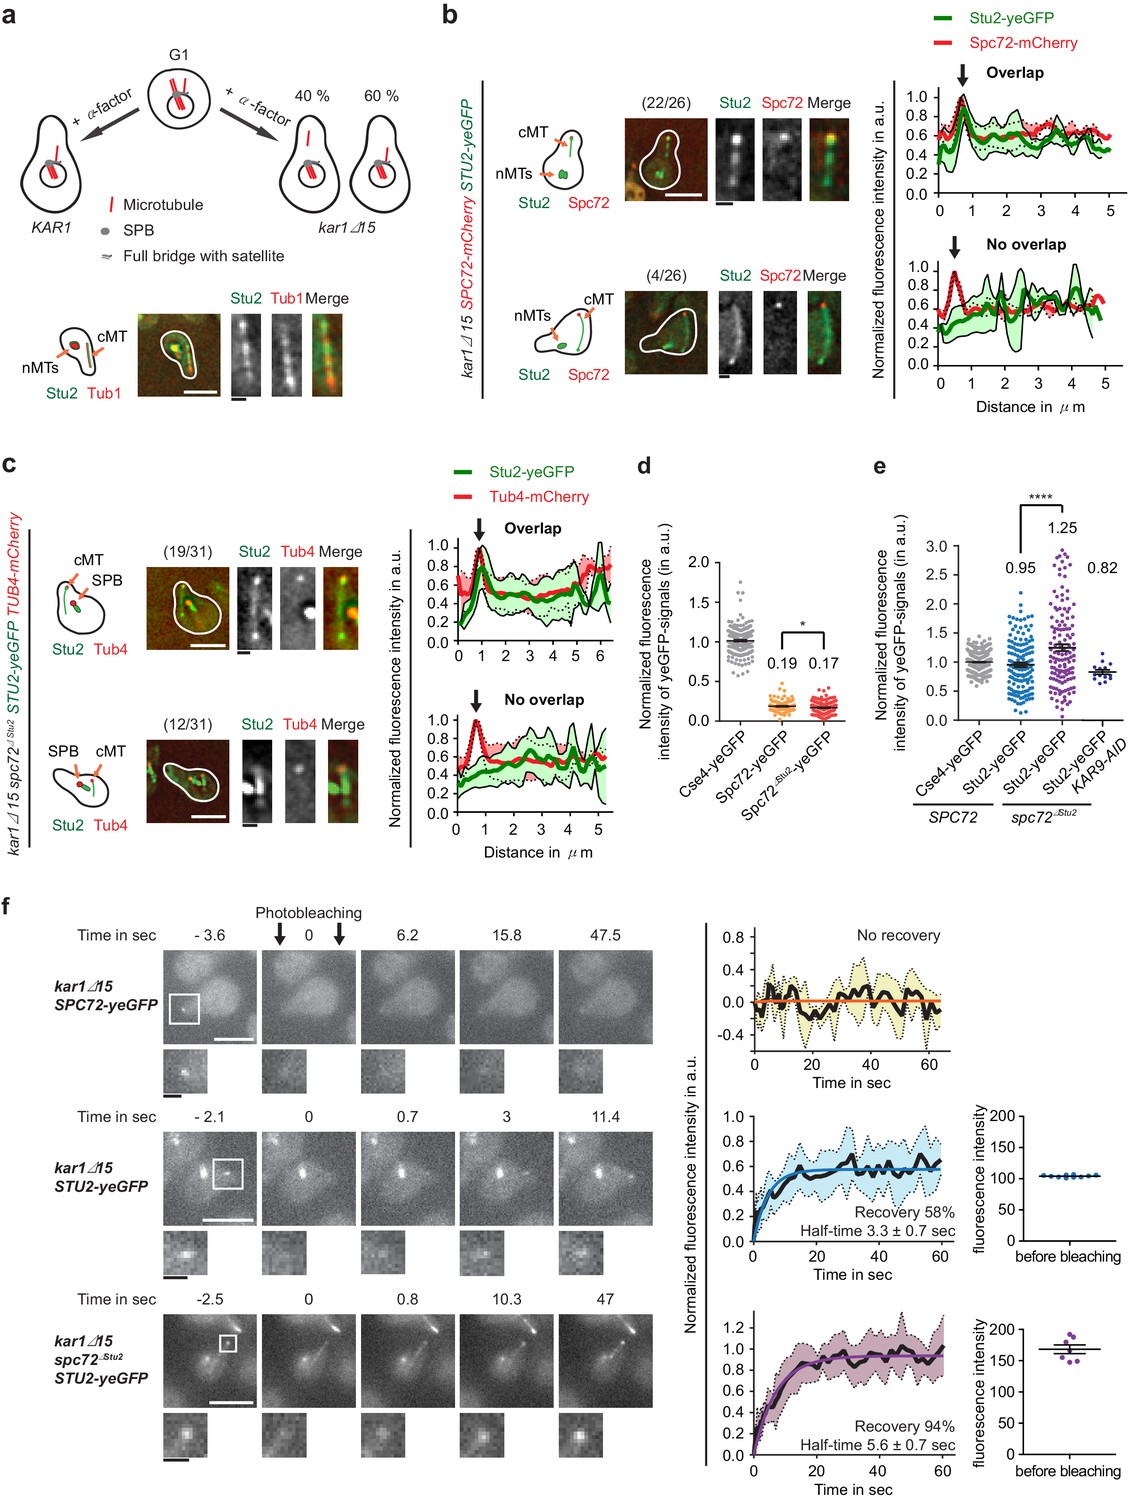
Stu2 associates to the minus end of detached cMTs via Spc72 and an additional factor.
(a) Model for the generation of detached cMTs. G1 cells organize cMTs from the SPB outer plaque and the bridge structure. Upon addition of α-factor, the bridge organzies cMTs by binding of γ-TuSC–Spc72 to the bridge component Kar1. In about 40% of kar1Δ15 cells, this interaction is lost and cMTs are released into the cytoplasm with γ-TuSC and Spc72 at the MT minus end. A single stack of an exemplary cell is shown at the bottom. The cartoon on the left illustrates the position of the detached cM in the cell on the right. White scale bar: 5 μm; black scale bar: 1 μm. (b–f) Experiments were performed with kar1Δ15 cells treated with α-factor and analysis was performed on single, detached cMTs. (b) Stu2–yeGFP associates with the minus end of detached cMTs. Numbers in brackets represent cells with this phenotype/total cell number. Representative images are single z-planes. The graphs on the right show line scans of the Stu2 signal (green) and the Spc72 signal (red) along the cMTs. The line represents the mean and the surrounding area the SD of the measured signals. The arrow marks the cMT minus end. White scale bar: 5 µm, black scale bar: 1 µm. (c) As in (b): Stu2–yeGFP associates with the majority of the minus ends of detached cMTs in spc72∆Stu2 cells. (d) Normalized intensity of Spc72 and Spc72∆Stu2 at detached cMTs. The kinetochore protein Cse4 from late anaphase cells was used as a fluorescence intensity standard. Mean ± SEM, n ≥ 129 cells. *p=0.0319. (e) Normalized intensity of Stu2 at detached cMT minus ends in SPC72, spc72∆Stu2 and spc72∆Stu2 KAR9-AID (1 hr IAA) cells. Cse4 was used as a fluorescence standard. Mean ± SEM, n ≥ 134 cells, ****p<0.0001. (f) Analysis of the dynamic behaviour of Spc72–yeGFP and Stu2–yeGFP at detached cMT minus ends by fluorescence recovery after photobleaching (FRAP). Representative images are from single z-planes with enlargement of the bleached signal shown underneath. Corresponding graphs on the side represent the normalized amount of signal recovery and the fluorescence intensity of the Stu2–yeGFP signal at the beginning of the experiment before bleaching. N(Spc72) = 6 cells; n(Stu2) = 10 cells each. Size bars are as in (b).
Figure 6 with 1 supplement
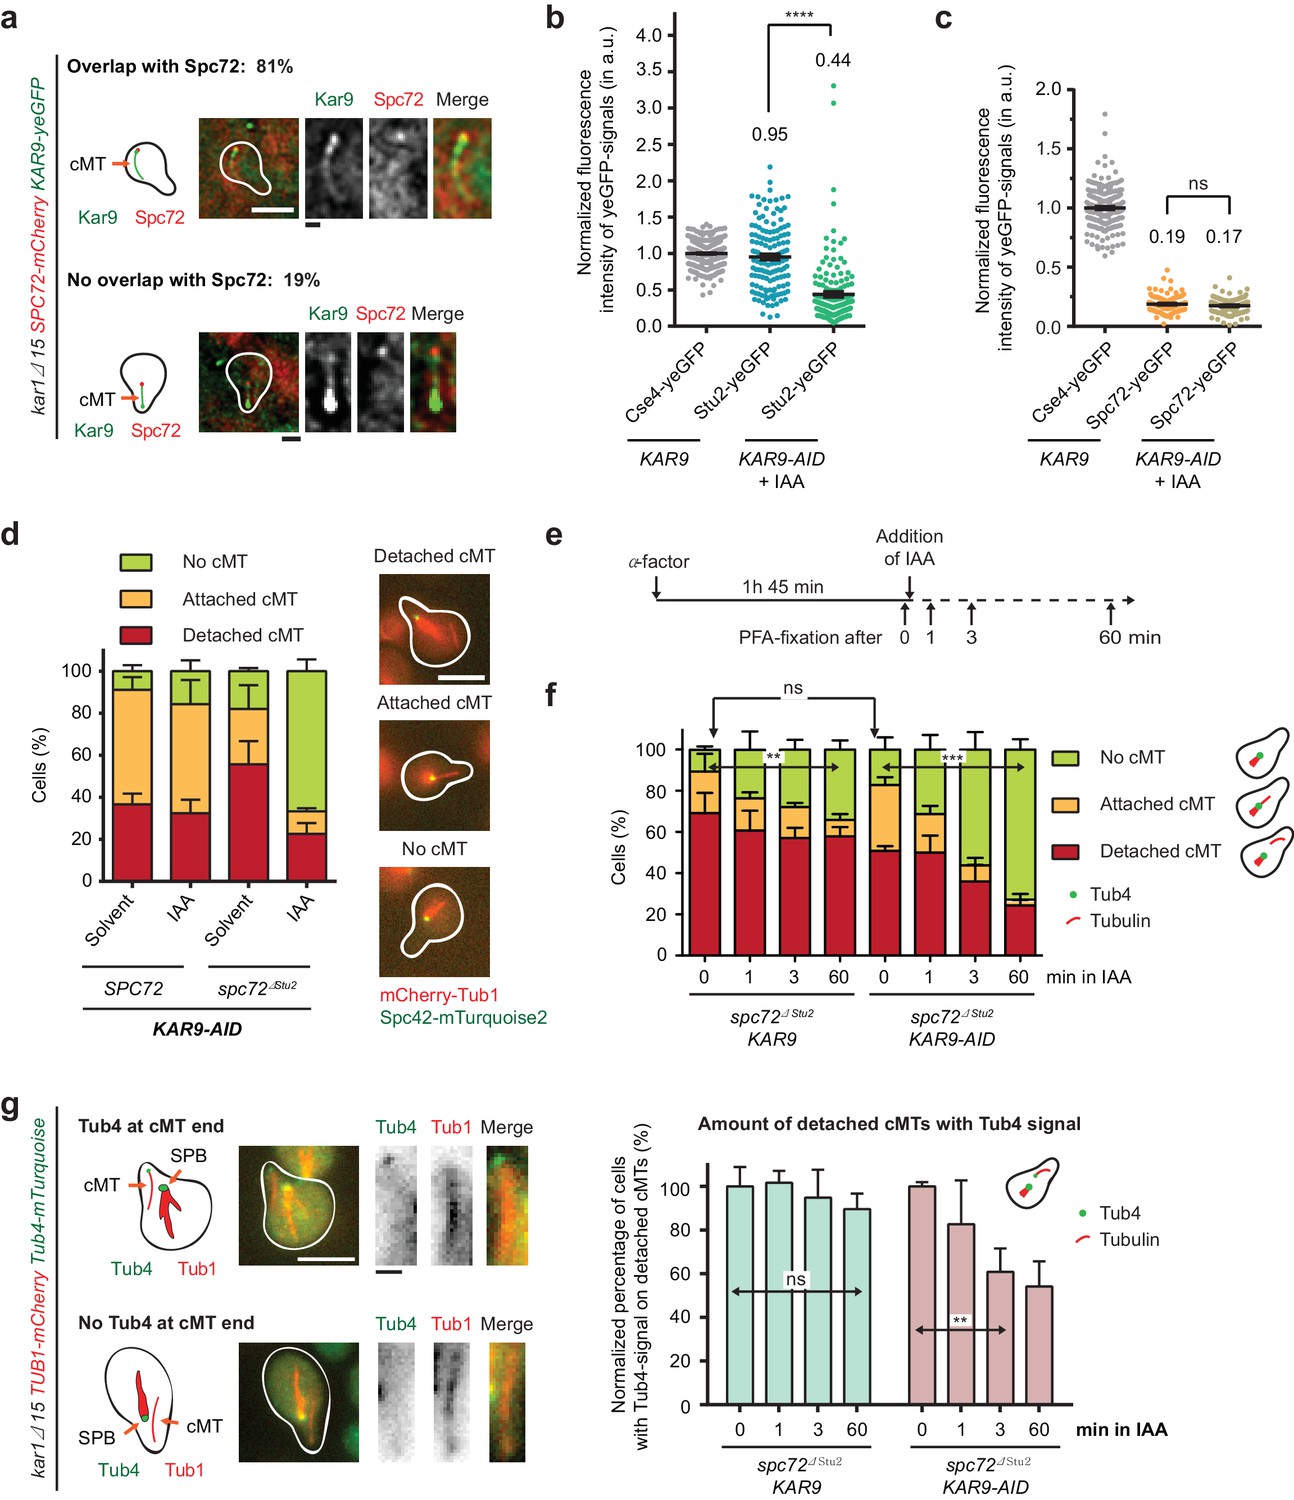
Kar9-dependent recruitment of Stu2 to the cMT minus end.
(a) Kar9–yeGFP localization on detached cMTs. Spc72–mCherry marks the cMT minus end. Representative images are from single z-planes. N = 27 cells; white scale bar — 5 µm; black scale bar — 1 µm. (b) Normalized intensity of Stu2–yeGFP at detached cMT minus ends in WT cells or after auxin-induced depletion of Kar9 for 1 hr. The cMT minus end was marked by Tub4–mCherry. Cse4 was used as a fluorescence intensity standard. Note, the Stu2–yeGFP value is the same as in Figure 5e. Strains were analysed simultaneously. Mean ± SEM, n ≥ 140 cells for each condition. ****p<0.0001. (c) Normalized intensity of Spc72–yeGFP at the cMT minus end of mCherry–Tub1 labelled detached cMTs. Measurements were done in KAR9 kar1∆15 cells and KAR9-AID kar1∆15 cells with auxin-induced depletion of Kar9 for 1 hr. The kinetochore signal of CSE4–yeGFP cells was used as a fluorescence intensity standard. Note, the Spc72–yeGFP value is the same as that in Figure 5d. Strains were analysed simultaneously. Mean ± SEM, n ≥ 104 cells; ns, not significant. (d) Indole-3-acetic acid (IAA) or the solvent ethyl alcohol (EtOH) were added for 1 hr to α-factor-arrested SPC72 and spc72∆Stu2 cells containing KAR9-3HA-AID. Mean ±SD, n ≥ 153 cells in three independent experiments. Scale bar: 5 μm. (e) Scheme of the experiment shown in (f). The solvent is EtOH. (f) Number of cMTs in spc72∆Stu2 KAR9-3HA kar1∆15 or spc72∆Stu2 KAR9-3HA-AID kar1∆15 cells over time. Mean ± SD, n ≥ 50 cells in three independent experiments. **p=0.001, ***p≤0.0006; ns, not significant. (g) The combined impairment of Kar9 and the Stu2 binding site in spc72∆Stu2 triggers the detachment of Tub4–mTurquoise2 from the minus end of detached cMTs. Conditions as in (e). Cells were fixed 0, 1, 3 and 60 min after IAA addition. The scale was normalized to the time point 0 min (=100%). Mean ± SD, n ≥ 50 cells; three independent experiments, **p=0.0033; ns, not significant. On the right: example cells with mCherry–Tub1 and with or without Tub4–mTurquoise2 signal are shown together with schematic drawings of the detached cMT. White scale bar — 5 μm; black scale bar — 1 μm.
Figure 6—figure supplement 1
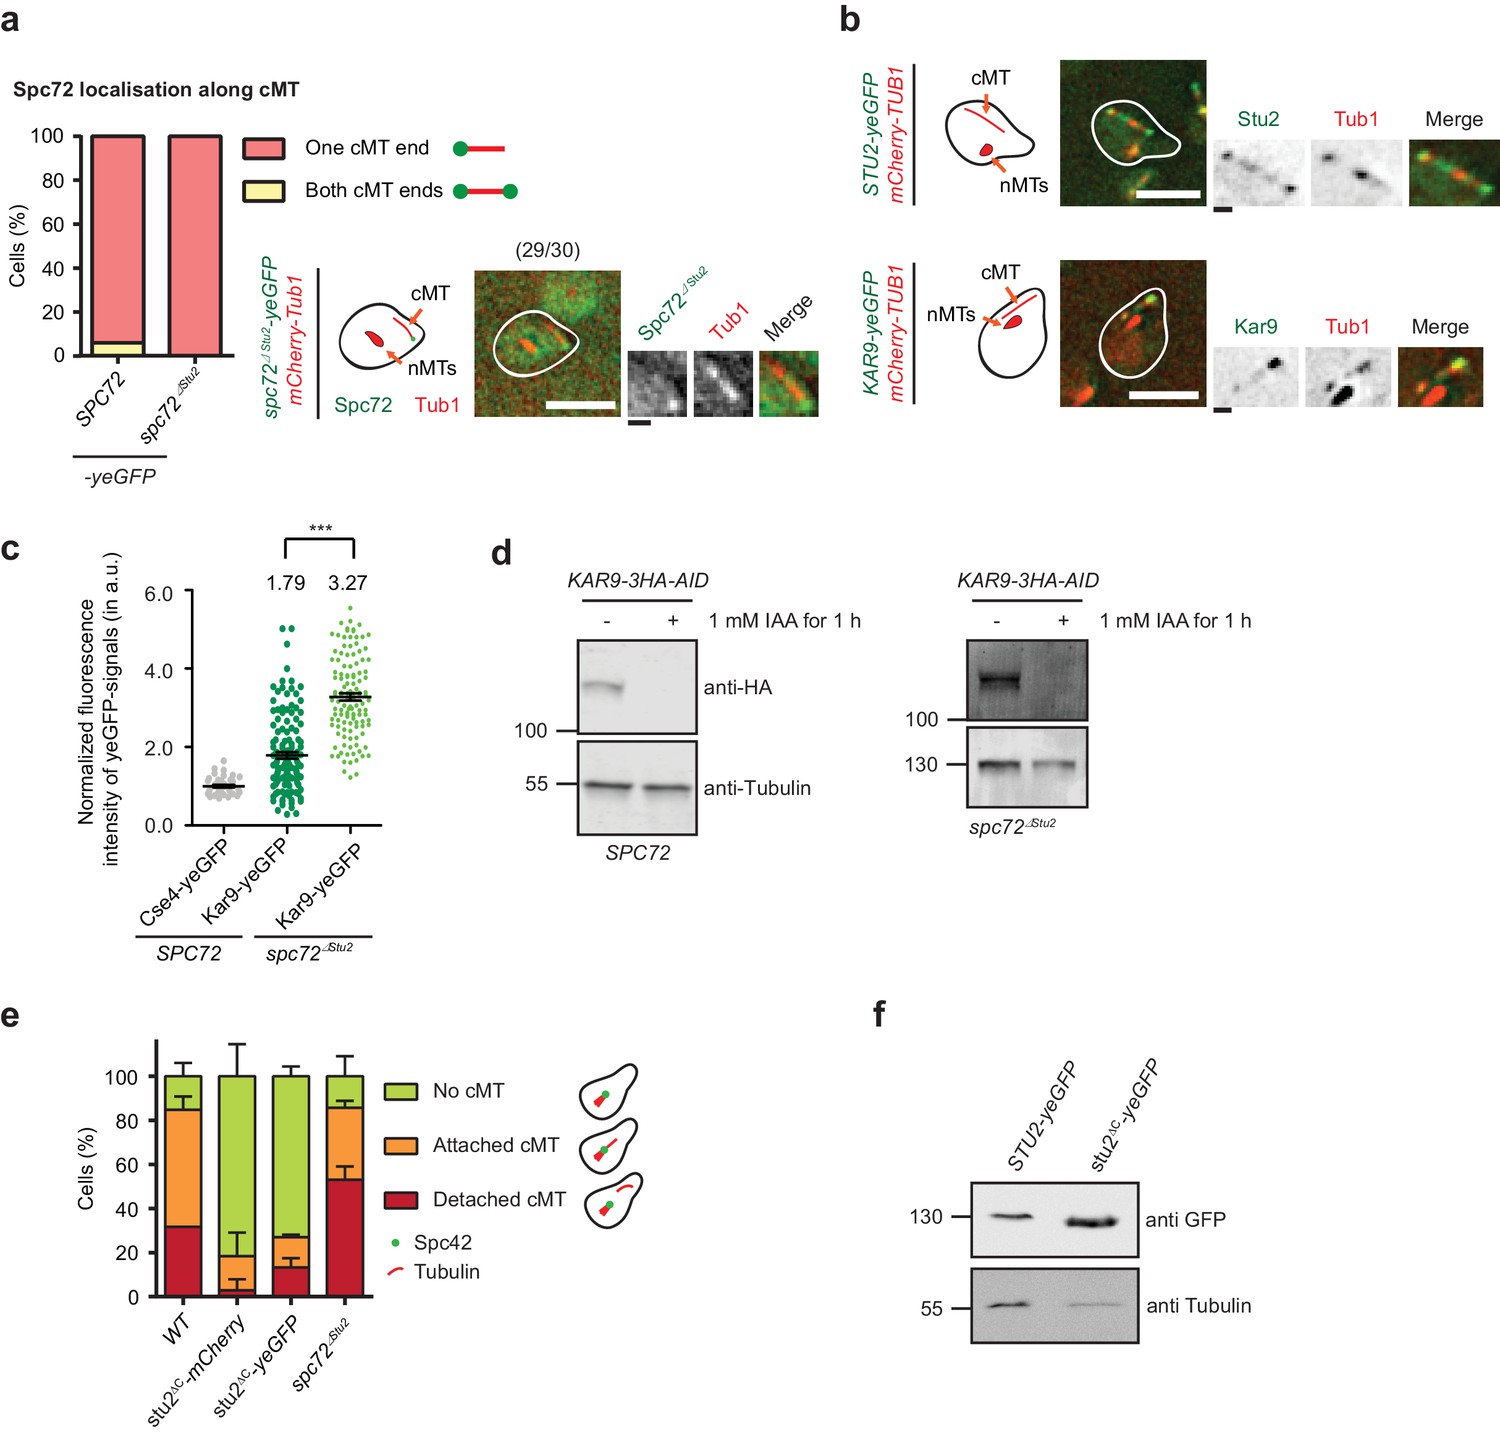
Role of Stu2 at the cMT minus end.
(a and b) Detached cMTs of kar1∆15 cells carrying Spc72–, Spc72∆Stu2–, Stu2– or Kar9–yeGFP. kar1Δ15 cells were arrested with α-factor for 1.5–2 hr. (a) Localization of Spc72 and Spc72∆Stu2 at the end of detached cMTs. Representative images are from single z-planes. The numbers in the brackets represent cells with this phenotype per total cells. N = 30. White scale bar — 5 μm; black scale bar — 1 μm. (b) Localization of Stu2–yeGFP and Kar9–yeGFP on detached cMTs. Representative images are from single z-planes. White scale bar — 5 μm; black scale bar — 1 μm. (c) Normalised fluorescence intensity of Kar9–yeGFP on single detached cMTs of kar1∆15 cells with either SPC72 or spc72∆Stu2. It shows that impaired binding of Stu2 to Spc72 increases Kar9 localisation to the cMT minus end. The Cse4–yeGFP signal was used for normalization. (d) Degradation of Kar9–AID-tagged protein after 1 hr incubation with 1 mM IAA. Tri-chloro acetic acid (TCA)-extract of kar1∆15 cells was prepared and the 3HA-tag was detected with antibodies. Tubulin was used as loading control. (e) stu2∆C kar1∆15 cells show a reduced number of cMTs compared to spc72∆Stu2 cells, indicating an additional function of the C-terminus of Stu2 besides its interaction with Spc72. Mean ±SD, n ≥ 50 cells in three experiments. (f) STU2–yeGFP and stu2∆C–yeGFP are similarly expressed in WT cells. TCA-extracts of log-phase cells were prepared and the GFP-tag was used for immuno-detection.
Figure 7 with 1 supplement
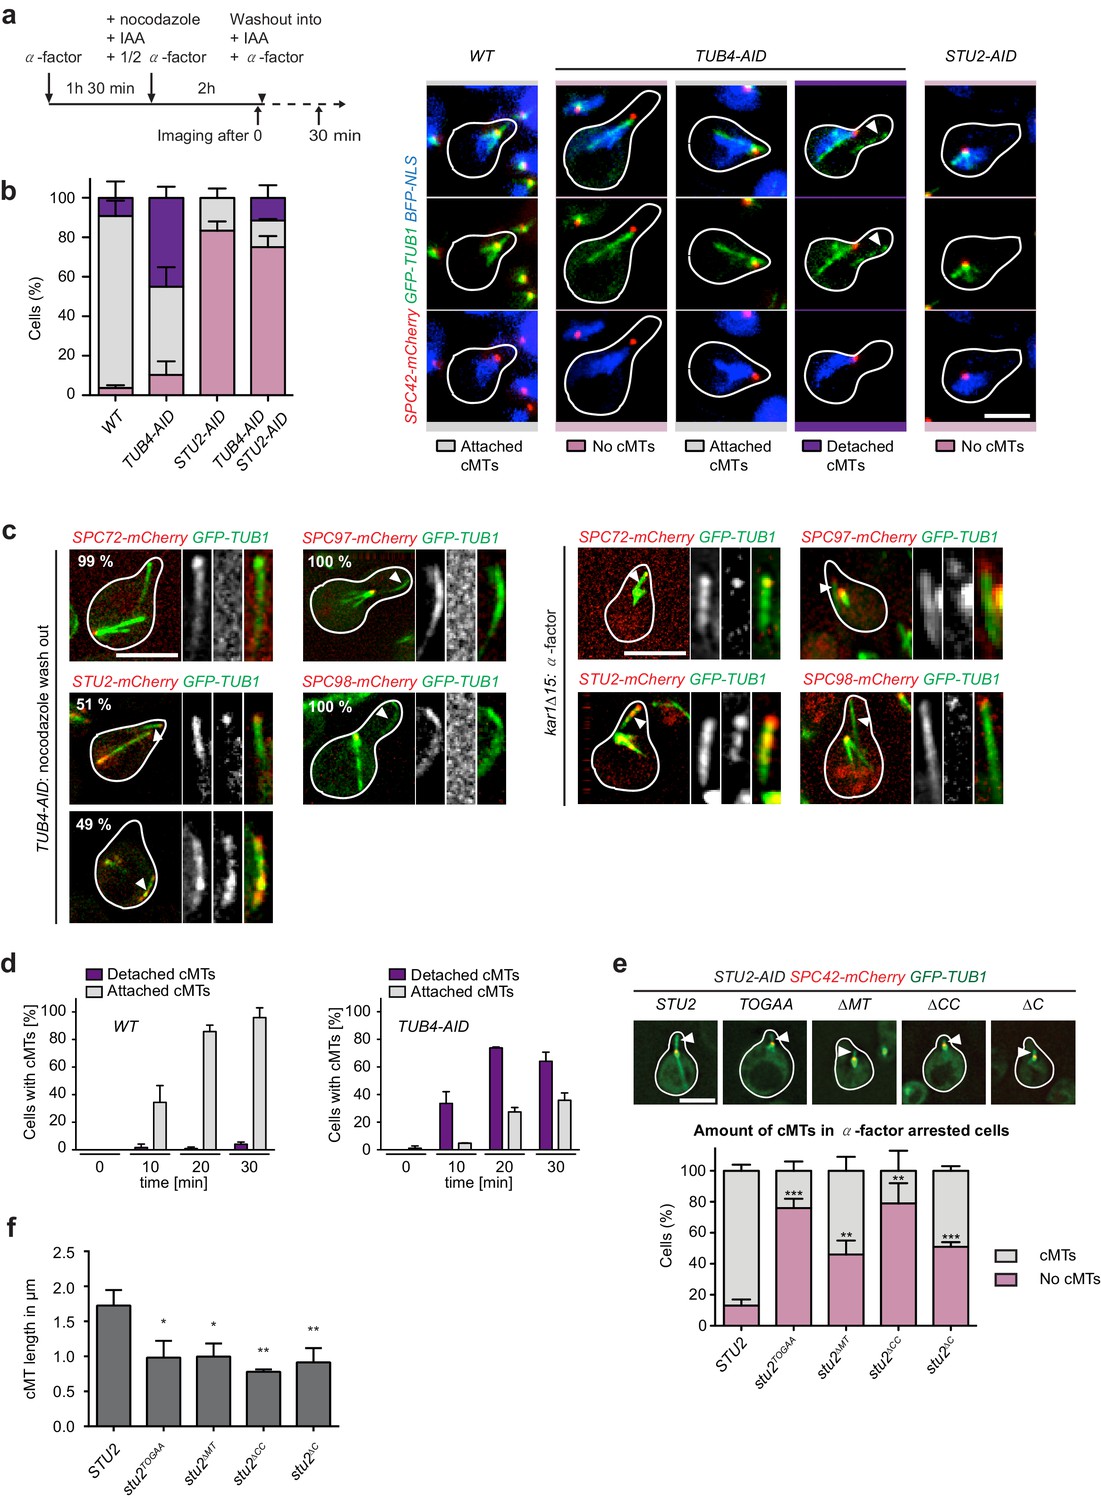
Tub4 limits cMT nucleation at the SPB while Stu2 is required for MT assembly in vivo.
(a) Scheme of experiments in (b and c). (b) cMT assembly after nocodazole wash out as outlined in (a). Shown are representative cells with yeGFP–TUB1 SPC42–mCherry NLS–BFP that were used for the quantification summarized in the barchart on the left. Mean ± SD, n ≥ 30 cells per strain, per experiment. The experiment was repeated three times. The arrowheads in the TUB4–AID cells point towards cMTs in the cytoplasm. Scale bar: 10 μm. (c) TUB4–AID yeGFP–TUB1 cells with the indicated mCherry markers were cultured as outlined in (a). The images show representative cells with cMTs that were not attached to the SPB (marked by arrowheads). The numbers indicate the percentage of cells demonstrating the illustrated phenotype (100 cells were analysed per condition). As control for the Spc72–, Stu2–, Spc97– and Spc98–mCherry signals on single detached cMTs, we incubated kar1∆15 GFP–TUB1 cells with α-factor for 60 min. Detached cMTs were analysed (arrowheads). The experiment was repeated twice with identical outcomes. (d) Kinetics of cMT assembly. TUB4 WT and TUB4–AID cells were treated with α-factor and nocodazole as outlined in (a). cMTs were analysed 0, 10, 20 and 30 min after nocodazole washout by live cell analysis (see Videos 1–3). Under this experimental condition, TUB4–AID cells nucleated more detached cMTs compared to those shown in (b). Mean ± SD, n ≥ 30 cells, two independent experiments. (e) STU2–AID yeGFP–TUB1 SPC42–mCherry cells with the indicated integrated STU2 constructs. The experiment was performed as outlined in (a). Three independent experiments were performed; n > 30 cells per experiment. **p<0.0039; ***p<0.0002. Example cells with long (STU2 WT) or short cMTs (STU2 mutants) are shown. Pictures are from single z-stacks with an arrowhead pointing towards the cMT. Scale bar: 5 μm. (f) Length of cMTs of cells from (e). Three experiments were performed; n > 30 cells per experiment.* p<0.0166; **p<0.0095.
Figure 7—figure supplement 1

The TOG domains of Stu2 are important for the nucleation of cMTs.
(a) IAA-depleted Tub4 and Stu2 below the critical threshold that is needed for viability. Drop test of cells on the indicated plates. Cells were grown for 3 d at 30°C. (b) IAA-induced depletion of Tub4–AID and Stu2–AID. AID-tagged strains were incubated for 1 hr at 30°C with and without IAA. Yeast cell extracts were analysed by immunoblotting with the indicated antibodies. Tub2 was used as a loading control. (c) Expression of STU2 mutant constructs from the STU2 promoter in STU2–AID cells incubated with IAA or the solvent control EtOH. Cell extracts were analysed by immunoblotting with anti-Stu2 antibodies (directed against TOG1/2). Note that, for unknown reasons, the anti-Stu2 antibody detected the Stu2–AID protein poorly. Tub2 was used as loading control.
Figure 8
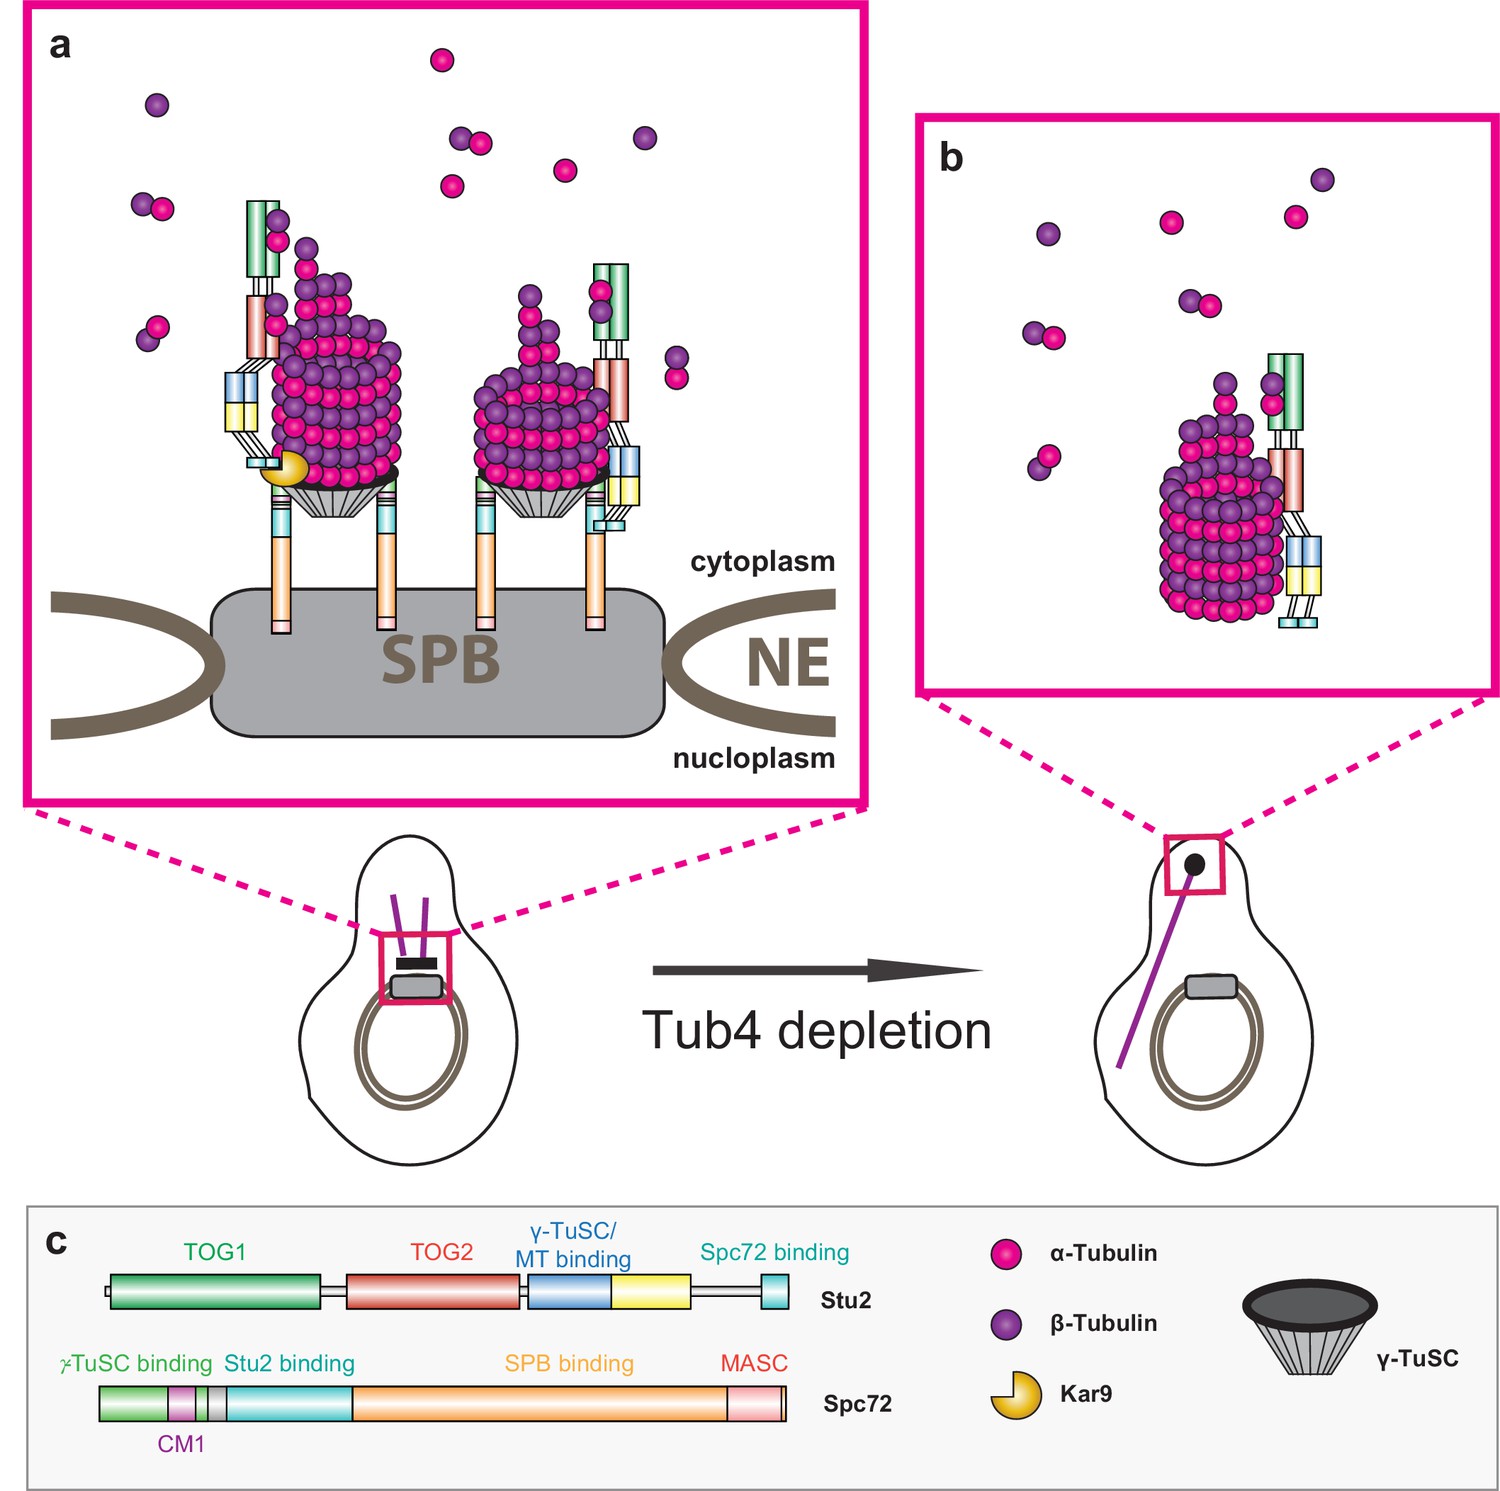
Model of Stu2-assisted cMT nucleation.
(a) Right: initiation of cMTs assembly through stabilisation of the Spc72–γ-TuSC interaction and the oriented recruitment of the first α/β-tubulin molecules. Left: further cMT growth promoted by the Kar9–Stu2 interaction. (b) In the case of Tub4 depletion, Stu2 can promote the assembly of cMTs away from the SPB. (c) Colour code for the domain organisation of Stu2 and Spc72 and legend for all of the proteins and complexes shown.
Videos
Video 1
TUB4–AID cells assemble cMTs away from the SPB after nocodazole washout.
Time-lapse sequences of TUB4–AID yeGFP–TUB1 SPC42–mCherry cells. After nocodazole washout in the presence of IAA and α-factor (as outlined in Figure 7a) cells were placed on a MatTek dish and imaged immediately. Images were acquired every 5 min and post-processed with maximum intensity projection.
Video 2
TUB4–AID cells assemble cMTs away from the SPB after nocodazole washout.
Time-lapse sequences of TUB4–AID yeGFP–TUB1 SPC42–mCherry cells with nocodazole washout as described in Video 1.
Video 3
cMTs assemble at the SPB of WT TUB4 cells after nocodazole washout.
TUB4 yeGFP–TUB1 SPC42–mCherry cells were treated and imaged as described in Videos 1 .
Additional files
-
Supplementary file 1
Yeast strains used for this study.
- https://doi.org/10.7554/eLife.39932.018
-
Supplementary file 2
Plasmids used for this study.
- https://doi.org/10.7554/eLife.39932.019
-
Transparent reporting form
- https://doi.org/10.7554/eLife.39932.020
Download links
A two-part list of links to download the article, or parts of the article, in various formats.
Downloads (link to download the article as PDF)
Open citations (links to open the citations from this article in various online reference manager services)
Cite this article (links to download the citations from this article in formats compatible with various reference manager tools)
The microtubule polymerase Stu2 promotes oligomerization of the γ-TuSC for cytoplasmic microtubule nucleation
eLife 7:e39932.
https://doi.org/10.7554/eLife.39932


