A generalized theory of age-dependent carcinogenesis
- University of Colorado Anschutz Medical Campus, United States
Figures
Figure 1
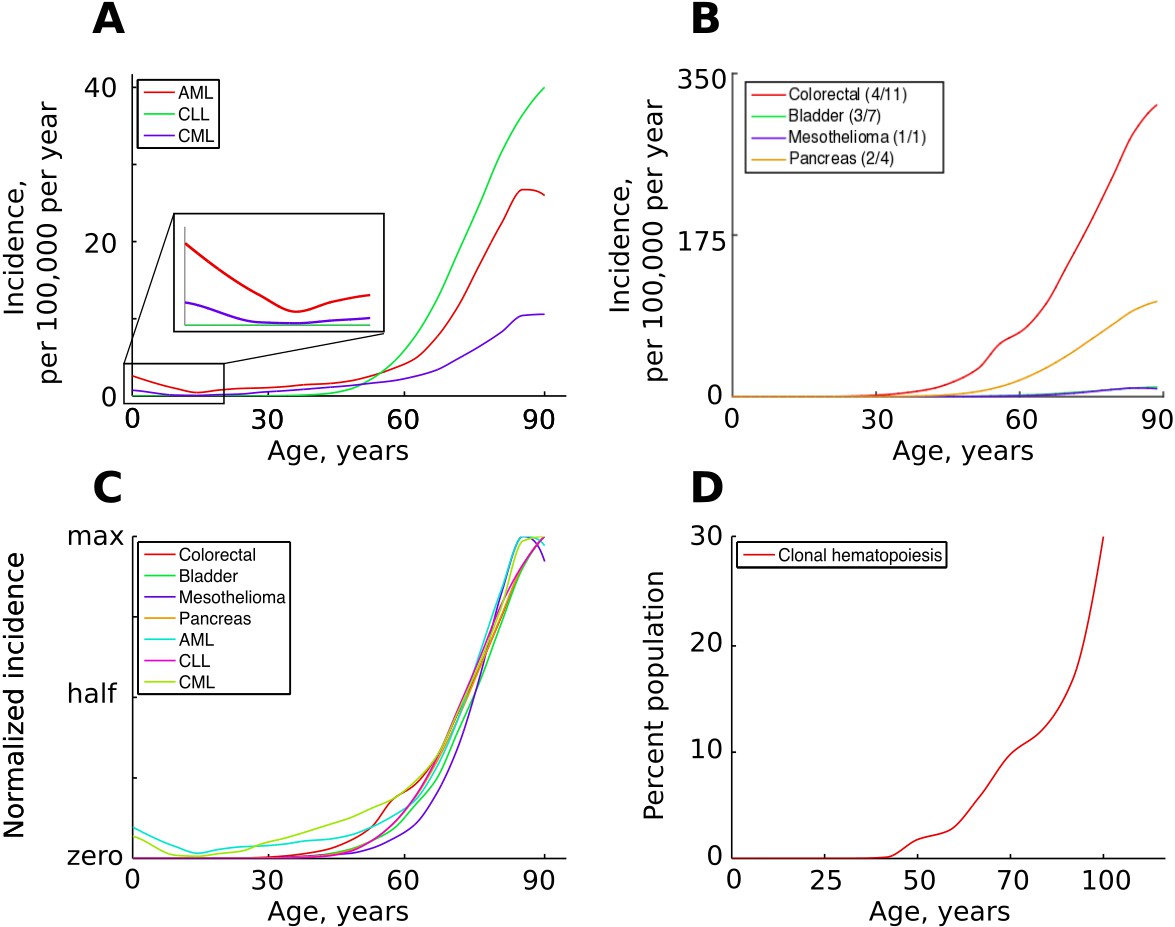
The incidence of some human cancers and clonal hematopoiesis.
(A) The age distribution of the three most common types of leukemia: AML – acute myeloid leukemia, CLL – chronic lymphocytic leukemia, CML – chronic myeloid leukemia (data of National Cancer Institute, www.seer.cancer.gov). (B). The incidence of four other cancers (data of National Cancer Institute, www.seer.cancer.gov); the first number in the brackets indicates the average number of predicted driver mutations in known cancer genes and the second is the average number of predicted driver mutations in all protein coding genes according to Martincorena et al. (2017). The four cancers were chosen for their variability in the predicted numbers of driver mutations. (C) The incidence of pooled cancers from panels A and B normalized by dividing each data point by the corresponding cancer’s maximum incidence (removing scale and preserving shape). (D) Percent of the human population characterized by detected clonal hematopoiesis according to Jaiswal et al. (2014); clonal hematopoiesis is detected as an increased variant allele frequency and is thought to be driven by a single mutation.
Figure 2 with 1 supplement
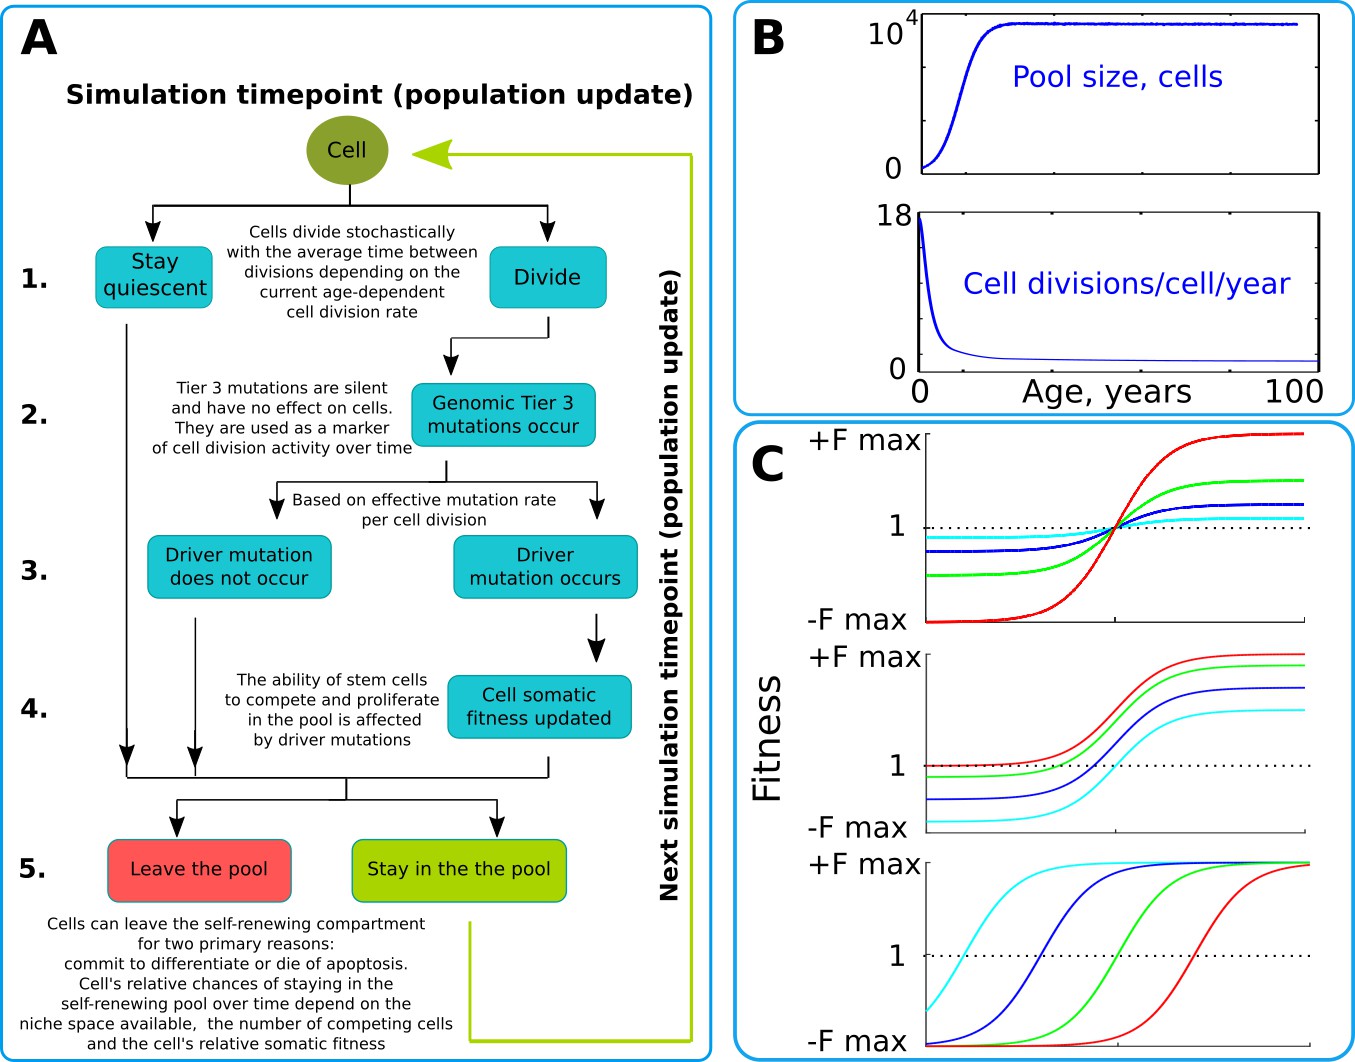
The simulation scheme and key parameters.
(A) A tree of cell processes and cell fate decisions made by any given single cell within one simulated model update. The indicated steps are used as guideposts in the Matlab code provided in Supplementary Materials. (B). Non-linear age-dependent changes in the simulated SC pool size (upper chart, based on Abkowitz et al., 1996 and Abkowitz et al., 2002) and cell division rate (lower chart, based on Bowie et al., 2006 and Sidorov et al., 2009); the initial number of cells is 300 in simulations where the adult pool size is 10,000 cells, and proportionally larger in simulations with larger adult pool sizes. (C). Age-dependent shift in selection (somatic fitness effects of somatic driver mutations); somatic selection is explored within a range of general selection strengths (upper chart), a range of the ratio of the strength of early and late-life selection, and a range age distribution of selection directionality and strength, assumed in the MMC-DS model to be a function of physiological aging (reflecting evolved programs that determine longevity). The X-axis represents age from 0 to 100 years, as shown in panel B. The Y-axis represents a range of driver mutation fitness effects from maximum negative (-Fmax) through 1 (fitness equal to non-mutant cells) to maximum positive fitness (+Fmax). The top chart shows alteration in the general strength of selection (light blue:±Fmax = ±0.05%, dark blue:±Fmax = ±0.125%, green:±Fmax = ±0.25%, red:±Fmax = ±0.5%). The middle chart shows the simulated range of the relative strength of early-life negative to late-life positive selection (light blue: -Fmax/+Fmax = −0.5%/+0.5%, dark blue: -Fmax/+Fmax = −0.3%/+0.7%, green: -Fmax/+Fmax = −0.1%/+0.9%, red: -Fmax/+Fmax = 0%/+1%). The bottom chart demonstrates age-dependent selection shifts imposed by different aging profiles (age of selection sign switch in years: light blue – 10, dark blue – 30, green – 50, red – 70 years;±Fmax = ±0.5%).
Figure 2—figure supplement 1
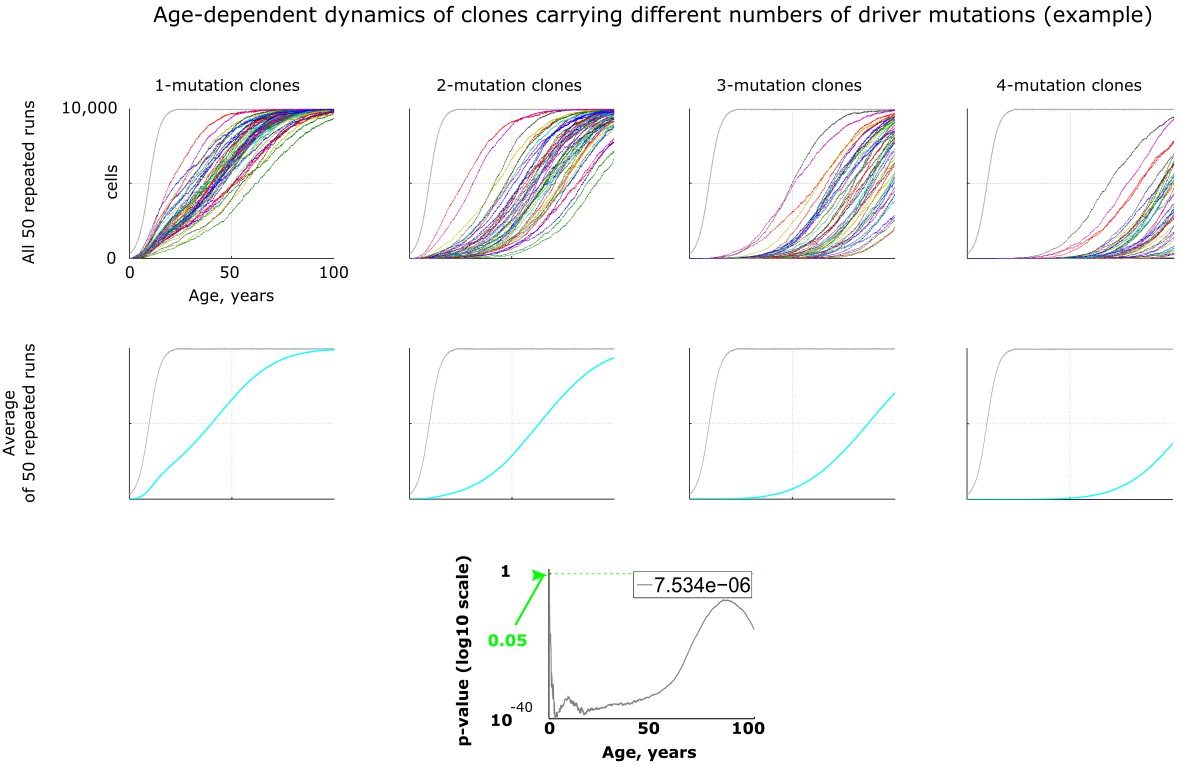
An example of age-dependent clonal dynamics generated by the model.
All results, except Figure 5, were generated by running 50 repeated simulation runs with identical parameters. Results in Figures 3–4 are represented as averaged dynamics of the 50 repeated simulation runs. Two types of statistical comparisons were done: a) the effect of changing a parameter in question (e.g. mutation rate) was compared within each type of clones, that is for 1-, 2-, 3- or 4-mutation clones (not shown in this figure); b) alternatively the difference between different types of clones was measured within one identical parameter set (lowermost chart in this figure). P-values in both types of statistics were calculated by comparing samples of 50 clones either for different parameter values within one clone type or for different clone types for one identical parameter set by applying the Kruskal-Wallis test, which is non-parametric analog of ANOVA. The number in top right corner of each p-value chart was derived by dividing the sum of all p-values along the age axis (area under p-value curve) by 5200 (maximum of Y-axis multiplied by maximum of X-axis, which represents the total area of the chart) as explained in Materials and methods.
Figure 3 with 3 supplements
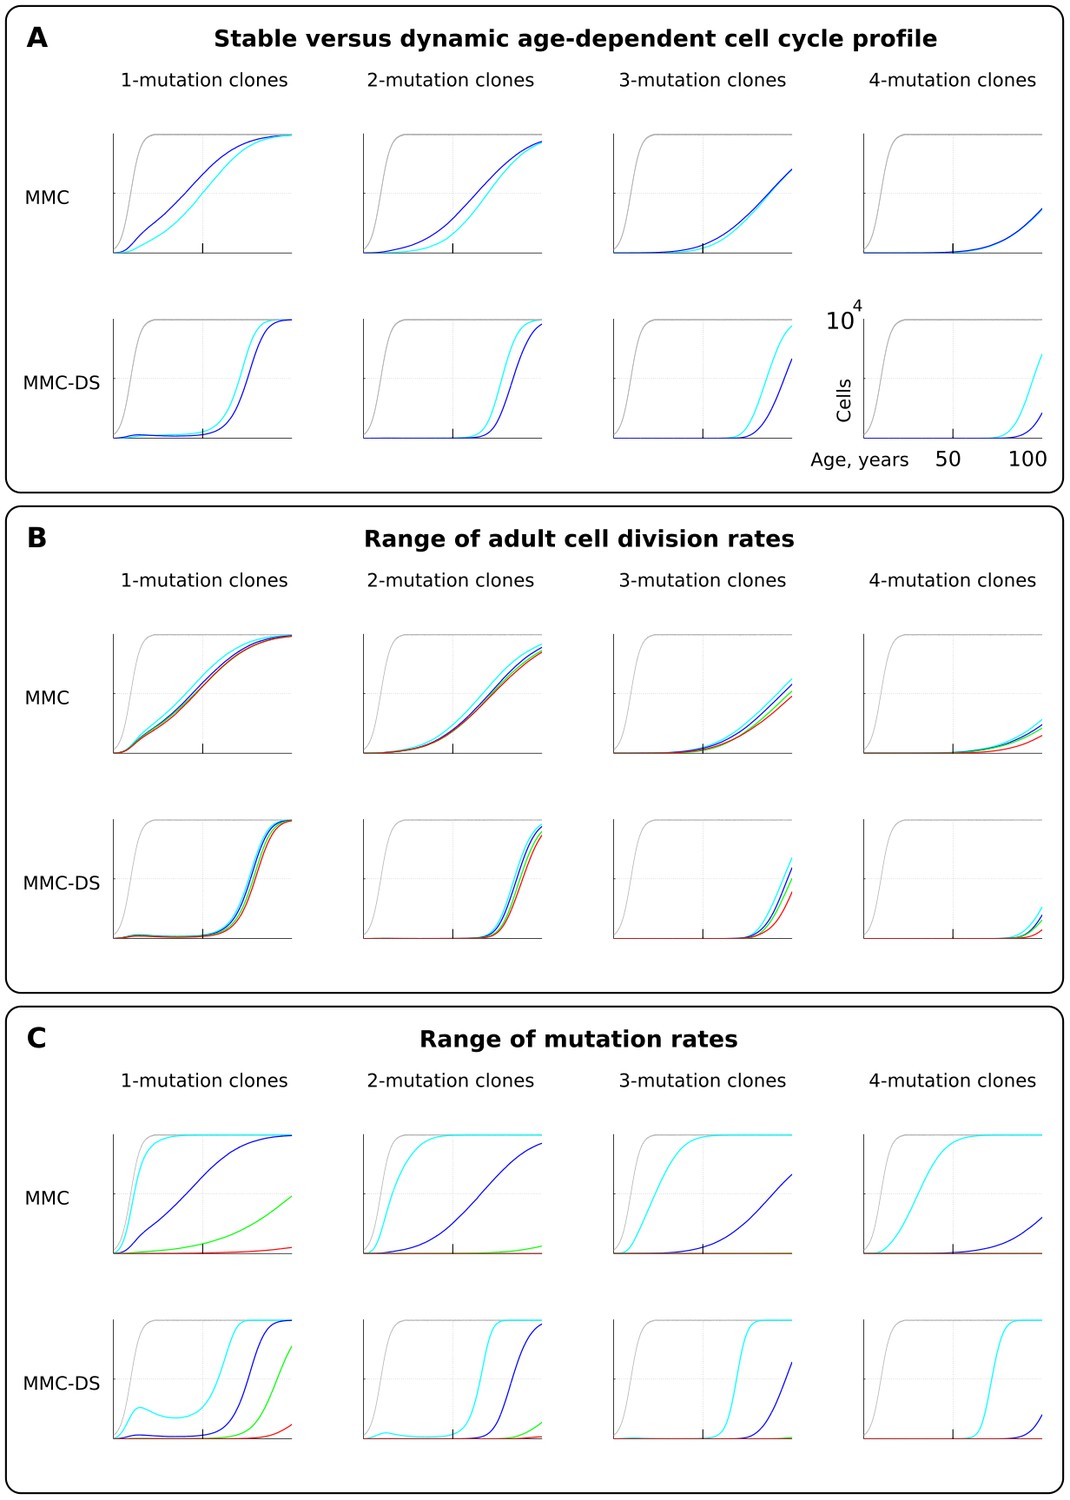
The effect of cell division profile, adult cell division rate and mutation rate on clonal dynamics of cells carrying 1, 2, 3 or four somatic driver mutations.
Y-axis in all charts ranges zero to 10,000 cells (linear scale); X-axis in all charts ranges zero to 100 years of age (linear scale).(A). The effect of dynamic (dark blue; the curve of cell division rates as shown in Figure 2B, lower chart) versus stable (light blue; cells division rate is stable at one division ~20 weeks throughout lifespan) cell division profiles. Grey curve in all charts of this type represents the size of the total SC pool. Other parameters as listed in Standard parameter sets, Supplementary Materials. (B). The effect of adult cell division rate under the dynamic age-dependent cell division profile (as shown in Figure 2B, lower chart). Color coding: light blue – one division per cell in ~70, dark blue – one in ~60, green – one in ~50, and red – one division ~40 weeks. Other parameters as listed in Standard parameter sets, Supplementary Materials. (C) The effect of mutation rate (MR). Color coding: light blue - MR = 10−2, dark blue – MR = 10−3, green – MR = 10−4, and red – MR = 10−5. Other parameters as listed in Standard parameter sets, Supplementary Materials. Notice that MR is not the usually understood mutation rate per cell division per base pair, but is the probability of acquiring (per cell division) any genetic/epigenetic change that confers the incipient cell a change in somatic fitness.
Figure 3—figure supplement 1

Results of statistical comparisons related to testing the effect of dynamic age-dependent cell division profiles.
Interpretation as explained in Figure 2—figure supplement 1 and Materials and methods.
Figure 3—figure supplement 2
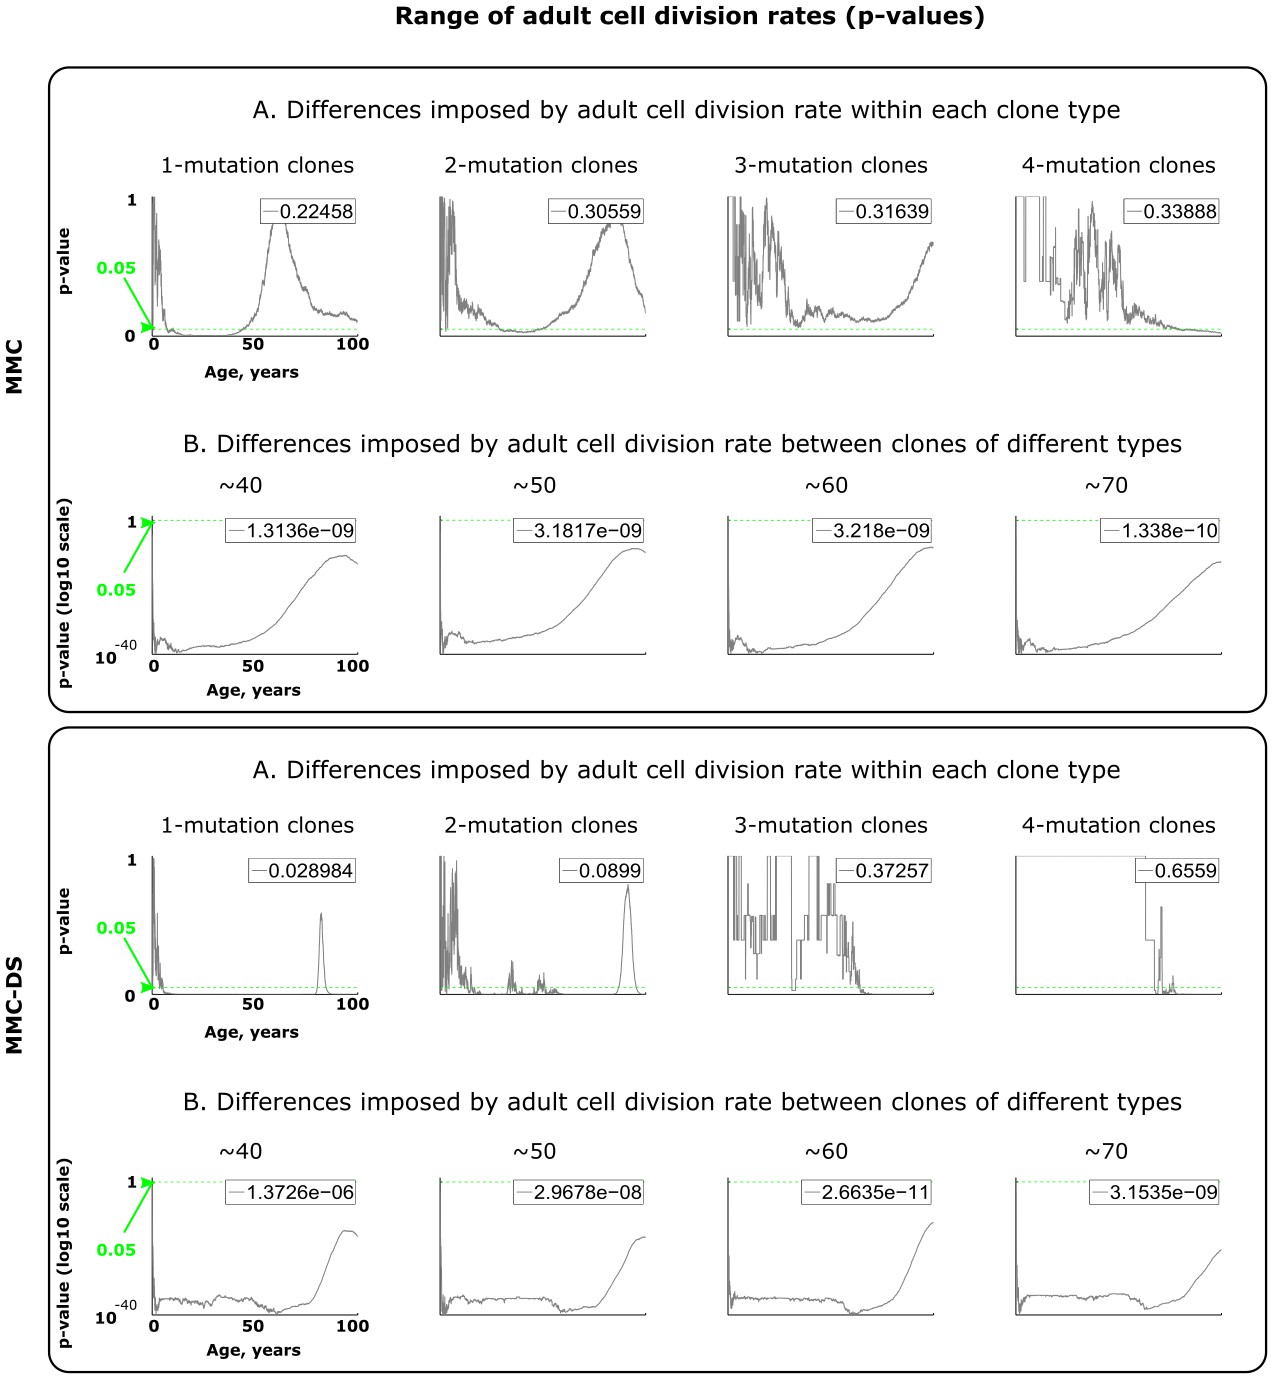
Results of statistical comparisons related to testing the effect of adult cell division rates.
Interpretation as explained in Figure 2—figure supplement 1 and Materials and methods.
Figure 3—figure supplement 3
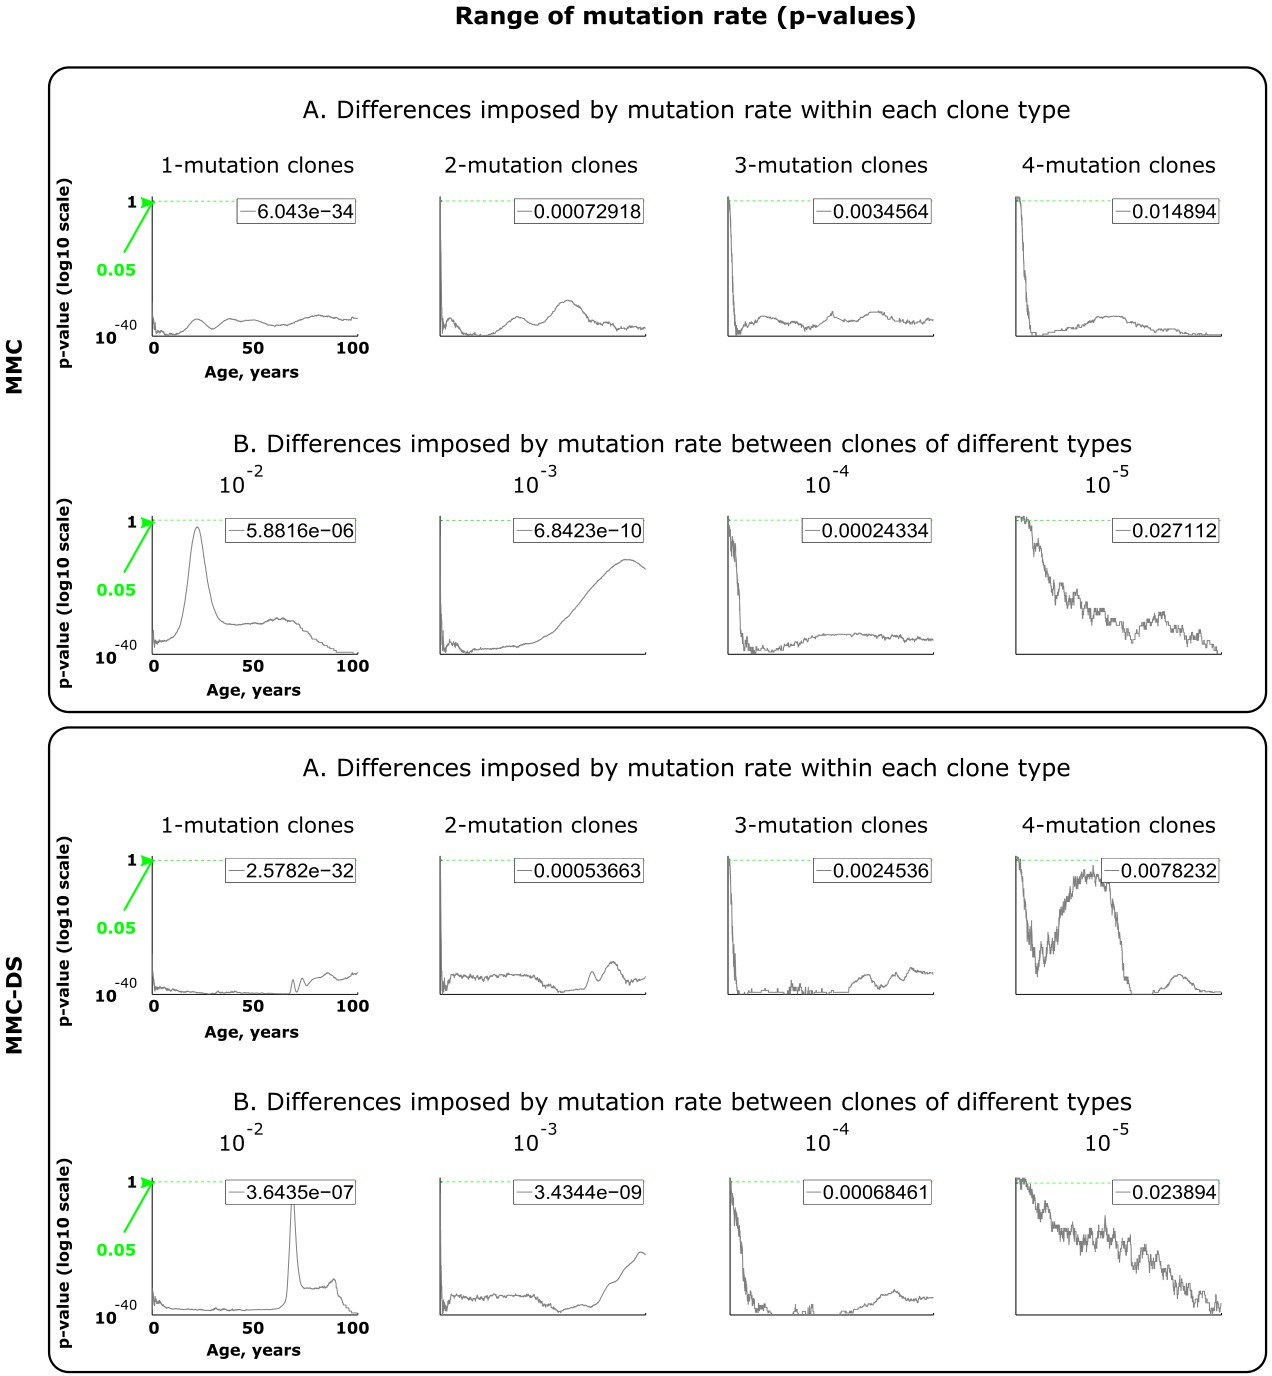
Results of statistical comparisons related to testing the effect of mutation rates.
Interpretation as explained in Figure 2—figure supplement 1 and Materials and methods.
Figure 4 with 3 supplements
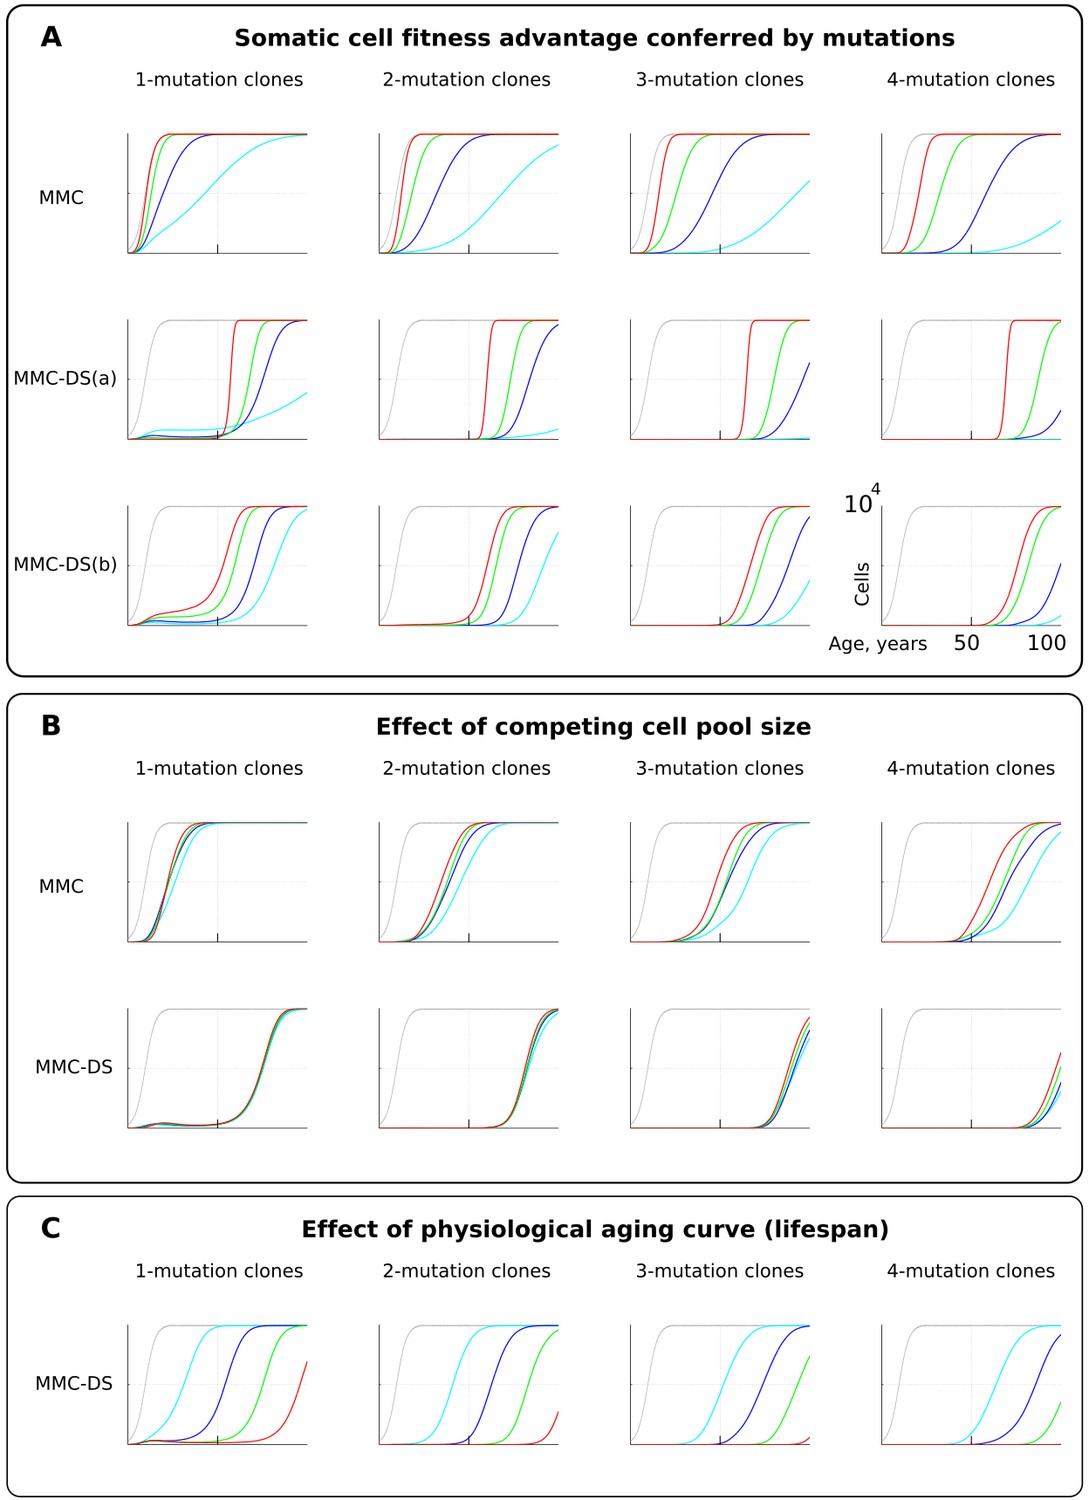
The influence of mutation somatic fitness effects, pool size, and physiological aging.
Y-axis in all charts except panel B ranges zero to 10,000 cells (linear scale); X-axis in all charts ranges zero to 100 years of age (linear scale).(A). The effect of alterations in somatic cell fitness conferred by driver mutations. Color coding for MMC: light blue – fitness advantage (FA) =+0.1%, dark blue – FA =+0.25%, green – FA =+0.5%, and red – FA =+1%. MMC-DS(a) explores a range of the general strength of differential selection corresponding to and color-matched to Figure 2C, upper chart (absolute selection strength values are described in Figure 2C). MMC-DS(b) explores a range of early to late life selection strength ratios corresponding and color-matched to Figure 2C, middle chart (absolute values are described in Figure 2C). Other parameters as listed in Standard parameter sets, Supplementary Materials. (B). The effect of adult pool (AP) size. Color coding: light blue – AP = 10,000 cells, dark blue – AP = 25,000 cells, green – AP = 50,000 cells, and red – AP = 100,000 cells. Starting pool size in all conditions is 300 cells. The Y-axis is relative and represents percent of AP (AP = 100%, maximum size delineated by the black curve). Other parameters as listed in Standard parameter sets, Supplementary Materials. (C). The effects of physiological aging in the MMC-DS model. The corresponding and color matched aging curve profiles (aging mirrors the shifts in somatic selection in MMC-DS) are shown in Figure 2C, lower chart. Other parameters as listed in Standard parameter sets, Supplementary Materials.
Figure 4—figure supplement 1
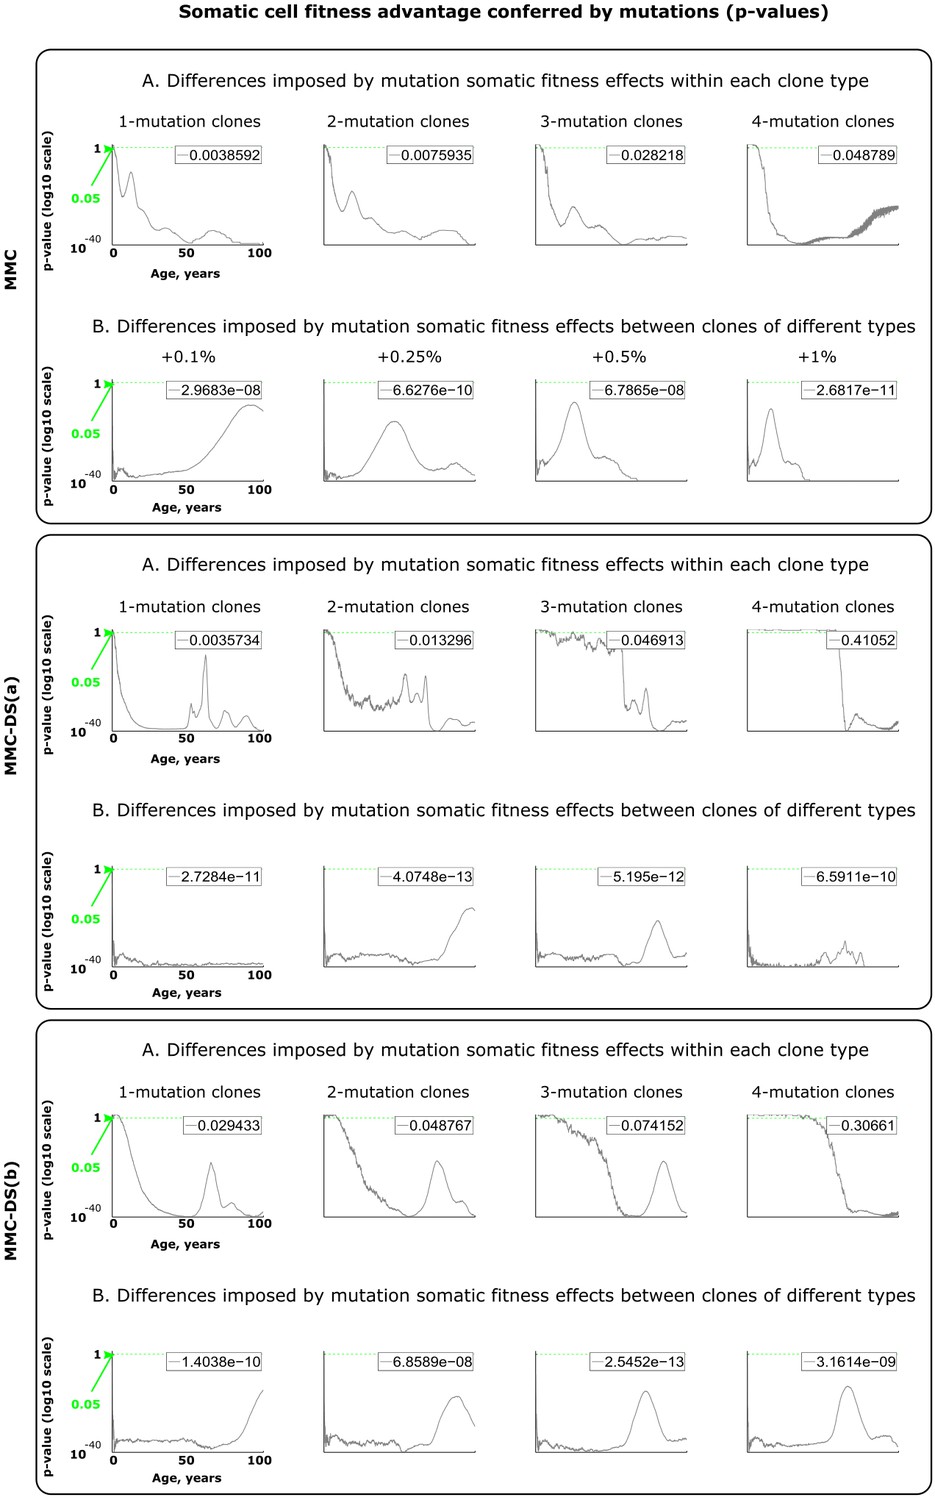
Results of statistical comparisons related to testing the effect of somatic fitness effects conferred by driver mutations.
Interpretation as explained in Figure 2—figure supplement 1 and Materials and methods.
Figure 4—figure supplement 2
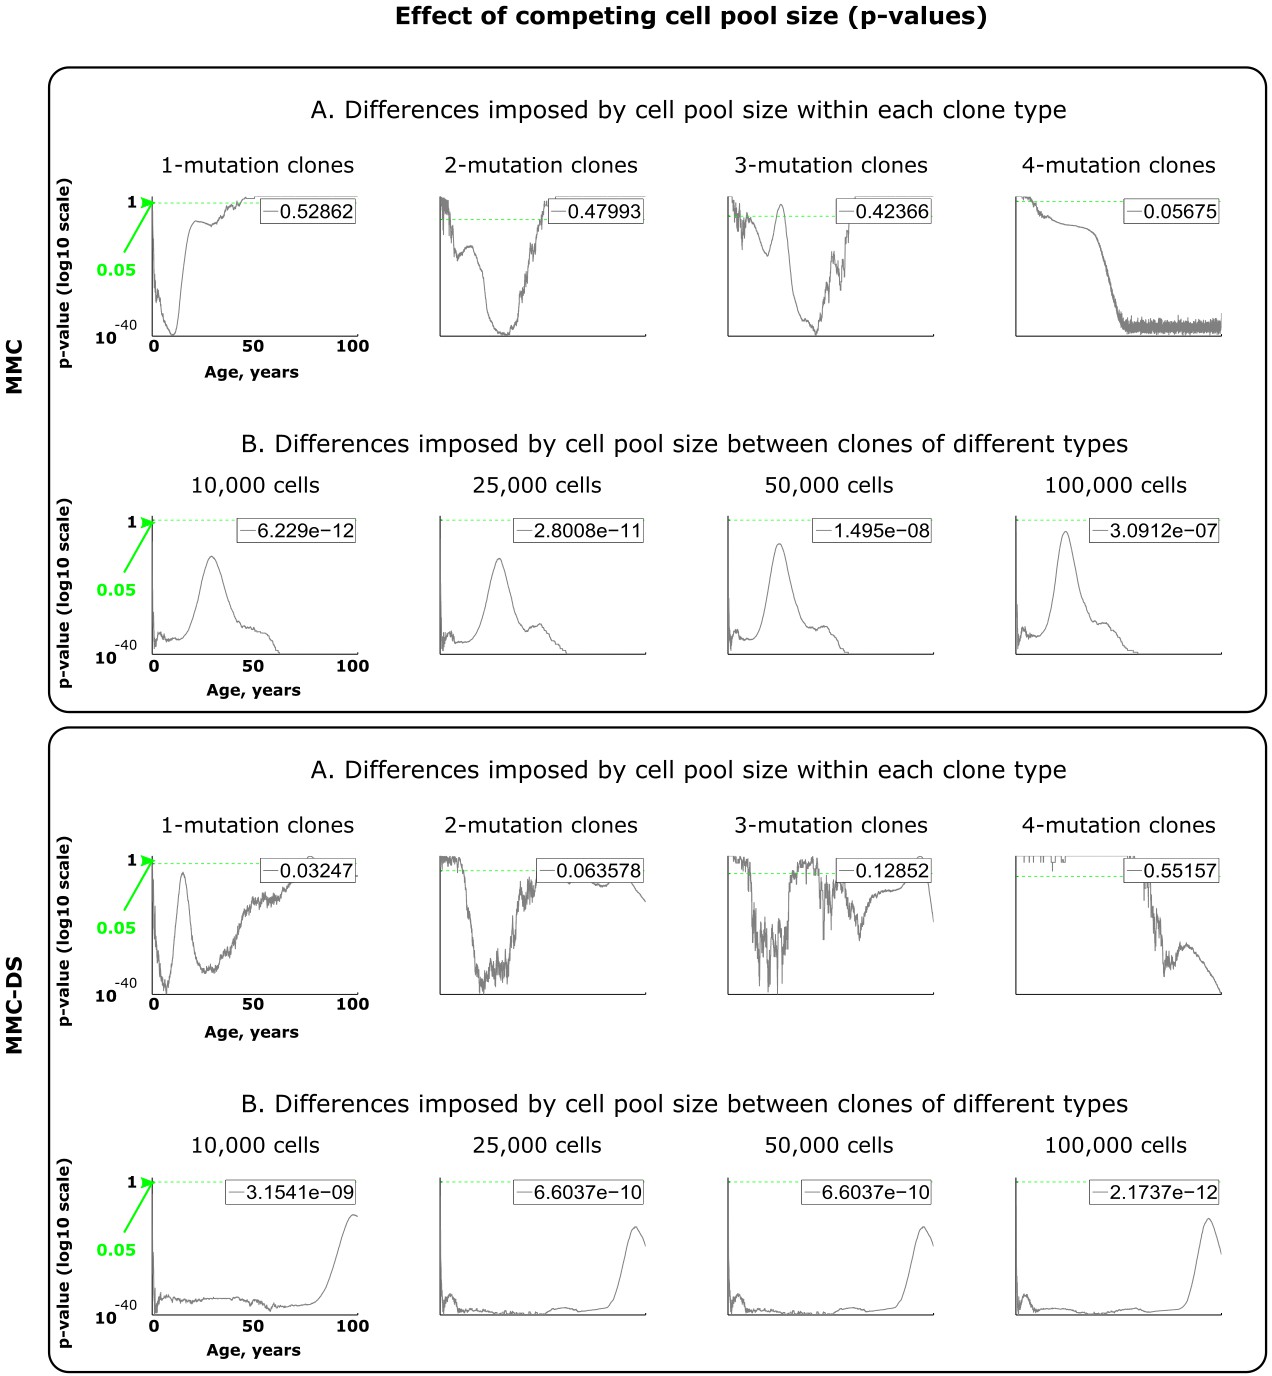
Results of statistical comparisons related to testing the effect of adult cell pool size.
Interpretation as explained in Figure 2—figure supplement 1 and Materials and methods.
Figure 4—figure supplement 3
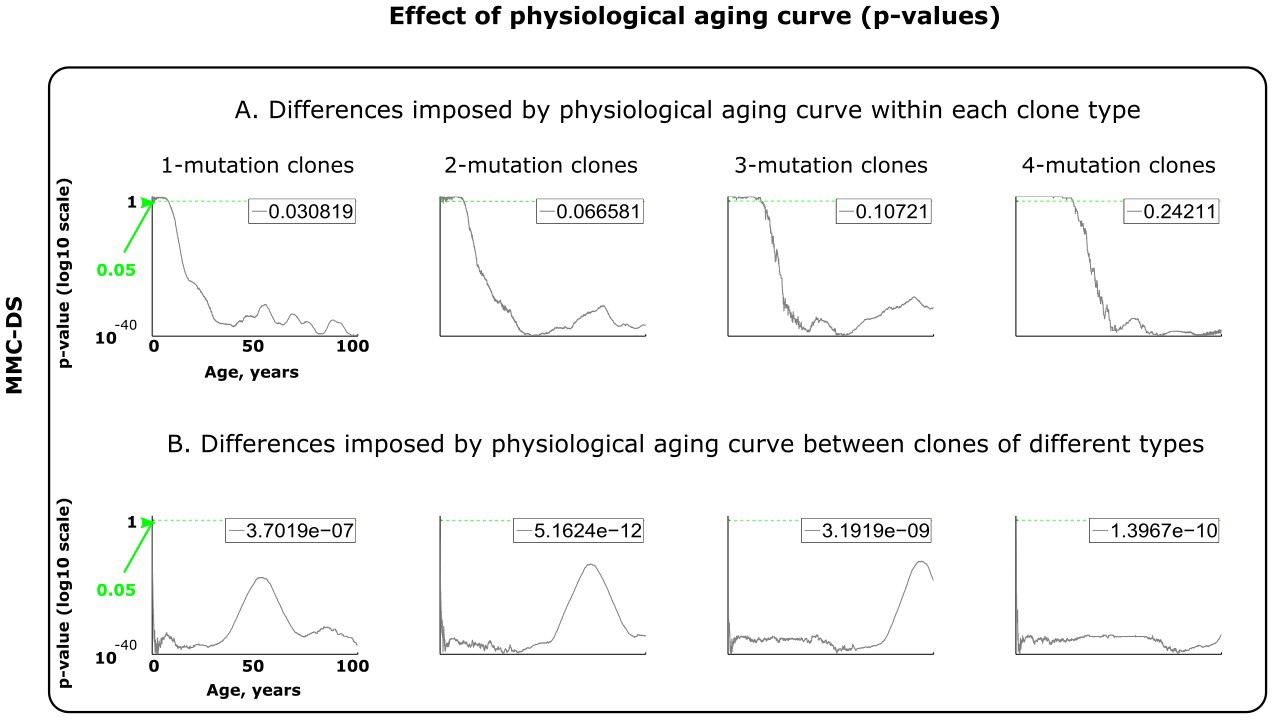
Results of statistical comparisons related to testing the effect of physiological aging curve (a proxy for lifespan).
Interpretation as explained in Figure 2—figure supplement 1 and Materials and methods.
Figure 5
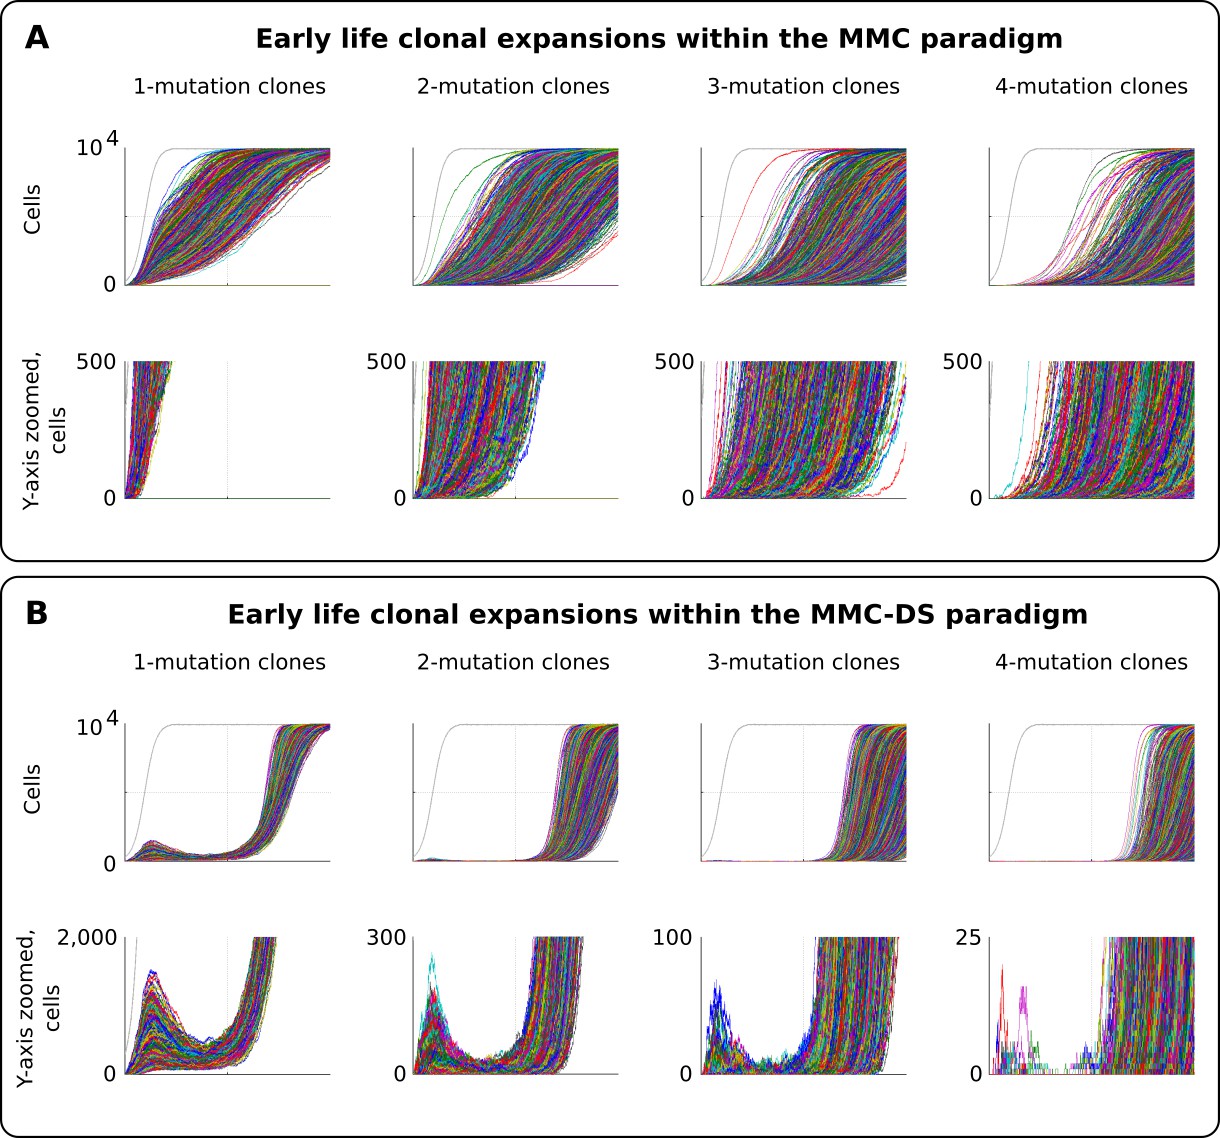
Clonal dynamics promoted by somatic driver mutations in early developing HSC pools.
(A) The MMC model demonstrates an uninterrupted increase in mutant clone frequencies over time. Other parameters as listed in Standard parameter set MMC, Standard parameter sets, Supplementary Materials. (B). The MMC-DS model demonstrates early peak frequencies of mutant clones which are later suppressed by purifying selection acting throughout the early half of the simulated lifespan. Other parameters as listed in Standard parameter set MMC-DS, Standard parameter sets, Supplementary Materials.
Figure 6
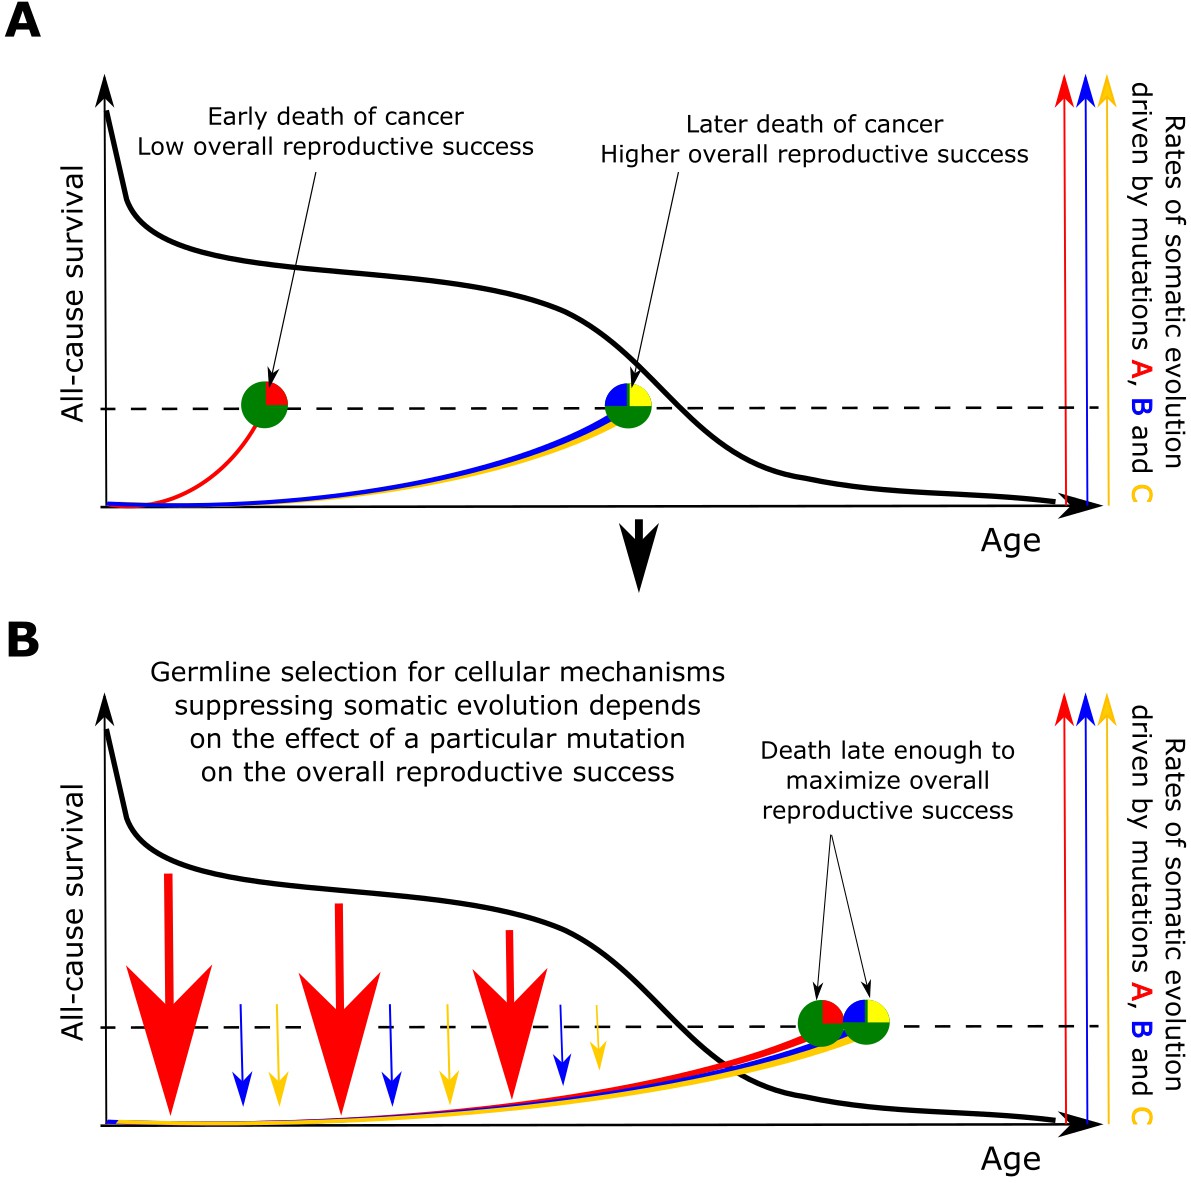
The principle proposed to underlie fundamental properties of somatic evolution in animal bodies.
(A) The effect of somatic evolution on germline evolution. Any particular somatic mutation can range on a scale from no health risk to a threat of early death. Green circles represent individual animals; red, yellow and blue are somatic mutations. The red mutation confers high risk of carcinogenesis causing early death (dashed line represents lethal threshold from somatic evolution). The red mutation thus has a profound effect on overall individual reproductive success. The yellow and blue somatic mutations need to cooperate to cause a lethal effect, which delays somatic evolution driven by them, as shown by our modeling results and earlier postulated by Armitage and Doll (Armitage and Doll, 1954). Therefore, the yellow and blue mutations have lower impact on reproductive success. As reproductive success is the universal equalizer impacting organismal fitness, germline selection acts to buffer the cellular effects of the red mutation differently than it acts on the effects of the yellow and blue mutation. (B). As a result of germline selection, based on the impact of each mutation on reproductive success, stronger tumor suppressive mechanisms evolve to limit the negative impacts of the red mutation. This effect is quantitative in that the differential amount of germline selection acting on a particular mutation depends on the degree of decrease in the overall reproductive success conferred by each mutation’s health risk. The resulting tumor suppression mechanisms delay cancer risk. However, such a delay cannot extend significantly beyond the ages when most of the population would be dead for other reasons, as the cost of developing tumor suppressor mechanisms is no longer compensated by the benefit of higher overall reproductive success at these later ages. Such a model implies that germline selection for tumor suppressive mechanisms is somatic mutation-specific and species-specific.
Additional files
-
Supplementary file 1
Model Matlab code.
- https://doi.org/10.7554/eLife.39950.015
-
Transparent reporting form
- https://doi.org/10.7554/eLife.39950.016
Download links
A two-part list of links to download the article, or parts of the article, in various formats.
Downloads (link to download the article as PDF)
Open citations (links to open the citations from this article in various online reference manager services)
Cite this article (links to download the citations from this article in formats compatible with various reference manager tools)
A generalized theory of age-dependent carcinogenesis
eLife 8:e39950.
https://doi.org/10.7554/eLife.39950


