Molecular pathway analysis towards understanding tissue vulnerability in spinocerebellar ataxia type 1
- Yale School of Medicine, Unites States
Figures
Figure 1
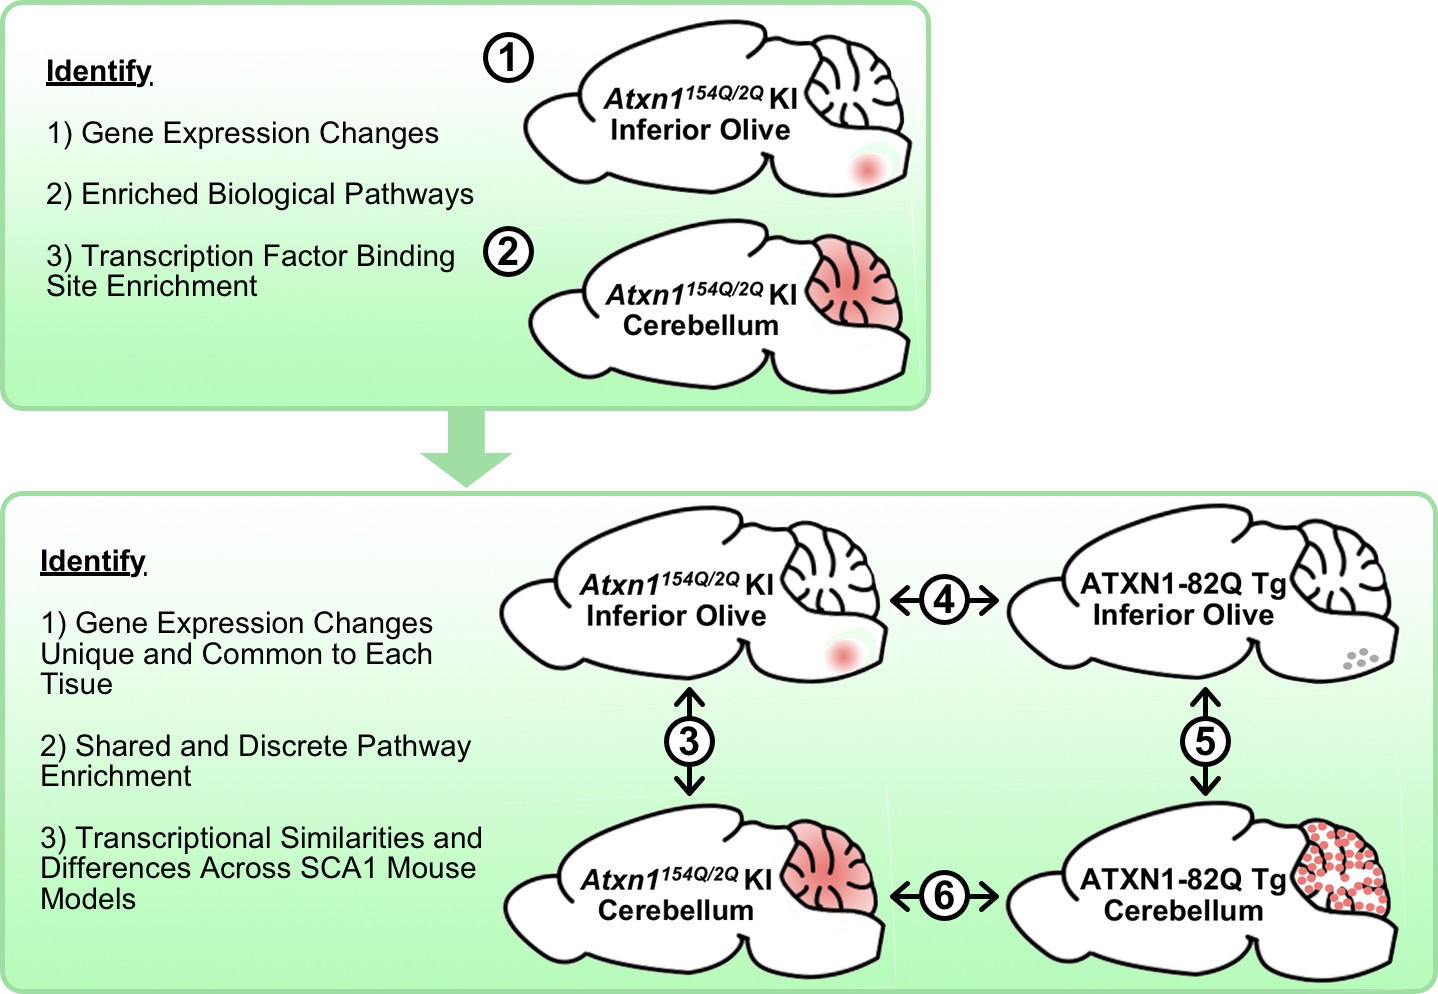
Schematic illustrating the cross-tissue and cross-model comparisons conducted to identify common and unique molecular alterations across SCA1 affected tissues.
Transcriptomics data from Atxn1154Q/2Q KI inferior olive and cerebellum were first analyzed individually (1-2) before comparing the two tissues (3). Using the ATXN1-82Q Tg inferior olive, comparison of the Atxn1154Q/2Q KI and ATXN1-82Q Tg inferior olive was assessed (4) before evaluating similarities and differences between ATXN1-82Q Tg affected tissues (5). Finally, a cerebellar cross-model comparison was conducted (6).
Figure 2 with 4 supplements

Defense Response-related genes are significantly enriched in the 12 week old Atxn1154Q/2Q KI inferior olive.
(A) PolyQ-expanded Atxn1 is expressed in the inferior olive of Atxn1154Q/2Q KI mice (n = 2 animals per genotype). * marks Atxn1-2Q and ** marks Atxn1-154Q. (B) Illustration of the brain region examined. (C) Total number of up- and down-regulated genes in the Atxn1154Q/2Q KI inferior olive (FDR p-value < 0.05; n = 3 males per genotype). (D) Biological pathway enrichment for all differentially regulated inferior olive genes. X-axis marks enrichment score, with the significance cut-off marked by the vertical black line (p-value < 0.05), in this and all following graphs unless mentioned otherwise. (E) Interferon Stimulated Genes (ISGs) are significantly up-regulated in Atxn1154Q/2Q KI. Orange coloring marks up-regulated genes. (F) Validation of up-regulated ISGs in 12 week old Atxn1154Q/2Q KI inferior olive using RT-qPCR. All samples normalized to Gapdh and Actb reference genes. n = 3 males per group. *** p-value < 0.001. Error bars indicate SEM in this and all following graphs. (G) Immunofluorescence staining for Iba1-positive cell counts and Gfap fluorescence intensity imaged in the 12 week old Atxn1154Q/2Q KI and WT control inferior olives. Scale bar is 300 µm. (H) Iba1 cell body counts and Gfap fluorescence intensity quantified relative to WT controls as a percentage. *p < 0.05; t-test; n.s. = non significant (n = 3 males and females per genotype). (I) Irf7 mRNA expression is significantly up-regulated in BV2 cells expressing human ATXN1-82Q (*p < 0.05, t-test; n = 4 wells per condition).
-
Figure 2—source data 1
5 week old Atxn1154Q/2Q KI inferior olive functional annotation clustering enrichment analysis.
- https://doi.org/10.7554/eLife.39981.008
-
Figure 2—source data 2
Functional annotation enrichment analysis for the 12 week old Atxn1154Q/2Q KI inferior olive.
- https://doi.org/10.7554/eLife.39981.009
-
Figure 2—source data 3
Upstream regulators for differentially regulated 12 week old Atxn1154Q/2Q KI inferior olive genes.
- https://doi.org/10.7554/eLife.39981.010
-
Figure 2—source data 4
5 week old Atxn1154Q/2Q KI inferior olive enriched pathways for cross time-point overlap with EnrichmentMap (enrichment FDR p-value < 0.05).
- https://doi.org/10.7554/eLife.39981.011
-
Figure 2—source data 5
12 week old Atxn1154Q/2Q KI Inferior Olive enriched patwhays for cross-time point overlap with EnrichmentMap.
- https://doi.org/10.7554/eLife.39981.012
Figure 2—figure supplement 1
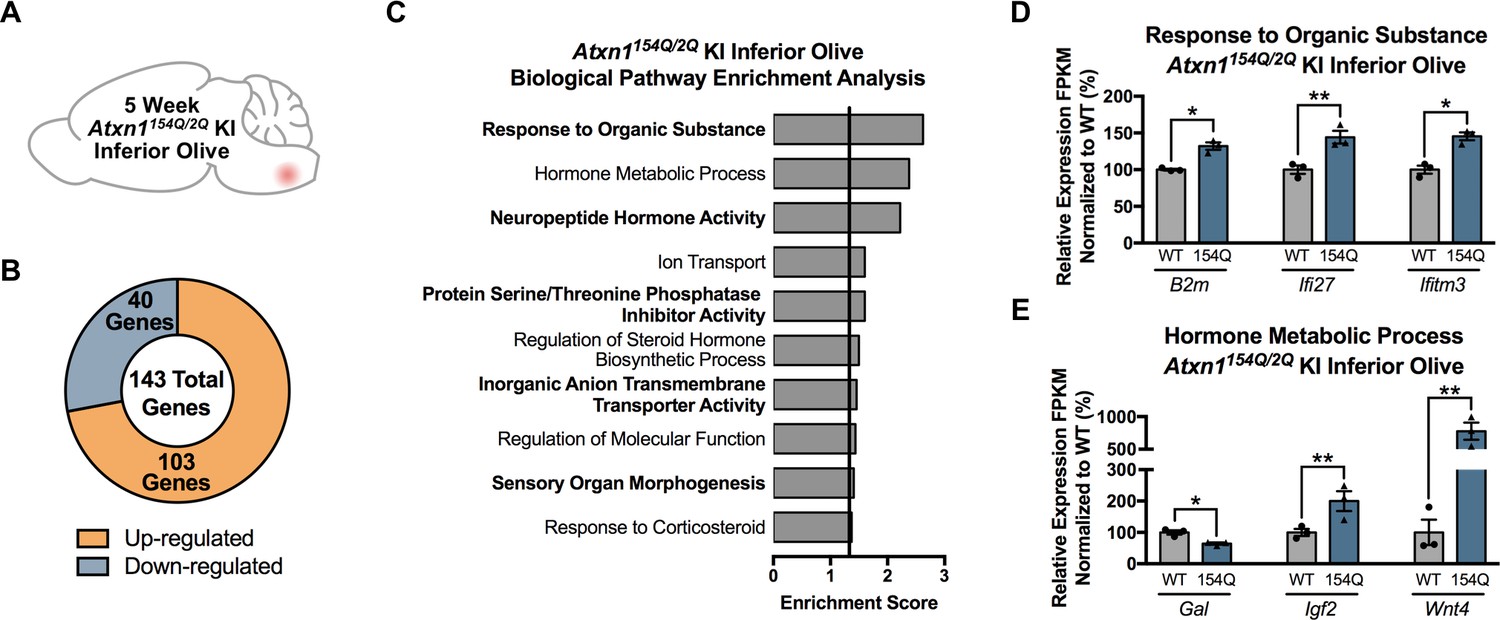
Response to Organic Substance and Hormone Metabolic Process genes are differentially regulated in the 5 week old Atxn1154Q/2Q KI inferior olive.
(A) Illustration of the tissue examined. (B) Total number of up- and down-regulated genes in Atxn1154Q/2Q KI inferior olive at 5 weeks of age (FDR p-value < 0.05; n = 3 males per genotype). (C) Biological pathway enrichment for all differentially regulated inferior olive genes. X-axis marks enrichment score, with the significance cut-off marked by the vertical black line (p-value < 0.05). Genes with an FDR p-value < 0.05 were used to generate the enriched pathway list. (D) Response to Organic Substance and (E) Hormone Metabolic Process-related genes are largely up-regulated. Y-axis represents the normalized FPKM expression of each gene relative to control samples as a percentage. (* FDR p-value < 0.05; ** FDR p-value < 0.01; n = 3 males per genotype used in RNA-seq).
Figure 2—figure supplement 2
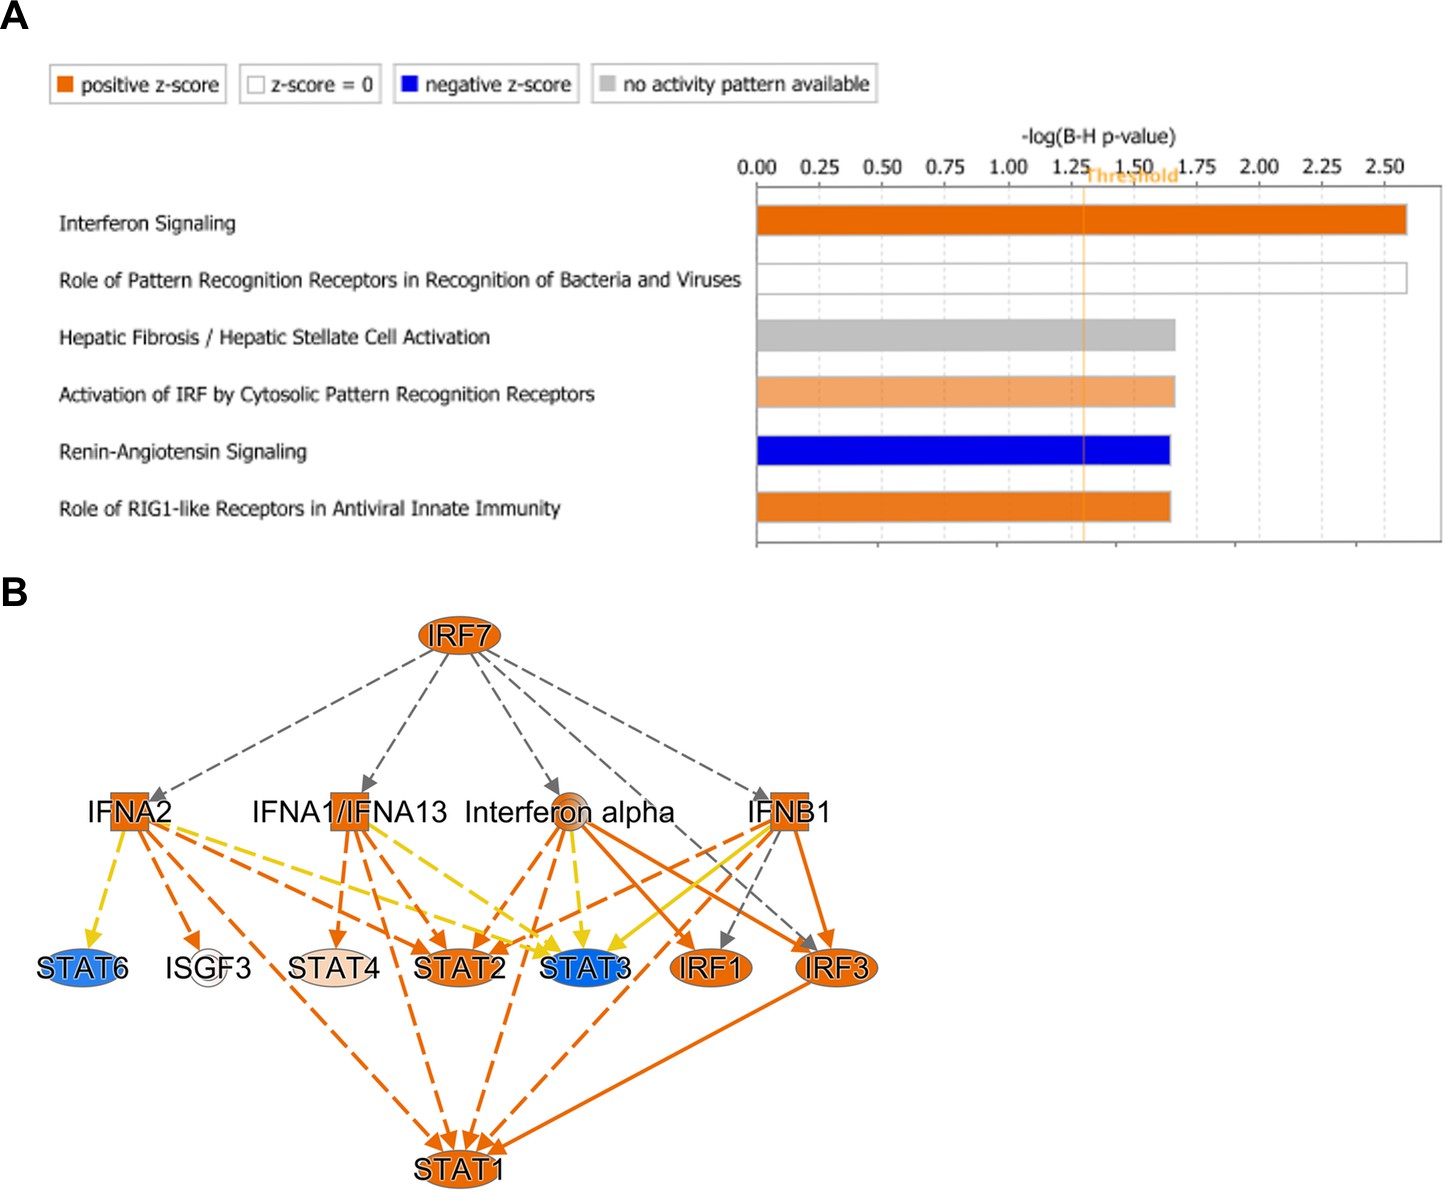
Features of the Defense Response, including Interferon Signaling and IRF Activation, are predicted to have increased activity in the 12 week old Atxn1154Q/2Q KI inferior olive.
(A) Biological pathway enrichment using Qiagen’s IPA in the 12 week old Atxn1154Q/2Q KI inferior olive differentially expressed genes. X-axis marks the enrichment score using a Benjamini-Hochberg corrected p-value. Bars that surpass the vertical threshold at 1.3 indicate significant enrichment for that pathway. Orange coloring indicates IPA-predicted activation of that pathway, while blue suggests possible inhibition based on z-score. Grey is not predicted. (B) Predicted upstream regulators for all differentially expressed Atxn1154Q/2Q KI inferior olive genes at 12 weeks. Orange nodes indicate predicted activation of those transcriptional regulators, blue indicates predicted suppression, and grey has no predicted activation or inhibition. Orange edges connecting transcriptional regulators indicate predicted activation, yellow are findings inconsistent with previous research, and grey is not predicted.
Figure 2—figure supplement 3
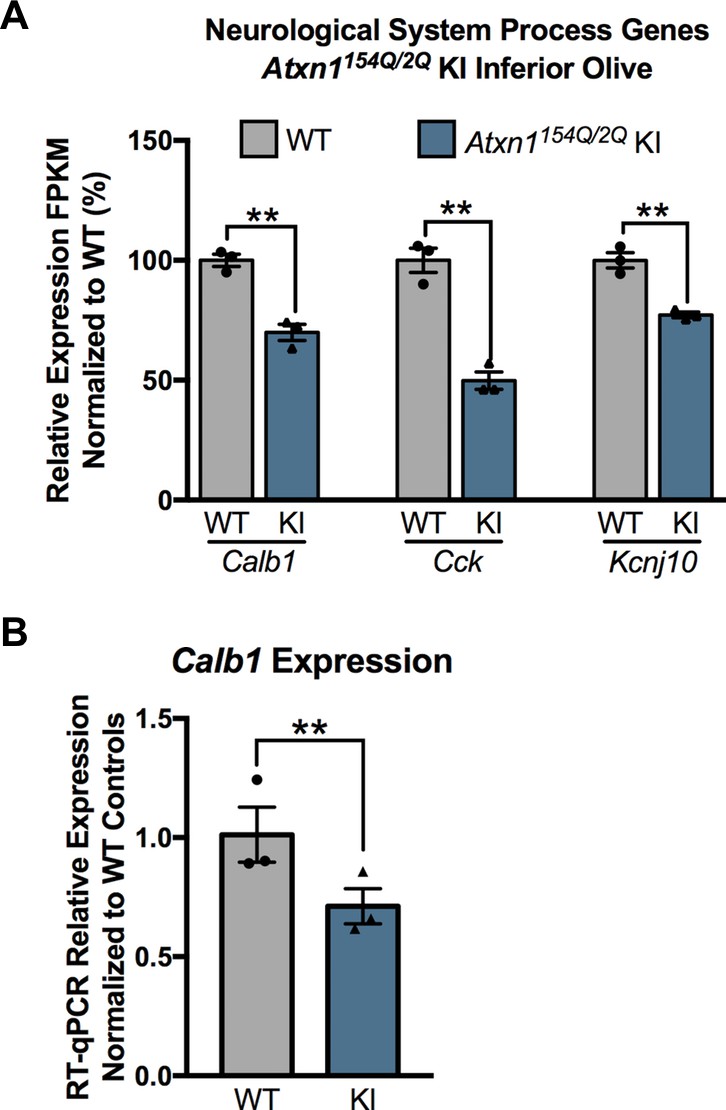
Subset of genes associated with the enriched biological pathway Neurological System Process are down-regulated in the 12 week old Atxn1154Q/2Q KI inferior olive.
(A) Down-regulated genes within the Neurological System Process pathway (** FDR p-value < 0.01; n = 3 males per genotype used in RNA-seq analysis). (B) Validation of Calb1 down-regulation using RT-qPCR. All samples were normalized to Gapdh and Actb reference genes (** p-value < 0.01 t-test; n = 3 males per genotype).
Figure 2—figure supplement 4
Divergent gene expression changes and minimal biological pathway overlap in the temporal comparison of the Atxn1154Q/2Q KI inferior olive.
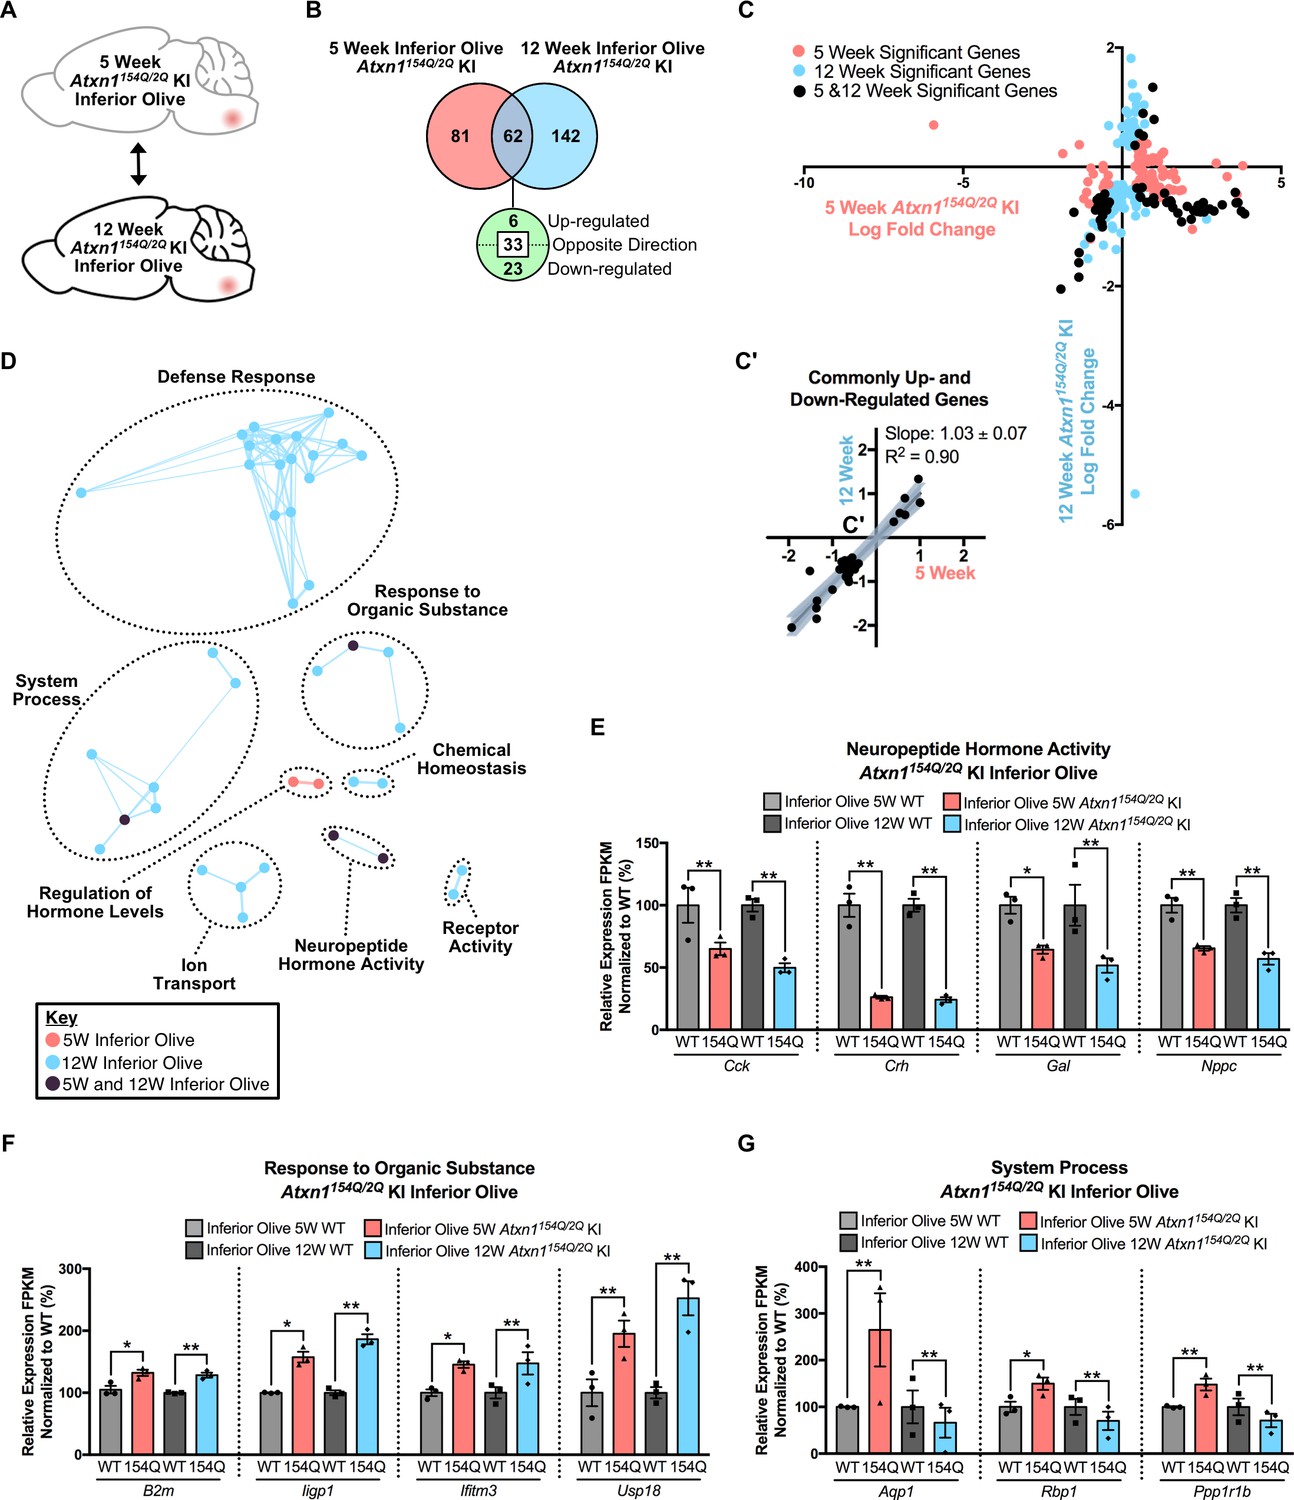
(A) Schematic of the time-point comparison in Atxn1154Q/2Q KI inferior olive between 5 and 12 weeks. (B) Total number of differentially regulated genes in the Atxn1154Q/2Q KI inferior olive relative to appropriate WT controls that are common, and uniquely altered, across time-points (FDR p-value < 0.05; n = 3 males per genotype for RNA-seq). (C) Dot plot of log fold changes for genes altered in the 5 and 12 week Atxn1154Q/2Q KI inferior olive. X-axis marks log fold change values in the 5 week Atxn1154Q/2Q KI, and the Y-axis marks log fold change values for the 12 week dataset. Pink nodes mark genes significantly altered only at the 5 week time-point, blue nodes mark genes significantly altered only at the 12 week time-point, and black marks genes significant at both time-points. (C') Log fold change of genes up- or down-regulated at both the 5 week and 12 week time-points only. Linear regression analysis identified the slope and R2 of these log fold changes (slope = 1.03 ± 0.07; R2 = 0.90). A total of 29 genes were plotted in this analysis. (D) Clustering of GO terms identified from the Atxn1154Q/2Q KI inferior olive 5 week and 12 week differentially regulated gene lists relative to the appropriate WT controls. (E) A subset of genes associated with Neuropeptide Hormone Activity were commonly down-regulated at each time-point. (F) A subset of Response to Organic Substance genes were up-regulated, and (G) some System Process-related genes were dysregulated when assessed in the 5 and 12 week time-point. * FDR p-value < 0.05; ** FDR p-value < 0.01.
Figure 3 with 4 supplements
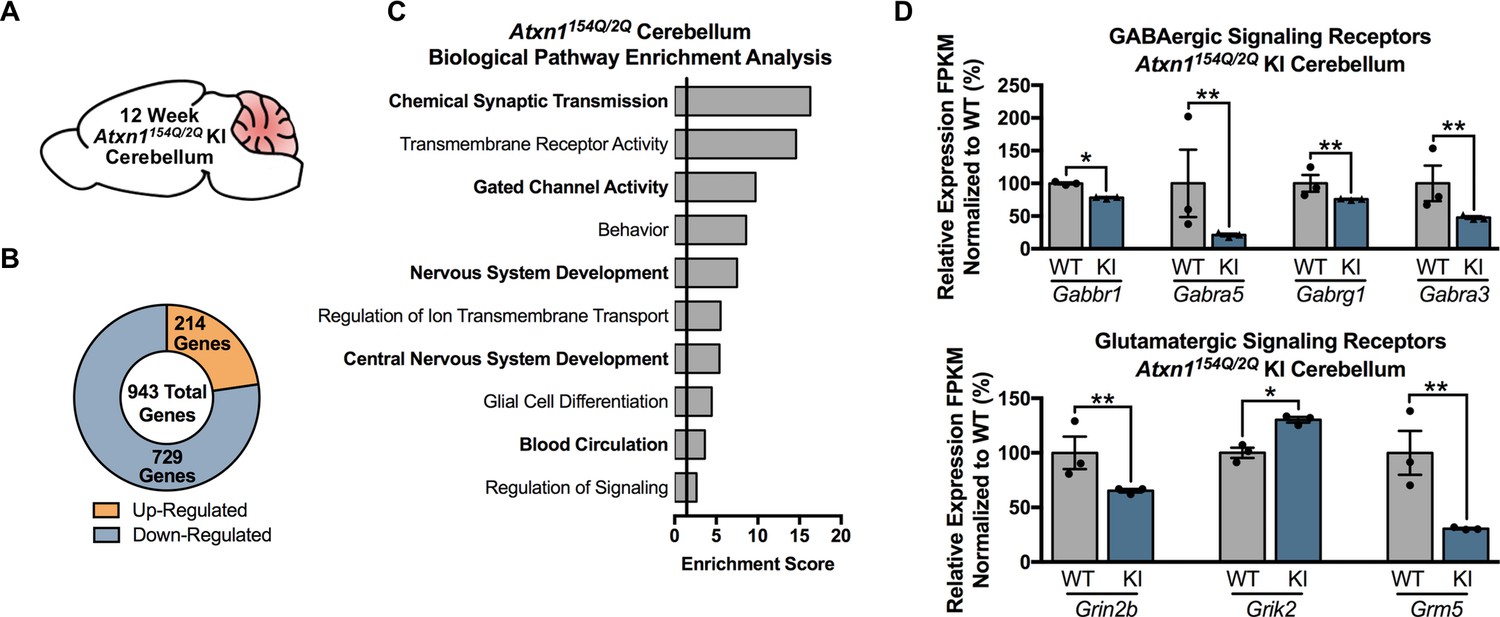
Chemical Synaptic Transmission genes, including GABAergic and glutamatergic genes, are differentially regulated in the 12 week old Atxn1154Q/2Q KI cerebellum.
(A) Illustration of the tissue examined. (B) Total number of up- and down-regulated genes in the 12 week old Atxn1154Q/2Q KI cerebellum (FDR p-value < 0.05; n = 3 males per genotype for RNA-seq). (C) Biological pathway enrichment for all differentially regulated cerebellar genes. (D) GABAergic and glutamatergic receptors and receptor subunits are altered in the cerebellum (* FDR p-value < 0.05; ** FDR p-value < 0.01; n = 3 males per group).
-
Figure 3—source data 1
5 week old Atxn1154Q/2Q KI cerebellum functional annotation clustering (differentially expressed genes FDR p-value < 0.05).
- https://doi.org/10.7554/eLife.39981.019
-
Figure 3—source data 2
12 week old Atxn1154Q/2Q KI cerebellum functional annotation enrichment analysis.
- https://doi.org/10.7554/eLife.39981.020
-
Figure 3—source data 3
5 week old Atxn1154Q/2Q KI cerebellum functional annotation enrichment analysis (using nominal p-value < 0.01 for genes).
- https://doi.org/10.7554/eLife.39981.021
-
Figure 3—source data 4
Atxn1154Q/2Q KI Cerebellum 5 weeks enrichment chart edited for EnrichmentMap (nominal p-value < 0.01).
- https://doi.org/10.7554/eLife.39981.022
-
Figure 3—source data 5
12 week old Atxn1154Q/2Q KI cerebellum enrichment chart edited for EnrichmentMap (FDR p-value < 0.05).
- https://doi.org/10.7554/eLife.39981.023
Figure 3—figure supplement 1
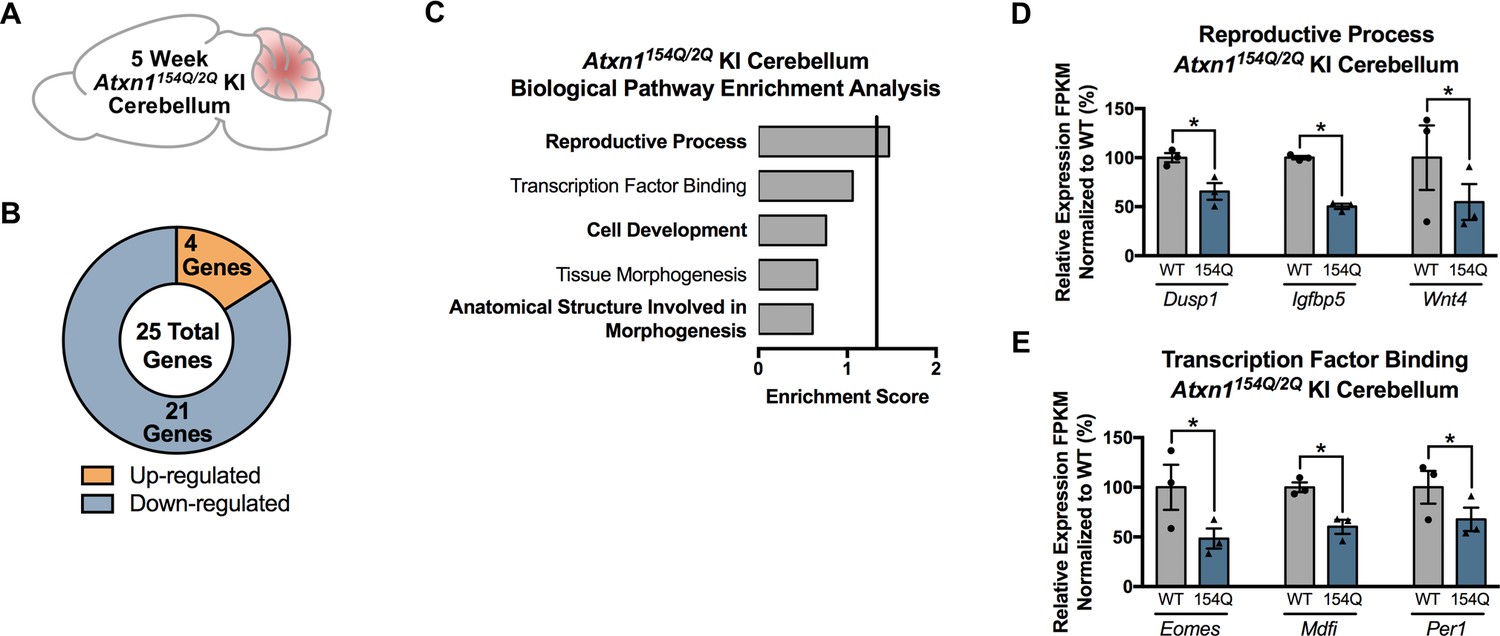
Few genes and pathways are significantly enriched in the 5 week Atxn1154Q/2Q KI cerebellum.
(A) Illustration of the tissue examined. (B) Total number of up- and down-regulated genes in Atxn1154Q/2Q KI cerebellum at 5 weeks of age (FDR p-value < 0.05; n = 3 males per genotype for RNA-seq). (C) Biological pathway enrichment for all differentially regulated genes in the 5 week old Atxn1154Q/2Q KI cerebellum. (D) Reproductive Process and (E) Transcription Factor Binding-related genes are largely down-regulated in the 5 week Atxn1154Q/2Q KI cerebellum. * FDR p-value < 0.05 (n = 3 males per genotype used in RNA-seq).
Figure 3—figure supplement 2
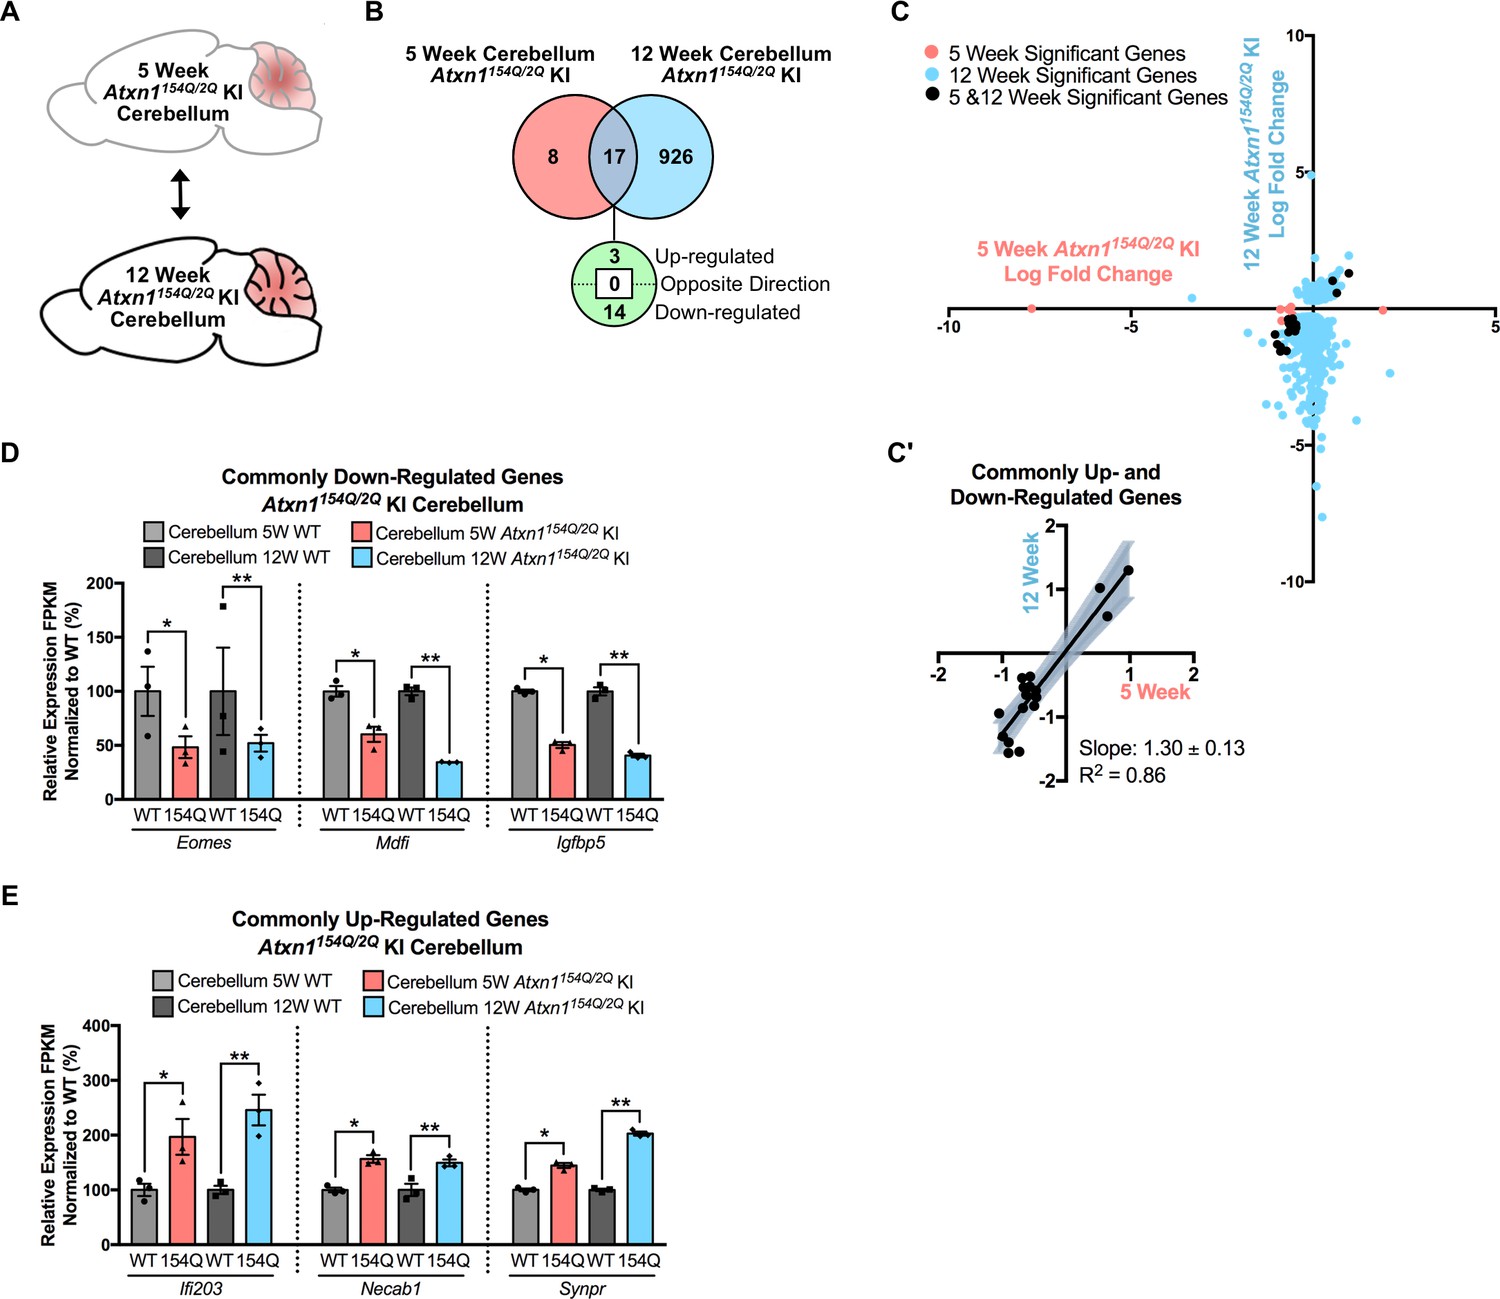
Consistent gene expression changes in the Atxn1154Q/2Q KI cerebellum across the 5 and 12 week time-points.
(A) Schematic of the time-point comparison in Atxn1154Q/2Q KI cerebellum. (B) Total number of differentially regulated genes in the Atxn1154Q/2Q KI cerebellum that are commonly altered in both the 5 and 12 week time-point relative to appropriate WT controls (FDR p-value < 0.05; n = 3 males per genotype for RNA-seq). (C) Dot plot of log fold changes for genes altered in the 5 and 12 week Atxn1154Q/2Q KI cerebellum. (C') Log fold change of genes up- or down-regulated at both the 5 week and 12 week time-points only. Linear regression analysis identified the slope and R2 of these log fold changes (slope = 1.30 ± 0.13; R2 = 0.86). A total of 17 genes were plotted in this analysis. (D) A subset of genes were commonly down-regulated and (E) commonly up-regulated at both time-points. * FDR p-value < 0.05; ** FDR p-value < 0.01 (n = 3 males per genotype for each time-point).
Figure 3—figure supplement 3

Nominally significant differentially regulated genes in the 5 week old Atxn1154Q/2Q KI cerebellum overlapped with previously published microarray datasets and revealed significantly enriched pathways.
(A) Subset of genes with a nominal p-value < 0.01 that overlapped with a previously published dataset (* nominal p-value < 0.01 but FDR p-value > 0.05; n = 3 males per genotype used in RNA-seq). (B) Total number of up- and down-regulated genes in Atxn1154Q/2Q KI cerebellum at 5 weeks of age (p-value < 0.01; n = 3 males per genotype for RNA-seq). (C) Biological pathway enrichment for all differentially regulated cerebellum genes with a nominal p-value < 0.01.
Figure 3—figure supplement 4
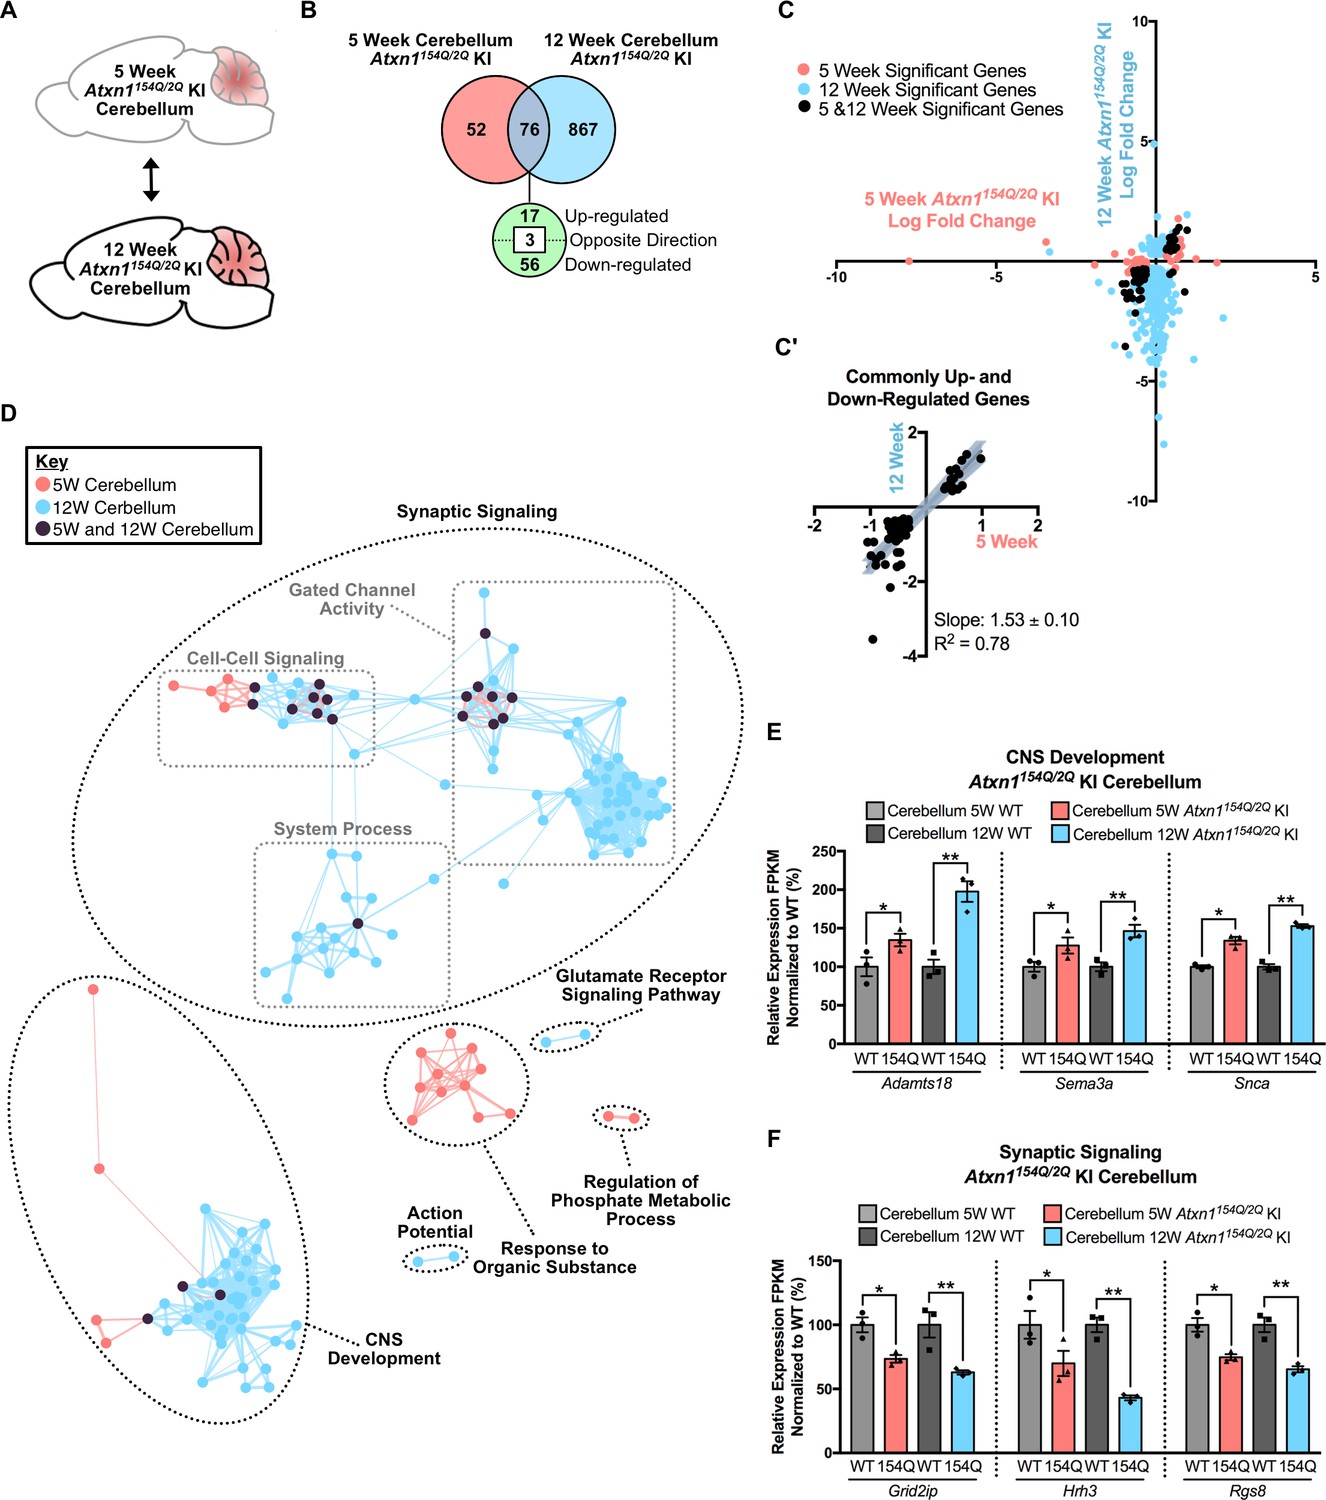
Consistent gene expression changes and pathway enrichment in the 5 week and 12 week Atxn1154Q/2Q KI cerebellum with an expanded 5 week p-value cutoff.
(A) Schematic of the time-point comparison in Atxn1154Q/2Q KI cerebellum. (B) Total number of differentially regulated genes in the Atxn1154Q/2Q KI cerebellum relative to appropriate WT controls that are common, and uniquely altered, in each time-point (nominal p-value < 0.01 for 5 week dataset; FDR p-value < 0.05 for 12 week dataset; n = 3 males per genotype for each time-point for RNA-seq). (C) Dot plot of log fold changes for genes altered in the 5 and 12 week Atxn1154Q/2Q KI cerebellum. Nominal p < 0.01 for the 5 week dataset, FDR p-value < 0.05 for the 12 week dataset. (C') Log fold change of genes up- or down-regulated in both the 5 week and 12 week time-points only. Dysregulated gene were excluded from this analysis. Linear regression analysis identified the slope and R2 of these log fold changes (slope = 1.53 ± 0.10; R2 = 0.78). A total of 73 genes were plotted in this analysis. (D) Clustering of GO terms identified from the Atxn1154Q/2Q KI cerebellum 5 week and 12 week differentially regulated gene lists relative to the appropriate WT controls. For this analysis, genes with a nominal p-value < 0.01 were used to generate the GO list for the 5 week Atxn1154Q/2Q KI cerebellum, and FDR p-value < 0.05 was used for the 12 week cerebellum. (E) A subset of genes associated with CNS Development were commonly up-regulated and (F) a subset of Synaptic Signaling genes were commonly down-regulated when assessed in the 5 and 12 week time-point. * nominal p-value < 0.01; ** FDR p-value < 0.01 (n = 3 males per genotype for each time-point).
Figure 4 with 1 supplement
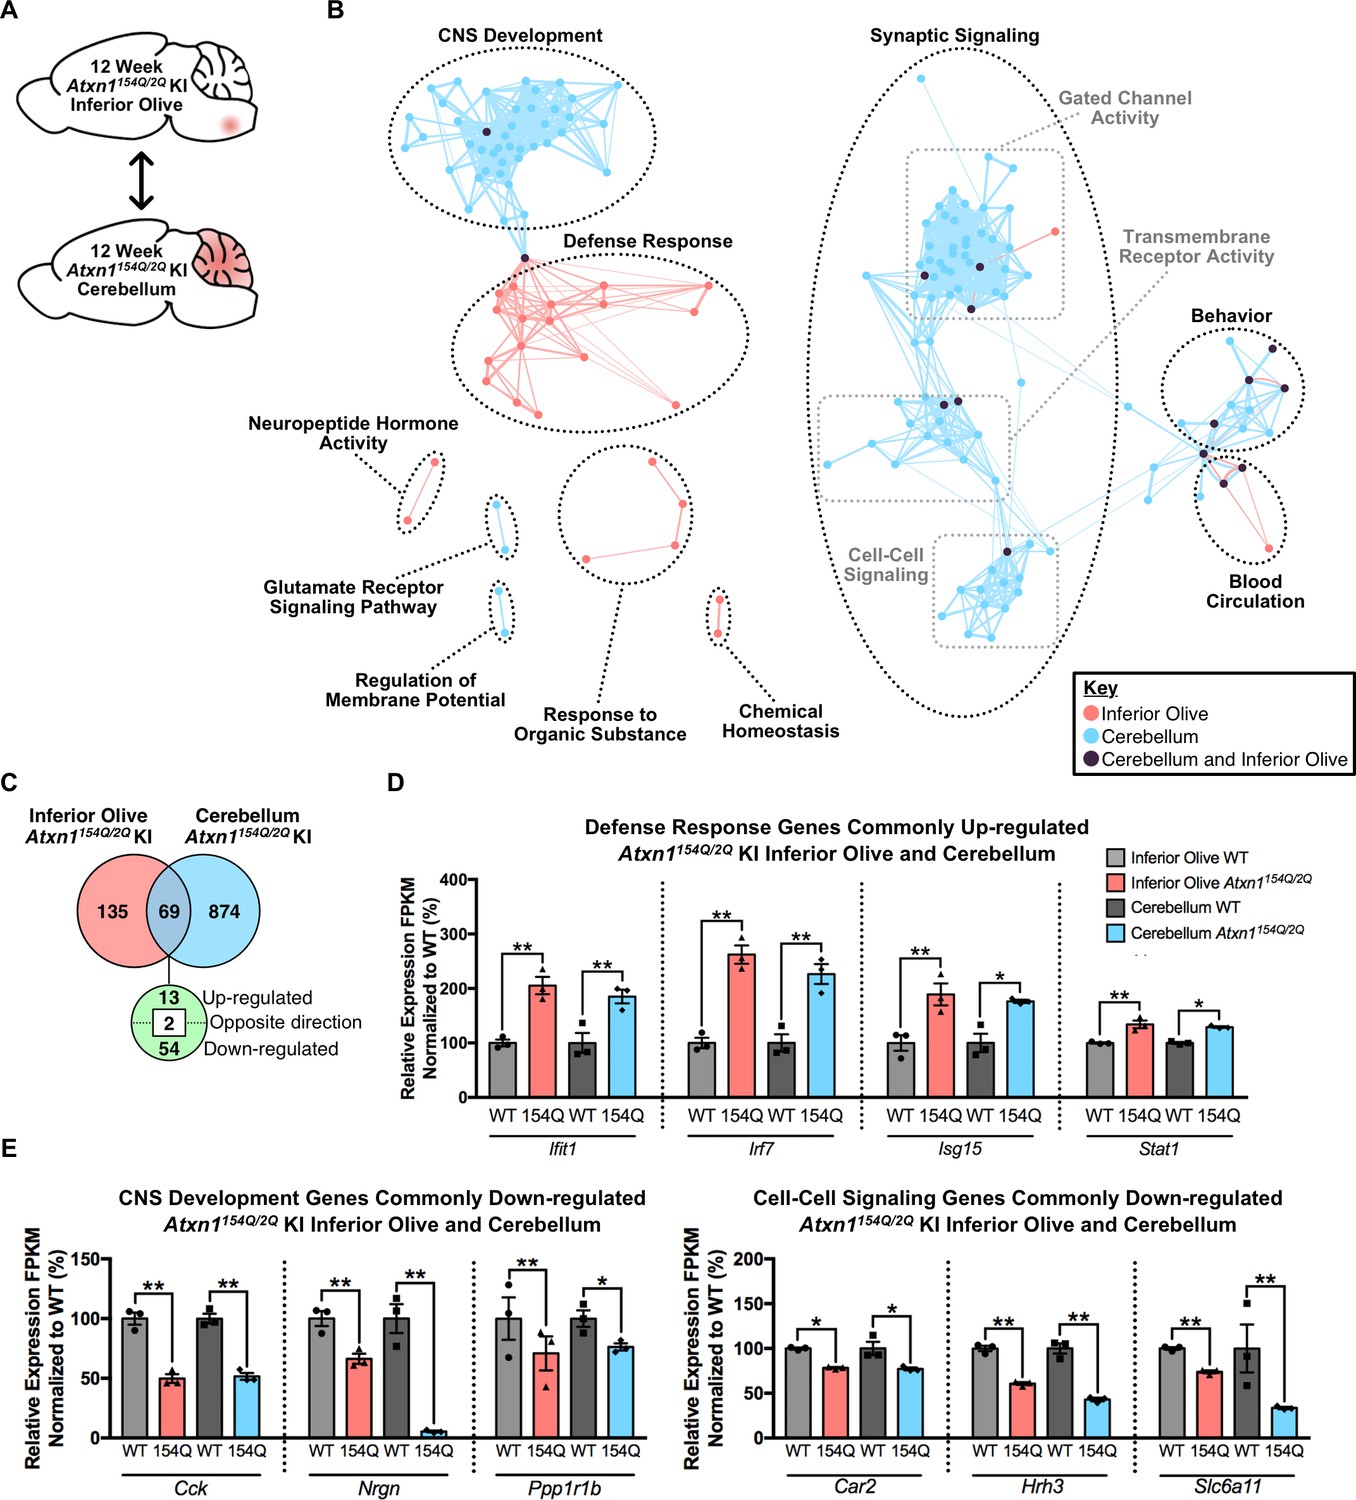
Cross-tissue comparison of pathway enrichment reveals common and unique features of the 12 week old Atxn1154Q/2Q KI inferior olive and cerebellum.
(A) Schematic of the cross-tissue comparison conducted. (B) Clustering of GO terms from the 12 week old inferior olive and cerebellum differentially expressed genes lists. In this and all following figures, nodes represent GO terms and edges connect nodes that share common genes. Edge width corresponds to the number of genes shared between nodes, and edge length represents the similarity coefficient between nodes. Color-coded nodes represent GO terms from either the inferior olive (pink), cerebellum (blue), or GO terms shared by both tissues (purple). All GO terms were significantly enriched within the datasets (FDR p-value < 0.05). (C) Total number of differentially regulated genes that are common, and uniquely altered, in the 12 week old Atxn1154Q/2Q KI inferior olive and cerebellum (FDR p-value < 0.05). (D) A subset of genes commonly up-regulated and (E) commonly down-regulated in both the inferior olive and cerebellum relative to WT controls (* FDR p-value < 0.05; ** FDR p-value < 0.01; n = 3 males per genotype for RNA-seq).
-
Figure 4—source data 1
5 week old Atxn1154Q/2Q KI Inferior Olive enrichment chart for EnrichmentMap (FDR p < 0.05).
- https://doi.org/10.7554/eLife.39981.027
-
Figure 4—source data 2
5 week old Atxn1154Q/2Q KI cerebellum enrichment chart edited for EnrichmentMap (nominal p-value < 0.01).
- https://doi.org/10.7554/eLife.39981.028
-
Figure 4—source data 3
12 week old Atxn1154Q/2Q KI inferior olive enrichment chart for EnrichmentMap.
- https://doi.org/10.7554/eLife.39981.029
-
Figure 4—source data 4
12 week old Atxn1154Q/2Q KI cerebellum enrichment chart for EnrichmentMap.
- https://doi.org/10.7554/eLife.39981.030
Figure 4—figure supplement 1
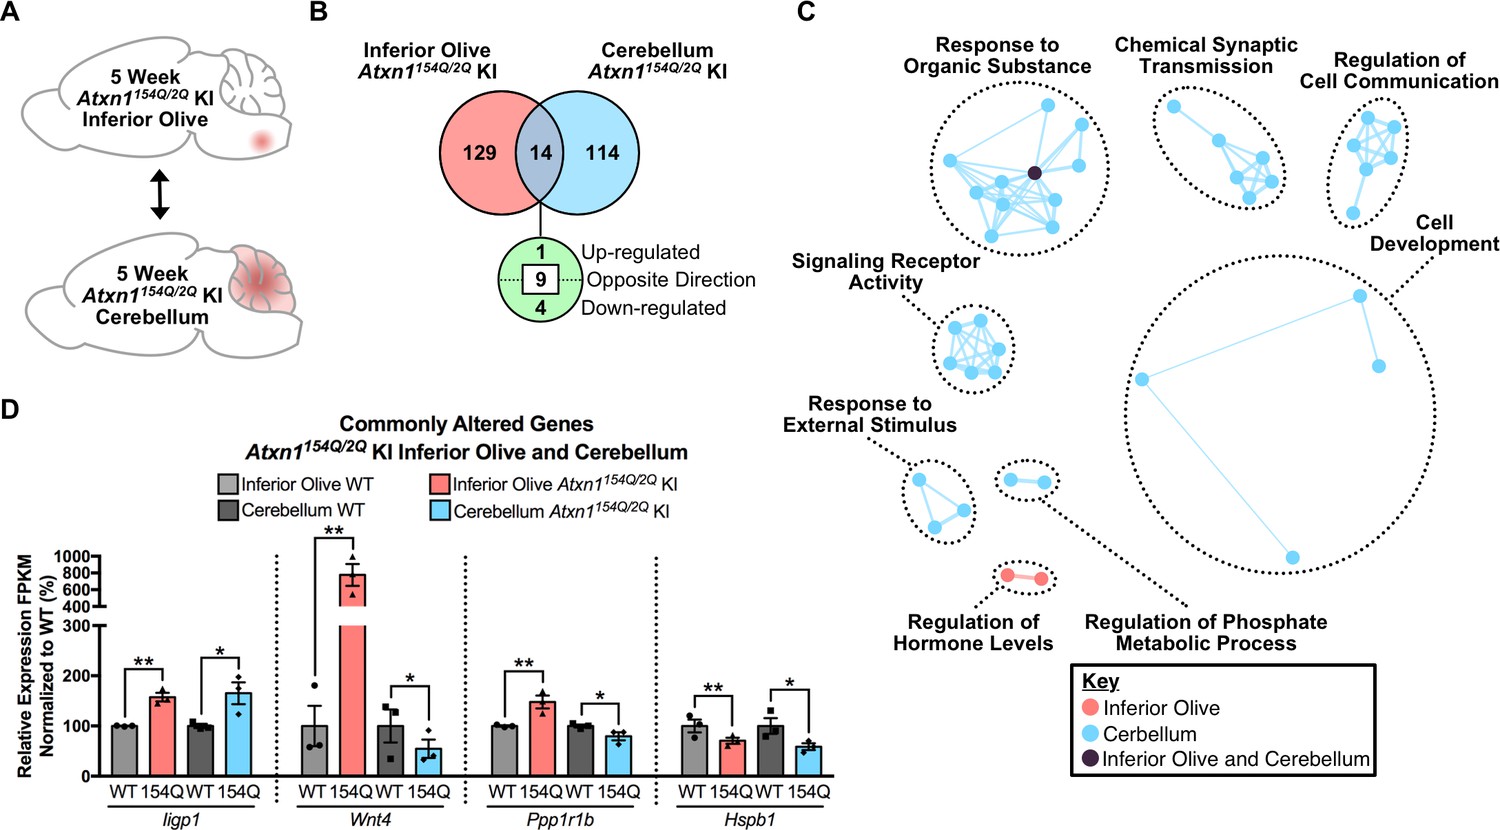
Minimal gene overlap in the 5 week old Atxn1154Q/2Q KI cerebellum and inferior olive in the cross-tissue comparison.
(A) Schematic of the cross-tissue comparison in the 5 week old Atxn1154Q/2Q KI inferior olive and cerebellum. (B) Total number of differentially regulated genes in the Atxn1154Q/2Q KI inferior olive and cerebellum relative to appropriate WT controls that are common, and uniquely altered, in each tissue (nominal p-value < 0.01 for cerebellum dataset; FDR p-value < 0.05 for inferior olive dataset; n = 3 males per genotype for RNA-seq). (C) Clustering of GO terms identified from the Atxn1154Q/2Q KI cerebellum and inferior olive differentially regulated gene lists relative to the appropriate WT controls. For cerebellum, nominal p-value < 0.01 was used to generate the list of enriched pathways, while FDR p-value < 0.05 was used for the inferior olive. (D) Genes differentially regulated in both the inferior olive and cerebellum relative to the appropriate WT controls were up-regulated, dysregulated, and down-regulated. * nominal p-value < 0.01; ** FDR p-value < 0.01 (n = 3 males per genotype for each time-point).
Figure 5 with 3 supplements

The Defense Response is enriched in both the 12 week old Atxn1154Q/2Q KI inferior olive and ATXN1-82Q Tg inferior olive.
(A) ATXN1 mRNA expression in the 12 week old ATXN1-82Q Tg cerebellum and inferior olive (***p < 0.001, t-test; n = 3 males per genotype). (B) PolyQ-expanded ATXN1 is present in the cerebellum, but not in the inferior olive (n = 2 males per genotype). * marks Atxn1-2Q, ** marks ATXN1-82Q.(C) Schematic of the cross-model, 12 week old inferior olive comparison. (D) Total number of differentially regulated genes that are common, and uniquely altered, in the inferior olive of Atxn1154Q/2Q KI and ATXN1-82Q Tg mice (FDR p-value < 0.05). (E) Clustering of GO terms from the Atxn1154Q/2Q KI and ATXN1-82Q Tg inferior olive differentially expressed genes lists. (F) Heatmap of log fold changes in Defense Response-related genes relative to control littermates from both the 12 week Atxn1154Q/2Q KI and 12 week ATXN1-82Q Tg inferior olive. (G) Total number of differentially regulated genes linked to Defense Response that are common, and uniquely altered, in the 12 week old Atxn1154Q/2Q KI and ATXN1-82Q Tg inferior olive (FDR p-value < 0.05).
-
Figure 5—source data 1
5 week old ATXN1-82Q Tg inferior olive functional annotation clustering analysis.
- https://doi.org/10.7554/eLife.39981.035
-
Figure 5—source data 2
12 week old ATXN1-82Q Tg inferior olive functional annotation clustering.
- https://doi.org/10.7554/eLife.39981.036
-
Figure 5—source data 3
5 week old ATXN1-82Q Tg inferior olive enrichment chart for EnrichmentMap.
- https://doi.org/10.7554/eLife.39981.037
-
Figure 5—source data 4
12 week old ATXN1-82Q Tg inferior olive enrichment chart for EnrichmentMap.
- https://doi.org/10.7554/eLife.39981.038
Figure 5—figure supplement 1
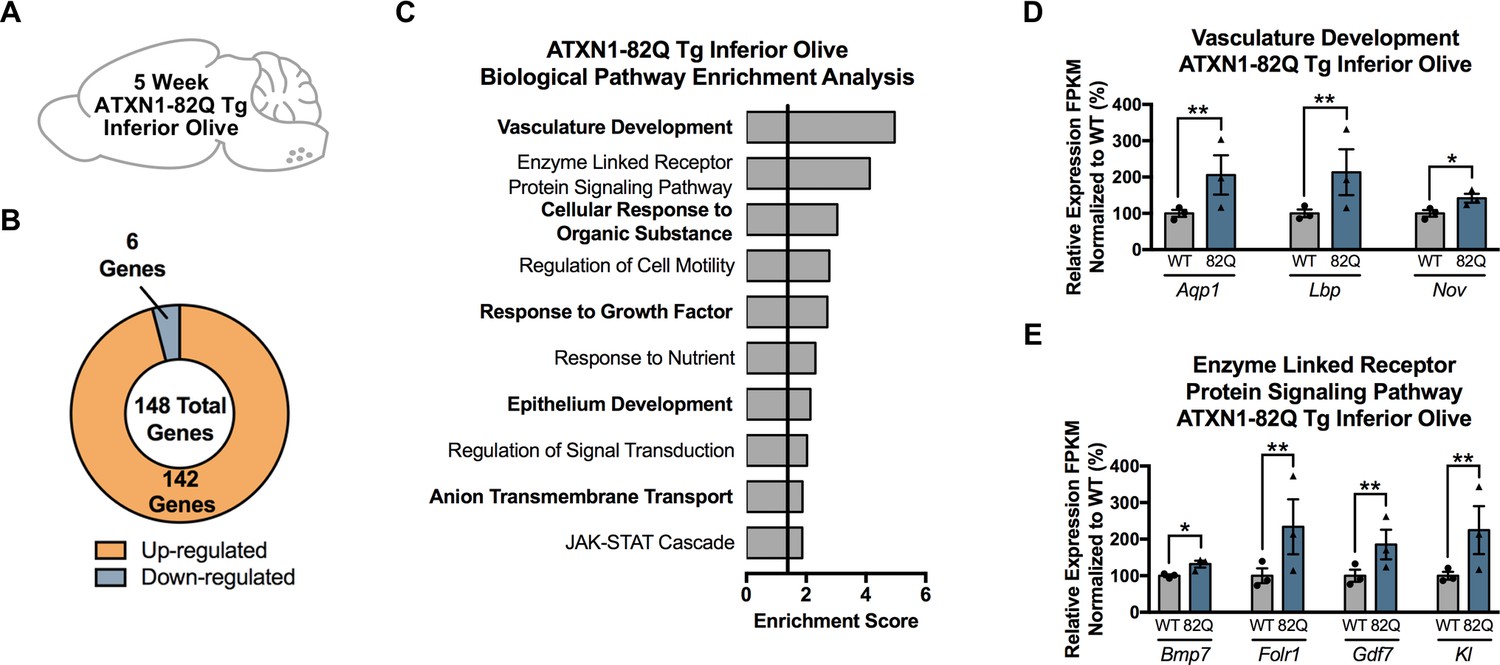
The majority of genes significantly altered in the 5 week ATXN1-82Q Tg inferior olive are up-regulated.
(A) Illustration of the tissue examined. (B) Total number of up- and down-regulated genes in ATXN1-82Q Tg inferior olive at 5 weeks of age (FDR p-value < 0.05; n = 3 males per genotype for RNA-seq). (C) Biological pathway enrichment for all differentially regulated inferior olive genes. (D) Vasculature Development and (E) Enzyme-Linked Receptor Protein Signaling Pathway-related genes are largely up-regulated. * FDR p-value < 0.05; ** FDR p-value < 0.01 (n = 3 males per genotype used in RNA-seq).
Figure 5—figure supplement 2
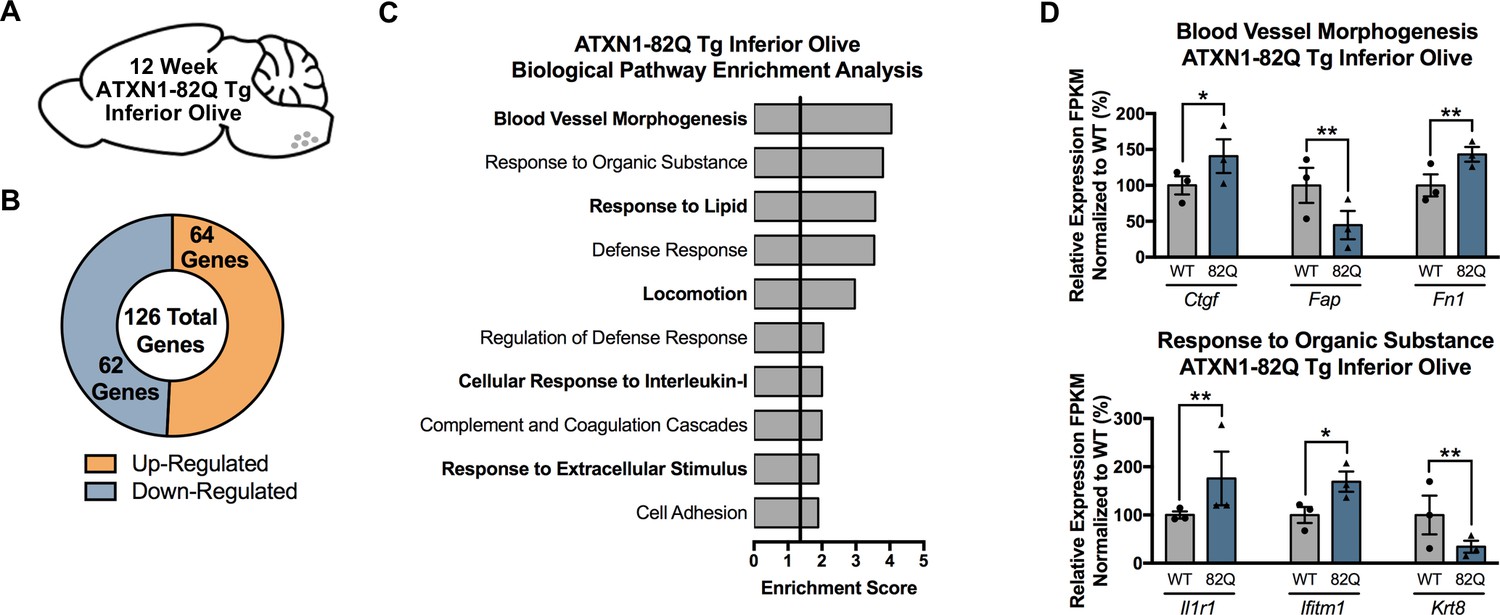
Differentially regulated genes identified in the 12 week ATXN1-82Q Tg inferior olive are associated with Blood Vessel Morphogenesis, Response to Organic Substance, and Defense Response-related pathways.
(A) Illustration of the tissue examined. (B) Total number of up- and down-regulated genes in the 12 week old ATXN1-82Q Tg inferior olive (FDR p-value < 0.05; n = 3 males per genotype for RNA-seq). (C) Biological pathway enrichment for all ATXN1-82Q Tg differentially regulated inferior olive genes at 12 weeks. (D) Blood Vessel Morphogenesis and Response to Organic Substance-related genes are up- and down-regulated. * FDR p-value < 0.05; ** FDR p-value < 0.01 (n = 3 males per genotype used in RNA-seq).
Figure 5—figure supplement 3
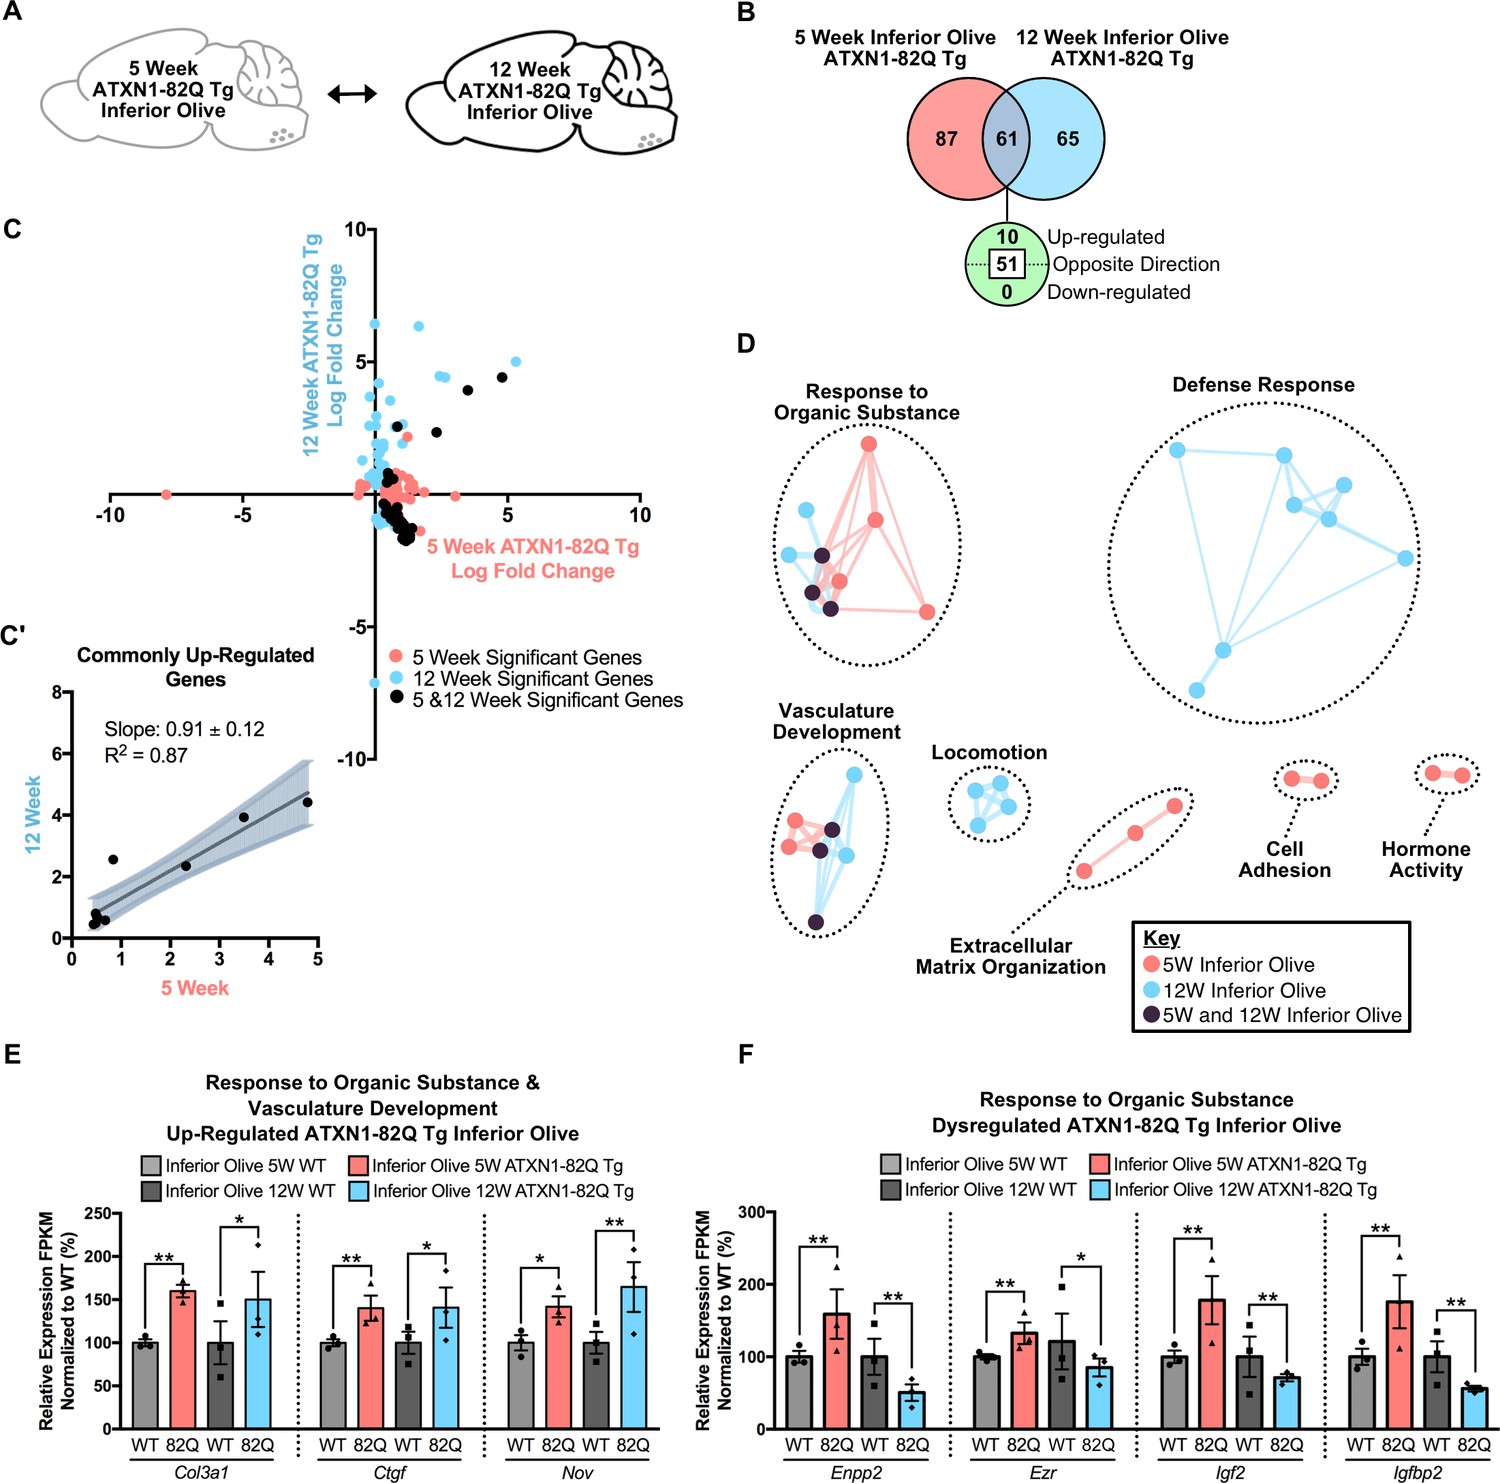
Divergent gene expression changes and minimal biological pathway overlap in the temporal comparison of the ATXN1-82Q Tg inferior olive.
(A) Schematic of the time-point comparison in ATXN1-82Q Tg inferior olive. (B) Total number of differentially regulated genes in the ATXN1-82Q Tg inferior olive relative to appropriate WT controls that are common, and uniquely altered, across the 5 and 12 week time-points (FDR p-value < 0.05; n = 3 males per genotype for RNA-seq). (C) Dot plot of log fold changes for genes significantly altered in the 5 and 12 week ATXN1-82Q Tg inferior olive relative to appropriate controls. (C') Log fold change of genes significantly up-regulated at both the 5 week and 12 week time-points only. Linear regression analysis identified the slope and R2 of these log fold changes (slope = 0.91 ± 0.12; R2 = 0.87). A total of 10 genes were plotted in this analysis. Dysregulated genes were excluded from this analysis. (D) Clustering of GO terms identified from the ATXN1-82Q Tg inferior olive 5 week and 12 week differentially regulated gene lists relative to the appropriate WT controls. (E) A subset of genes associated with Response to Organic Substance and Vasculature Development were commonly up-regulated and (F) a subset of Response to Organic ubstance genes were dysregulated when assessed in the 5 and 12 week time-points. * FDR p-value < 0.05; ** FDR p-value < 0.01 (n = 3 males per genotype for each time-point).
Figure 6 with 4 supplements
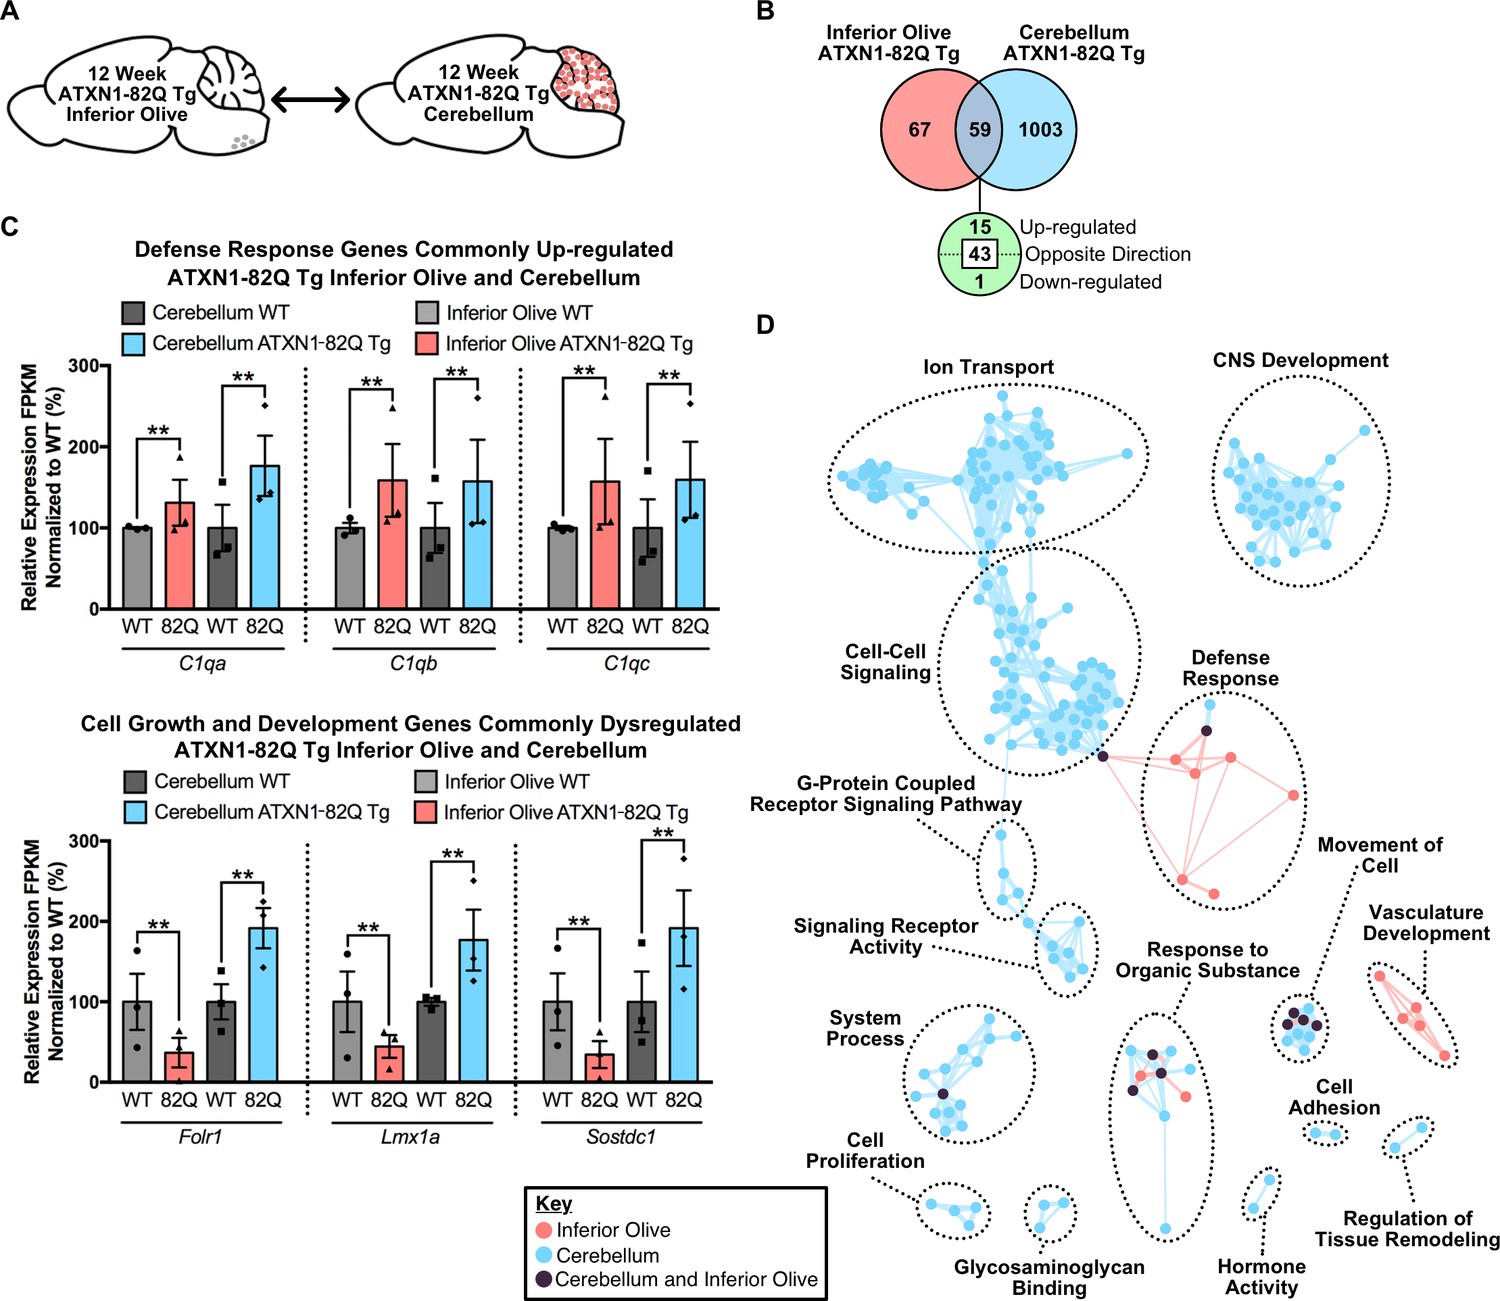
Divergent gene expression changes and low biological pathway overlap between 12 week old ATXN1-82Q Tg inferior olive and cerebellum.
(A) Schematic of the cross-tissue comparison in ATXN1-82Q Tg mice. (B) Total number of differentially regulated genes that are common, and uniquely altered, in the inferior olive and cerebellum of 12 week old ATXN1-82Q Tg mice (FDR p-value < 0.05; n = 3 males per genotype). (C) A subset of genes commonly up-regulated in the inferior olive and cerebellum, and genes altered in opposing directions (** FDR p-value < 0.01; n = 3 males per genotype for RNA-seq). (D) Clustering of GO terms from the ATXN1-82Q Tg inferior olive and cerebellum differentially expressed genes lists.
-
Figure 6—source data 1
5 week old ATXN1-82Q Tg cerebellum functional annotation enrichment analysis.
- https://doi.org/10.7554/eLife.39981.044
-
Figure 6—source data 2
12 week old ATXN1-82Q Tg functional annotation clustering enrichment analysis.
- https://doi.org/10.7554/eLife.39981.045
Figure 6—figure supplement 1

Chemical Synaptic Transmission and Regulation of Cell Communication are the most enriched pathways in the 5 week ATXN1-82Q Tg cerebellum.
(A) Illustration of the tissue examined. (B) Total number of up- and down-regulated genes in ATXN1-82Q Tg cerebellum at 5 weeks of age (FDR p-value < 0.05; n = 3 males per genotype for RNA-seq). (C) Biological pathway enrichment for all differentially regulated 5 week old ATXN1-82Q Tg cerebellum genes (p-value < 0.05). (D) Genes linked to Chemical Synaptic Transmission and (E) Regulation of Cell Communication are largely down-regulated. * FDR p-value < 0.05; ** FDR p-value < 0.01 (n = 3 males per genotype used in RNA-seq).
Figure 6—figure supplement 2
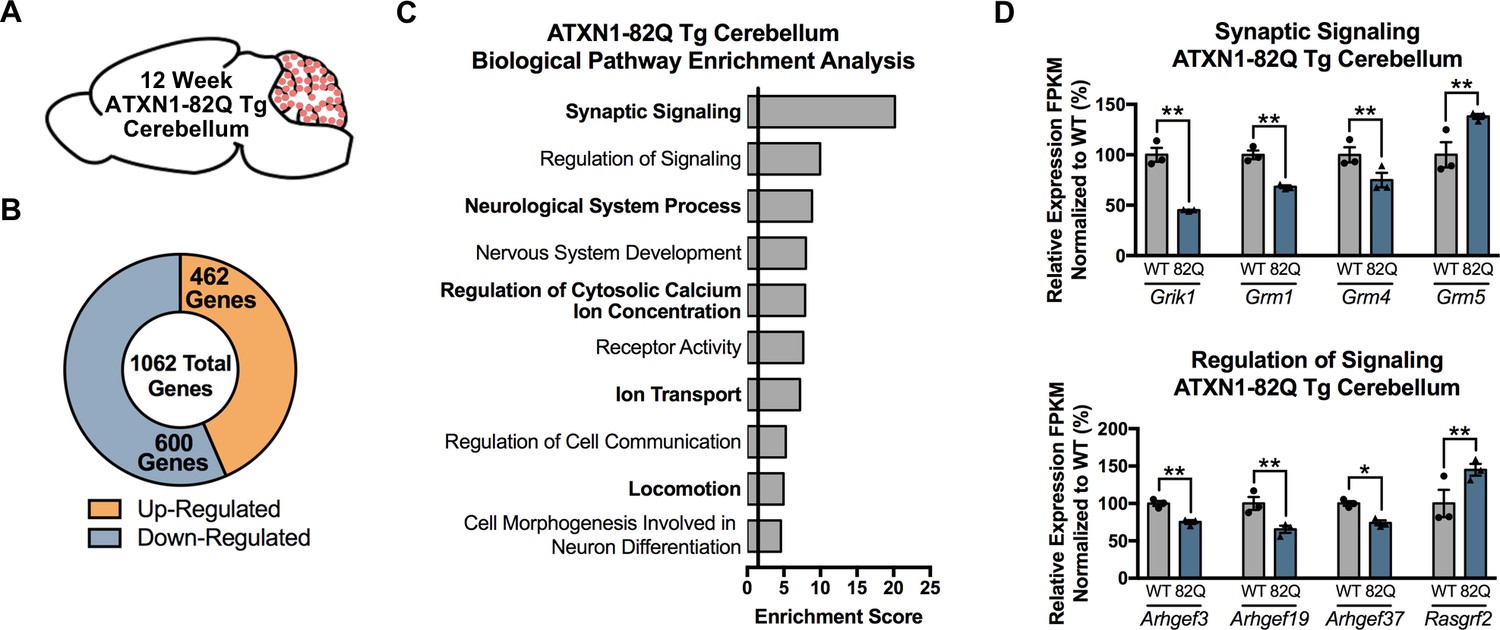
Pathways related to Synaptic Signaling are enriched in the 12 week ATXN1-82Q Tg cerebellum.
(A) Illustration of the tissue examined. (B) Total number of up- and down-regulated genes in ATXN1-82Q Tg cerebellum at 12 weeks of age (FDR p-value < 0.05; n = 3 males per genotype for RNA-seq). (C) Biological pathway enrichment for all differentially regulated cerebellum genes (p-value < 0.05). (D) Genes linked to Synaptic Signaling and (E) Regulation of Signaling are down- and up-regulated. * FDR p-value < 0.05; ** FDR p-value < 0.01 (n = 3 males per genotype used in RNA-seq).
Figure 6—figure supplement 3
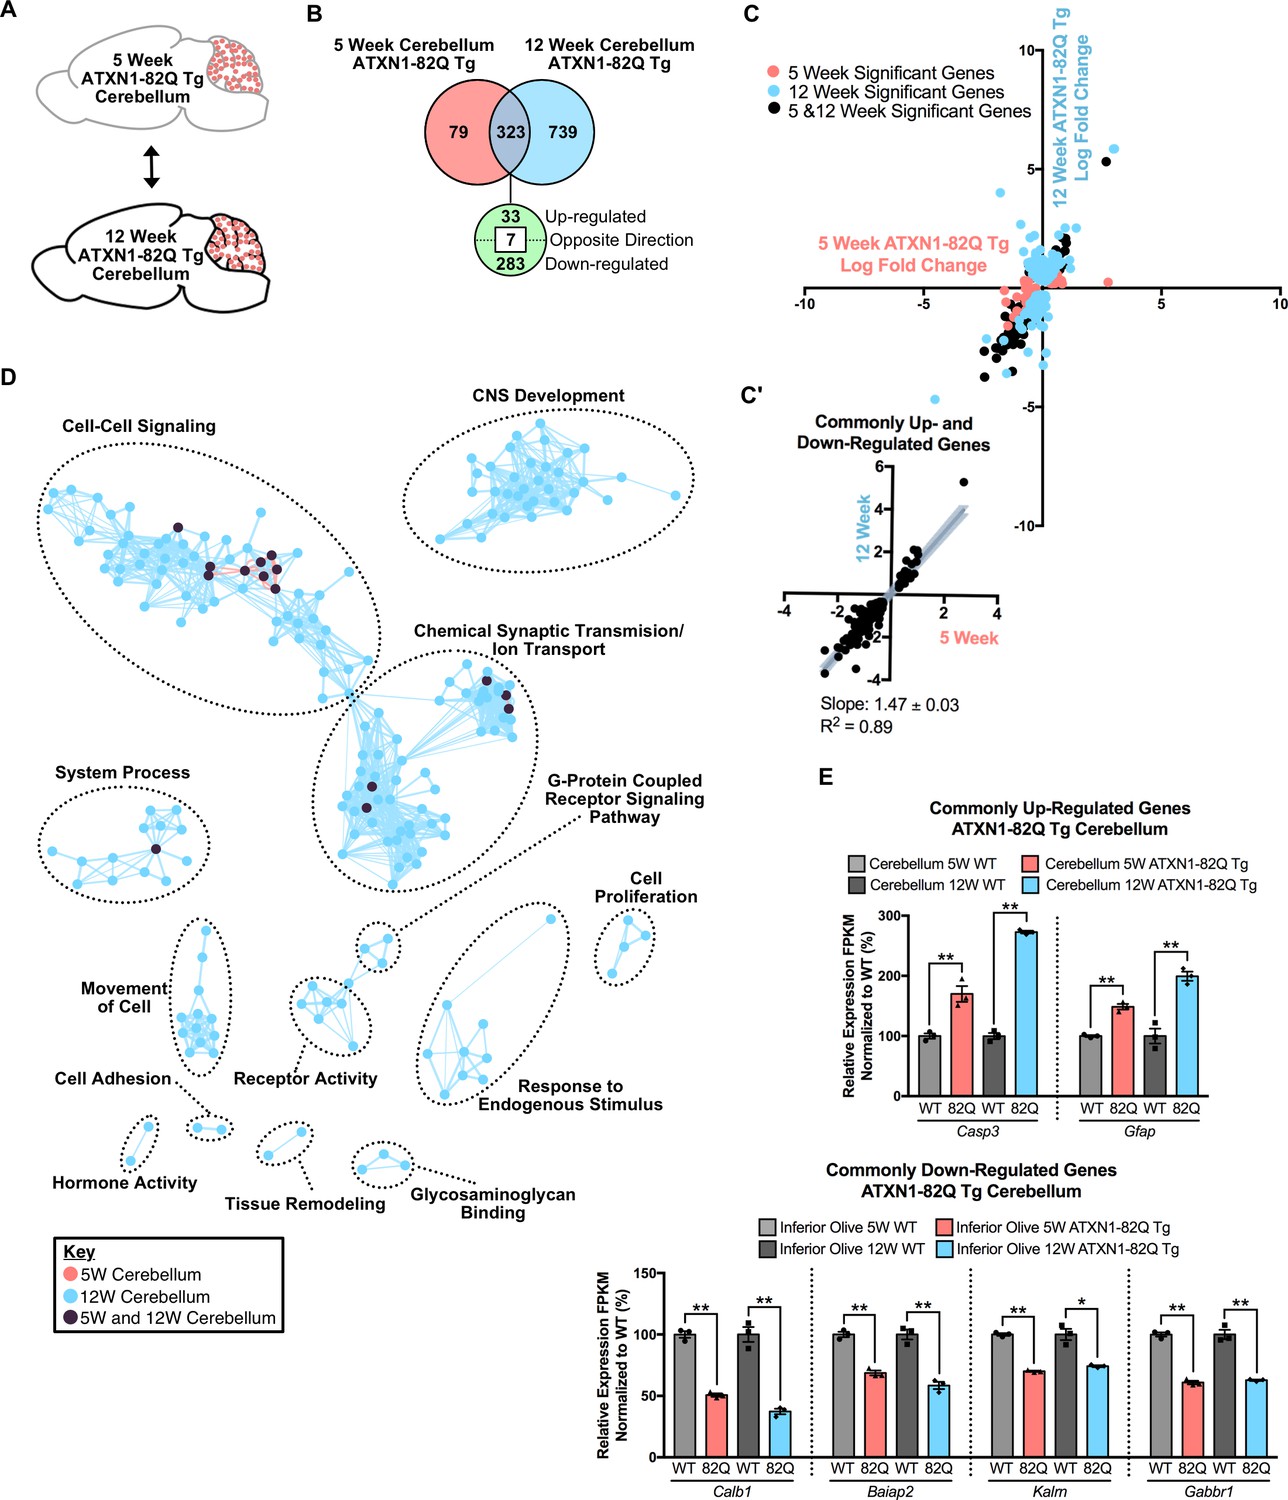
Common gene expression changes and pathway enrichment in the 5 and 12 week ATXN1-82Q Tg cerebellum.
(A) Schematic of the time-point comparison in ATXN1-82Q Tg cerebellum. (B) Total number of differentially regulated genes in the ATXN1-82Q Tg cerebellum relative to appropriate WT controls that are common, and uniquely altered, across the 5 and 12 week time-points (FDR p-value < 0.05; n = 3 males per genotype for RNA-seq). (C) Dot plot of log fold changes for genes altered in the 5 and 12 week ATXN1-82Q Tg cerebellum. (C') Log fold change of genes significantly up- or down-regulated at both the 5 week and 12 week time-points only. Linear regression analysis identified the slope and R2 of these log fold changes (slope = 1.47 ± 0.03; R2 = 0.89). A total of 316 genes were plotted in this analysis. Dysregulated genes were excluded from this analysis. (D) Clustering of GO terms identified from the ATXN1-82Q Tg cerebellum 5 week and 12 week differentially regulated gene lists relative to the appropriate WT controls. (E) A subset of genes were commonly up-regulated and down-regulated at both time-points relative to WT controls. * FDR p-value < 0.05; ** FDR p-value < 0.01 (n = 3 males per genotype for each time-point).
Figure 6—figure supplement 4
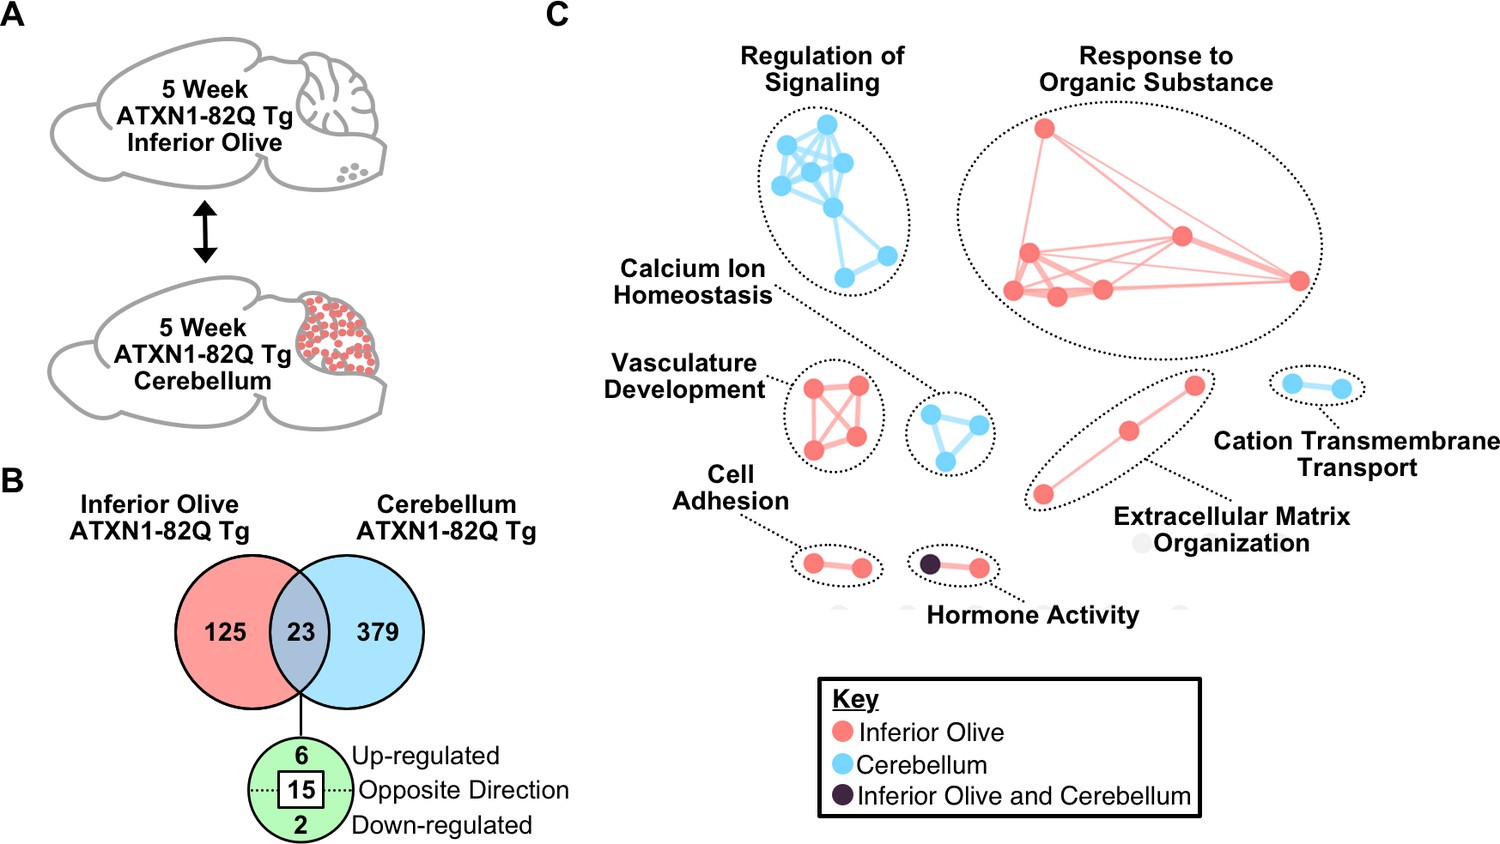
Divergent gene expression changes and pathway enrichment in the 5 week ATXN1-82Q Tg inferior olive and cerebellum.
(A) Schematic of the cross-tissue comparison in ATXN1-82Q Tg inferior olive and cerebellum at 5 weeks of age. (B) Total number of differentially regulated genes in the ATXN1-82Q Tg cerebellum and inferior olive relative to appropriate WT controls that are common, and uniquely altered (FDR p-value < 0.05; n = 3 males per genotype for RNA-seq). (C) Clustering of GO terms identified from the ATXN1-82Q Tg inferior olive and cerebellum 5 week differentially regulated gene lists relative to the appropriate WT controls.
Figure 7
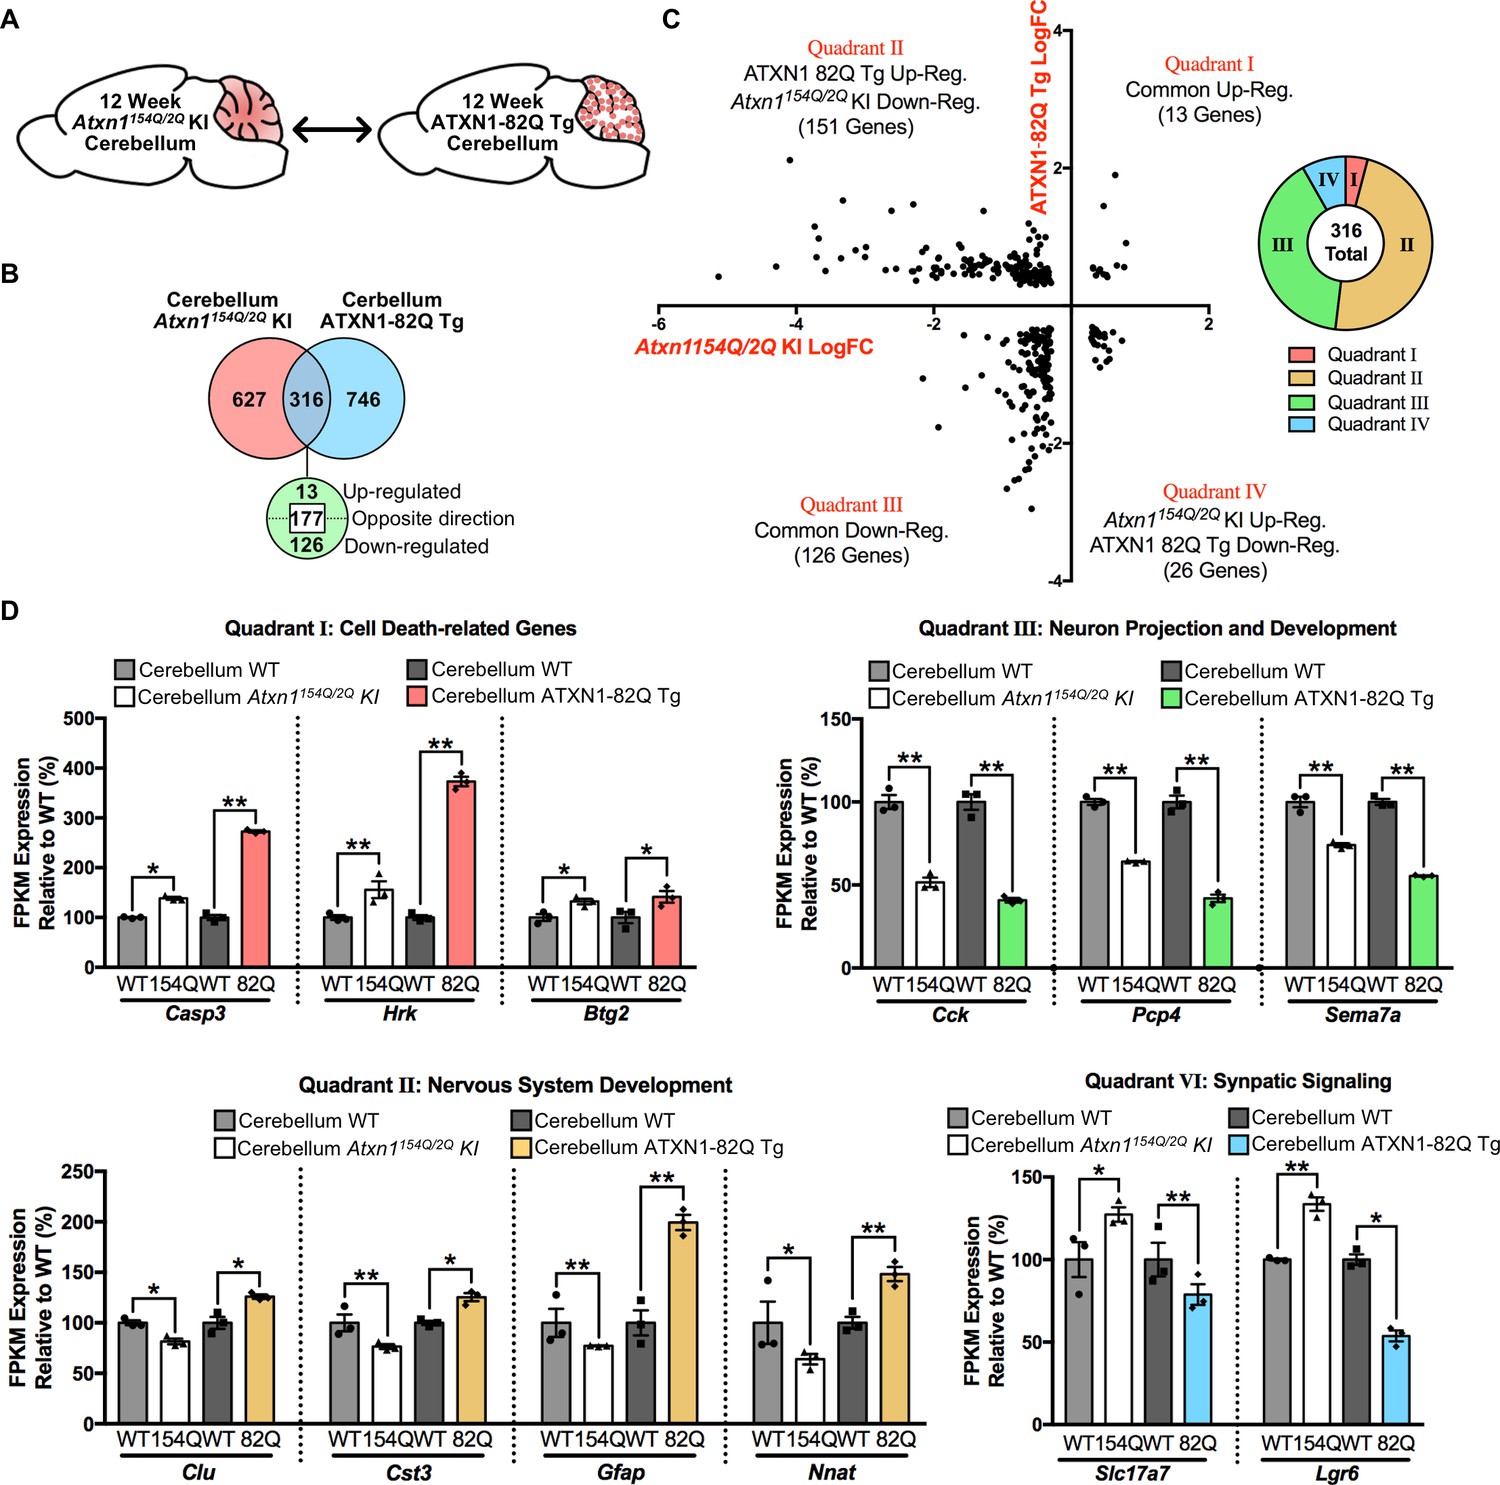
Genes commonly regulated in the cerebellum across 12 week old SCA1 mouse models are altered in opposing directions.
(A) Schematic of the cross-model comparison in 12 week old Atxn1154Q/2Q KI and ATXN1-82Q Tg cerebellum. (B) Number and directionality of shared differentially regulated genes in the Atxn1154Q/2Q KI and ATXN1-82Q Tg cerebellum (FDR p-value < 0.05; n = 3 males per genotype for RNA-seq). (C) Log fold change for genes commonly altered in both the Atxn1154Q/2Q KI and ATXN1-82Q Tg cerebellum, and the proportion of commonly altered genes within each quadrant. (D) Common genes up-regulated or down-regulated in the cerebellum from both mouse models (Quadrant I and III), and genes regulated in opposing directions (Quadrant II and IV) at 12 weeks of age (* FDR p-value < 0.05; ** FDR p-value < 0.01; n = 3 males per genotype for RNA-seq).
Figure 8

Summary of biological and molecular pathway enrichment across SCA1 mouse models in each brain region over time.
Differentially regulated genes in the 5 week old inferior olive and cerebellum from both SCA1 mouse models are associated with specific biological and molecular pathways, a subset of which are listed. The 5 week old Atxn1154Q/2Q KI cerebellum pathways are derived when using a nominal p-value < 0.01. In the cerebellum, the majority of differentially regulated genes are down-regulated at both the 5 and 12 week time-points (blue arrow). In the SCA1 inferior olive, the majority of genes are up-regulated at 5 weeks of age, which is followed by a shift toward gene down-regulation (orange and blue gradient arrow). In SCA1 mice at 12 weeks of age, there are enriched biological and molecular pathways that are both conserved, and unique, to specific affected tissues.
Tables
Table 1
Enrichment for Irf7 binding site DNA motifs in up-regulated 12 week old Atxn1154Q/2Q inferior olive genes.
https://doi.org/10.7554/eLife.39981.013| Brain region | Motif occurrence | Down-Regulated | Shuffled | p-value | q-value |
|---|---|---|---|---|---|
| Inferior Olive | Present | 32 | 26 | 0.468 | 0.123 |
| Absent | 128 | 134 | |||
| Brain Region | Motif Occurrence | Up-Regulated | Shuffled | p-value | q-value |
| Inferior Olive | Present | 27 | 2 | 8.8e-9 | 9.2e-9 |
| Absent | 17 | 42 |
-
FDR p-value calculated using the two-stage linear step-up procedure of Benjamini, Krieger, and Yekutieli (Q 5%).
Table 2
Enrichment for Cic binding site DNA motifs in down- and up-regulated 12 week old Atxn1154Q/2Q inferior olive and cerebellum.
https://doi.org/10.7554/eLife.39981.024| Cic DNA motif | Brain region | Motif occurrence | Down-Regulated | Shuffled | p-value | q-value |
|---|---|---|---|---|---|---|
| TGAATGAA | Inferior Olive | Present | 31 | 19 | 0.090 | 0.095 |
| Absent | 129 | 141 | ||||
| Cerebellum | Present | 126 | 57 | 5.6e-8 | 2.9e-7 | |
| Absent | 604 | 673 | ||||
| TGAATGGA | Inferior Olive | Present | 35 | 25 | 0.197 | 0.148 |
| Absent | 125 | 135 | ||||
| Cerebellum | Present | 157 | 104 | 3.7e-4 | 9.7e-4 | |
| Absent | 573 | 626 | ||||
| Cic DNA Motif | Brain Region | Motif Occurrence | Up-Regulated | Shuffled | p-value | q-value |
| TGAATGAA | Inferior Olive | Present | 10 | 4 | 0.143 | 0.125 |
| Absent | 34 | 40 | ||||
| Cerebellum | Present | 32 | 19 | 0.073 | 0.095 | |
| Absent | 181 | 194 | ||||
| TGAATGGA | Inferior Olive | Present | 13 | 2 | 0.003 | 0.005 |
| Absent | 31 | 42 | ||||
| Cerebellum | Present | 38 | 29 | 0.287 | 0.188 | |
| Absent | 175 | 184 |
-
FDR p-value calculated using the two-stage linear step-up procedure of Benjamini, Krieger, and Yekutieli (Q 5%).
Table 3
Enrichment for Cic binding site DNA motifs in down- and up-regulated genes from 12 week old ATXN1-82Q Tg inferior olive and cerebellum.
https://doi.org/10.7554/eLife.39981.046| Cic DNA motif | Brain region | Motif occurrence | Down-Regulated | Shuffled | p-value | q-value |
|---|---|---|---|---|---|---|
| TGAATGAA | Inferior Olive | Present | 12 | 1 | 0.002 | 0.002 |
| Absent | 56 | 67 | ||||
| Cerebellum | Present | 90 | 48 | 1.9e-4 | 4.0e-4 | |
| Absent | 510 | 552 | ||||
| TGAATGGA | Inferior Olive | Present | 19 | 13 | 0.312 | 0.187 |
| Absent | 49 | 55 | ||||
| Cerebellum | Present | 110 | 86 | 0.073 | 0.061 | |
| Absent | 490 | 514 | ||||
| Cic DNA Motif | Brain Region | Motif Occurrence | Up-Regulated | Shuffled | p-value | q-value |
| TGAATGAA | Inferior Olive | Present | 10 | 7 | 0.606 | 0.318 |
| Absent | 60 | 63 | ||||
| Cerebellum | Present | 97 | 51 | 4.9e-5 | 2.1e-4 | |
| Absent | 366 | 412 | ||||
| TGAATGGA | Inferior Olive | Present | 15 | 7 | 0.103 | 0.072 |
| Absent | 55 | 63 | ||||
| Cerebellum | Present | 96 | 59 | 0.002 | 0.002 | |
| Absent | 367 | 404 |
-
FDR p-value calculated using the two-stage linear step-up procedure of Benjamini, Krieger, and Yekutieli (Q 5%).
Key resources table
| Reagent type | Designation | Source or reference | Identifiers | Additional information |
|---|---|---|---|---|
| Strain, or strain background (Mus musculus, C57BL/6J) | Atxn1154Q/2Q KI | PMID:12086639 | RRID:MGI:2429435, backcrossed in house on C57BL/6J background | |
| Strain, or strain background (Mus musculus, FVB/NJ) | ATXN1-82Q Tg | PMID:7553854 | RRID:MGI:2447854 backcrossed in house on FVB/NJ background | |
| Strain, or strain background (Mus musculus, C57BL/6J) | C57BL/6J | The Jackson Lab | Stock: 000664 | |
| Strain, or strain background (Mus musculus, FVB/NJ) | FVB/NJ | The Jackson Lab | Stock: 001800 | |
| Cell line (Mus musculus) | BV2 | A kind gift from Dr. Katerina Akassoglou (Adams et al., 2007) | RRID: CVCL_0182 | |
| Transfected construct | human Flag-ATXN1 82Q | A kind gift from Dr. Huda Zoghbi | Addgene Plasmid #33237 | |
| Transfected construct | mammalian expression vector pcDNA3.1+ | Invitrogen (ThermoFisher Scientific) | Cat. # V790-20 | |
| antibody | rabbit polyclonal anti-Atxn111750 | a kind gift from Huda Zoghbi (Servadio et al., 1995) | RRID:AB_2721278 | (1:1,000) WB |
| Antibody | mouse monoclonal anti-Calbindin | Sigma | Cat. #: C9848 RRID:AB_476894 | (1:2,000) IHC |
| Antibody | mouse monoclonal anti-Gapdh | Sigma | Cat. #G8795 RRID:AB_1078991 | (1:10,000) WB |
| Antibody | chicken polyclonal anti-Gfap | Abcam | Cat. # ab4674 RRID:AB_304558 | (1:1,000) IHC |
| Antibody | rabbit polyclonal anti-Iba1 | Wako | Cat. # 019–19741 RRID:AB_839504 | (1:2,000) IHC |
| Antibody | goat polyclonal anti-chicken Alexa555 | ThermoFisher | Cat. #A21437 RRID:AB_2535858 | (1:500) IHC |
| Antibody | goat polyclonal anti-mouse Alexa488 | ThermoFisher | Cat. # A11001 RRID:AB_2534069 | (1:500) IHC |
| Antibody | goat polyclonal anti-rabbit Alexa568 | ThermoFisher | Cat. #A11011 RRID:AB_143157 | (1:500) IHC |
| Antibody | donkey anti-rabbit | GE Healthcare | Cat. #NA934 RRID:AB_772206 | (1:4,000) WB |
| Antibody | anti-mouse | GE Healthcare | Cat. #NXA931 RRID:AB_772209 | (1:4,000) WB |
| Commercial assay or kit | RNeasy Mini Kit | Qiagen | Cat #74106 | |
| Commercial assay or kit | iScript cDNA Synthesis Kit | Bio-Rad | Cat. #1708891 | |
| Commercial assay or kit | iTaq Universal Probes Supermix | Bio-Rad | Cat. #1725131 | |
| Commercial assay or kit | Pierce BCA Protein Assay | ThermoFisher | Cat. #23225 | |
| Commercial assay or kit | Amaxa Cell Line Nucleofector Kit T | Lonza | Cat. #VCA-1002 | |
| Other | DAPI | Vector Laboratories | Cat. #H-1500 RRID:AB_2336788 | |
| Other | Actb probe | Applied Biosystems | Cat. #4352932E | |
| Other | ATXN1 probe | Applied Biosystems | Cat. # 4331182 Hs00165656_m1 | |
| Other | Calb1 probe | Applied Biosystems | Cat. #4331182 Mm00486647_m1 | |
| Other | Gapdh probe | Applied Biosystems | Cat. #4352933E | |
| Other | Ifitm3 probe | Applied Biosystems | Cat. # 4331182 Mm00847057_s1 | |
| Other | Ifr7 probe | Applied Biosystems | Cat. #4331182 Mm00516793_g1 | |
| Other | Oasl2 probe | Applied Biosystems | Cat. # 4331182 Mm01201449_m1 | |
| Other | Stat1 probe | Applied Biosystems | Cat. # 4331182 Mm01257286_m1 | |
| Software, algorithm | Ingenuity Pathway Analysis (IPA) (Spring Release 2018) | http://www.ingenuity.com/products/pathways_analysis.html | RRID:SCR_008653 | |
| Software, algorithm | NIH DAVID v6.8 | http://david.abcc.ncifcrf.gov/ | RRID:SCR_001881 | |
| Software, algorithm | TopHat v2.1.0 | http://tophat.cbcb.umd.edu/ | RRID:SCR_013035 | |
| Software, algorithm | Cufflinks v2.2.1 | http://cole-trapnell-lab.github.io/cufflinks/ | RRID:SCR_014597 | |
| Software, algorithm | Bowtie2 v2.1.0 | http://bowtie-bio.sourceforge.net/bowtie2/index.shtml | RRID:SCR_016368 | |
| Software, algorithm | FastQC v0.11.3 | http://www.bioinformatics.babraham.ac.uk/projects/fastqc/ | RRID:SCR_014583 | |
| Software, algorithm | Cummerbund | http://compbio.mit.edu/cummeRbund/index.html | RRID:SCR_014568 | |
| Software, algorithm | Bioconductor R with heatmap.2 gplots package | https://www.rdocumentation.org/packages/gplots/versions/3.0.1/topics/heatmap.2 | ||
| Software, algorithm | R project for statistical computing v3.3.3 | http://www.r-project.org/ | RRID:SCR_001905 | |
| Software, algorithm | MEME Suite - Motif-based sequence analysis tools | http://meme-suite.org/ | RRID:SCR_001783 | |
| Software, algorithm | EnrichmentMap | http://baderlab.org/Software/EnrichmentMap | RRID:SCR_016052 | |
| Software, algorithm | Cytoscape v3.5.1 | http://cytoscape.org | RRID:SCR_003032 | |
| Software, algorithm | GraphPad Prism | http://www.graphpad.com/ | RRID:SCR_002798 | |
| Software, algorithm | ImageJ | https://imagej.net/ | RRID:SCR_003070 |
Additional files
-
Supplementary file 1
5 week old Atxn1154Q/2Q KI inferior olive IPA canonical pathway enrichment.
- https://doi.org/10.7554/eLife.39981.049
-
Supplementary file 2
5 week old Atxn1154Q/2Q KI inferior olive IPA predicted upstream regulators.
- https://doi.org/10.7554/eLife.39981.050
-
Supplementary file 3
Upstream regulators for differentially regulated 12 week old Atxn1154Q/2Q KI cerebellum genes.
- https://doi.org/10.7554/eLife.39981.051
-
Supplementary file 4
5 week old ATXN1-82Q Tg inferior olive IPA canonical pathways.
- https://doi.org/10.7554/eLife.39981.052
-
Supplementary file 5
12 week old ATXN1-82Q Tg inferior olive upstream regulators predicted in IPA.
- https://doi.org/10.7554/eLife.39981.053
-
Supplementary file 6
RNA integrity numbers (RIN) for samples used in RNA-seq analysis.
- https://doi.org/10.7554/eLife.39981.054
-
Transparent reporting form
- https://doi.org/10.7554/eLife.39981.055
Download links
A two-part list of links to download the article, or parts of the article, in various formats.
Downloads (link to download the article as PDF)
Open citations (links to open the citations from this article in various online reference manager services)
Cite this article (links to download the citations from this article in formats compatible with various reference manager tools)
Molecular pathway analysis towards understanding tissue vulnerability in spinocerebellar ataxia type 1
eLife 7:e39981.
https://doi.org/10.7554/eLife.39981


