Complex spike synchrony dependent modulation of rat deep cerebellar nuclear activity
- New York University School of Medicine, United States
- Mount Sinai School of Medicine, United States
Figures
Figure 1
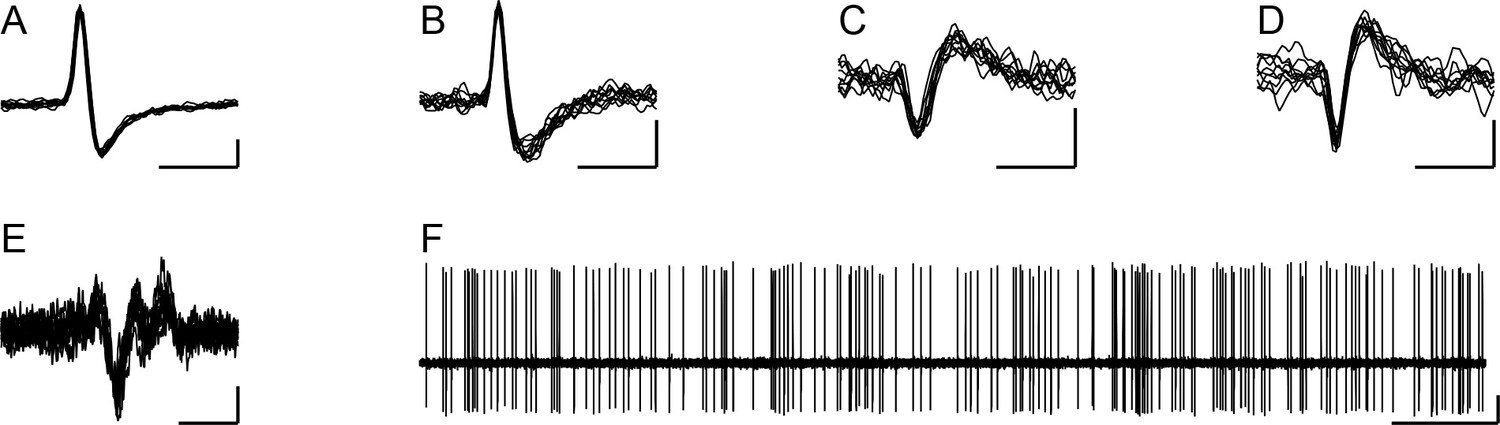
Extracellular records of DCN neurons.
(A–D) Extracellular records (10 overlapped sweeps) showing the spike waveforms of the DCN neurons whose activity is analyzed throughout the paper. The letter of each panel corresponds to the experiment name used throughout the remainder of the paper for analyses related to that cell. Horizontal calibration bars are 1 ms. Vertical calibration bars: A, 200 µV; B-D, 100 µV. (E) Example of CS activity recorded from one of the PCs identified as presynaptic to a DCN cell (10 overlapped spikes). Calibration bars are 5 ms and 50 µV. (F) Example recording of DCN neuron (same as in panel A) to show typical firing pattern consisting of both tonic and bursting activity. Calibration bars are 0.5 s and 200 µV.
Figure 2
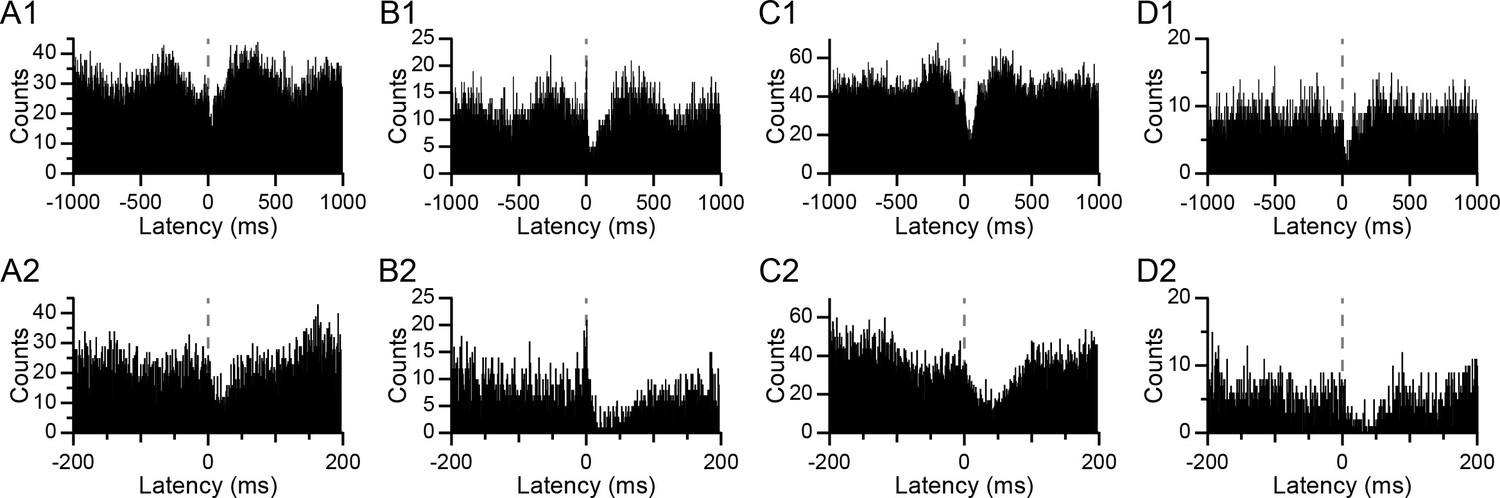
CS-associated changes in DCN activity.
(A–D) CS-triggered histograms of DCN activity for four different PC-DCN pairs identified as synaptically-connected. Panels A and B show histograms from the same DCN cell with two different PCs. Panels C and D show histograms from two other DCN cells. The bottom row (A2–D2) shows the corresponding histograms of the top row (A1–D1) with an expanded time scale in order to see the timing of the onset of the inhibition in DCN activity at the time of the CS (latency = 0 ms; dashed line). Bin width = 1 ms.
Figure 3
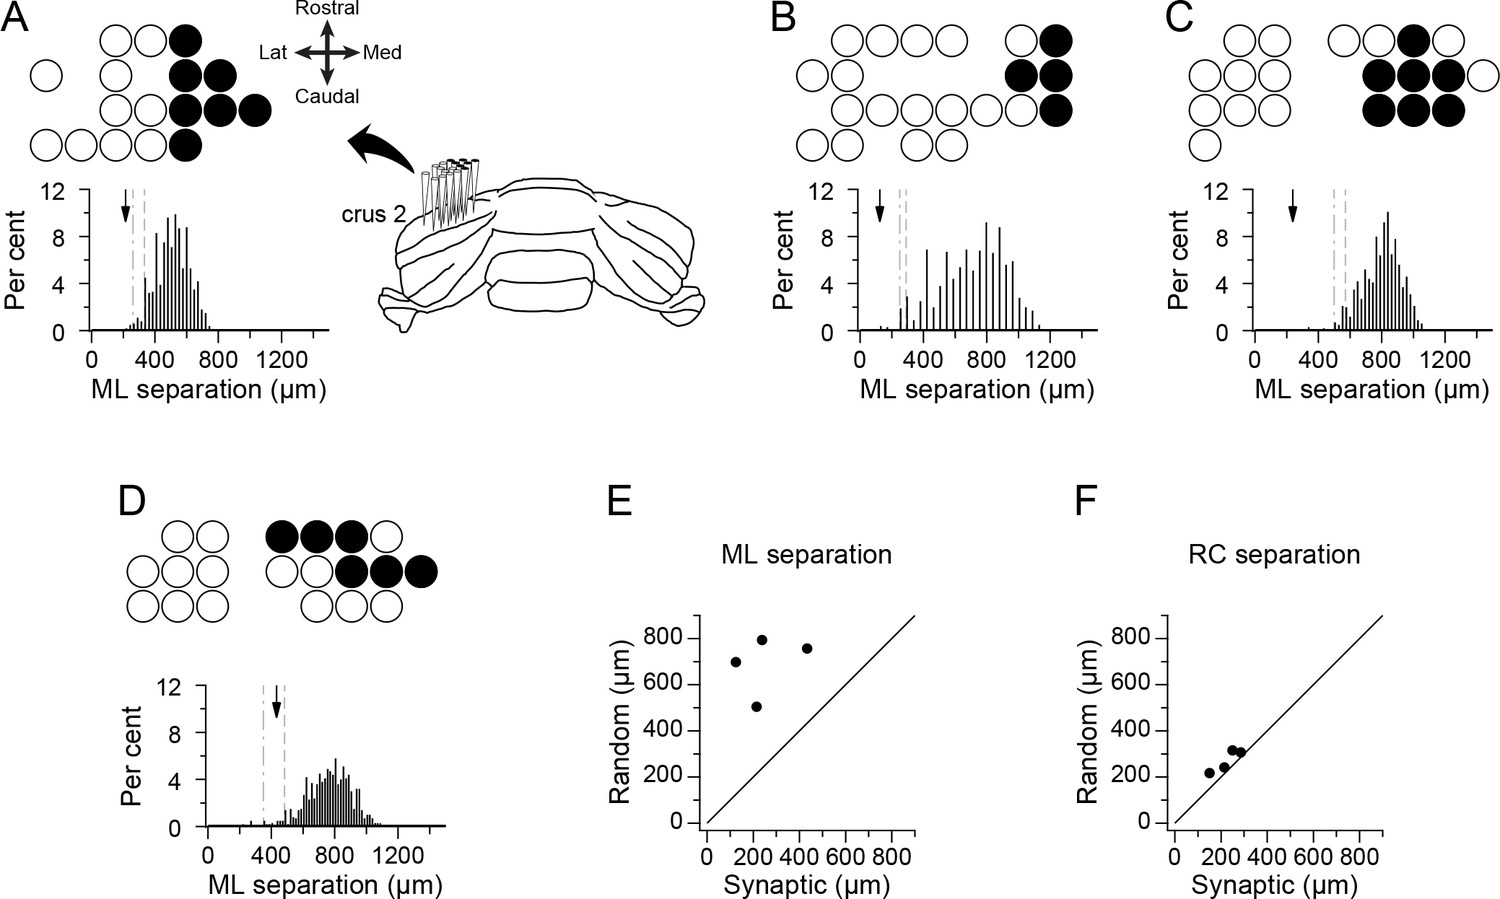
PCs identified by correlogram analysis as projecting to the same DCN neuron form spatially restricted groups.
(A–D) Schematics showing recording arrays from four experiments. Circles indicate positions of recorded PCs; filled circles indicate positions of PCs identified as presynaptic to the recorded DCN cell. The histogram below each schematic shows the distribution of the mean mediolateral separation among cells from groups having the same number of cells as the presynaptic group but whose locations on the array were randomly chosen. Arrow indicates the mean separation value for presynaptic group in each experiment. The dashed and dash-dotted lines indicate the 5% and 1% percentiles, respectively. (E) Scatter plot of the mean mediolateral separation of PCs in the presynaptic group versus the mean of the distribution for the random groups. (F) Same as (E) except that the separation in the rostrocaudal direction is plotted. Note that each experiment shown in panels A-D will be referred to throughout the paper and in other figures with reference to their panel designation in this figure.
Figure 4
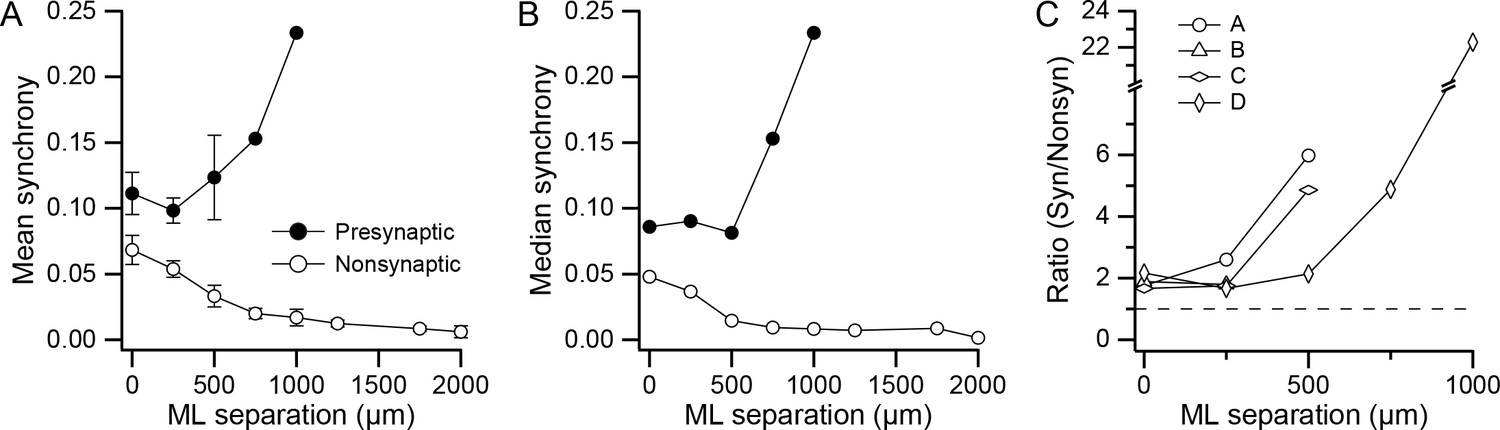
DCN projection groups show high CS synchrony levels.
(A) Plot of mean synchrony as a function of the mediolateral (ML) separation between PCs from all experiments. The filled circles show the mean synchrony for pairs in which both PCs were in one of the identified presynaptic groups and the unfilled circles show the synchrony for pairs from the remaining cells in the arrays. Error bars are ±1 SEM. (B) Similar to A, except that median synchrony is plotted as a function of ML separation. (C) The ratio of mean synchrony of the synaptic and non-synaptic PCs is plotted as a function of ML separation for each of the four experiments.
Figure 5
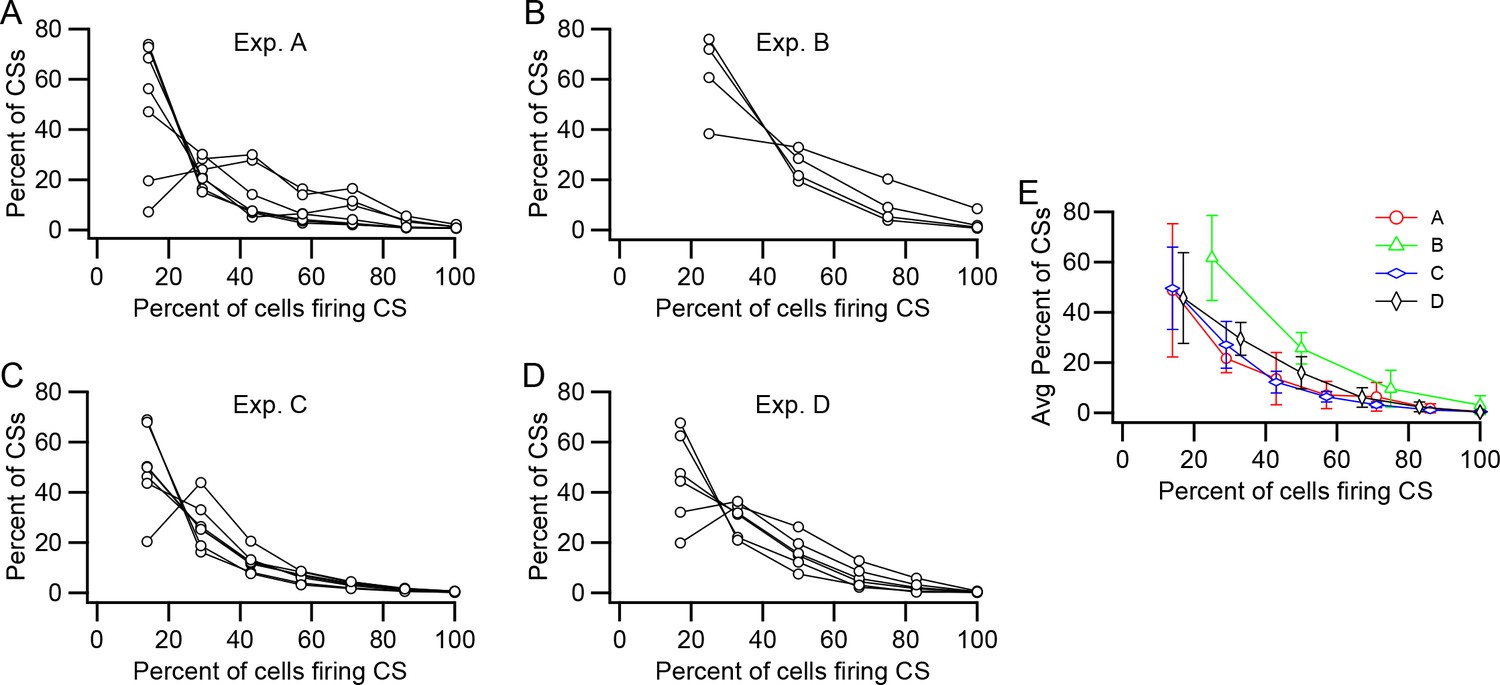
Relative prevalence of synchronous CS activity.
(A–D) Plots of the percent of CSs at each synchrony level (Percent of cells firing CSs) within the presynaptic group. Each panel shows data from one experiment. Each curve shows the distribution of CSs for one PC in the presynaptic group. The number of PCs in each group is as follows: A, 7; B, 4; C, 7; D, 6. (E) Average distribution for each experiment.
Figure 6
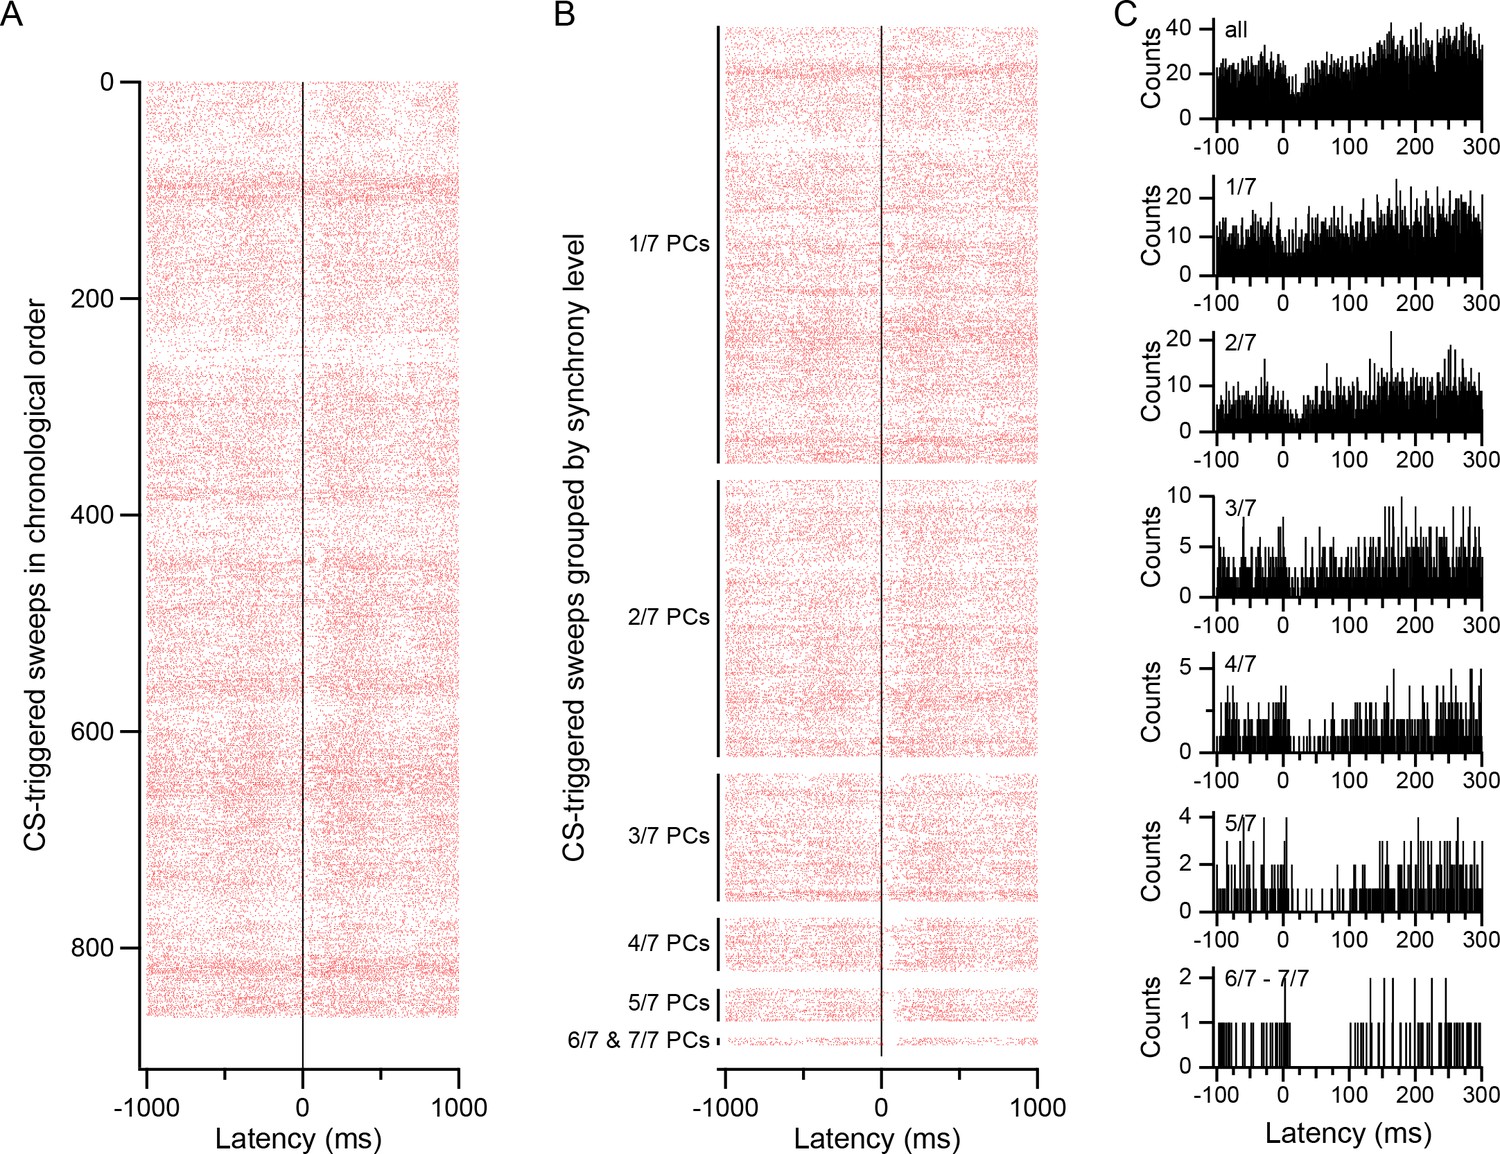
CS-associated modulation of DCN activity.
(A) CS-triggered raster display of DCN activity. The raster was generated from all CSs of one PC during a 20 min recording (firing rates: CS, 0.70 Hz; DCN cell, 30 Hz). Each row represents the activity surrounding one CS. The rows are arranged in chronological order (top to bottom). (B) Raster of same data as in A, but CSs are first grouped according to synchrony level, as indicated by labels on y-axis. Within each synchrony level the rows are arranged chronologically. In particular, note how the inhibition of DCN activity just after the CS (latency = 0 ms) increases with synchrony. (C) CS-triggered histograms of DCN activity for different synchrony levels. Top histogram (all) generated from all CSs and corresponds to the entire raster in A and B. The remaining histograms were generated from their corresponding groups in the raster of panel B. Note the expanded time scale compared to the rasters in order to highlight the change in the inhibition that follows the CS, and the transient excitation just preceding the CS (visible in bottom four histograms).
Figure 7
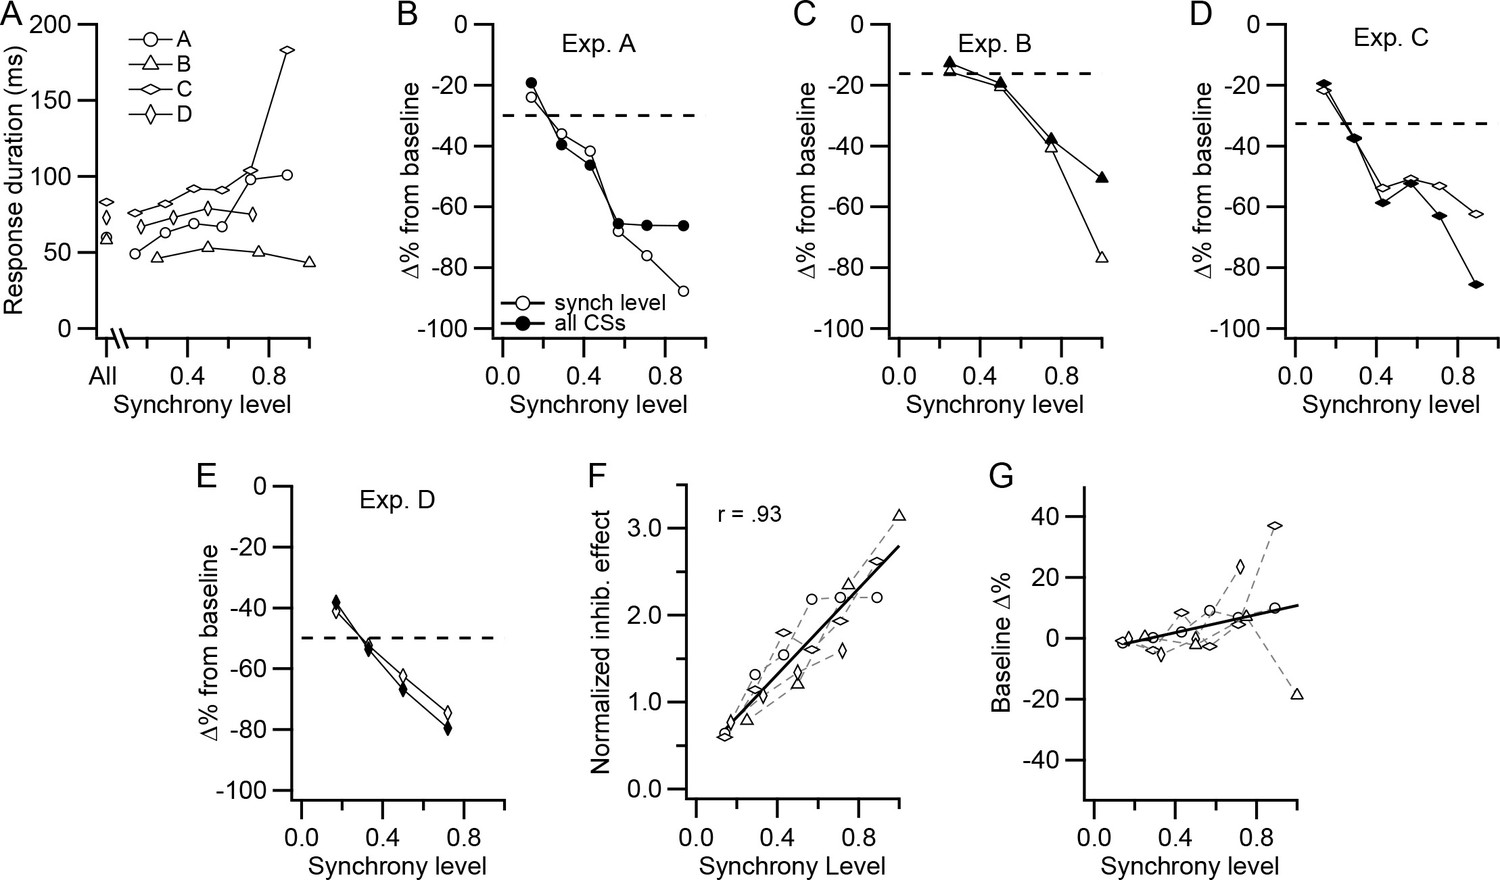
CS-associated inhibition of DCN activity is a function of synchrony.
(A) Duration of post-CS inhibition is plotted as a function of synchrony level for each experiment. The durations were determined from histograms generated from the CS activity of all PCs in a presynaptic group. The points plotted above 'All' are durations determined from the histogram generated from all CSs. The other points were generated from all CSs at a particular synchrony level. (B–E) For each experiment, the percent change in DCN activity during the post-CS inhibition period from baseline activity is plotted as a function of synchrony level. The time of the response period was set either based on the All-CS histogram (filled circles) or by measurement of the duration on the specific synchrony level histograms (unfilled circles). Dashed lines indicate the change in activity measured from the All-CS histogram. (F) Comparison of the effect of synchrony across all experiments. The 'all CSs' curves in panels B-E were normalized by dividing each by the corresponding average synchrony for that experiment (horizontal dashed line in each panel). Symbols for experiments are the same as in panel A. Solid line is least squares regression line. (G) Change in the level of the baseline activity with synchrony. Histograms were normalized for number of CSs, and then baseline activity at each synchrony level was compared to the baseline level for the All-CS histogram. In some of the experiments, the highest synchrony levels were combined because there were too few events (<10) at the highest levels to analyze. In these cases, the synchrony level was set to a weighted average of the combined levels: experiments A and C, levels 6-7/7; experiment D, levels 4-6/6. No levels were combined for experiment B. Solid line is least squares regression line.
Figure 8
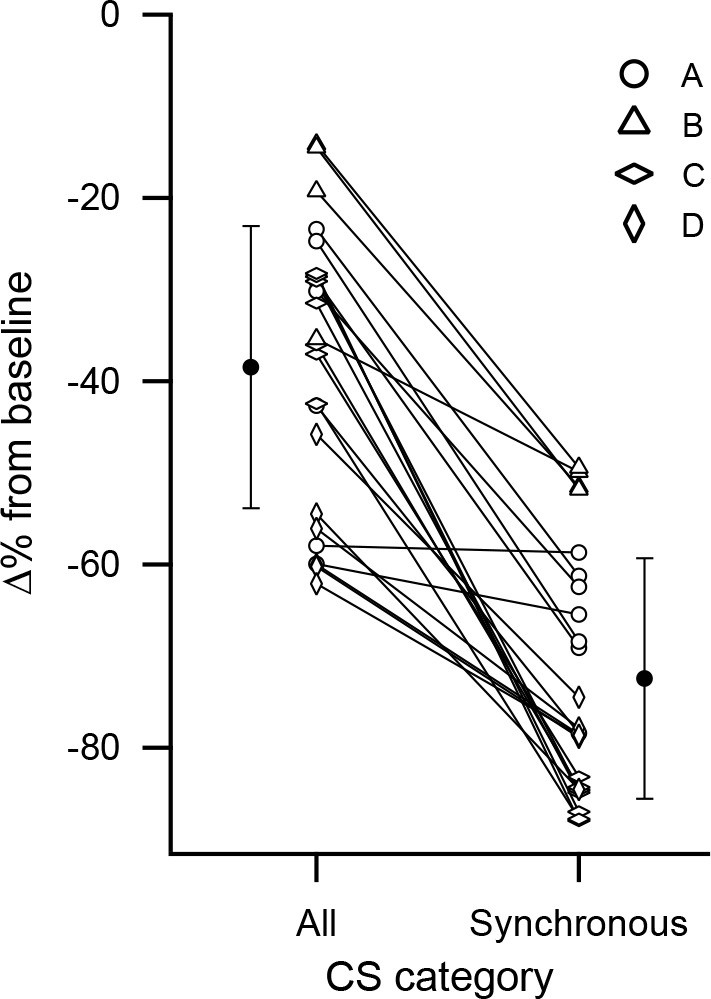
Cell by cell comparison of the inhibitory effect on DCN activity of synchronous CS activity.
The percent change from baseline DCN activity following a CS was calculated for each PC based on all of its CSs or only those that were highly synchronous. The percent change values for each cell are connected by a line. The black circles indicate the averages of the two conditions. Error bars are SD. The highest synchrony levels were combined to ensure all cells in an experiment had at least 10 events: experiment A, levels 5-7/7; experiment C, levels 6-7/7; experiment D, levels 4-6/6. No levels were combined for experiment B.
Figure 9
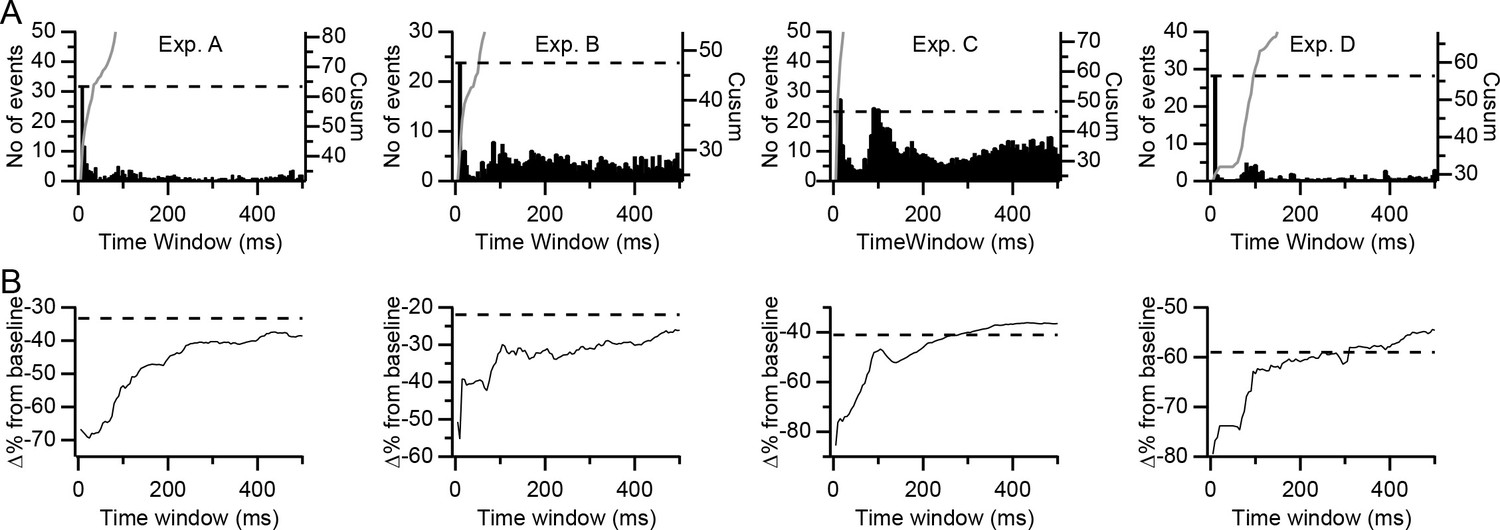
Dependence of inhibitory effect on the precision of synchrony.
(A) Histograms of the number of highly synchronous events among presynaptic PCs as a function of the time window used to define synchrony for each of the experiments. Each histogram bar represents the number of events in that window but not in any shorter window. Each bar reflects a 5 ms increase in window size for both positive and negative latencies from the reference CS. Gray traces are the cumulative summation (cusum) curves. Dashed lines indicate twice the height of the first histogram bar (±5 ms time window) as plotted using the cusum (right) axis. (B) Plots of the inhibitory effect (percent change from baseline) on DCN activity of highly synchronous CS events as a function of the time window. Dashed lines indicate the overall inhibitory effect of all CSs in the presynaptic group PCs.
Figure 10
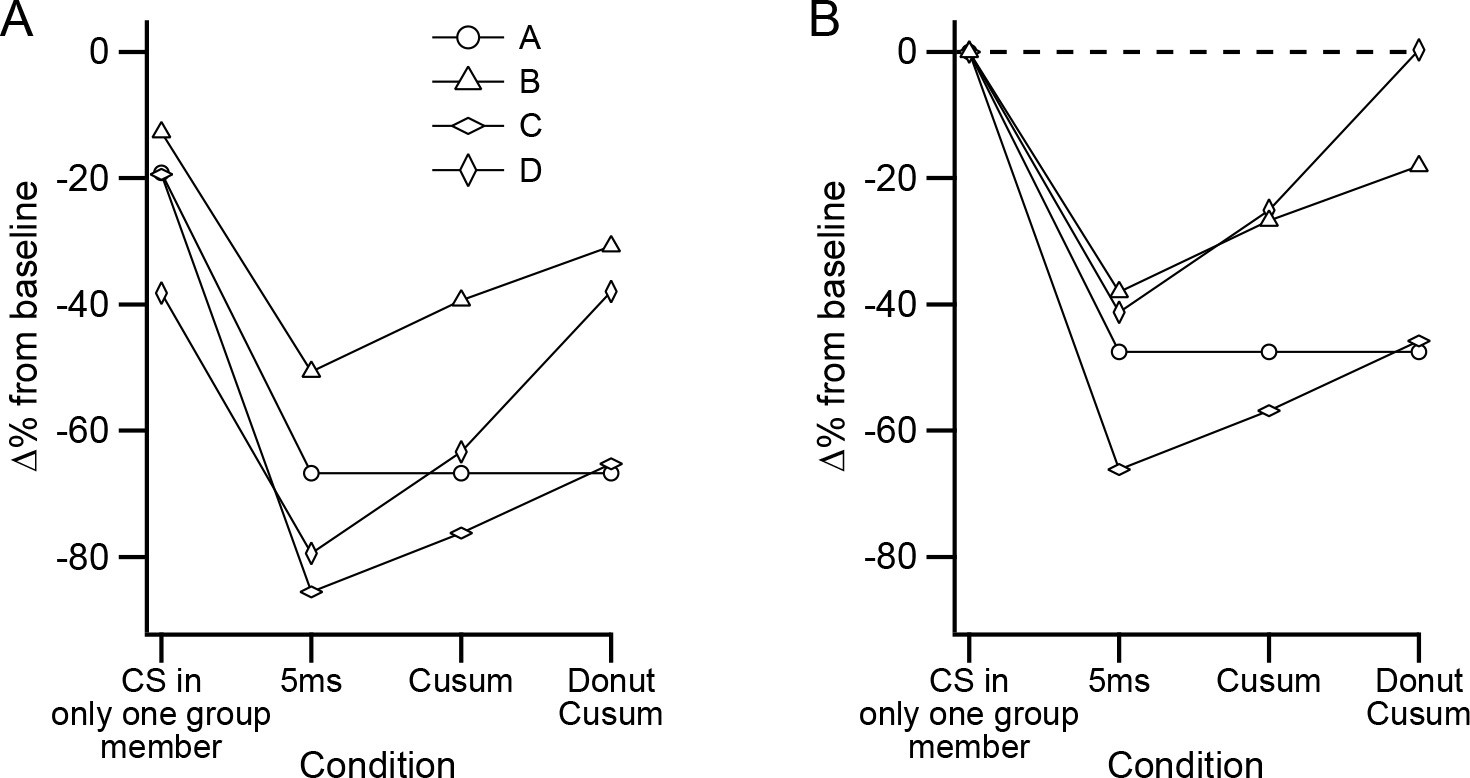
Precisely synchronized CS events are responsible for inhibitory effect on DCN activity.
(A) Plot of different sets of CSs comparing their effectiveness in inhibiting DCN activity. Each symbol shows the data from a separate experiment. (B) Data in (A) replotted after subtracting the inhibitory effect of events in which only one PC fired a CS.
Figure 11

Other aspects of CS-associated modulation of DCN activity show weaker relationship to synchrony.
(A) CS-triggered correlogram of DCN activity generated from all CSs of all presynaptic PCs for experiment A. Horizontal dashed line indicates baseline level of histogram and vertical dashed lines indicate limits of long-latency modulation period. (B–C) Change from baseline activity during the pre-CS (B) and post-CS (C) periods as a function of synchrony. Each curve is the average effect for one experiment. Experiment B did not show clear long-latency modulation and thus was not plotted.
Additional files
-
Transparent reporting form
- https://doi.org/10.7554/eLife.40101.013
Download links
A two-part list of links to download the article, or parts of the article, in various formats.
Downloads (link to download the article as PDF)
Open citations (links to open the citations from this article in various online reference manager services)
Cite this article (links to download the citations from this article in formats compatible with various reference manager tools)
Complex spike synchrony dependent modulation of rat deep cerebellar nuclear activity
eLife 8:e40101.
https://doi.org/10.7554/eLife.40101


