A pathway for Parkinson’s Disease LRRK2 kinase to block primary cilia and Sonic hedgehog signaling in the brain
- Stanford University School of Medicine, United States
- University of Dundee, United Kingdom
- Parkinson’s Institute and Clinical Center, United States
- Max-Planck-Institute of Biochemistry, Germany
Figures
Figure 1 with 1 supplement
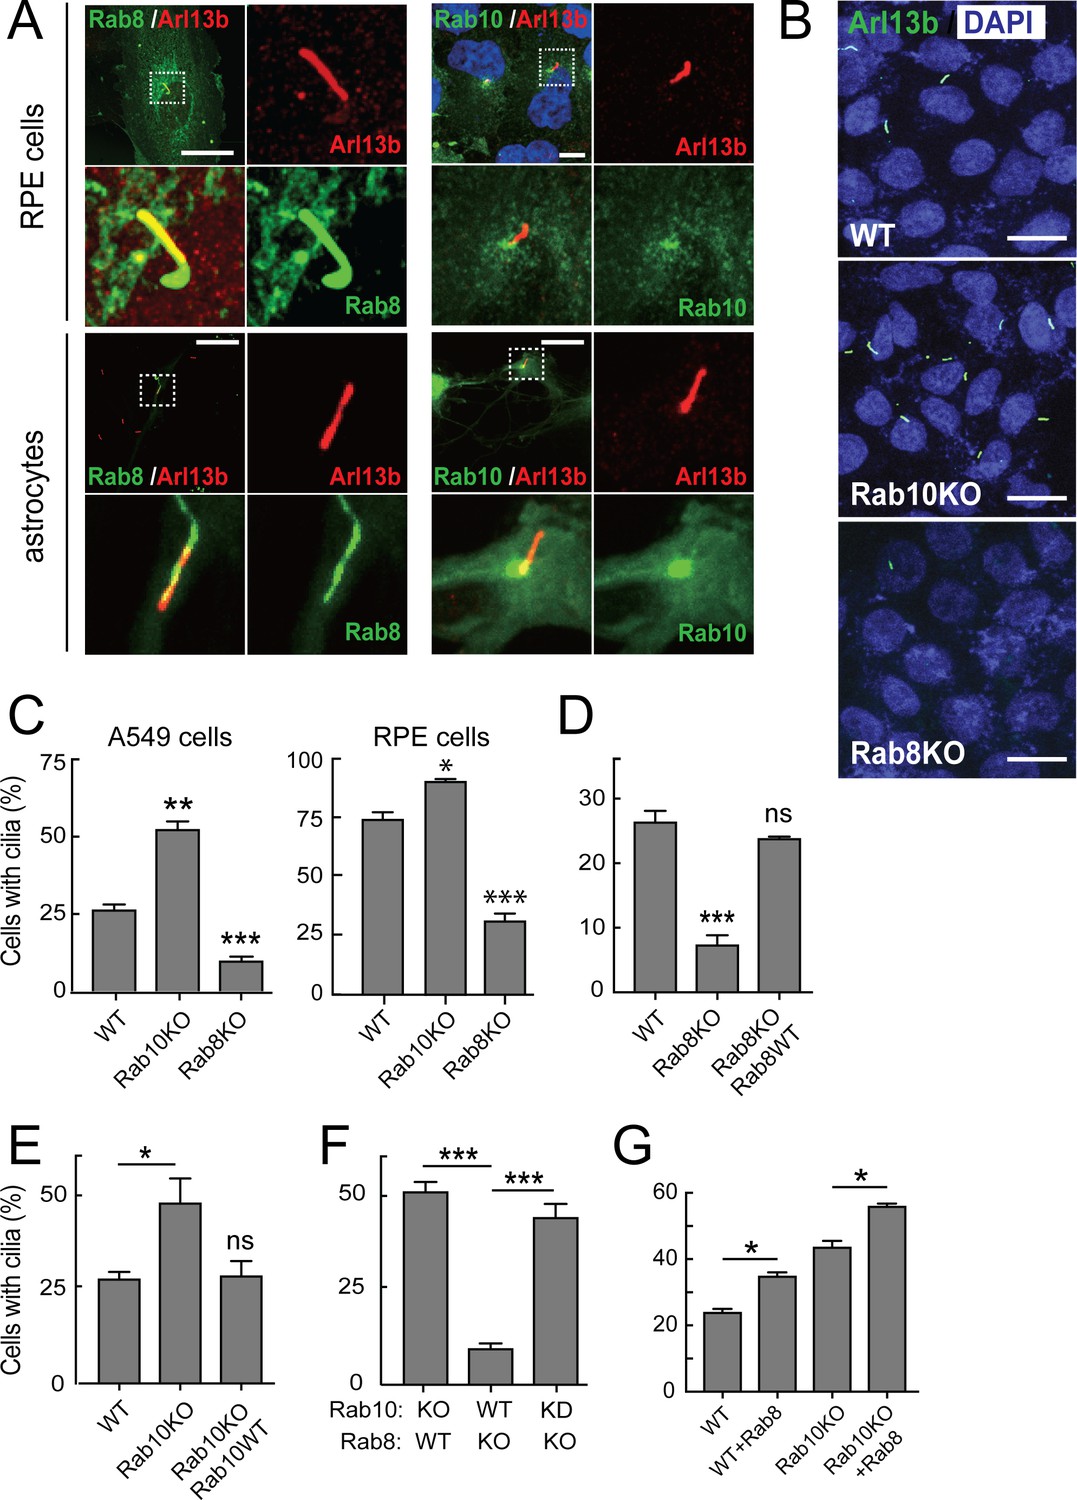
Rab10 is a negative regulator of primary cilia formation.
hTERT-RPE cells (Figure 1A, upper panels) or primary rat astrocytes (Figure 1A, lower panels) were transfected with GFP-Rab8A (A, left) or GFP-Rab10 (A, right). 24 hr post transfection, cells were fixed and stained for primary cilia using anti-Arl13b antibodies (red). Dotted boxes indicate areas that are magnified in the insets. Yellow indicates co-localization between GFP-Rabs (green) and Arl13b (red). (B) A549 knock out cells lacking endogenous Rab10 (Rab10-KO) or Rab8A (Rab8-KO) were ciliated on glass coverslips and 48 hr later fixed and stained for primary cilia Arl13b (green). (C) Quantitation of data shown in (B) for A549 cells and also RPE cells analyzed in parallel. Error bars represent SEM from three experiments with >200 cells per condition in each experiment. (D,E) Rab8A-KO or Rab10-KO A549 cells were infected with lentivirus to stably express wild type GFP-Rab8A or GFP-Rab10, respectively. Cells were ciliated on coverslips and stained for Arl13b. (D) Quantitation of primary cilia in Rab8A-KO A549 cells stably expressing GFP-Rab8A-WT. (E) Quantitation of primary cilia in Rab10-KO A549 cells stably expressing GFP-Rab10-WT. (F) Quantitation of primary cilia in Rab8A-KO A549 cells treated with Rab10 shRNA. (G) Quantitation of primary cilia in WT and Rab10-KO A549 cells expressing GFP-Rab8A. Error bars represent SEM from three experiments with >200 cells per condition. *, p<0.05; **, p<0.01; ***. p<0.001; ns = not significant. Scale bars = 10 µm.
Figure 1—figure supplement 1

Documentation of Rab8A and Rab10 shRNA efficacy.
A549 Rab10-KO and Rab8A-KO cells infected with lentivirus to deliver shRNAs targeting Rab8A or Rab10, respectively. A549 knock out cells were rescued by lentiviral delivery of GFP-Rab8A or Rab10. Immunoblot of 60 µg cell lysate probed with anti-GFP, anti-Rab8A or anti-Rab10 antibodies; tubulin was used as loading control. Numbers at left indicate mobility of molecular weight markers in kDa.
Figure 2 with 1 supplement
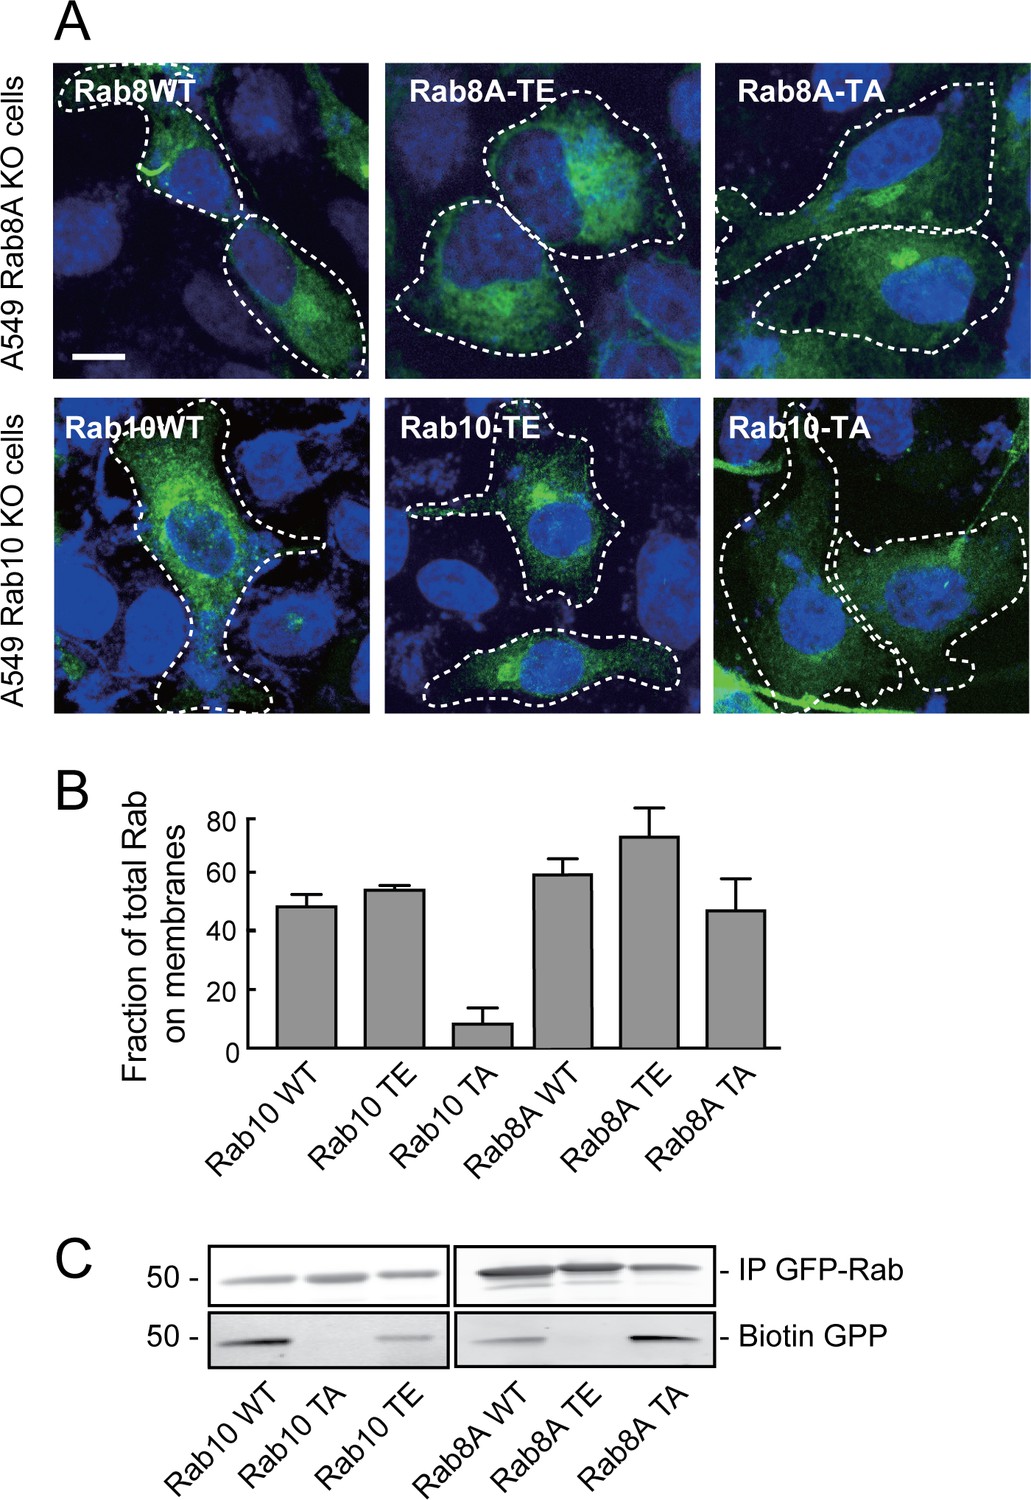
Rab8A and Rab10 phospho-site mutants are non-functional proteins.
(A) Rab8A-KO and Rab10-KO A549 cells were infected with lentivirus to stably express wild type (WT), phospho-mimetic (TE) or non-phosphorylatable (TA) mutants of Rab8A and Rab10, respectively. 24 hr post transfection, cells were fixed and stained with anti-GFP. (B) HEK293T cells were transfected with wild type (WT), T73E (TE) or T73A (TA) mutant GFP-Rab10 or GFP-Rab8A as indicated. After 24 hr, cells were fractionated into membrane and cytosol and 50 µg membranes and the equivalent volume of cytosol was immunoblotted using anti-GFP antibodies. Graph indicates the percent of total Rab10 or Rab8A protein that was membrane associated. (C) In vitro prenylation measured using cytosol fractions from (B), incubated for 4 hr with biotin-geranyl pyrophosphate at room temperature. The reaction was immunoprecipitated with GFP binding protein-Sepharose and samples were immunoblotted for biotin using Strepatavidin-Alexa 800 and anti-GFP.
Figure 2—figure supplement 1

Phospho-site mutants of Rab8A and Rab10 bind RILPL1 poorly.
HEK293T cells were co-transfected with Y1699C-LRRK2, phospho-site mutants of HA-tagged Rab8A (WT/T72A/T72E) (A) or HA-tagged Rab10 (WT/T72A/T72E) and GFP-RILPL1 or GFP alone. Cells were treated with MLi2 as indicated. Lysates were immunoprecipitated with anti-GFP antibody and immunoblotted for Rab8A or Rab10 using anti-HA antibody to detect total proteins. Total lysates were immunoblotted for anti-HA, anti-GFP and anti-LRRK2 (UDD3). Immunoprecipitation is indicated by GFP-IP analyzed by immunoblot using anti-HA antibody and anti-pRab8A or anti-pRab10 antibody for detecting phosphorylated protein. Graph at bottom quantified the relative amount of Rab10 that was bound to RILPL1 in panel B. Error bars represent SEM from three independent experiments.
Figure 3 with 1 supplement
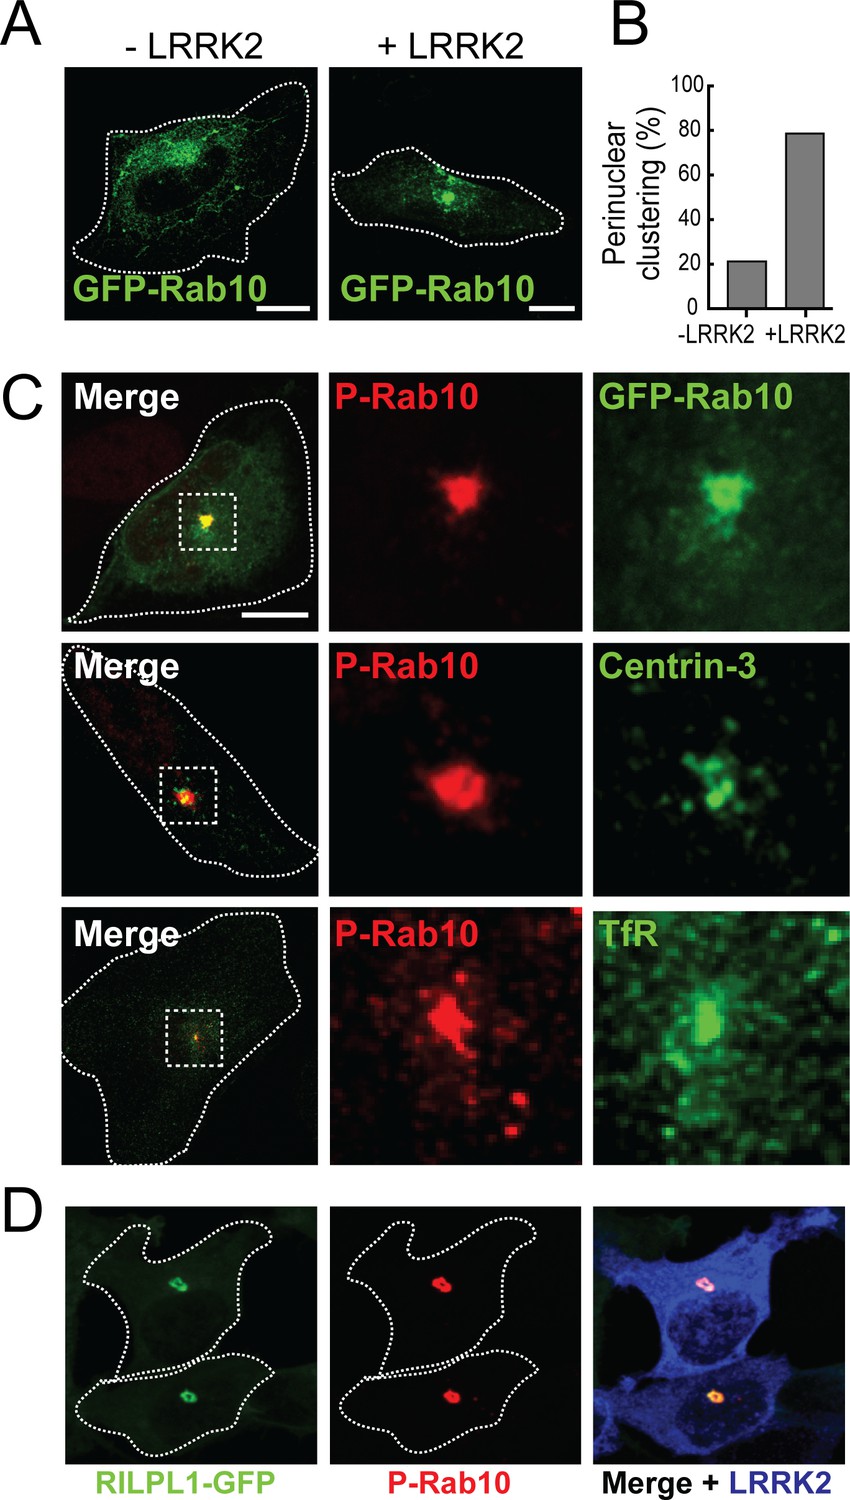
pRab10 localizes on peri-centriolar membranes.
HeLa cells stably expressing GFP-Rab10 were transfected with or without LRRK2-R1441G plasmid. After 24 hr, cells were fixed and stained with the indicated antibodies. (A) Localization of total GFP-Rab10 (green) without (left) or with (right) R1441G-LRRK2 transfection. (B) Quantitation of peri-nuclear clustering of GFP-Rab10. (C) Cells were stained with rabbit anti-pRab10 antibody (red) and co-stained with either mouse anti-GFP (green), mouse anti-Centrin-3 (green) or mouse anti-transferrin receptor (TfR, green). (D) HEK293T cells were co-transfected with myc-LRRK2-R1441G and RILPL1-GFP (green). After 24 hr, cells were fixed and stained for pRab10 (red) and LRRK2 (blue). Dotted lines indicate cell boundaries. Dotted boxes indicate the enlarged region of interest. Scale bars, 10 µm.
Figure 3—figure supplement 1
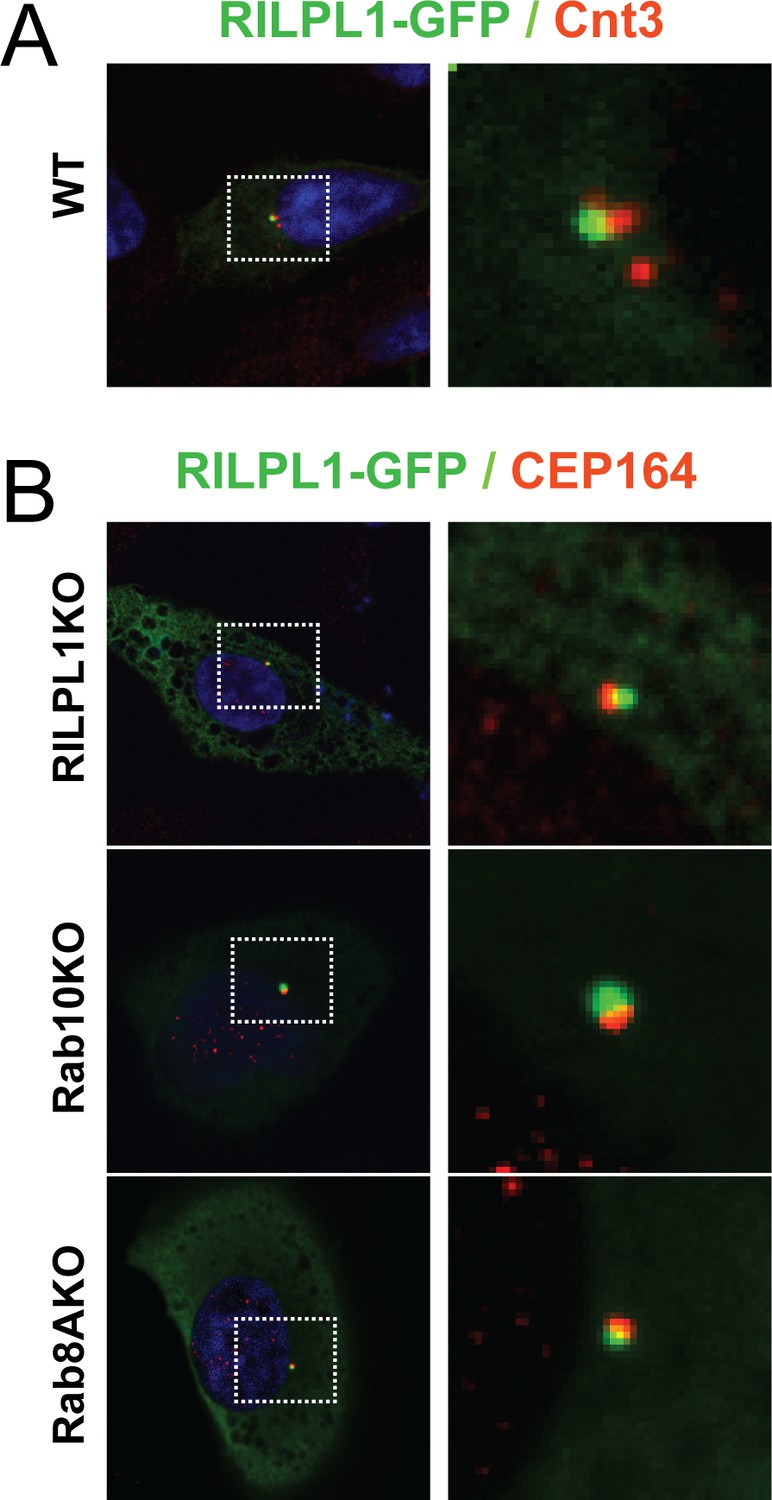
RILPL1 localizes to mother centrioles.
Wild type, Rab8A-KO, Rab10-KO and RILPL1-KO A549 cells were transfected with RILPL1-GFP. After 24 hr, cells were fixed and stained with antibodies against the general centriolar marker, mouse anti-Centrin-3 or with a mother centriole-specific marker, mouse anti-CEP164 antibodies and co-stained with chicken anti-GFP. (A) RILPL-GFP (green) and Centrin-3 (red). (B) RILPL1-GFP (green) and CEP164 (red). Knock out cell lines are indicated. Dotted box indicates the areas magnified in the insets.
Figure 4
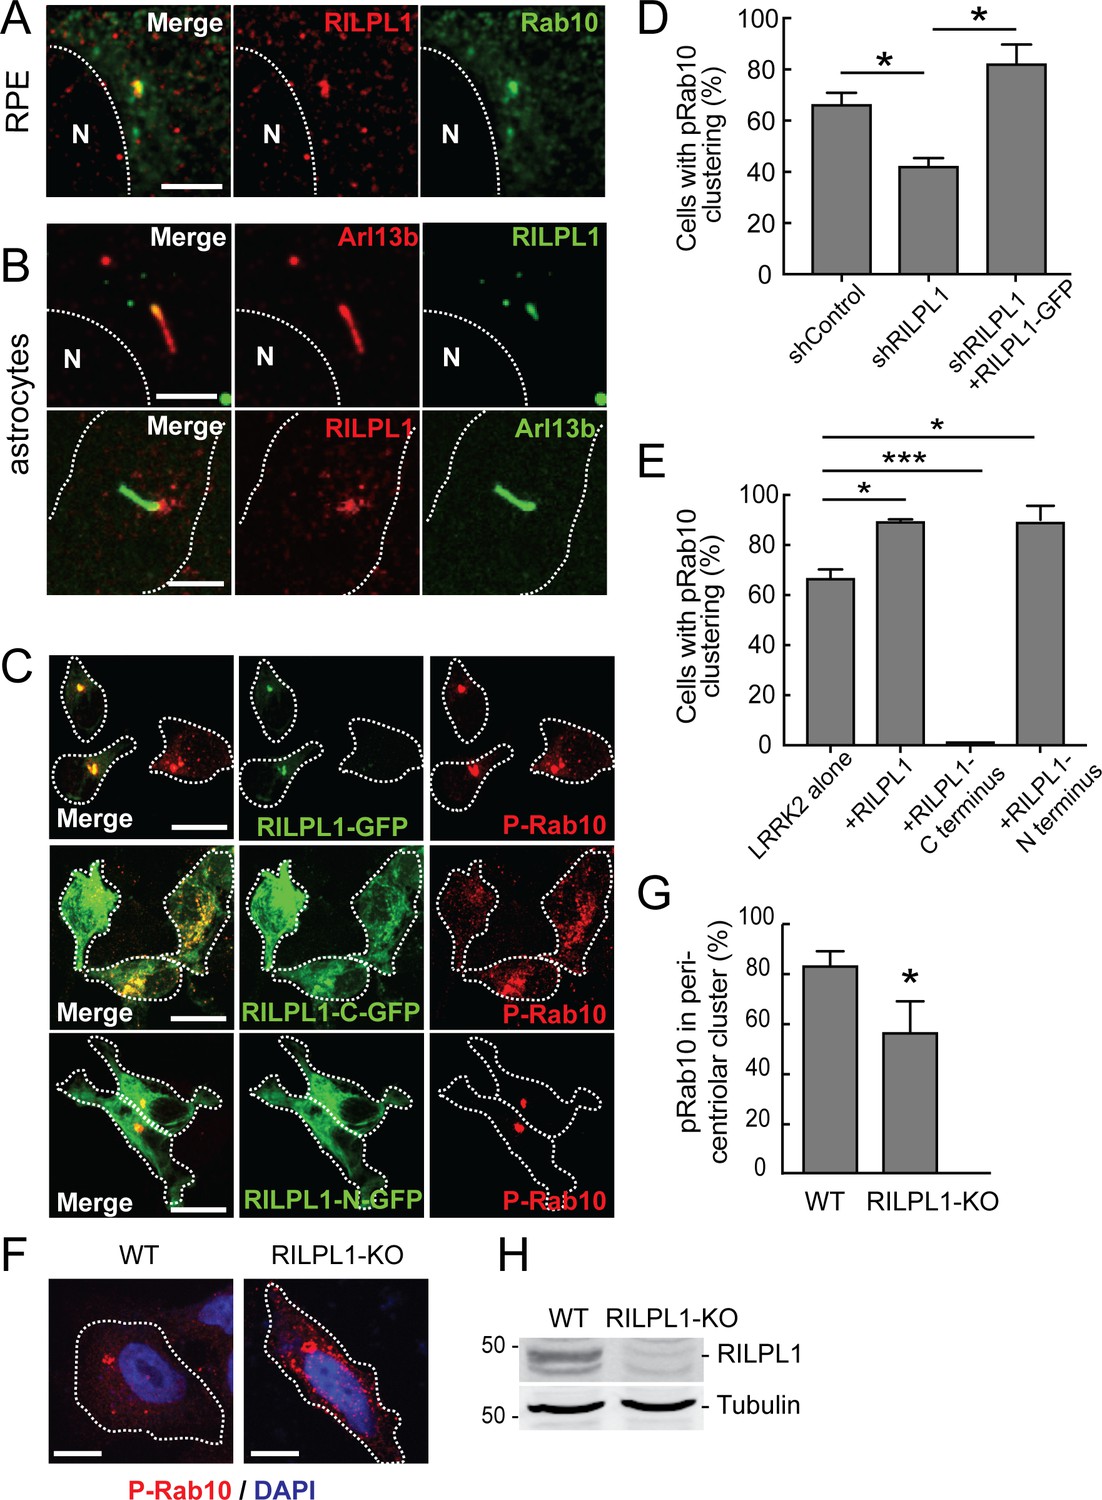
Localization of pRab10 is influenced by RILPL1.
(A) RPE cells were ciliated for 24 hr and stained with rabbit anti-RILPL1 antibodies (red) and co-stained with mouse anti-Arl13b or rabbit anti-Rab10 antibodies (green). (B) Rat primary astrocytes were ciliated and stained with anti-RILPL1 and anti-Arl13B antibodies as indicated. (C–E) HEK293T cells were infected with lentiviral shRNA for RILPL1 and selected by puromycin. LRRK2-R1441G was co-transfected with either RILPL1-WT. Also, RILPL1-C-terminus GFP or RILPL1-N-terminus GFP (green) were co-transfected with LRRK2 in wildtype cells. After 24 hr, cells were stained with anti-phospho-Rab10 antibody (red). (D) Quantitation of cells with peri-centriolar clustering of pRab10 in RILPL1 knock down HEK293T cells, with or without rescue by (full length) RILPL1-WT. (E) Quantitation of peri-centriolar clustering of pRab10 in cells transfected with full length, RILPL1-N terminus, RILPL1-C terminus. (F) A549 WT and A549-RILPL1 knock out cells were transfected with myc-LRRK2-R1441G and 24 hr later, stained with anti-pRab10 (red) and DAPI (blue). (G) Quantitation of total pRab10 in peri-centriolar clusters. (H) A549 WT and A549-RILPL1 knock out cells were lysed and analyzed by immunoblotting with the indicated antibodies. Error bars represent SEM from three experiments with >50 cells per condition in each experiment. *, p<0.05; **, p<0.05; ***, p<0.001. Scale bar, 10 µm.
Figure 5 with 1 supplement
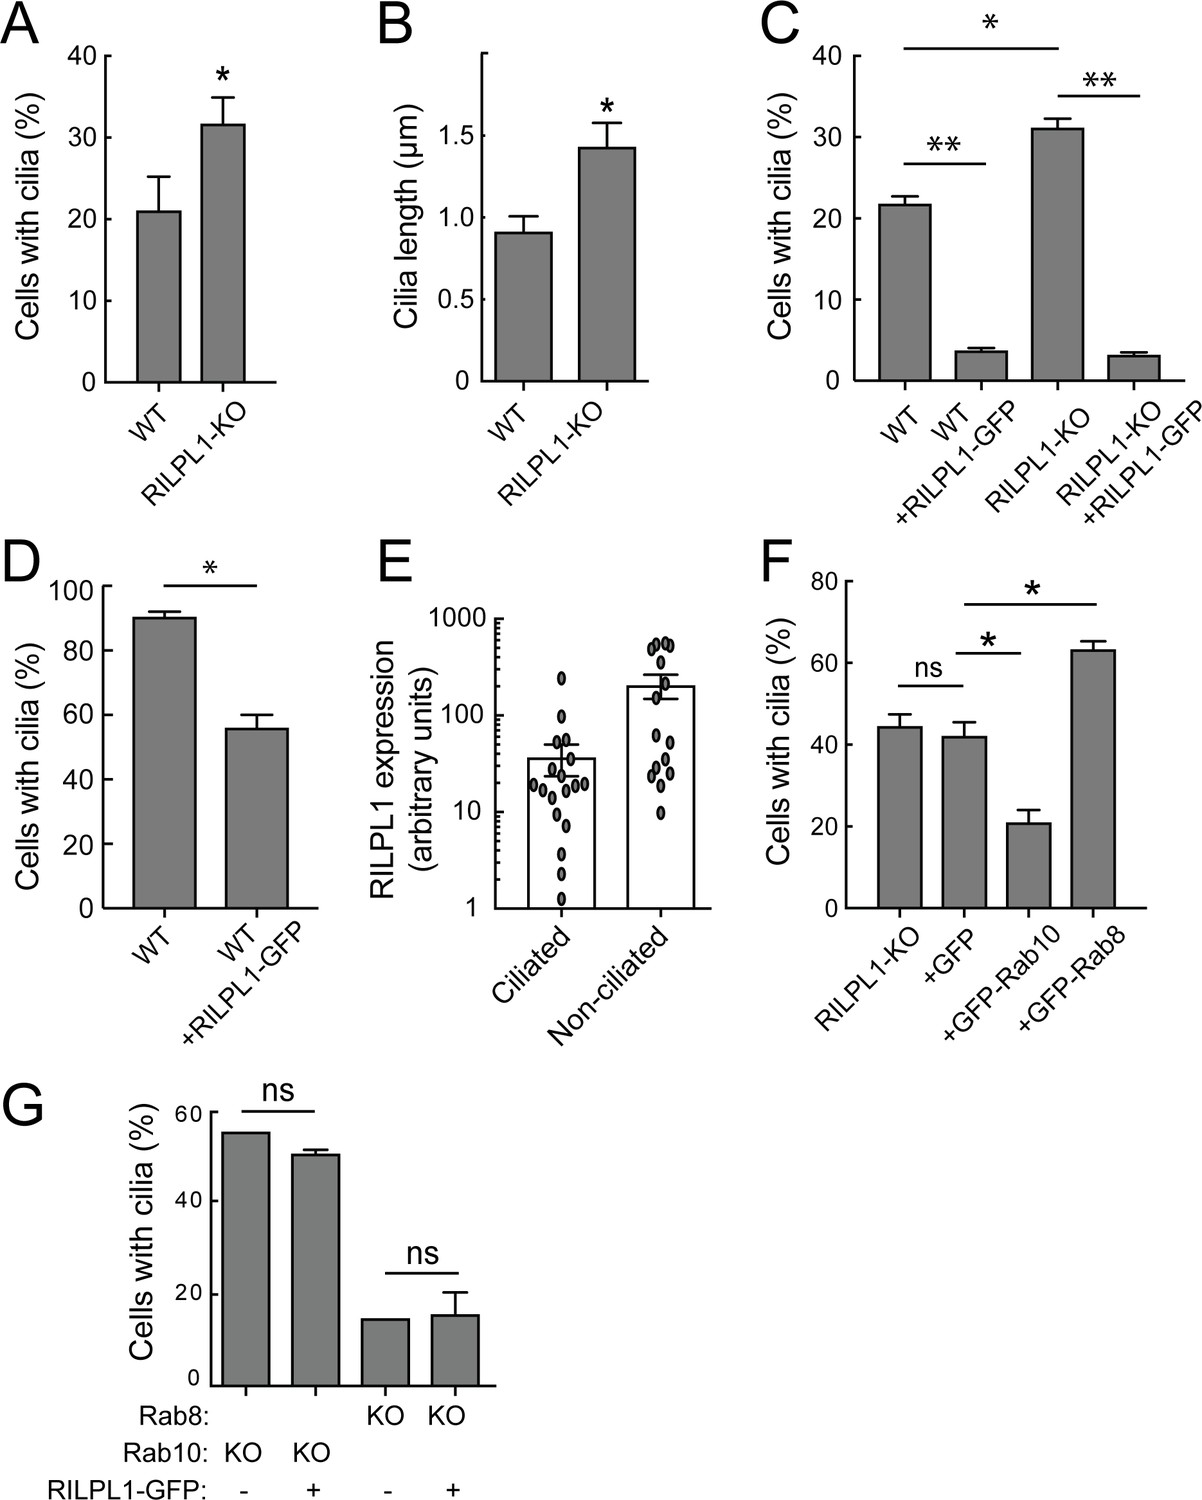
RILPL1 is a negative regulator of ciliation.
(A) Quantitation of primary cilia in WT and RILPL1-KO A549 cells. (B) Quantitation of cilia length in WT and RILPL1-KO cells. (C) Quantitation of cells with cilia when RILPL1-GFP is expressed in WT or RILP1-KO ad A549 cells. (D) Quantitation of cells with cilia when RILPL1-GFP is expressed in WT hTERT-RPE cells. (E) Quantitation of RILPL1-GFP expression in ciliated versus non-ciliated cells RPE by determining GFP signal intensity per cell in microscopy images. (F) Quantitation of cilia in A549 RILPL1-KO cells that were either un-transfected or transfected with GFP alone, GFP-Rab10 or GFP-Rab8A. (G) Quantitation of cilia in A549 cells lacking Rab8A or Rab10 as indicated, with or without RILPL1-GFP expression.
Figure 5—figure supplement 1
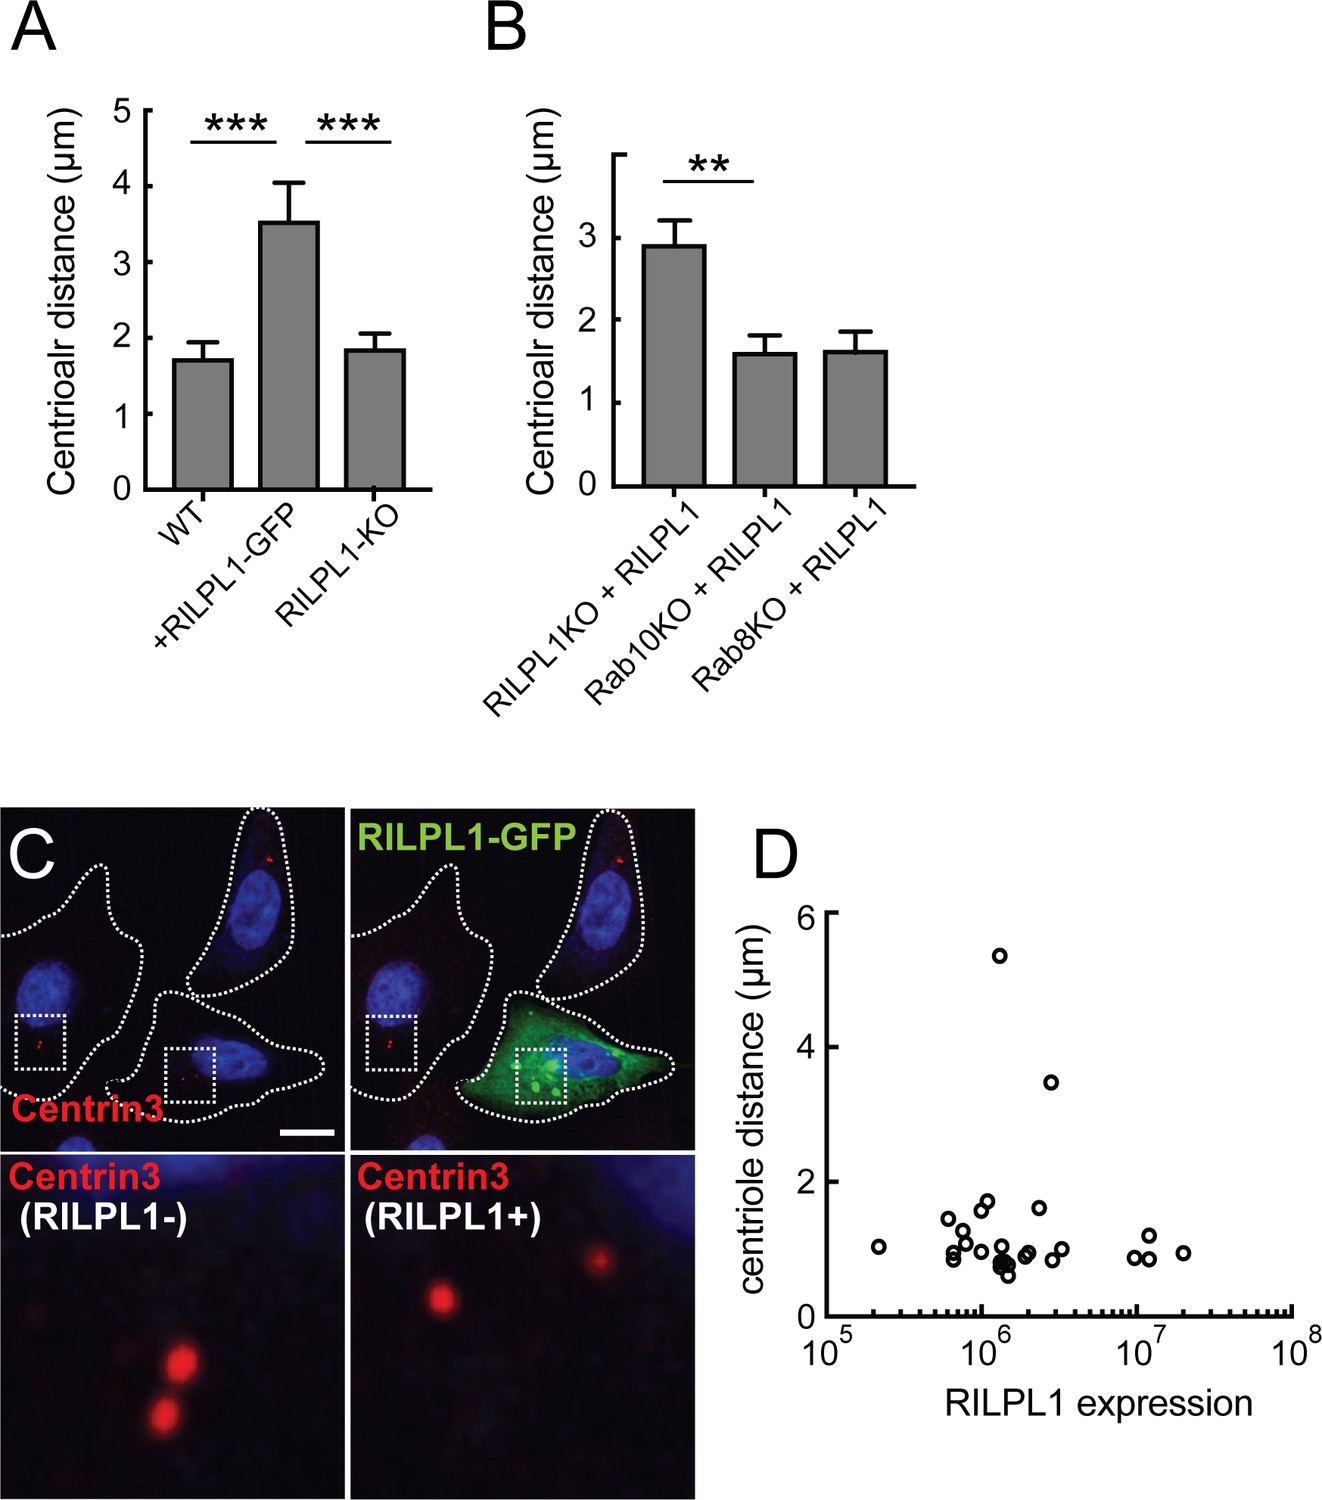
Exogenous RILPL1 expression disrupts centriolar cohesion.
(A) Measurements of the distances (in µm) between centriole dots in WT A549 cells alone, A549 after RILPL1-GFP transfection and RILPL1-KO cells. (B) Measurements of the distance (in µm) between centrioles when RILPL1-GFP is expressed in A549 cells lacking RILPL1, Rab10 or Rab8A. (C) A549 cells transfected for 24 hr with RILPL1-GFP plasmid, stained with mouse anti-Centrin-3 (red) and DAPI (blue). Dotted lines indicate the cell boundaries; boxes indicate the regions of the images magnified in the lower panels. Scale bars, 10 µm. (D) Distance between centrioles as a function of RILPL1-GFP expression, determined by quantitation of GFP fluorescence in expressing cells. Error bars represent SEM from two experiments. *, p<0.05. **, p<0.01; ***, p<0.001 by Student’s unpaired, two tailed T-test.
Figure 6
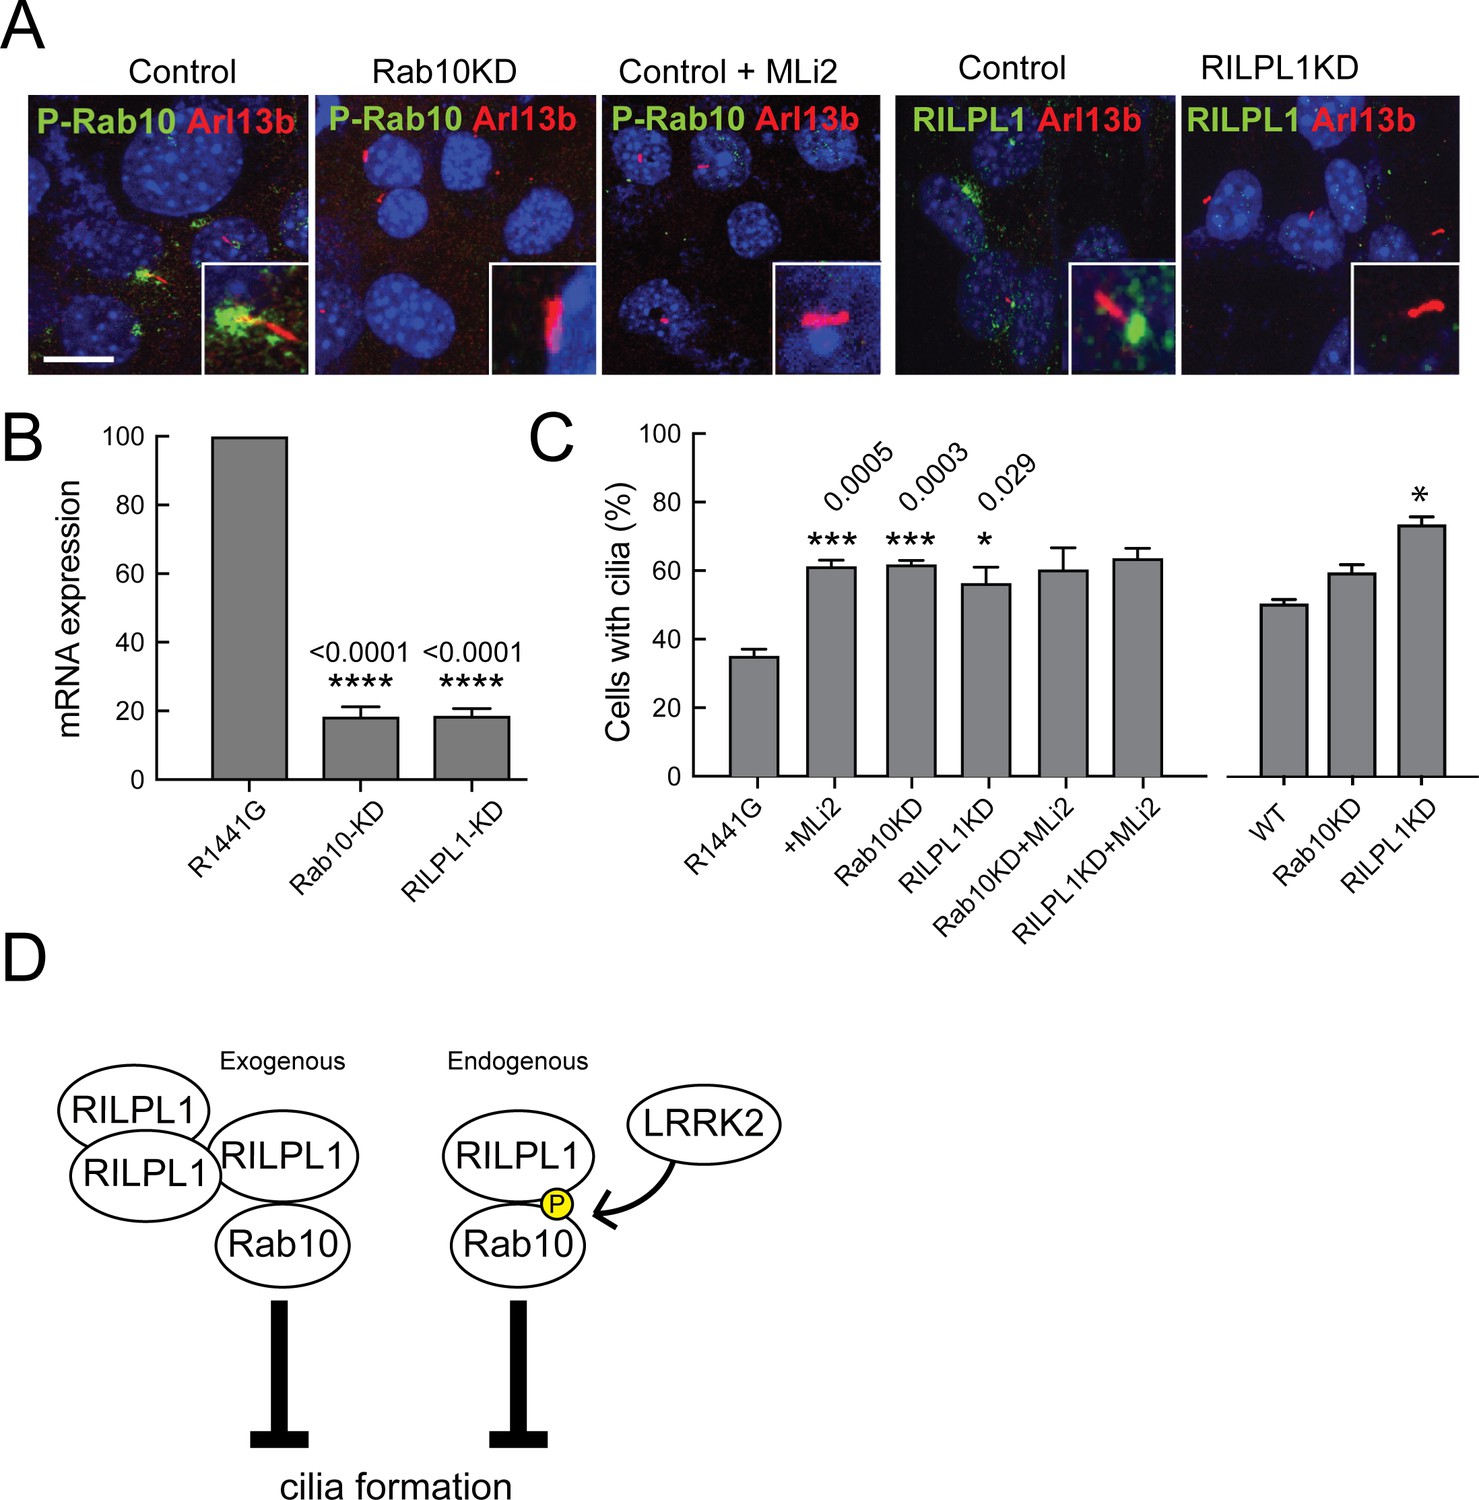
LRRK2-mediated cilia defects require Rab10 and RILPL1.
Rab10 and RILPL1 were depleted from LRRK2 R1441G MEFs using lentiviral delivery of shRNA. Cells were plated on coverslips or lysed for qPCR analysis 4 days post-infection. After 48 additional hours, cells were serum starved for 16 hr in the presence of 200 nM MLi2 or DMSO as indicated. (A) Cilia were stained with anti-Arl13b antibodies (red) and either anti-pRab10 (green) or anti-RILPL1 (green) as indicated. Nuclei were stained with DAPI (blue). Scale bar, 10 µm. Inset boxes show magnified regions including the cilium and its base. (B) Relative mRNA expression for Rab10 and RILPL1 in Rab10KD and RILPL1KD normalized to control R1441G-MEF cells. Error bars indicate standard error of the mean from quadruple qPCR replicates. (C) Quantitation of primary cilia in (left) R1441G-MEF cells or (right-most three bars) WT MEF cells,±MLi2,±Rab10 knock down or ±RILPL1 knock down. Error bars represent SEM from duplicate experiments quantifying >100 cells per experiment. Student unpaired 2-tailed T-test values showing *,<0.05, **,<0.001. (D) Graphical representation of the working model in which RILPL1 and phosphorylated Rab10 suppressing cilia formation cooperatively. RILPL1 cannot inhibit ciliation in cells lacking Rab10; overexpression of Rab10 inhibits ciliation, and LKKR2 kinase increases the susceptibility of cells to RILPL1 inhibition by increasing the affinity of RILPL1 for p-Rab10 protein. Under these conditions, pRab8A can also bind RILPL1 and both Rab8A and Rab10 fail to bind most of their other effector proteins.
Figure 7
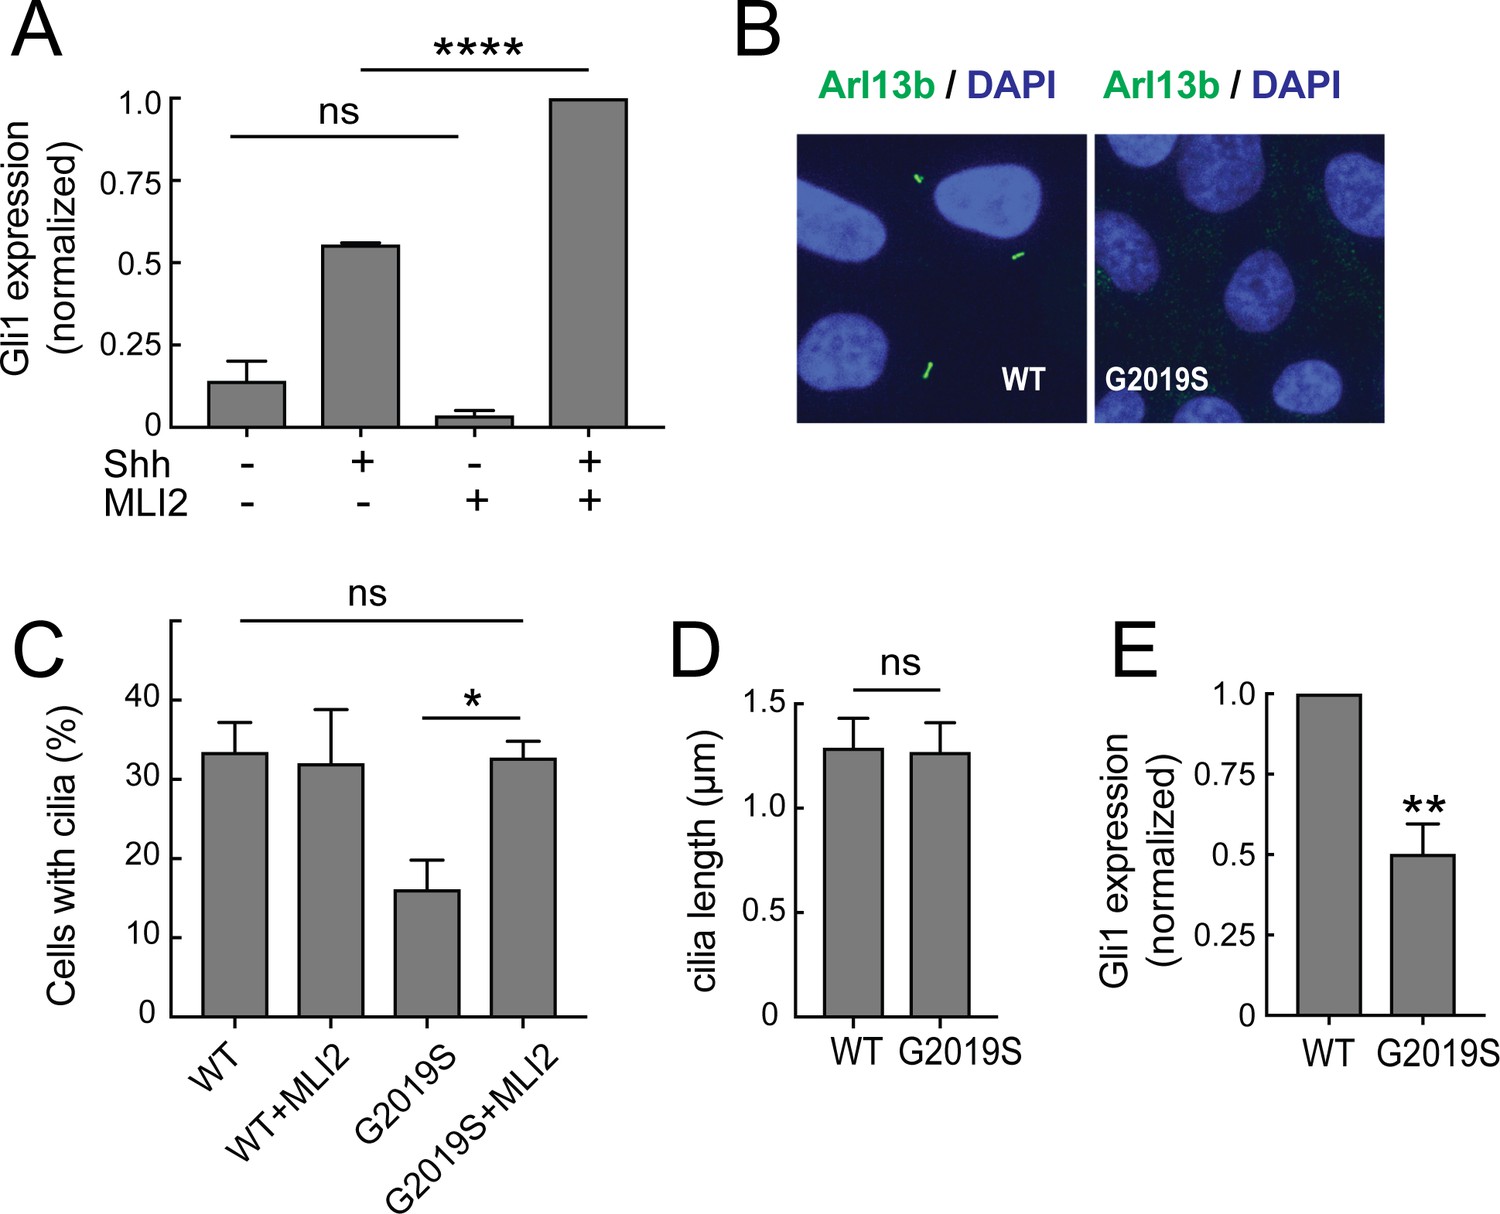
Ciliary signaling defects in MEFs and patient-derived iPS cells.
(A) Confluent LRRK2 R1441G MEF cells were treated with 25 nM Sonic hedgehog (Shh) or PBS along with 200 nM MLi2 or DMSO for 24 hr under serum starvation conditions and then lysed for RNA isolation. Shown is the Gli1 mRNA level relative to GAPDH mRNA, normalized to control samples treated with both MLi2 and Shh. Error bars indicate standard error of the mean from three independent experiments. (B–E) Undifferentiated, patient derived LRRK2G2019S/WT iPS cells were cultured for 48 hr on matrigel coated coverslips. They were fixed and stained for Arl13b (B) or lysed for RNA isolation and qPCR analysis (E). (B) Arl13b (green) and DAPI (blue) staining in G2019S or wild type cells as indicated. (C,D) Quantitation of ciliation and cilia lengths for LRRK2WT/WT and LRRK2G2019S/WT iPS cells; MLi2 treatment was for 24 hr (400 nM). (E) Relative mRNA expression of human Gli1 in LRRK2G2019S/WT iPS cells normalized to LRRK2WT/WT corrected cells as indicated. Error bars indicate SEM from two independent experiments, each done in duplicate. P values were from Student’s unpaired 2-tailed t test; ns = not significant, **,<0.01, ****,<0.001.
Figure 8 with 1 supplement
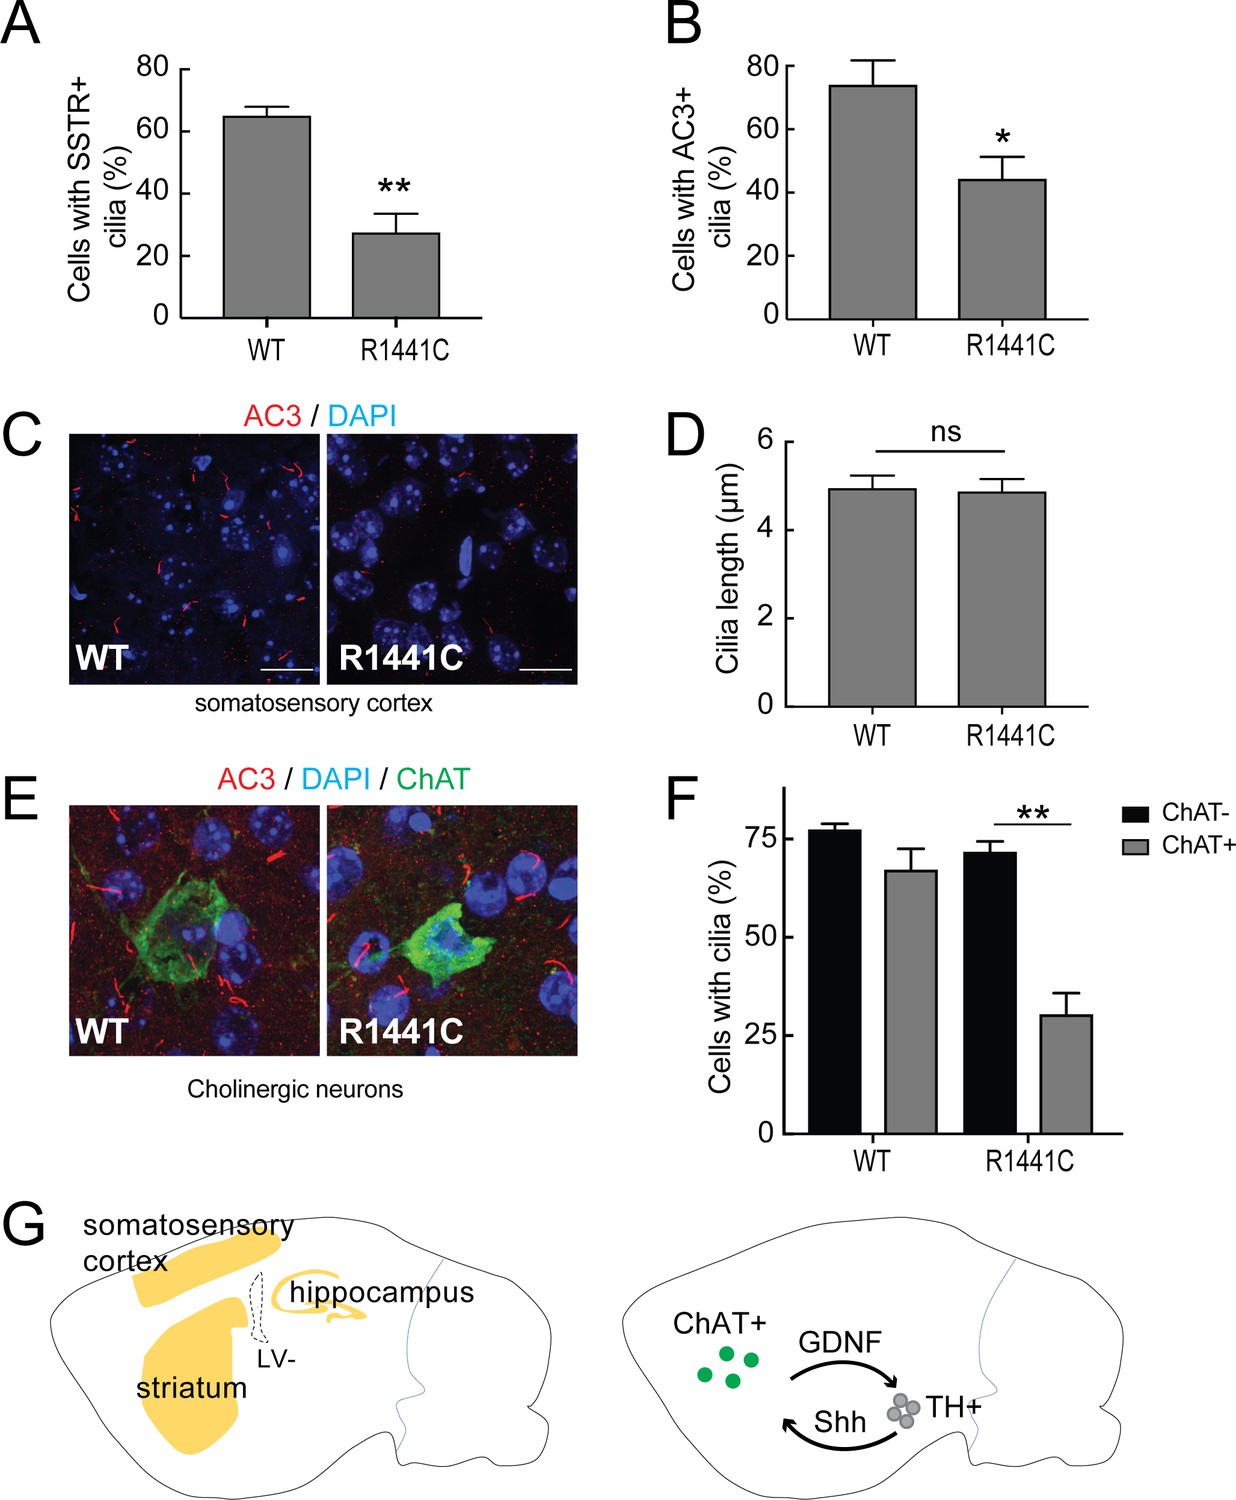
Primary cilia in mouse brain.
Brains from wild type and 7 month old R1441C LRRK2 mice were stained with rabbit antibodies to neuron-specific primary cilia markers: somatostatin receptor 3 (SSTR3) or adenylate cyclase 3 (AC3). Primary cilia were quantified from somatosensory cortex, hippocampus and striatal regions. (A) Quantitation of neurons with SSTR3+ primary cilia in the cortex. (B) Percent of total neurons with AC3+ primary cilia in the cortex. (C) Representative image showing neuronal primary cilia stained for AC3 (red) and nuclei (blue) in the cortex. (D) Average length of primary cilia in the cortex (µm). (E) Cholinergic neurons in the striatum stained with goat anti-ChAT (choline acetyltransferase antibody, green), anti-AC3 (red) and nuclei (blue). (F) Quantitation of ChAT+ and ChAT- neurons in the striatum with AC3+ primary cilia;>50 cholinergic neurons were counted. (G) Cartoon depicting the regions in sagittal sections of mouse brains (yellow) where neurons were sampled for primary cilia (left image). Right panel depicts reciprocal communication between ChAT +neurons in the striatum (green) with tyrosine hydroxylase positive (TH+) dopaminergic neurons (grey) linked via Glia derived neurotrophic factor (GDNF) and Sonic hedgehog (Shh) signaling. Error bars represent standard error of the mean from n = 4 mice,>500 cells per mouse; p values were determined by Student’s unpaired 2-tailed t-test.
Figure 8—figure supplement 1

Neuronal primary cilia in hippocampus and striatum.
Anti-Adenylate cyclase three staining for primary cilia in hippocampal (A–C) or striatal (D–F) regions of wild type and 7 month old LRRK2 R1441C mouse brains. (A,D) Length of primary cilia measured in µm. (B, E) Quantitation of neurons with primary cilia. (C, F) Representative images of brain sections stained with anti-AC3 antibodies (red) and DAPI (blue). Scale bar, 10 µm. Error bars represent SEM from four mice. WT and R1441C are indicated. p-values>0.05 were considered not significant (ns).
Tables
Table 1
Summary of Rab8A and Rab10 phosphosite mutant protein properties
https://doi.org/10.7554/eLife.40202.006| Rab protein | Membrane associated | Localization | In vitro prenylated | In/at base of cilia | Rescue ciliation in knockout cells | Bind RILPL1 strongly |
|---|---|---|---|---|---|---|
| Rab8A WT | YES | Perinuclear Cilium | YES | In/at base | YES | When phosphorylated |
| Rab8A TA | YES | Golgi | YES | NO | NO | NO |
| Rab8A TE | Aggregated? | Golgi? | NO | NO | NO | POORLY |
| Rab10 WT | YES | Perinuclear Cilium base | YES | At base | YES | When phosphorylated |
| Rab10 TA | NO | Cytosol | NO | NO | NO | NO |
| Rab10 TE | YES | Golgi | YES | NO | NO (dominant effect) | POORLY |
Additional files
-
Transparent reporting form
- https://doi.org/10.7554/eLife.40202.017
Download links
A two-part list of links to download the article, or parts of the article, in various formats.
Downloads (link to download the article as PDF)
Open citations (links to open the citations from this article in various online reference manager services)
Cite this article (links to download the citations from this article in formats compatible with various reference manager tools)
A pathway for Parkinson’s Disease LRRK2 kinase to block primary cilia and Sonic hedgehog signaling in the brain
eLife 7:e40202.
https://doi.org/10.7554/eLife.40202


