Global warming reduces leaf-out and flowering synchrony among individuals
- ETH Zurich (Swiss Federal Institute of Technology), Switzerland
- University of Munich (LMU), Germany
Figures
Figure 1 with 5 supplements
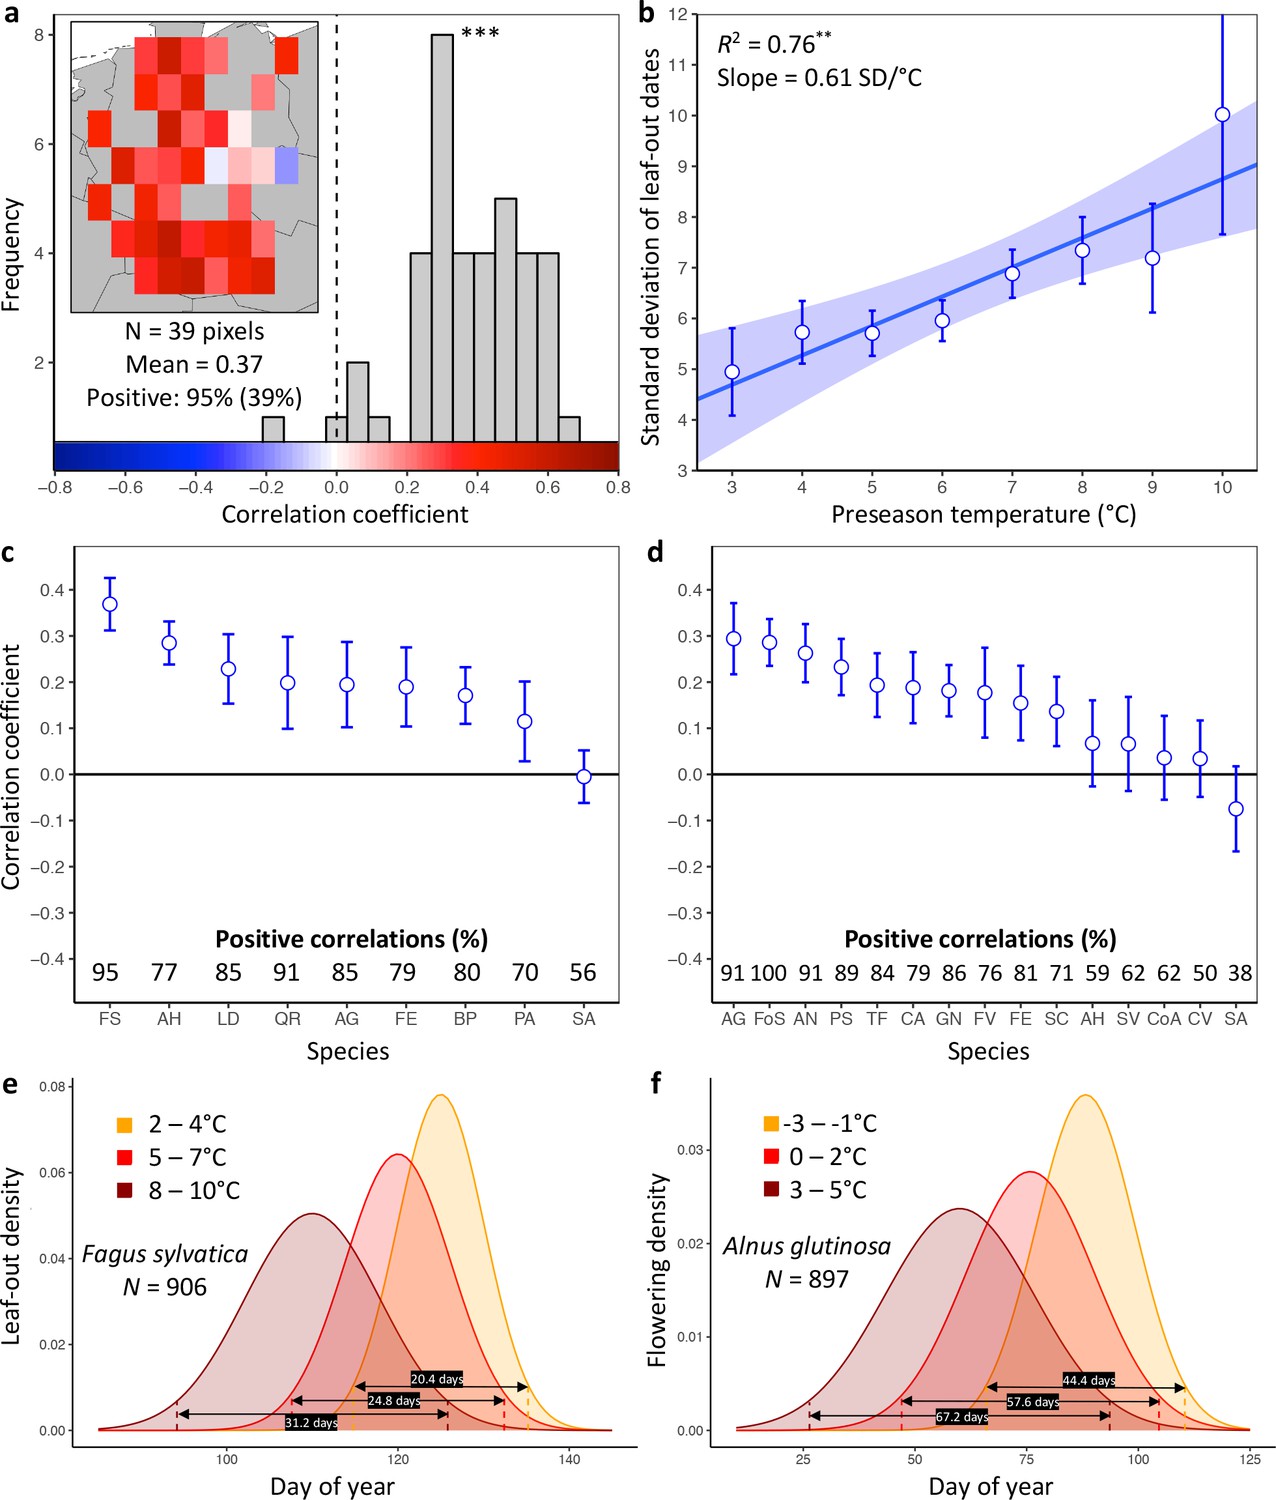
Loss of inter-individual synchrony in leaf-out and flowering with increasing temperatures.
(a) Frequency distribution showing the correlations between the standard deviation of inter-individual leaf-out times and spring temperature for Fagus sylvatica at 39 pixels (1° x 1° areas). Mean = Mean correlation coefficients across all sites (N) Positive = percentage of positive correlations and the percentage of statistically significant positive correlations (in parentheses). Inset shows a heat map of the correlations at the 39 pixels. (b) Effect of preseason temperature on the standard deviation of inter-individual leaf-out times (mean ± SEM) in F. sylvatica averaged across all years and sites. (c) (d) Mean Pearson correlation coefficients (± 95% confidence intervals) for the effect of spring temperature on the standard deviation of inter- individual leaf-out (c) or flowering times (d). Positive correlations = percentage of the total number of positive correlations. See Figure 1—figure supplements 1b and 2b for number of sites (1° x 1° areas) in which the relationship was analyzed. (e) (f) Distributions of inter-individual (e) leaf-out dates in F. sylvatica and (f) flowering dates in Alnus glutinosa under different spring temperatures. N = Number of available year x pixel (1° x 1° areas) combinations. To model the distributions (means and standard deviations), mixed-effects models were applied including site (pixel) as a random effect. See for distributions of all 20 analyzed species. AG, Alnus glutinosa; AH, Aesculus hippocastanum; AN, Anemone nemorosa; BP, Betula pendula; CA, Corylus avellana; CoA; Colchicum autumnale; CV, Calluna vulgaris; FE, Fraxinus excelsior; FoS, Forsythia suspensa; FS, Fagus sylvatica; FV, Fragaria vesca; GN, Galanthus nivalis; LD, Larix decidua; PA, Picea abies; PS, Prunus spinosa; QR, Quercus robur; SA, Sorbus aucuparia; SC, Salix caprea; SV, Syringa vulgaris; TF, Tussilago farfara.
Figure 1—figure supplement 1
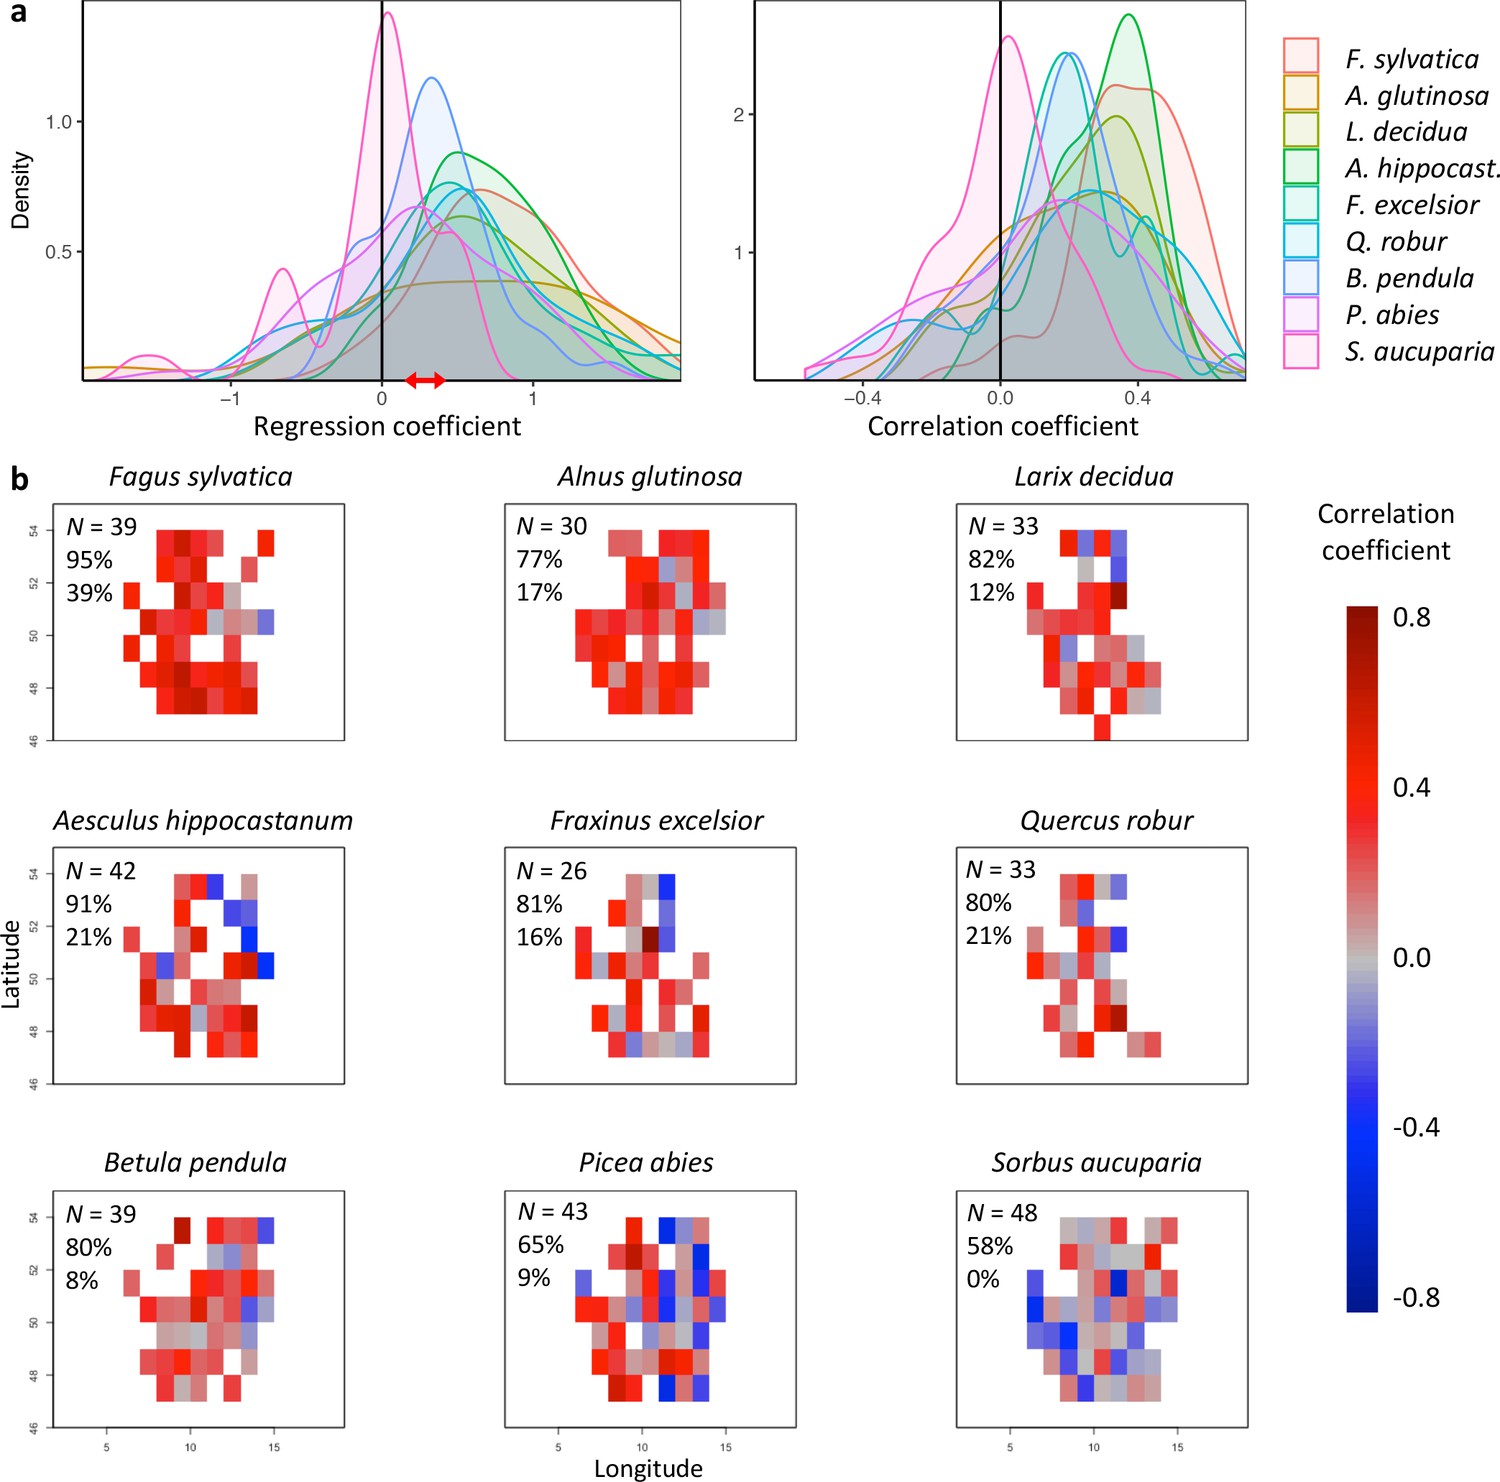
Effects of preseason temperature on inter-individual leaf-out synchrony (LOS), using PEP data.
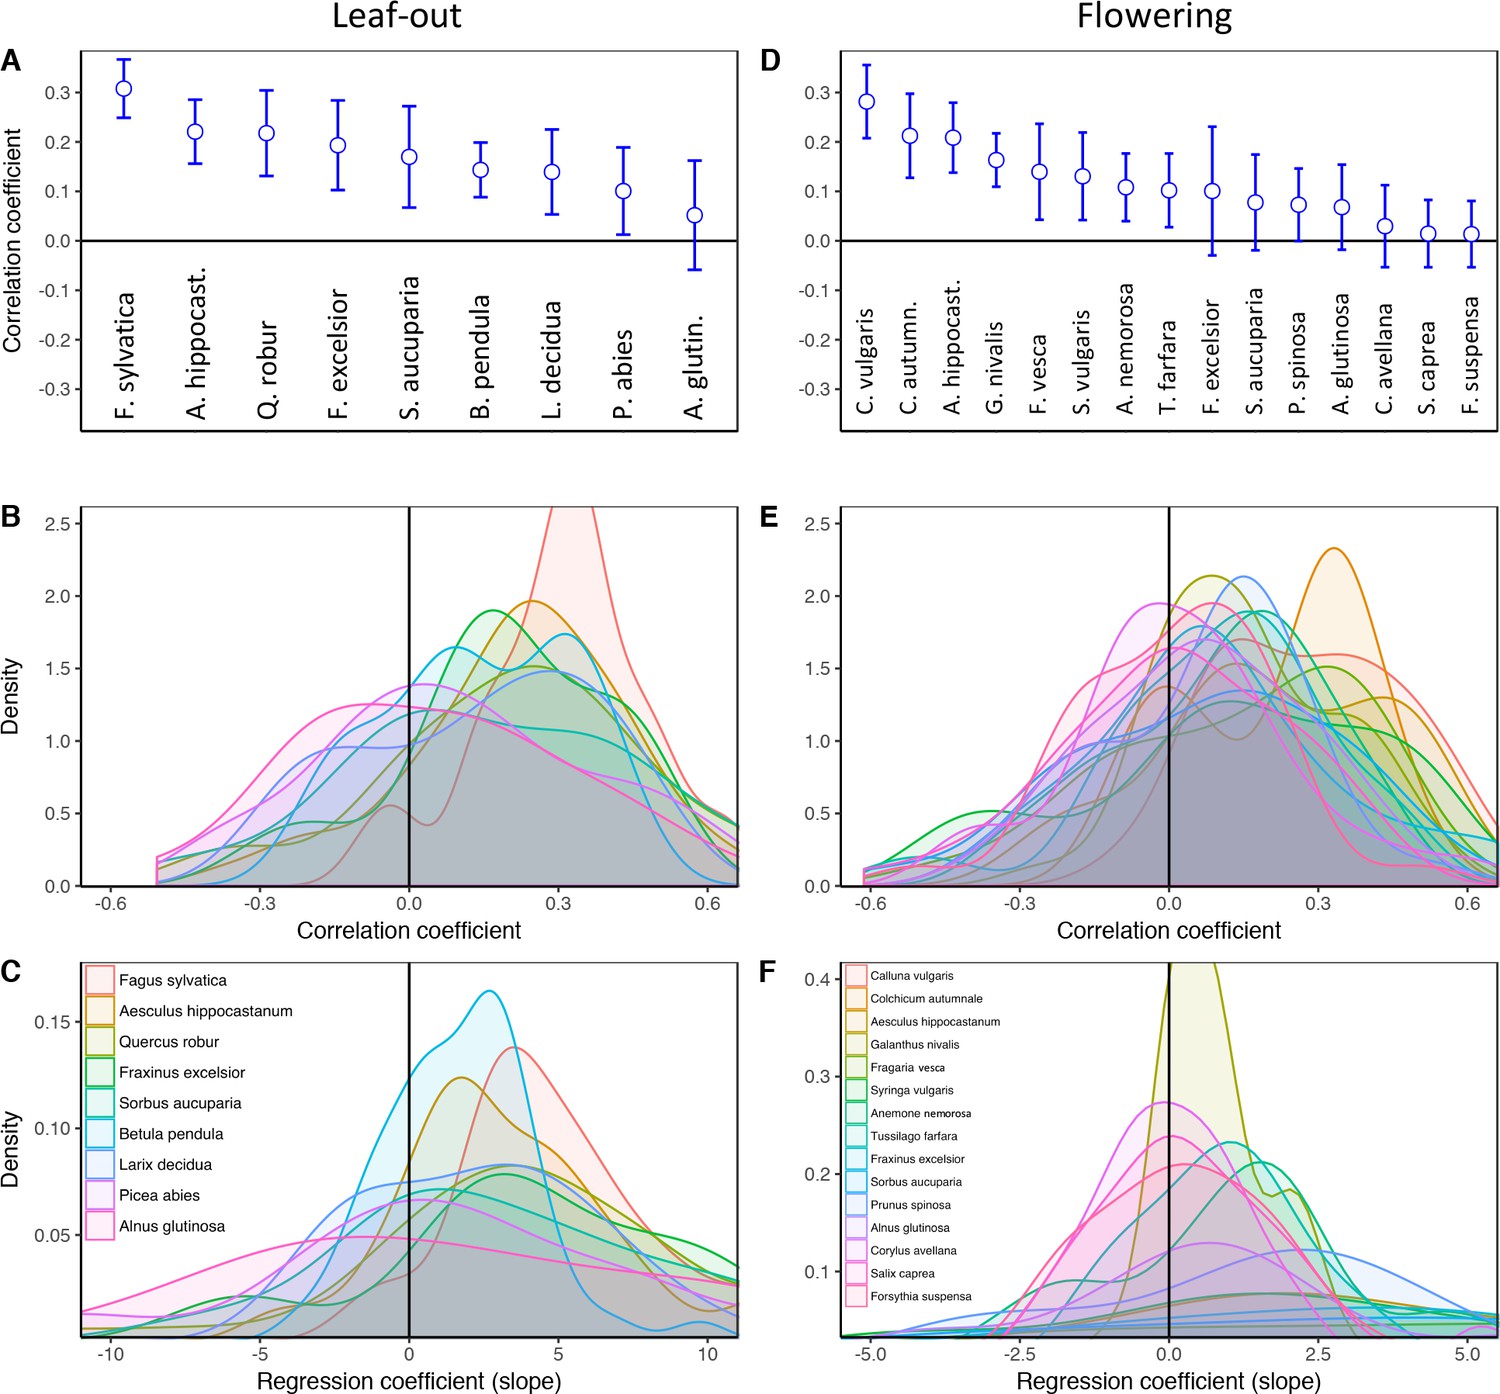
(a) Density plots of regression (left) and Pearson correlation coefficients (right) between LOS and preseason temperature for nine species. Regression coefficients show the change in LOS per each degree increase in preseason temperature. The red arrow indicates the range of regression coefficients obtained when simulating spring phenology with a degree-day model (see Figure 2—figure supplements 2. (b) Maps showing the regression coefficients for the effect of temperature on LOS at each site (colour coding according to correlation coefficients). N = Number of sites (1° x 1° pixels) in which the relationship was analysed. Percentages are the proportion of positive correlations and significantly positive correlations, respectively.
Figure 1—figure supplement 2
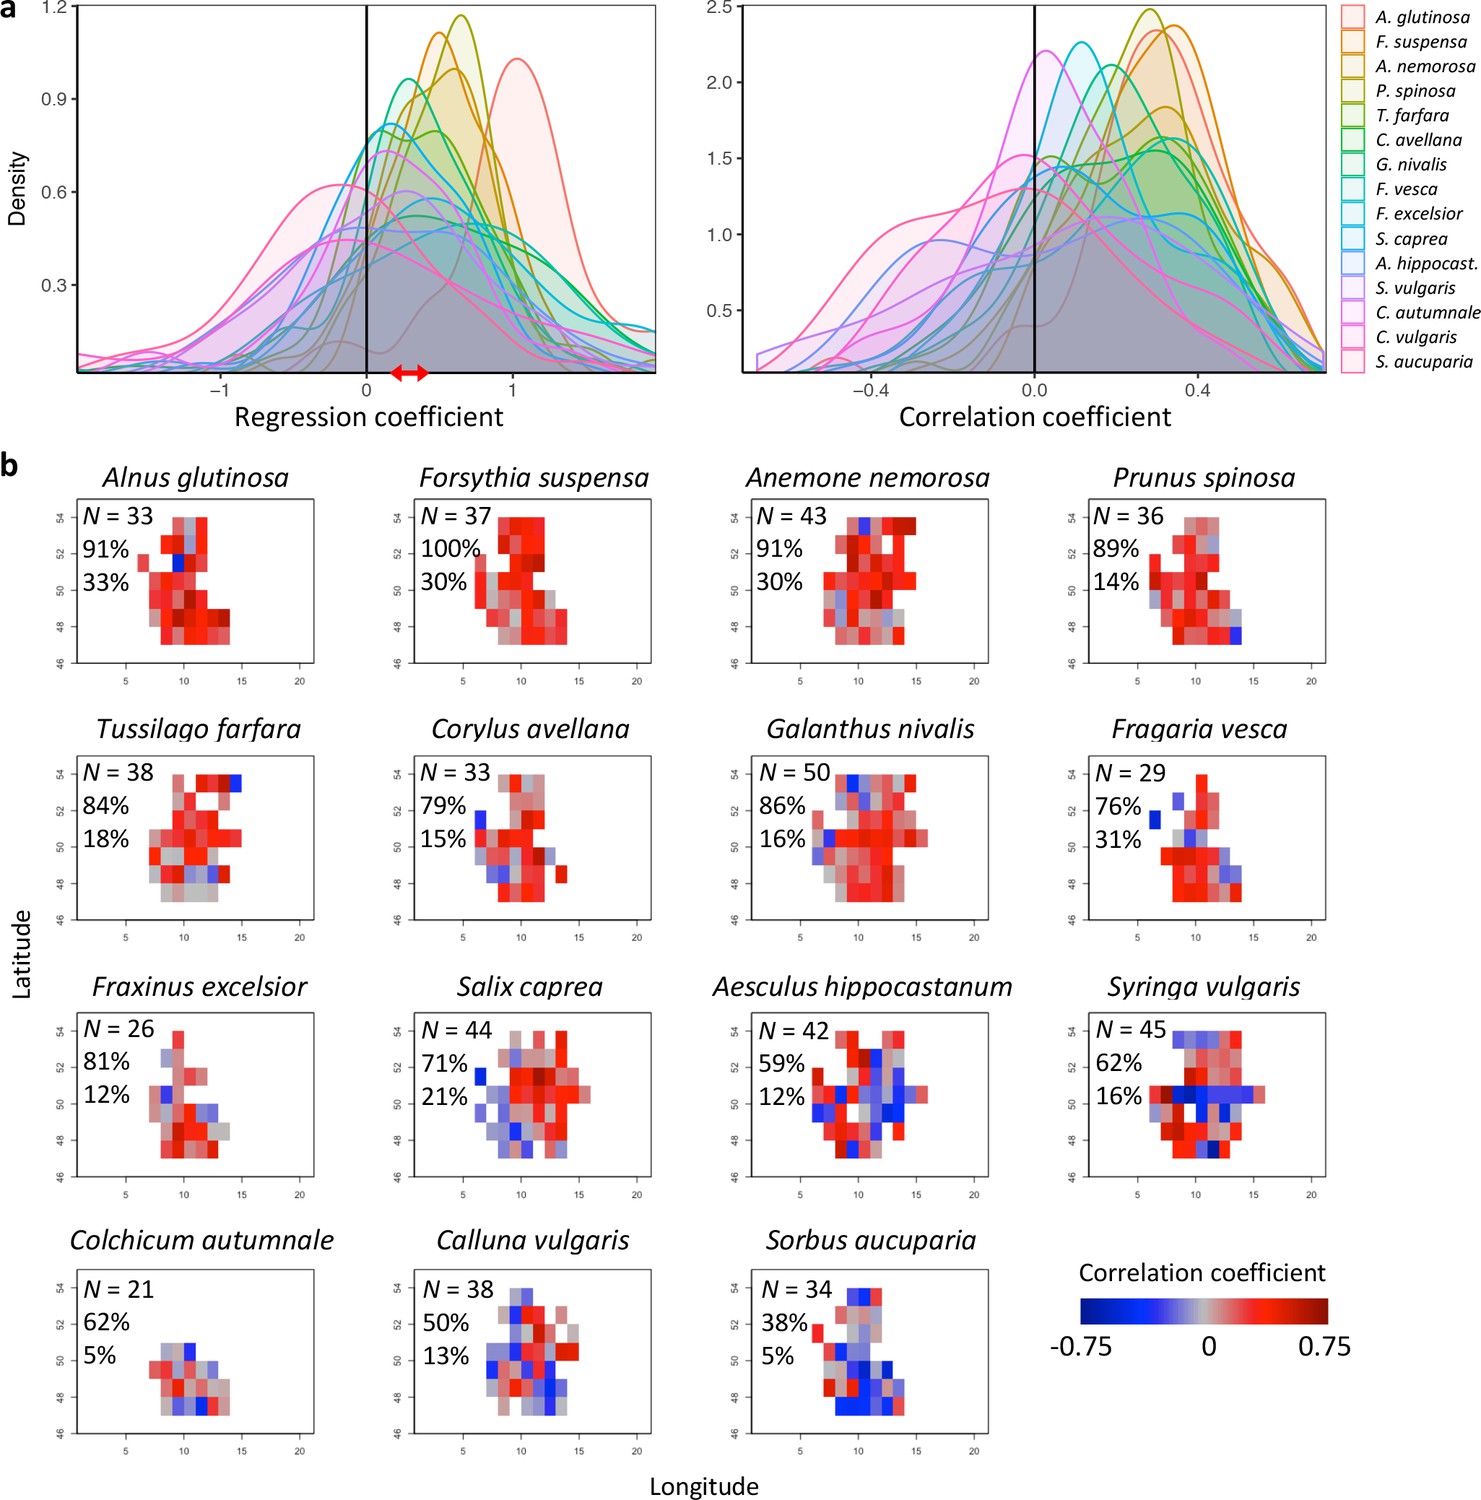
Effects of preseason temperature on inter-individual flowering synchrony (FLS), using PEP data.
(a) Density plots of regression (left) and Pearson correlation coefficients (right) between FLS and spring temperature for 15 species. Regression coefficients show the change in FLS per each degree increase in spring temperature. The red arrow indicates the range of regression coefficients obtained when simulating spring phenology with a degree-day model (see Figure 2—figure supplements 2. (b) Maps showing the correlation coefficients for the effect of temperature on FLS at each site (colour coding according to correlation coefficients). N = Number of sites (1° x 1° areas) in which the relationship was analysed. Percentages are the proportion of positive correlations and significantly positive correlations, respectively.
Figure 1—figure supplement 3
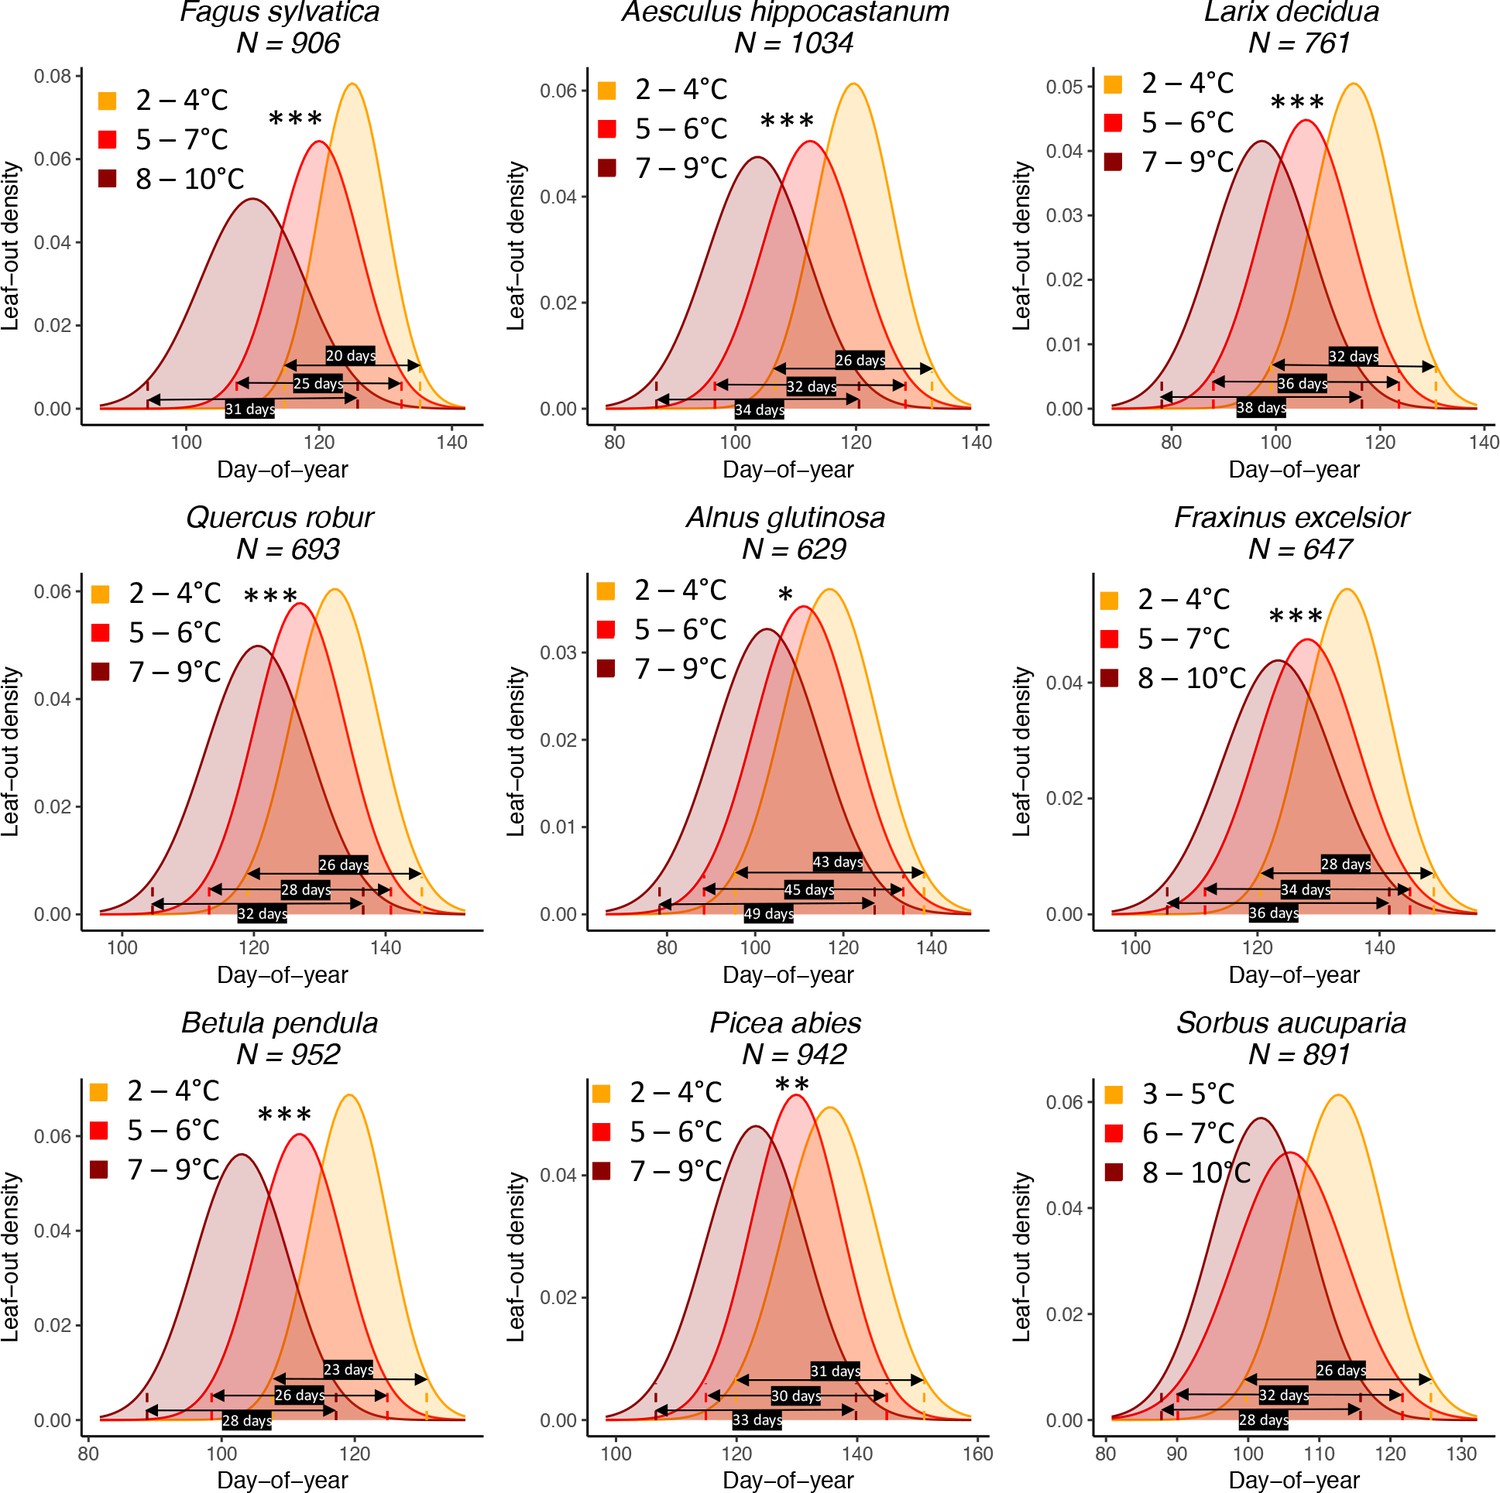
The effect of preseason temperature on inter-individual (within-population) leaf-out distributions.
N = Number of available year x site (1° x 1° areas) combinations. To model the distributions (means and standard deviations), mixed-effects models were applied including site as a random effect. Stars indicate a significant positive effect of preseason temperature on LOS (*p<0.05; **p<0.01; ***p<0.001). Black arrows show the period in which > 95% of individuals leaf out (four standard deviations), for example, for Fagus sylvatica, in years with a cool preseason, 95% of individuals within a population leaf out within 20 days, whereas in years with a warm preseason this period is 31 days (55% longer).
Figure 1—figure supplement 4
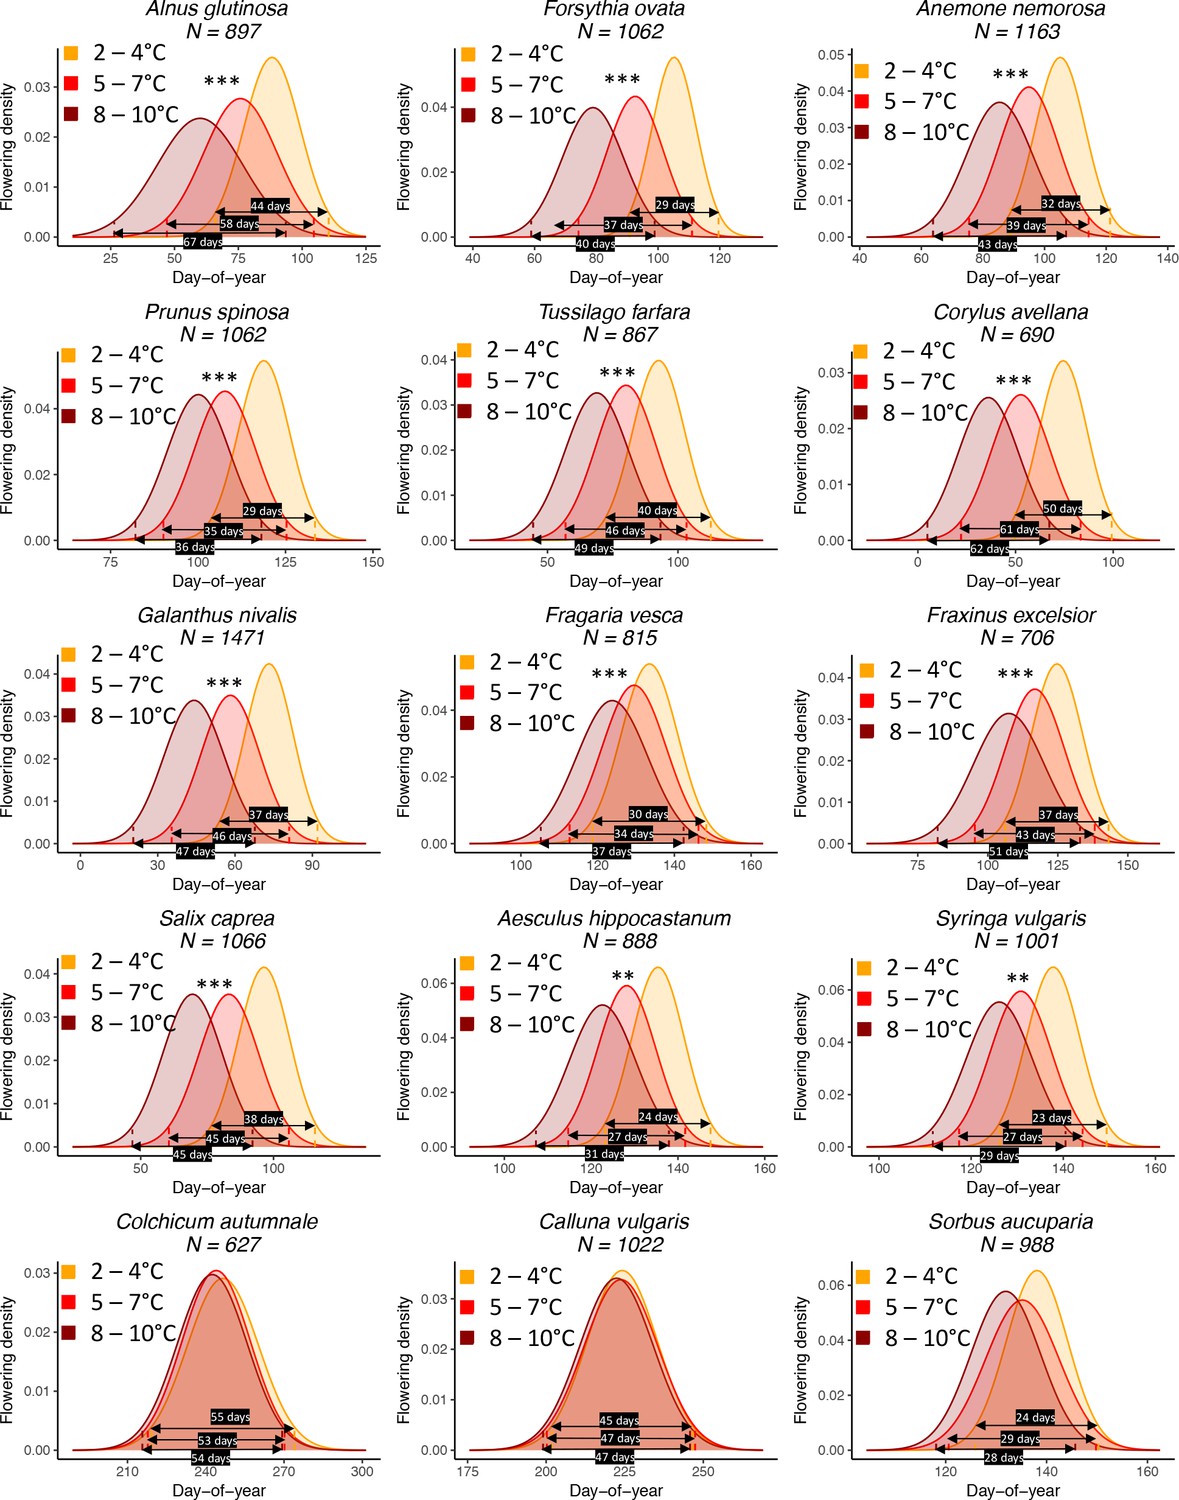
The effect of preseason temperature on inter-individual (within population) flowering distributions.
N = Number of available year x site (1° x 1° areas) combinations. To model the distributions (means and standard deviations), mixed-effects models were applied including site as a random effect. Stars indicate a significant positive effect of preseason temperature on FLS (*p<0.05; **p<0.01; ***p<0.001). Black arrows show the period in which > 95% of individuals flower (four standard deviations), for example, for Alnus glutinosa, in years with a cool preseason, 95% of individuals within a population flower within 44 days, whereas in years with a warm preseason this period is 67 days (52% longer).
Figure 1—figure supplement 5
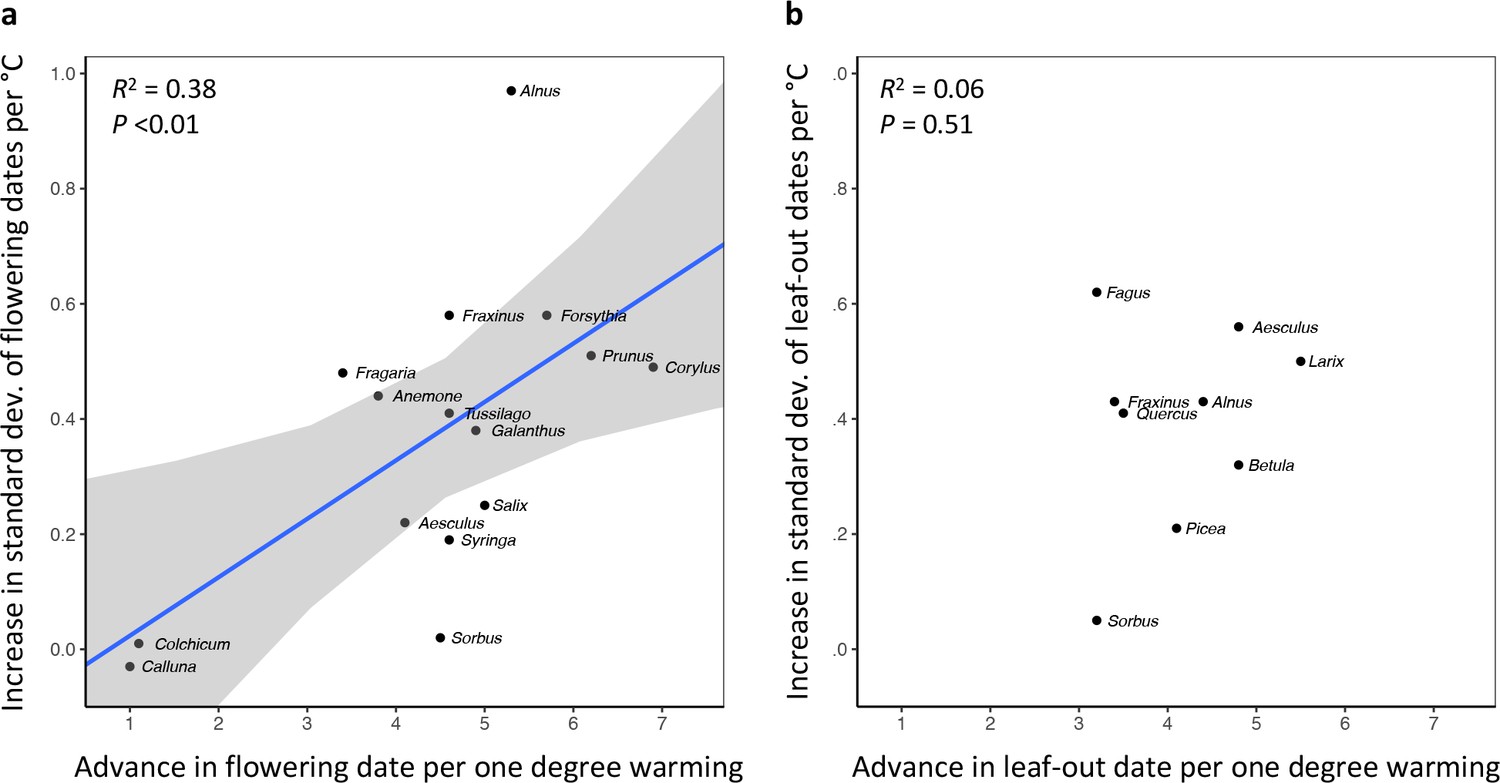
In species in which preseason temperature has little effect on the mean flowering date, preseason temperature also has little effect on FLS.
(a) Positive correlation between species’ mean temperature sensitivity of flowering date (days advance in flowering per one degree warming) and the mean temperature sensitivity of FLS (increase in the standard deviation of inter-individual flowering times per one degree warming). (b) No correlation between species’ mean temperature sensitivity of leaf-out date (days advance in leaf-out per one degree warming) and the mean temperature sensitivity of LOS (increase in the standard deviation of inter-individual leaf-out times per one degree warming). The effects of preseason temperature on mean flowering date, mean leaf-out date, FLS, and LOS were inferred from mixed-effects models including site as a random effect. Species: Alnus glutinosa, Aesculus hippocastanum, Anemone nemorosa, Betula pendula, Corylus avellana, Colchicum autumnale, Calluna vulgaris, Fraxinus excelsior, Forsythia suspense, Fagus sylvatica, Fragaria vesca, Galanthus nivalis, Larix decidua, Picea abies, Prunus spinosa, Quercus robur, Sorbus aucuparia, Salix caprea, Syringa vulgaris, Tussilago farfara.
Figure 2 with 2 supplements
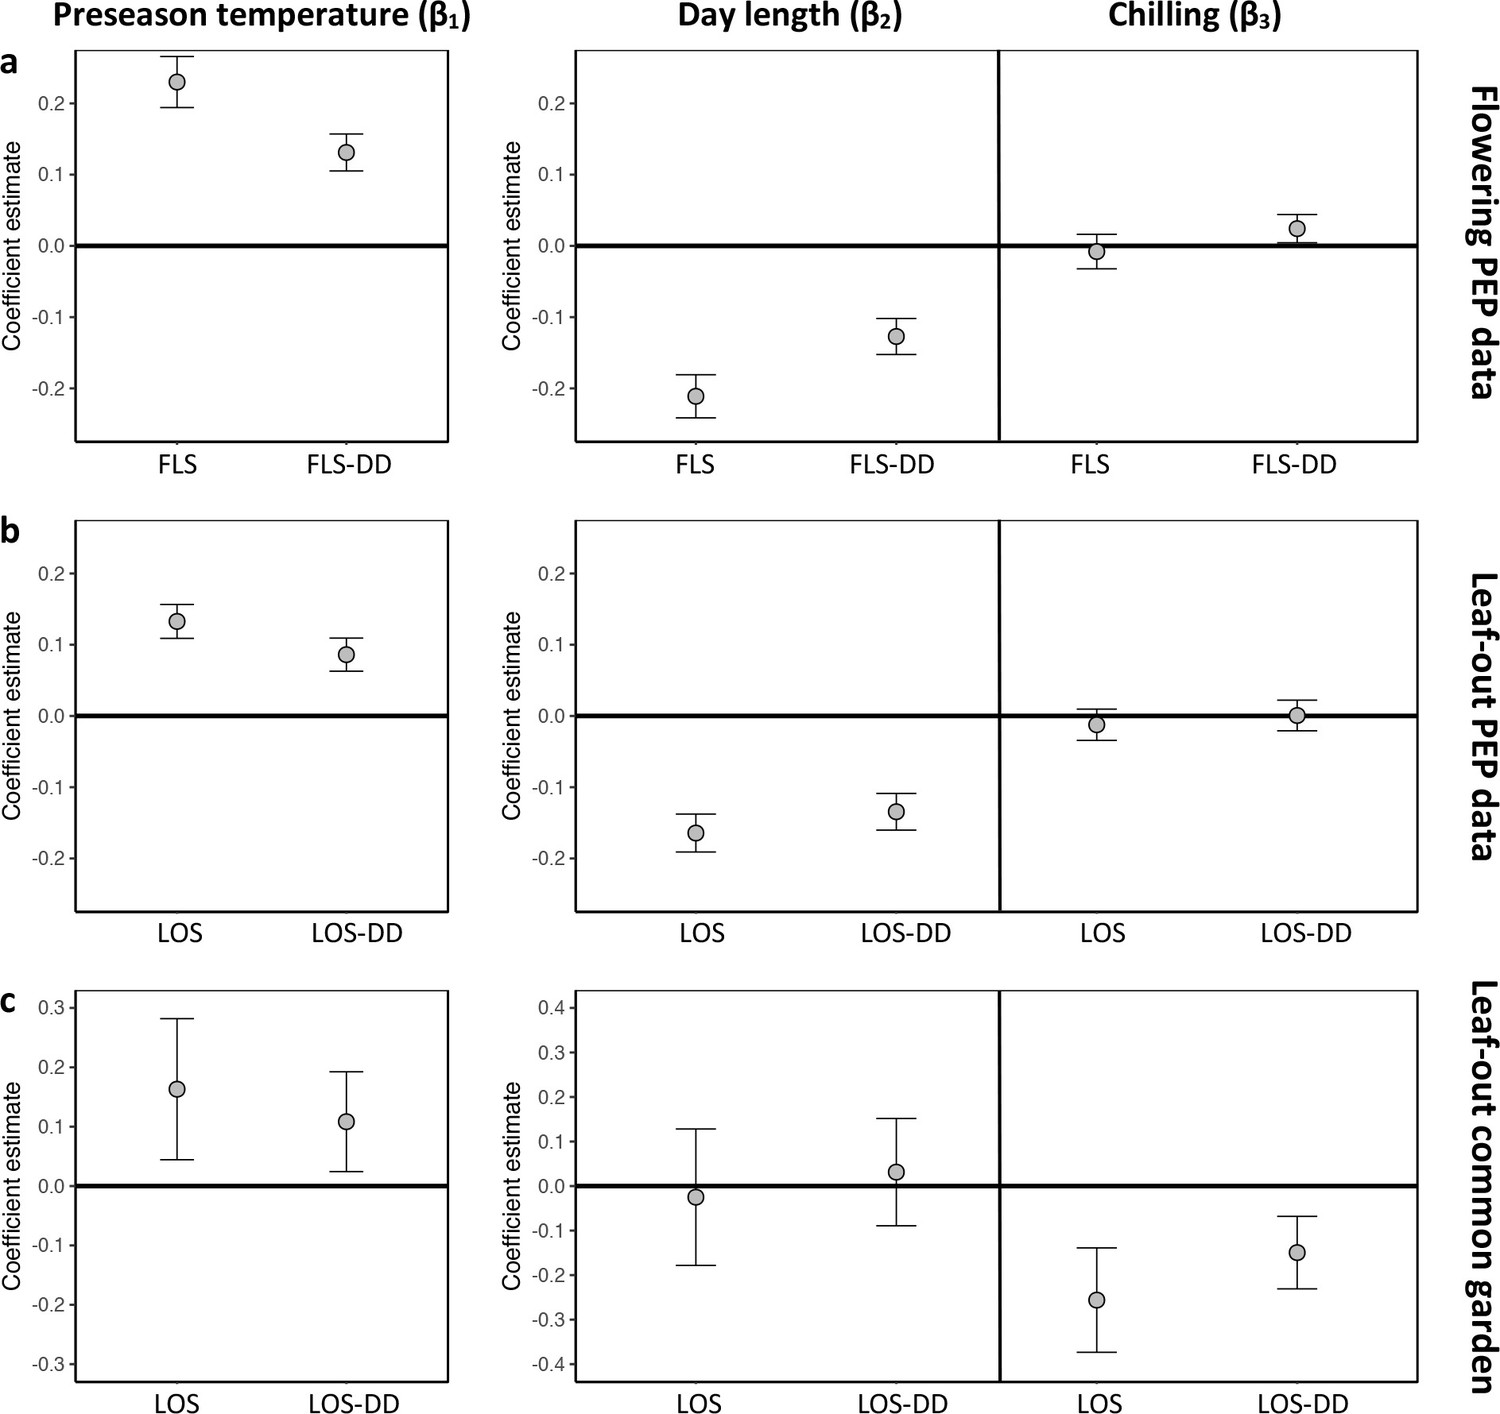
Hierarchical Bayesian models to test for the environmental drivers of inter- individual flowering (a) and leaf-out (b, c) synchrony.
Plots show coefficient values (β) [means and 95% credible intervals] for equations 6 and 7 (see Materials and methods). PEP data (a, b) or common-garden observations (c) were used for analysis. Left panels: The effect of preseason temperature on inter-individual phenological synchrony measured either as the standard deviation in leaf-out/flowering dates (LOS/FLS) or the standard deviation in degree-day (DD) requirements among individuals (LOS-DD/FLS DD). Right panels: The effects of day length and winter chilling on inter-individual leaf-out synchrony. To account for within-species rather than among-species synchrony, all models include species random effects. The models using the PEP data (a and b) additionally include site random effects (1° pixels) to address within-pixel phenological synchrony. All variables were standardized to allow for direct effect size comparisons. N = 13 (a), 9 (b), and 59 species (c).
Figure 2—figure supplement 1
Greater variation of forcing requirements among individuals with increasing preseason temperatures.
Effects of preseason temperature on inter-individual LOS-DD (A–C) and FLS-DD (D–F), using PEP data. (A) Mean Pearson correlation coefficients (±95% confidence intervals) for the effect of spring temperature on LOS-DD. See Figure 1—figure supplements 1b and 2b for number of sites (1° x 1° areas) in which the relationship was analysed. (B, C,) Density plots of regression (B) and Pearson correlation coefficients (C) between LOS-DD and spring temperature for nine species. Regression coefficients show the change in LOS-DD per each degree increase in spring temperature. (D–F) Same plots for the effect of spring temperature on FLS-DD. LOS-DD = Standard deviation of inter-individual forcing requirements until leaf-out; FLS-DD = Standard deviation of inter-individual forcing requirements until flowering.
Figure 2—figure supplement 2
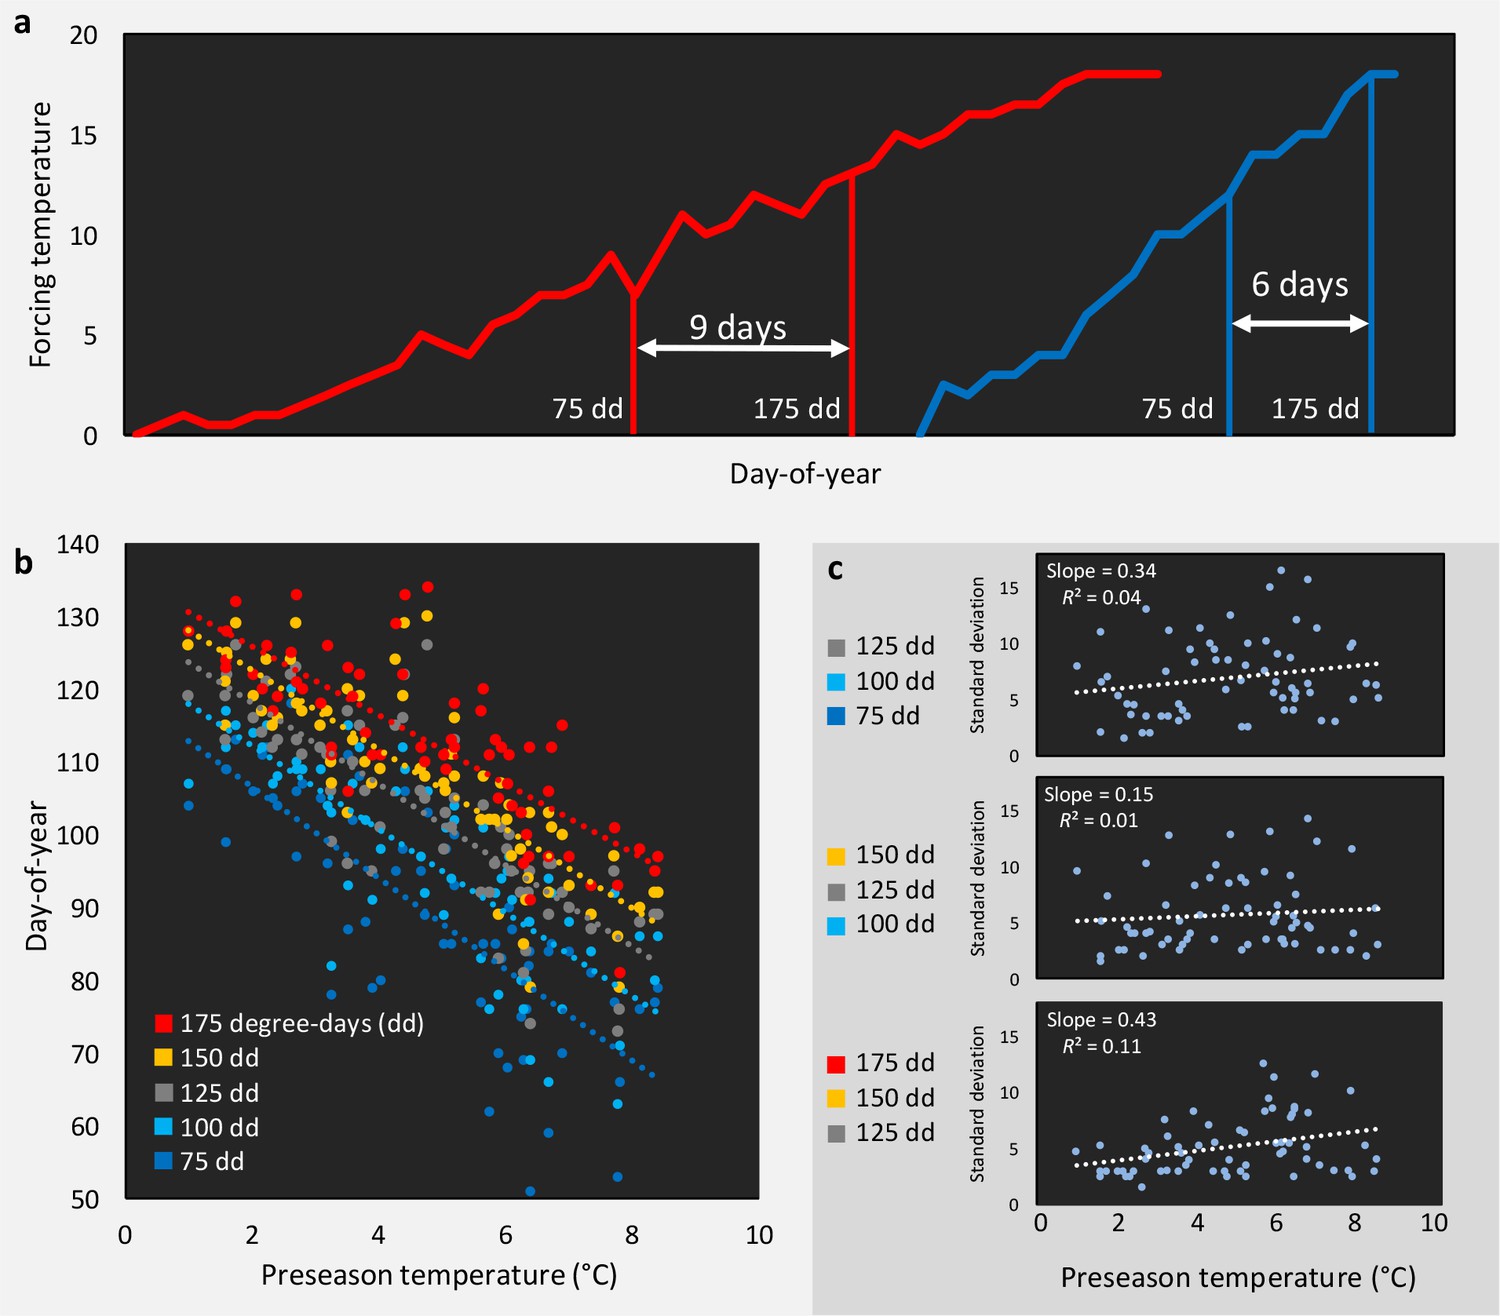
Does decreased LOS and FLS under climate warming result from a decrease in within-spring warming speed?
(a) Schematic representation of the hypothesized relationship between climate warming and within-spring temperature increase: in a cold year (blue line) temperature rises late but fast, in a warm year (red line) temperature rises early but more slowly (flattening the temperature curve during spring). The result would be a less synchronized phenology in warm years, because forcing sums required for the occurrence of the respective phenological event are more spread out. This is illustrated by the date (day-of-year) at which 75 or 175 degree-days (cumulative daily temperature above 5°C starting 1 of January) accumulate in both cases (difference of 9 day in the warm year vs. 6 days in the cold year). (b) The day of year when 75, 100, 125, 150, or 175 degree-days have accumulated, shown as response to mean preseason temperature (14 Feb until 15 April) in the respective year, using temperature data for 63 years (1955–2017) from Munich, Germany. (c) The standard deviations of the dates (days of year) when (i) 75, 100, and 125 degree-days have accumulated (upper panel), (ii) 100, 125, and 150 degree-days have accumulated (middle panel), and (iii) 125, 150, and 175 degree-days have accumulated (middle panel) in response to preseason temperature.
Figure 3
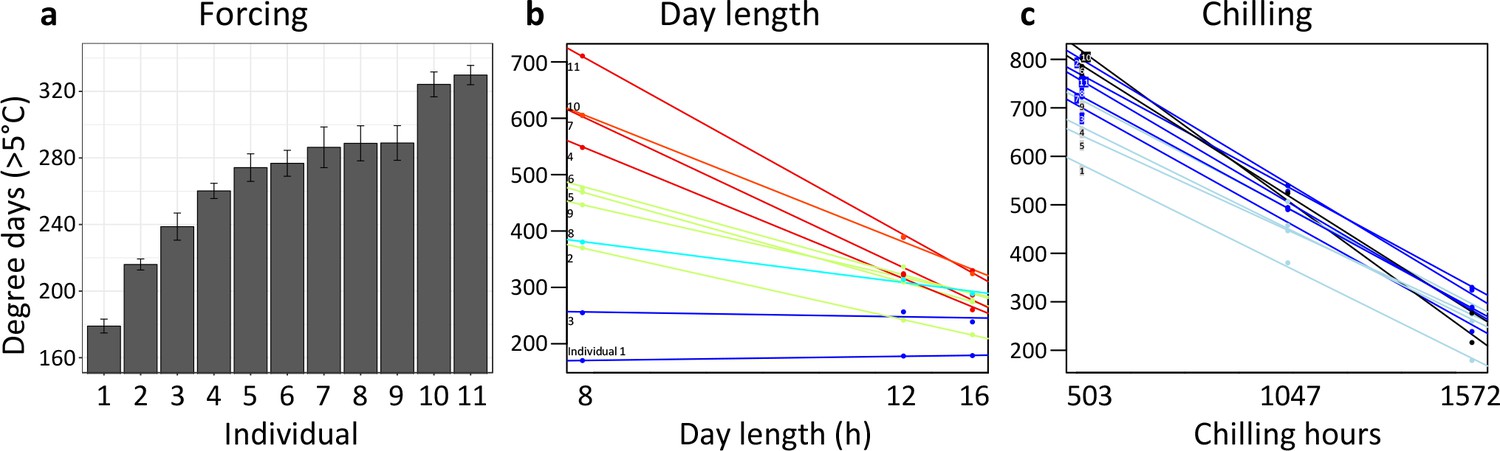
Individual differences in the forcing (a), day-length (b), and chilling (c) requirements among 11 beech trees (F. sylvatica; Experiment 1).
(a) Mean ( ± SEM) forcing requirements (accumulative degree-days >5°C) until leaf-out under long chilling and constant 16 h day length. (b) Degree-days until leaf-out at 8 hr, 12 hr, and 16 h day length (collection date: 21 March 2015). Colours according to slope (red: steep slope; blue: no slope). (c) Degree-days until leaf-out under short, intermediate, and long chilling (collection dates: 22 Dec 2014, 6 Feb 2015, 21 March 2015) and 16 h day length. Colours according to slope (dark blue: steep slope; light blue: no slope).
Figure 4 with 1 supplement

Loss of phenological synchrony with climate warming is explained by contrasting day-length sensitivities in Fagus sylvatica.a, b, Experiment 2.
(a) Leaf-out dates of Fagus sylvatica (blue), Fagus crenata (dotted grey), and Quercus robur (grey) under varying winter lengths (chilling hours = sum of hours from 1 November until leaf-out with an average temperature between 0°C and 5°C). Bars show the standard deviation of average leaf-out dates among 11 F. sylvatica individuals. The shaded area shows the difference between the leaf-out date of the first flushing twig of the first individual and the last twig of the last individual to leaf- out, using a LOESS smoothing function. For F. crenata and Q. robur, we investigated one individual each and therefore do not report inter-individual variation. (b) Standard deviation of leaf-out dates among 11 F. sylvatica individuals at different winter lengths (chilling levels) and natural day length. (c) The effect of individual day-length sensitivity on the timing of leaf unfolding when twigs were collected on 10 December 2015. Note the reversed x-axis scale, that is, smaller values indicate higher day-length sensitivity. (d) Variables explaining the sequence of leaf-out dates of 11 F. sylvatica individuals at eight different chilling levels. The percentage of leaf-out variation (derived from the ANOVA sums of squares) that can be explained by individual forcing requirements (red), day-length requirements (green), chilling requirements (blue), and the remaining residuals, that is, unexplained variation (black). *p<0.05; **p<0.01; ***p<0.001.
Figure 4—figure supplement 1
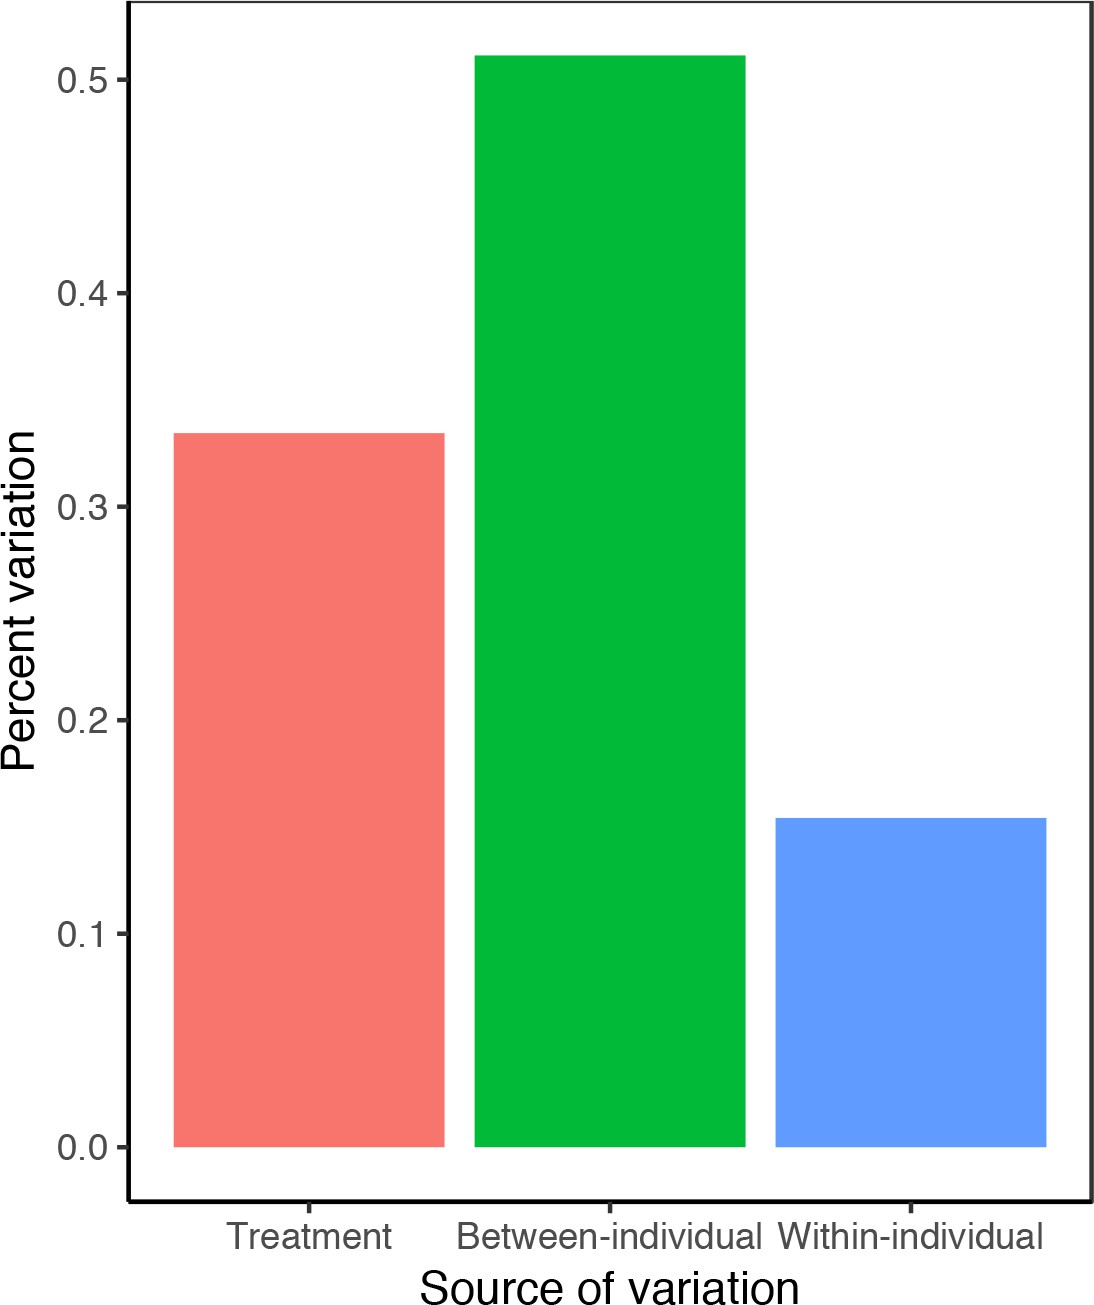
Percent variation in leaf-out dates attributable to treatment effects and between- and within-individual variation within treatments.
Data from experiment 2 (see Materials and methods). Variance components were inferred from random-effects-only models, including leaf-out date as the dependent variable and treatment and individuals as nested random effects.
Figure 5
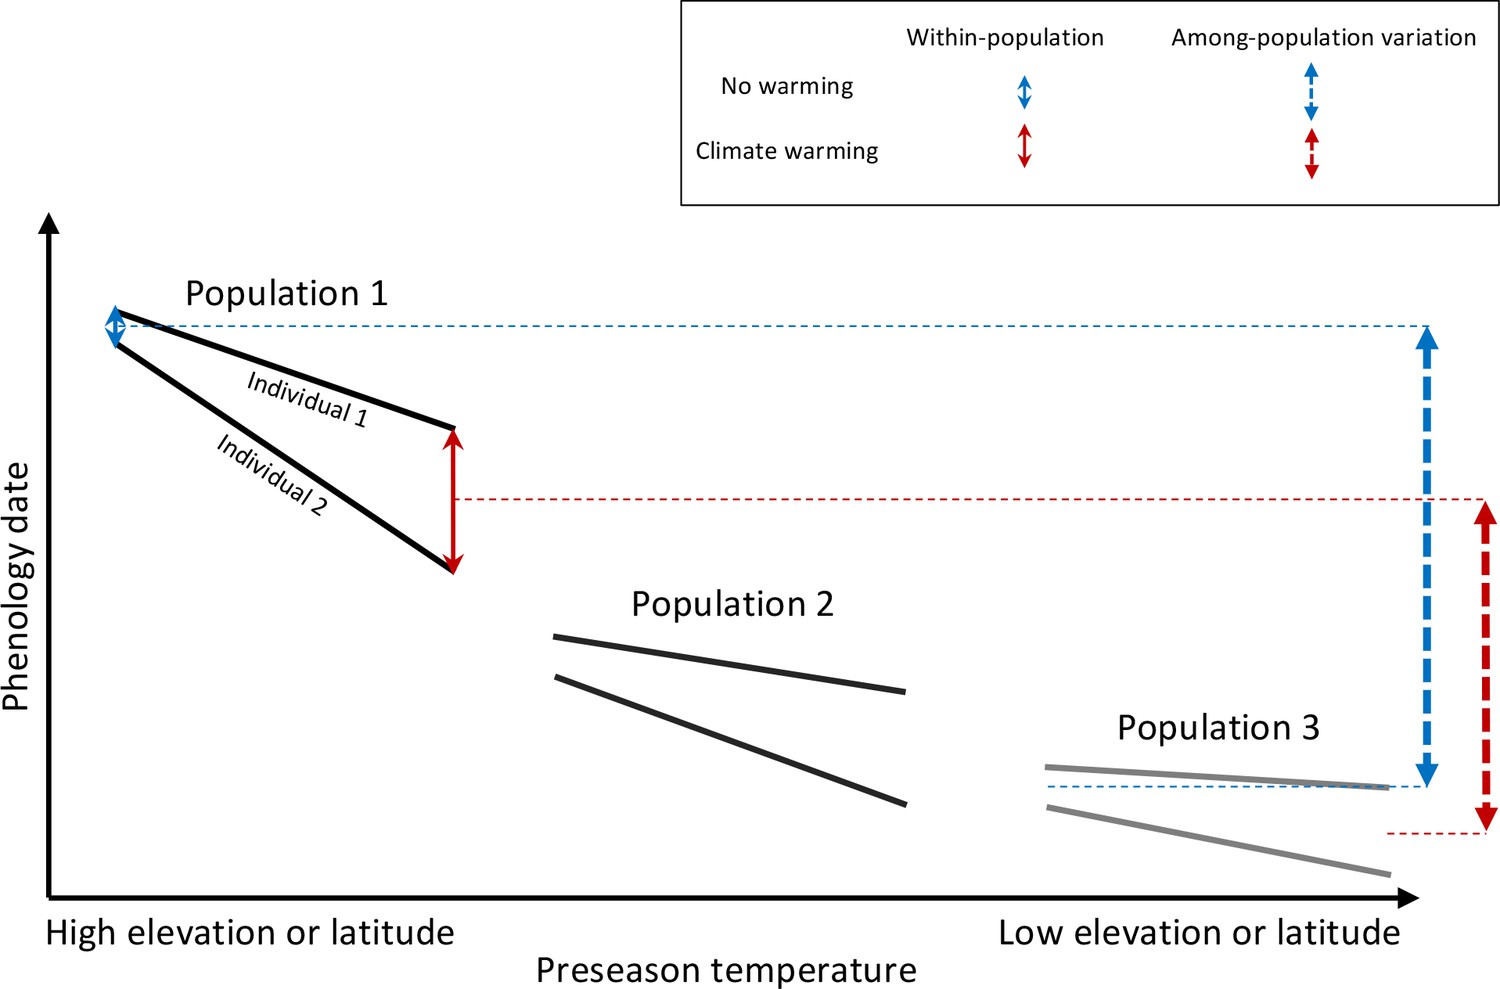
Schematic representation of within- and among-population phenological synchrony in response to climate warming.
As demonstrated in this study, inter-individual synchrony within a population will decrease under warmer preseason temperatures because individuals differ in their sensitivity to temperature. Within-population variation under ambient or warmed preseason temperatures is illustrated by the solid blue and red arrows, respectively. By contrast, phenological synchrony among populations is expected to increase, given that populations in warm regions (Population 3) will advance their phenology less than populations in cold regions (Population 1). This is illustrated by the dashed blue and red arrows, showing that the difference in the average phenological date between Population 1 and 3 is smaller under warmer preseasons (red dashed arrow) than under ambient preseason temperatures (blue dashed arrow).
Additional files
-
Supplementary file 1
List of species.
- https://doi.org/10.7554/eLife.40214.015
-
Transparent reporting form
- https://doi.org/10.7554/eLife.40214.016
Download links
A two-part list of links to download the article, or parts of the article, in various formats.
Downloads (link to download the article as PDF)
Open citations (links to open the citations from this article in various online reference manager services)
Cite this article (links to download the citations from this article in formats compatible with various reference manager tools)
Global warming reduces leaf-out and flowering synchrony among individuals
eLife 7:e40214.
https://doi.org/10.7554/eLife.40214


