Convergence of monosynaptic and polysynaptic sensory paths onto common motor outputs in a Drosophila feeding connectome
- University of Bonn, Germany
- University of Cambridge, United Kingdom
- Janelia Research Campus, Howard Hughes Medical Institute, United States
- University of California, San Francisco, United States
Figures
Figure 1 with 4 supplements

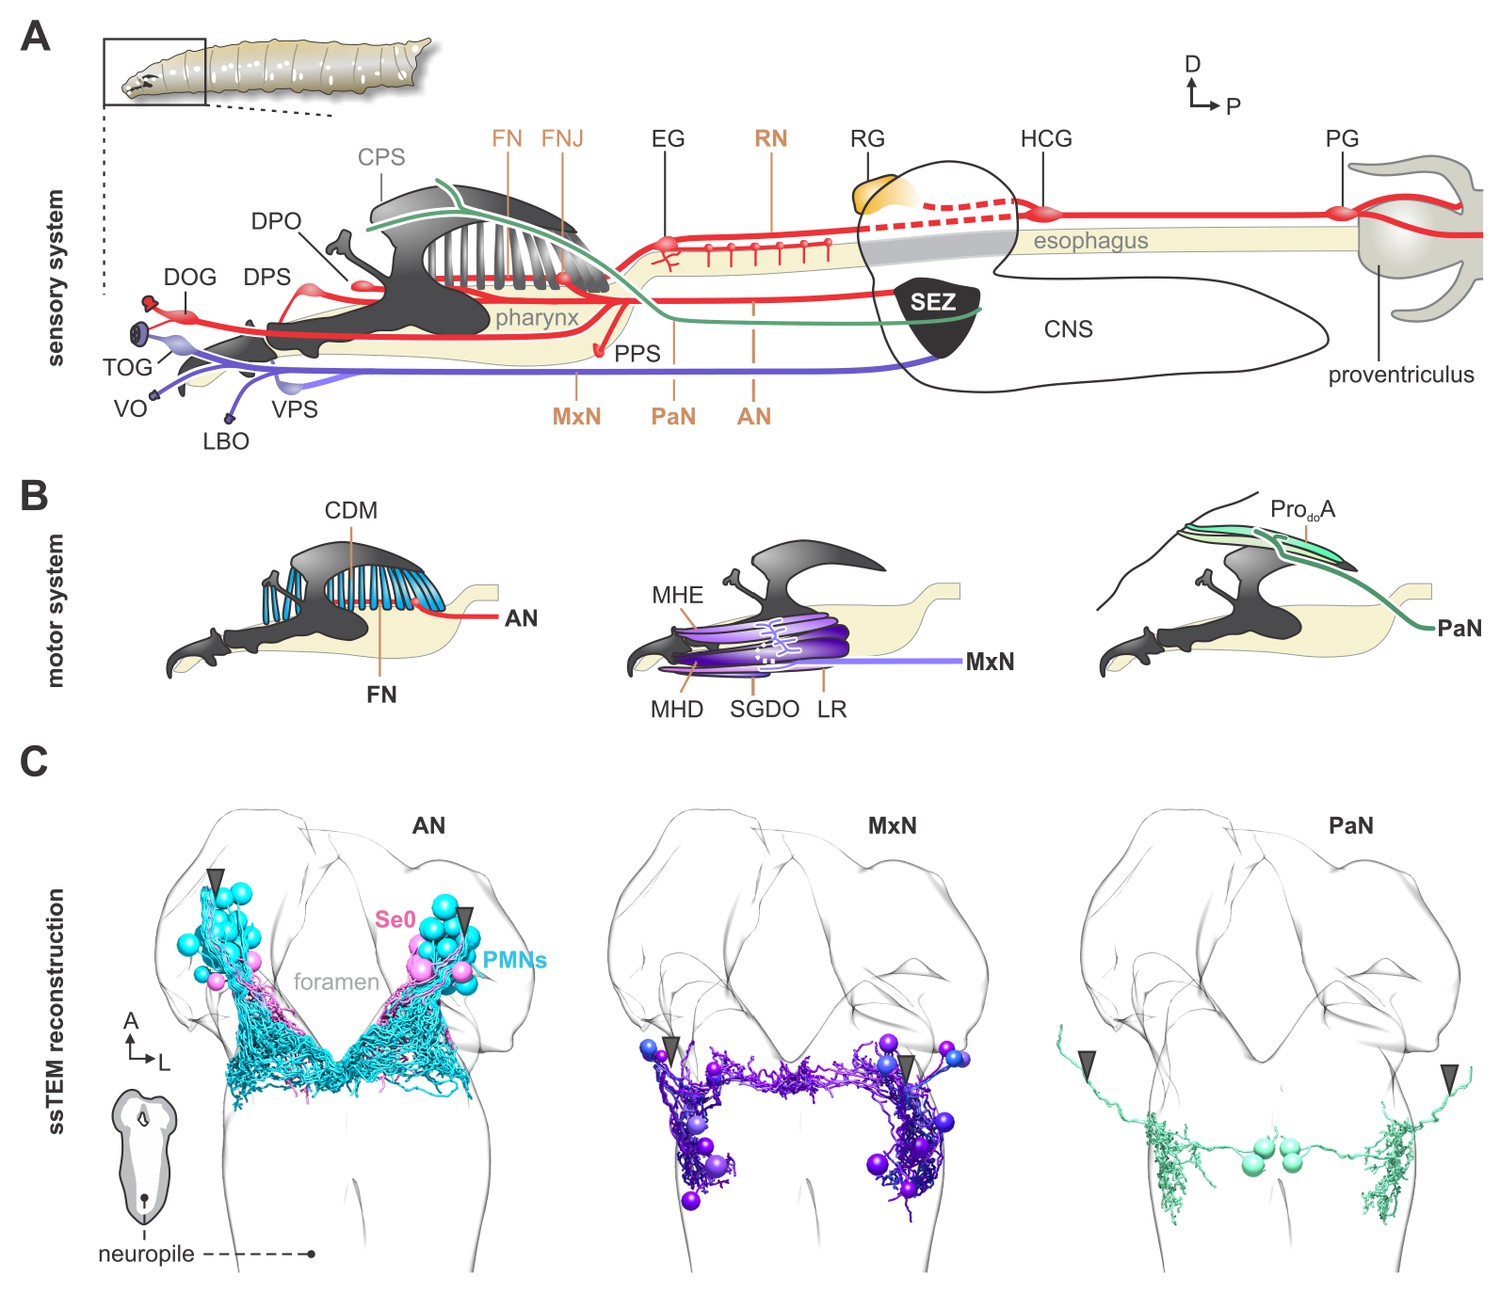
EM reconstruction of the pharyngeal nerves of Drosophila larva.
(A) Left: schematic diagram shows a lateral view of an adult mouse brain and the broad organization of different cranial nerves targeting the medulla of the brainstem. Right: topographical chart of the medulla and part of the spinal cord. Primary sensory and primary motor nuclei are shown on the left and on the right, respectively. (B) Schematic overview of external, pharyngeal and internal sensory systems targeting the subesophageal zone (SEZ), median neurosecretory cells (mNSCs) and the antennal lobe (AL) in Drosophila (left panel). Schematic overview of central output neurons targeting feeding related muscles and the enteric nervous system (right panel). Median neurosecretory cells (mNSCs) target neuroendocrine organ and the periphery, by releasing neuropeptides such as Dilps, DMS and DH44. The mushroom body (MB), a learning and memory center, serves as a landmark. (C) EM reconstruction of pharyngeal sensory input (left panel). Sensory neurons enter the brain via the antennal nerve (AN), maxillary nerve (MxN) and prothoracic accessory nerve (PaN), and cover large parts of the SEZ (left panel). Arrowheads mark respective nerve entry site. Two of the AN sensory projections (per side) extend into the protocerebrum. EM reconstruction of pharyngeal motor output (right panel). Pharyngeal motor neurons (PMNs) and serotonergic output neurons (Se0) leave the CNS via the antennal nerve (AN) and innervate the cibarial dilator musculature (for pharyngeal pumping) and part of the esophagus and the enteric nervous system. MxN motor neurons leave the CNS via the maxillary nerve (MxN) and innervate mouth hook elevator and depressor, labial retractor and salivary gland ductus opener. PaN motor neurons leave the CNS via the prothoracic accessory nerve (PaN) and innervate the dorsal protractor (for head tilt movements). All neurons are colored based on their morphological class. See Figure 1—figure supplements 1–4 and Figure 2—figure supplement 6 for detailed anatomy and description of morphological clustering.
-
Figure 1—source data 1
Summary of nerve nomenclature of Drosophila melanogaster larva.
Different names exist from analysis of structures analyzed at different stages of development (embryo, larva) and imaging methodology by different authors (Hertweck, 1931; Bodenstein, 1950; Campos-Ortega and Hartenstein, 1985; Schoofs et al., 2010; Hartenstein et al., 2018; Kendroud et al., 2018). The table provides a cross-reference for the readers but should not be taken as a definitive canonical version. At the larval stage, the different nerves enter the CNS from the periphery as single entities. These then split apart into different branches, each with a new set of nerve names, within the CNS. Our usage of the term PaN derives from an analogous nerve described in Calliphora (Ludwig, 1949) and Drosophila (Schoofs et al., 2010).
- https://doi.org/10.7554/eLife.40247.007
Figure 1—figure supplement 1
Anatomy of the pharyngeal nerves.
(A) The cephalic, pharyngeal and enteric sensory system of the larval head (lateral view). Sensory neurons of the dorsal organ ganglion (DOG), dorsal pharyngeal sensilla (DPS), dorsal pharyngeal organ (DPO) and posterior pharyngeal sensilla (PPS) project to the subesophageal zone (SEZ) via the antennal nerve (AN). Sensory neurons of the enteric nervous system, including the frontal nerve (FN) and recurrent nerve (RN), esophageal ganglion (EG), hypocerebral ganglion (HCG) and proventricular ganglion (PG), fuse together with the AN shortly after the frontal nerve junction (FNJ). The terminal organ ganglion (TOG), ventral organ (VO), labial organ (LBO) and ventral pharyngeal sensilla (VPS) project to the SEZ via the maxillary nerve (MxN). The prothoracic accessory nerve (PaN) contains sensory pathways from dorsal head region and enters the brain between the tritocerebrum and ventral ganglion. (B) Feeding related muscle system. The motor neurons of the antennal nerve (PMNs) innervate the cibarial dilator muscles (CDM) through the frontal nerve. The mouth hook elevator (MHE), mouth hook depressor (MHD), salivary gland ductus opener (SGDO) and labial retractor (LR) are innervated by side branches of the maxillary nerve. The dorsal protractor (ProdoA) is innervated by the prothoracic accessory nerve. (C) EM reconstruction of all motor neurons innervating the feeding related muscles in the larval head. Arrowheads mark respective nerve entry site.
Figure 1—figure supplement 2
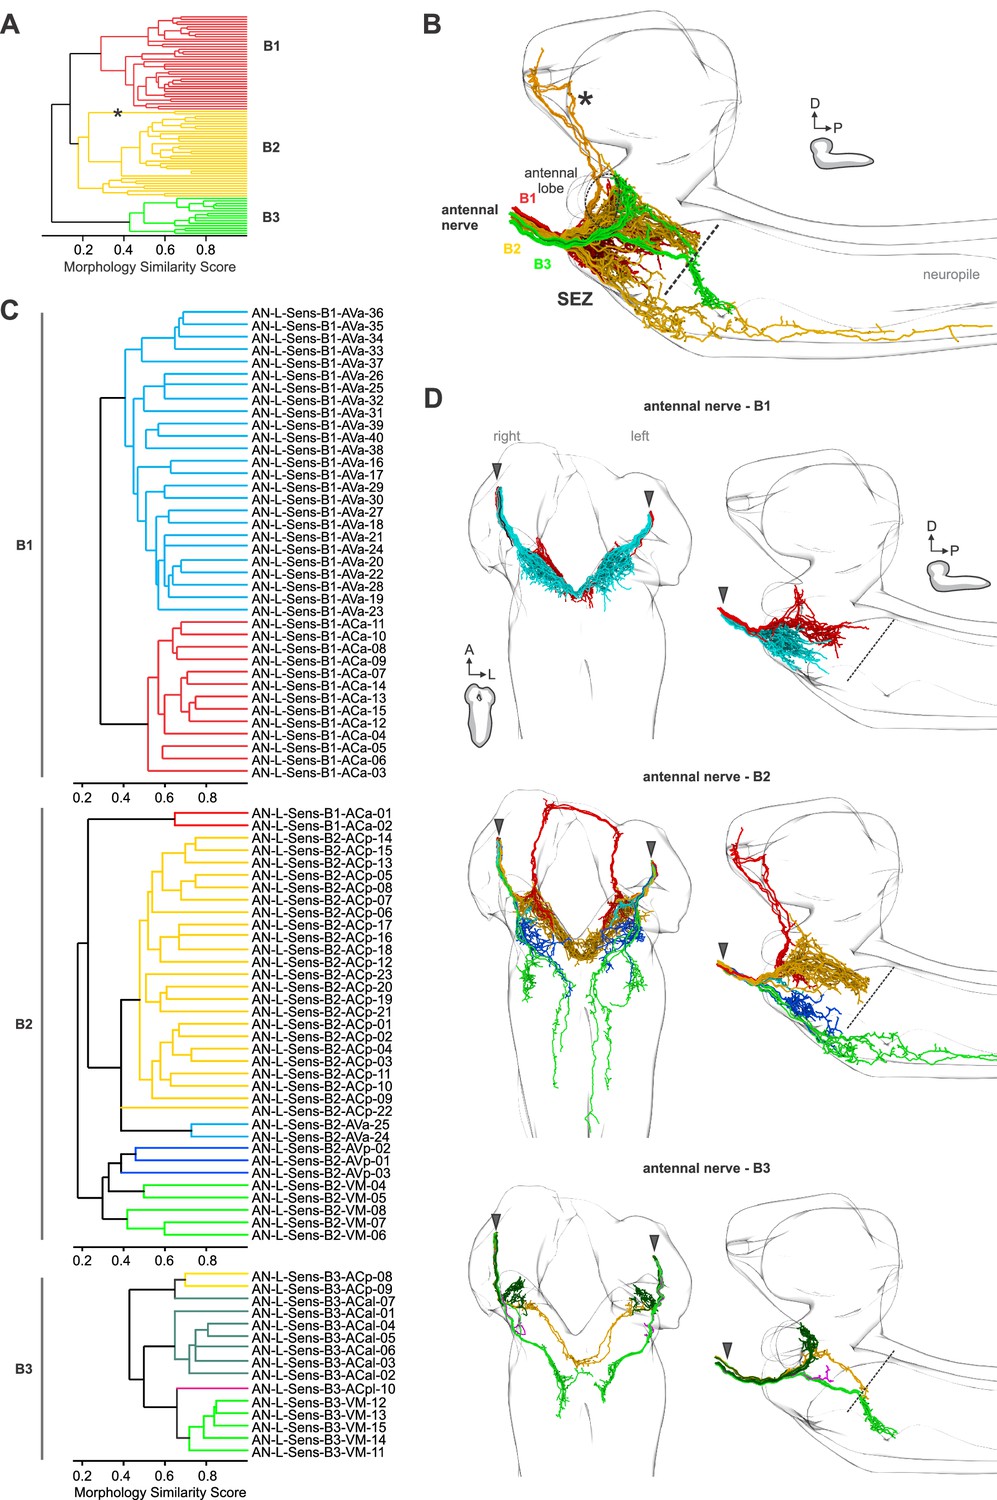
Sensory neurons of the antennal nerve.
(A) Hierarchical morphology similarity score was calculated for all non-olfactory sensory neurons of the antennal nerve (AN). Clustering revealed three distinct axon bundles within the nerve. Asterisk marks two sensory neurons with projections to the protocerebrum. Dendrogram shows exemplary neurons of the left side. (B) EM reconstruction of AN sensory projections colored based on their morphological class. (C) Hierarchical morphology clustering was calculated separately for each AN axon bundle. Dendrograms are colored based on synapse similarity score (Figure 2, Figure 2—figure supplements 1–5). (D) EM reconstruction of each AN axon bundle. Neurons colored based synapse similarity score. (Figure 2, Figure 2—figure supplements 1–5).
Figure 1—figure supplement 3
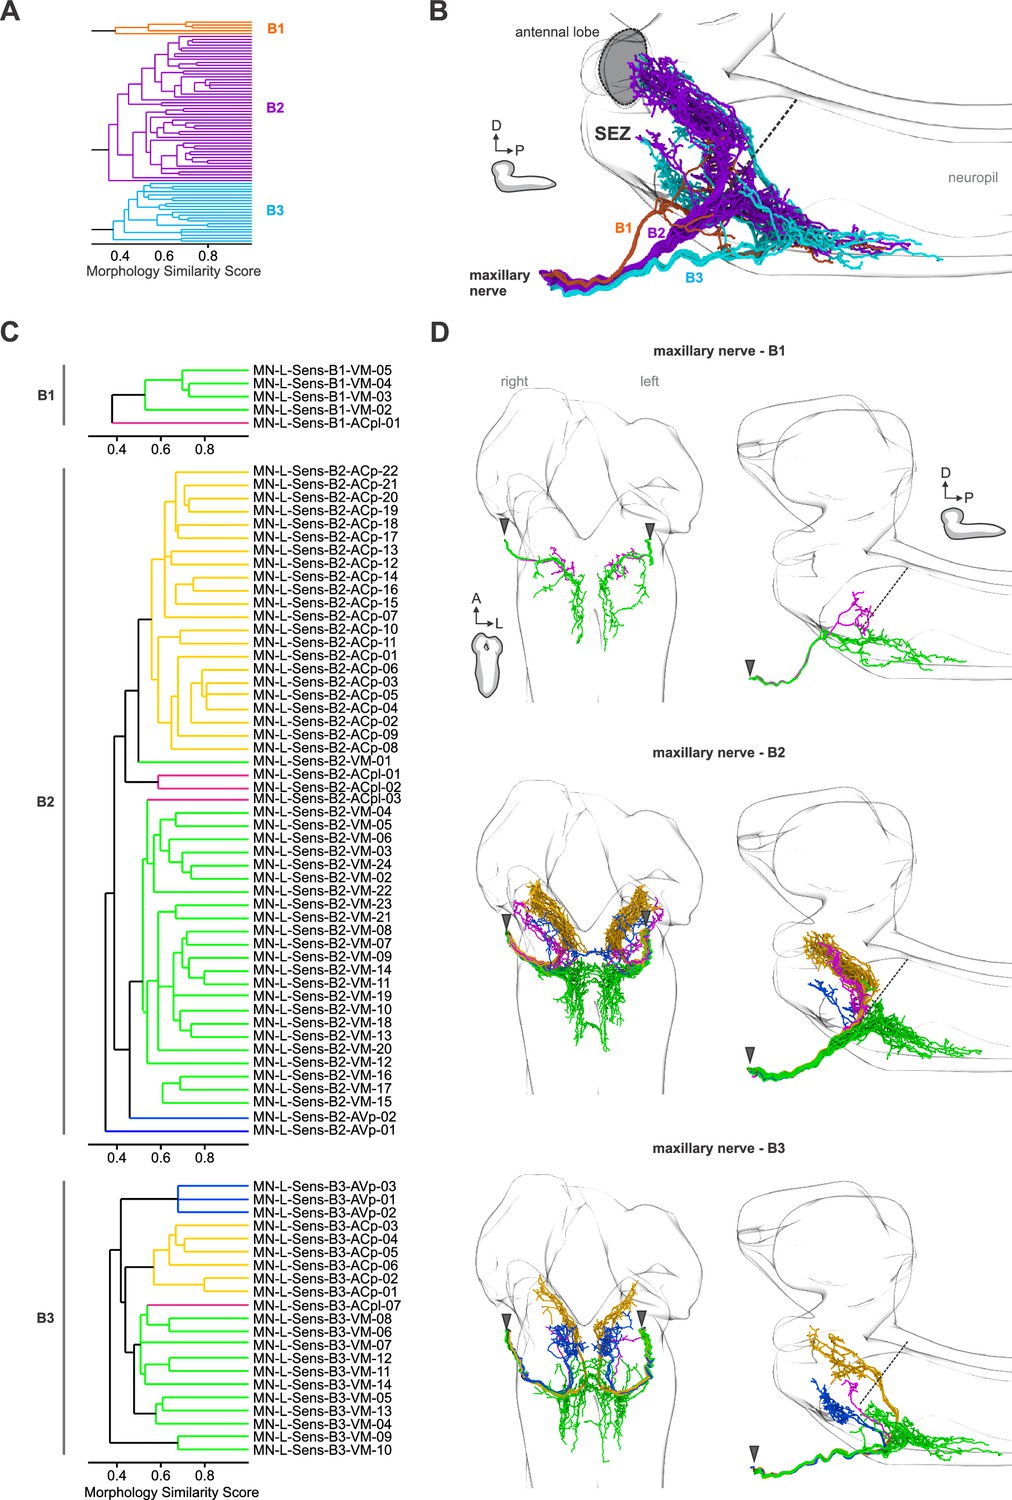
Sensory neurons of the maxillary nerve.
(A) Hierarchical morphology similarity score was calculated for all sensory neurons of the maxillary nerve (MxN). Clustering revealed three distinct axon bundles within the nerve. Dendrogram shows exemplary neurons of the left side. (B) EM reconstruction of MxN sensory projections colored based their morphological class. (C) Hierarchical morphology clustering was calculated separately for each MxN axon bundle. Dendrograms are colored based on synapse similarity score (Figure 2, Figure 2—figure supplements 1–5). (D) EM reconstruction of each MxN axon bundle. Neurons colored based synapse similarity score. (Figure 2, Figure 2—figure supplements 1–5).
Figure 1—figure supplement 4
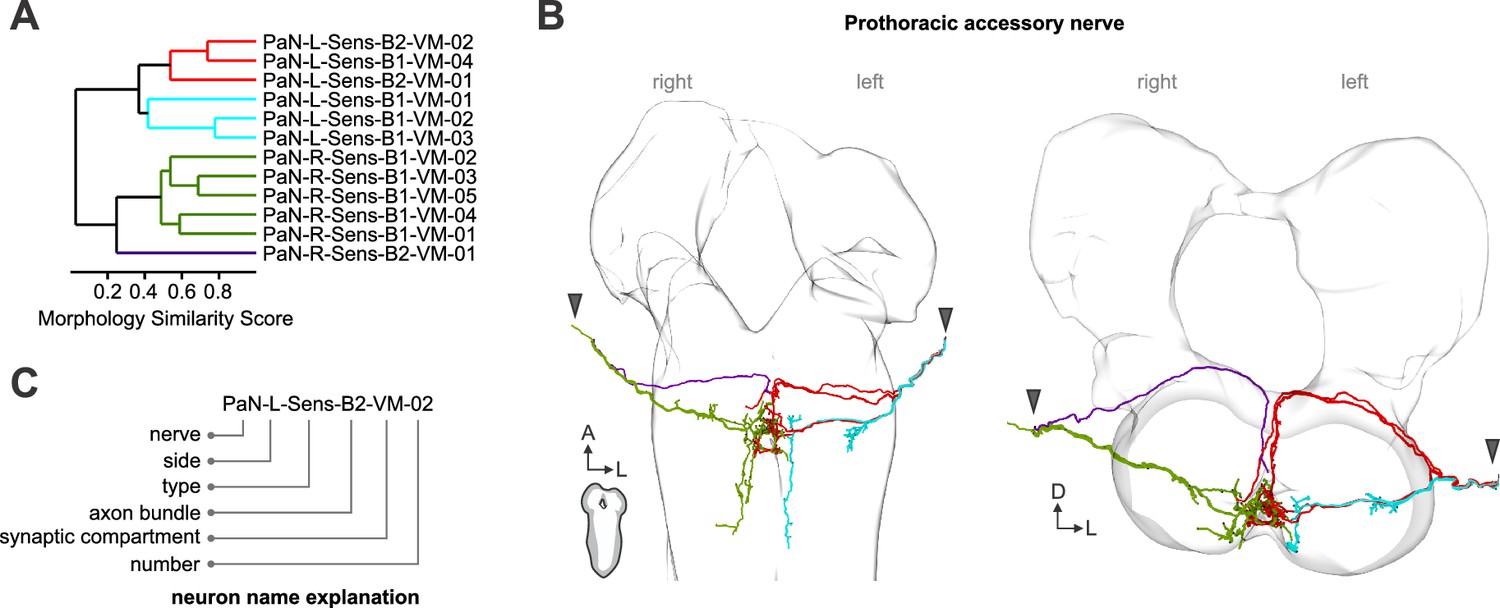
Sensory neurons of the prothoracic accessory nerve.
(A) Hierarchical morphology similarity score was calculated for all sensory neurons of the prothoracic accessory nerve (PaN). Dendrogram is colored based on synapse similarity score (Figure 2, Figure 2—figure supplements 1–5). (B) EM reconstruction of PaN sensory neurons. Neurons are colored based on synapse similarity score. (Figure 2, Figure 2—figure supplements 1–5). (C) Neuron name definition. Neurons were named based on their nerve, nerve entry side to the brain, type (Sens = sensory), distinct axon bundle, synaptic area based on synapse similarity score. (Figure 2, Figure 2—figure supplements 1–5).
Figure 2 with 6 supplements

Spatially segregated central axonal projections of sensory neurons.
(A) Calculation of pairwise synapse similarity score for all non-olfactory sensory neurons. (B) Spatial distribution of synaptic sites for all sensory neuron cluster. Hierarchical clustering based on synapse similarity score revealed seven distinct (non-overlapping) areas of sensory convergence within the SEZ: the anterior part of the Anterior Central sensory compartment (ACa), anterior part of the Anterior Ventral sensory compartment (AVa), posterior part of the Anterior Ventral sensory compartment (AVp), posterior part of the Anterior Central sensory compartment (ACp), anterior-lateral part of the Anterior Central sensory compartment (ACal), posterior-lateral part of the Anterior Central sensory compartment (ACpl) and Ventromedial sensory compartment (VM). Convergence zones are targeted by varying numbers of sensory neurons but are consistent across hemispheres. Each dot represents a single synaptic site. Graphs show distribution along dorsal-ventral and anterior-posterior axis of the CNS. (C) Spatial distribution of synaptic sites for all neuroendocrine, serotonergic and motor neuron classes. Each dot represents a single synaptic site. Graphs show distribution along dorsal-ventral and anterior-posterior axis of the CNS. (D) EM reconstruction of clustered sensory neurons (left). EM reconstruction of all output neuron classes (right). Summarizing representation of glomerular-like sensory compartments and motor compartments within the SEZ (middle panel). See Figure 2—figure supplements 1–5 for detailed description of clustering and sensory region composition.
Figure 2—figure supplement 1
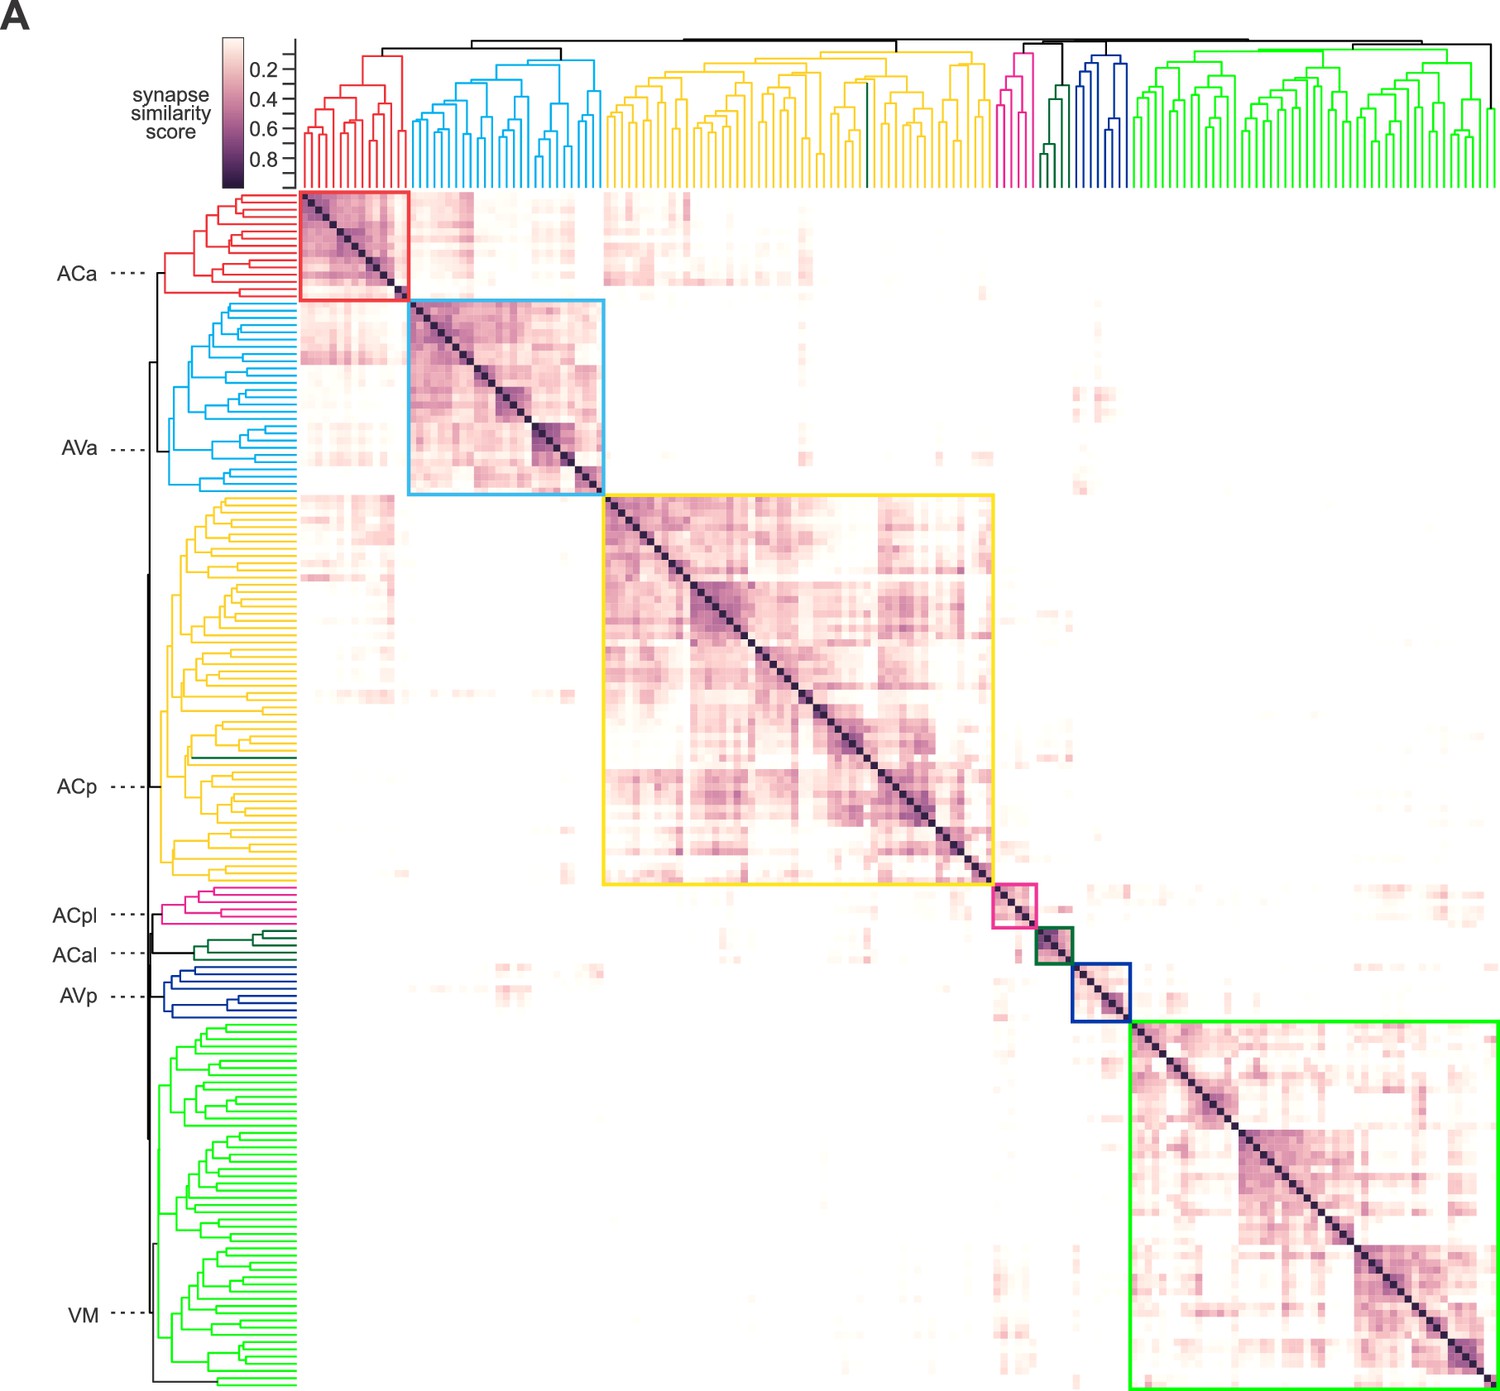
Similarity of sensory neuron synapse placement.
(A) Pairwise calculated synapse similarity score for all non-olfactory sensory neurons of the antennal-, maxillary- and prothoracic accessory nerve. Hierarchical clustering based on synapse similarity score revealed seven distinct areas of sensory convergence within the SEZ. Cluster map shows left sensory neurons only. Cluster cutoff was set to 0.06 to provide the broadest possible groups which also was consistent with connectivity patterns (Figure 3, Figure 4, Figure 6) and gustatory receptor expression pattern in the CNS (Figure 5, Figure 5—figure supplements 1–9). One neuron was manually moved from ACp (yellow) to ACal (dark green) to be consistent with the connectivity data.
Figure 2—figure supplement 2
Sensory compartments.
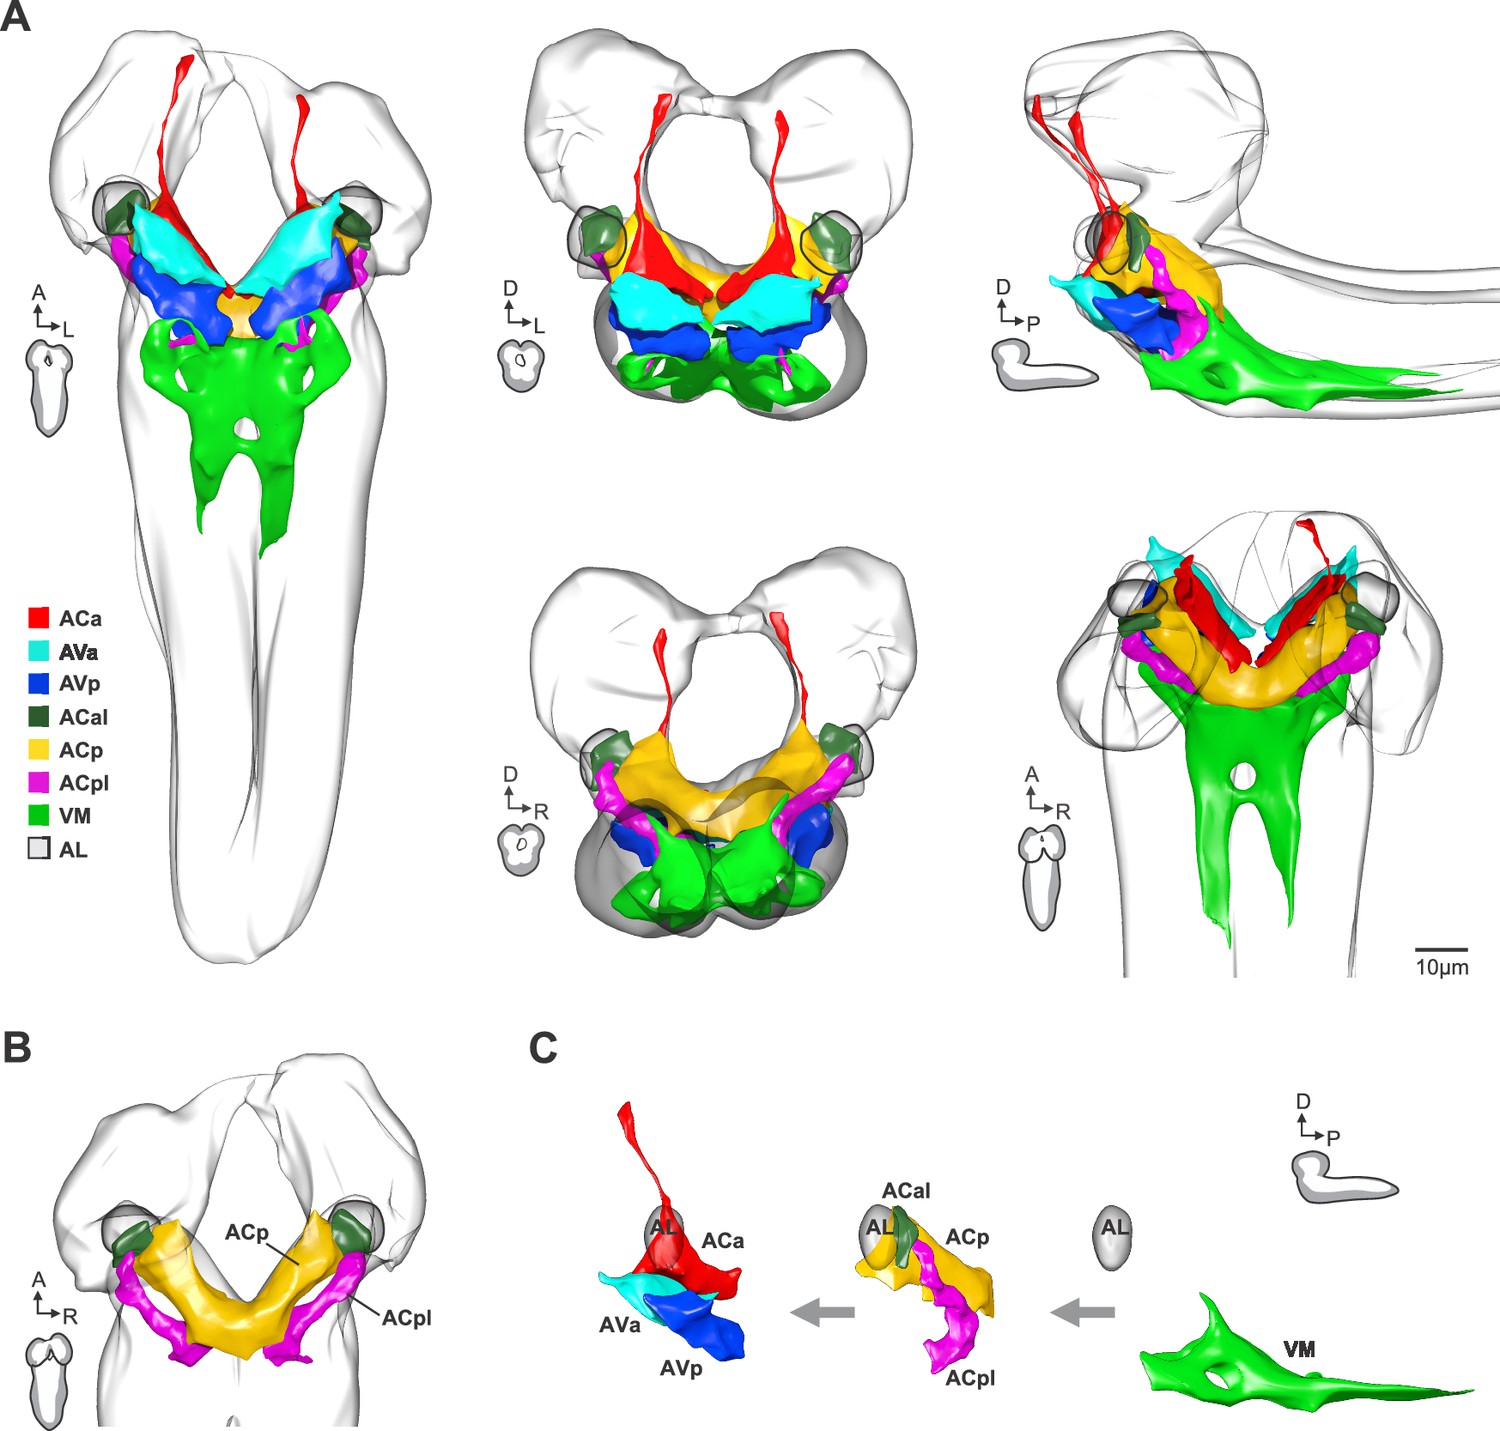
(A) Glomerular-like compartmentalization of the supesophageal zone (SEZ). Non-overlapping digital 3D models delineate compartments based on synapse similarity score. (B) The ACpl (posterior lateral part of the Anterior Central sensory compartment) with 14 neurons which laterally flanks the ACp (primary gustatory center) delineate a so far undescribed sensory compartment in the larva (comparable to antenno-subesophageal tract ‘AST’ in adults (Ito et al., 2014). (C) Expanded view of partly intermeshed sensory compartments (Digital 3D models), subgrouped into monosynaptic reflex module (ACa, AVa and AVp, also see Figure 3), mushroom body module (AL, ACal, ACp and ACpl, also see Figure 6) and somatosensory compartment (VM). List of compartment names, abbreviations and color code.
Figure 2—figure supplement 3
EM reconstruction of compartment forming sensory neurons and their synaptic sites.
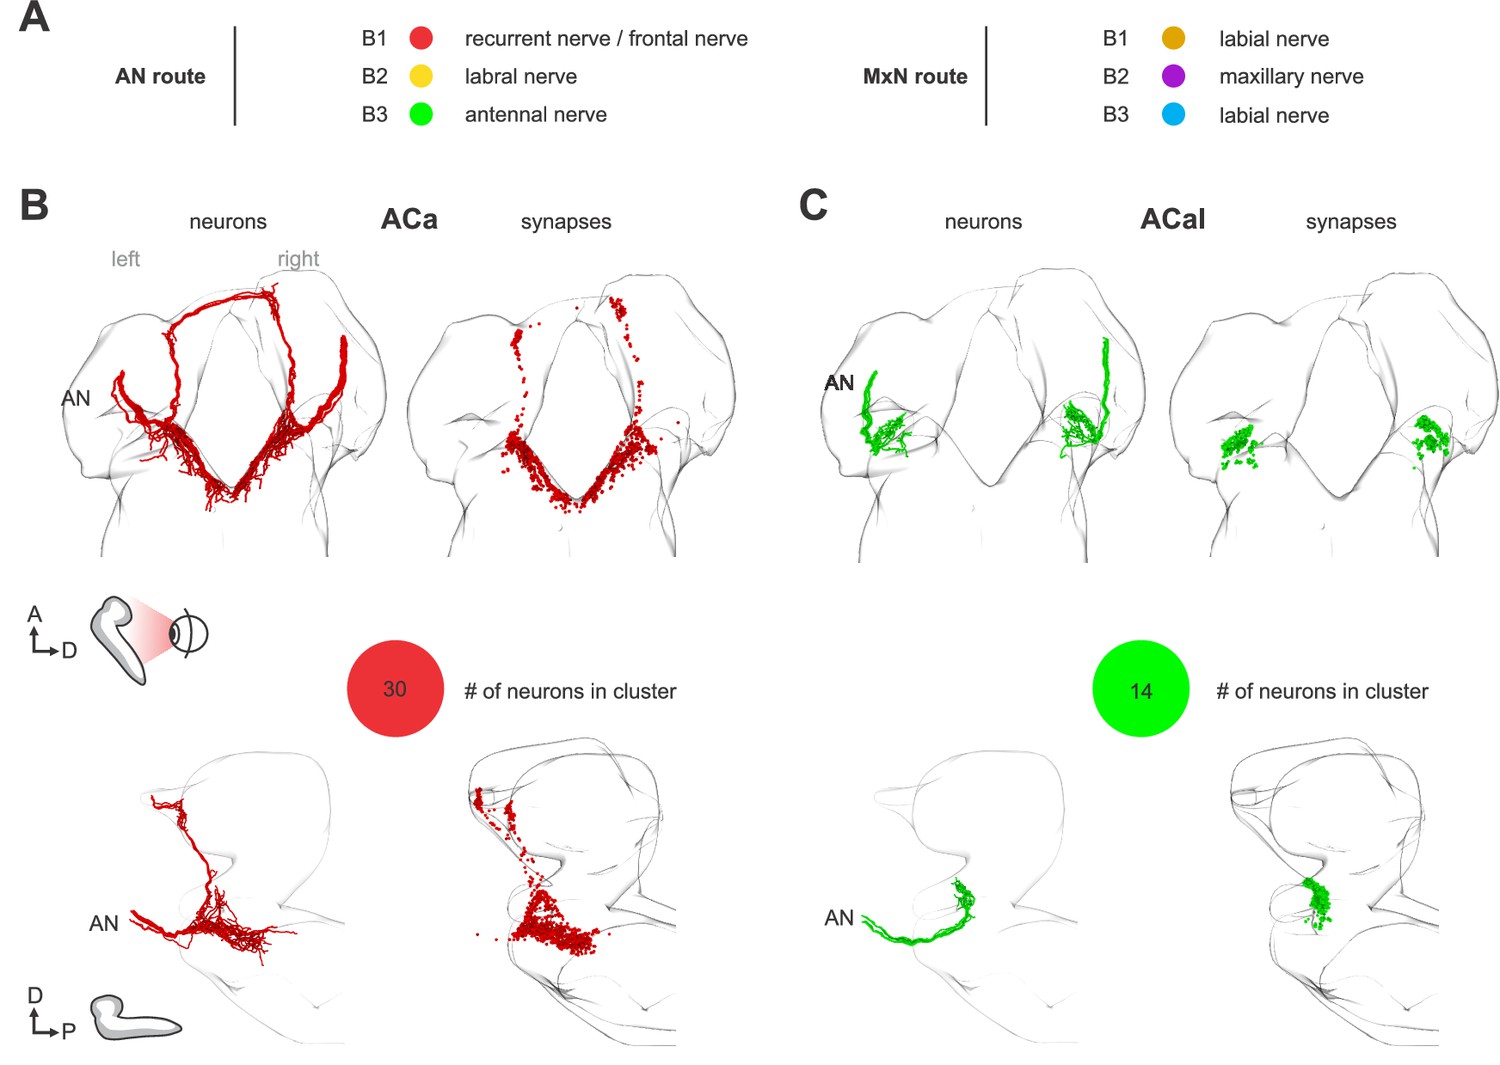
(A) Peripheral origin of AN and MxN axon bundles of pharyngeal nerves and nerve branches. The recurrent nerve, the frontal nerve labral nerve and the antennal nerve enter the brain as single morphologically indistinguishable nerve collective (termed as a whole the antennal nerve). The maxillary nerve and labial nerve also enter the brain as morphologically indistinguishable nerve collective (termed as a whole the maxillary nerve). (B, C) ACa, ACal, EM reconstruction and distribution of synaptic sites of afferent neurons as clustered in Figure 2—figure supplement 1. Each dot represents a synaptic site. Neurons and synapses are colored based on their peripheral origin (nerve). Number in colored circle represents number of sensory neurons in cluster.
Figure 2—figure supplement 4
EM reconstruction of compartment forming sensory neurons and their synaptic sites.
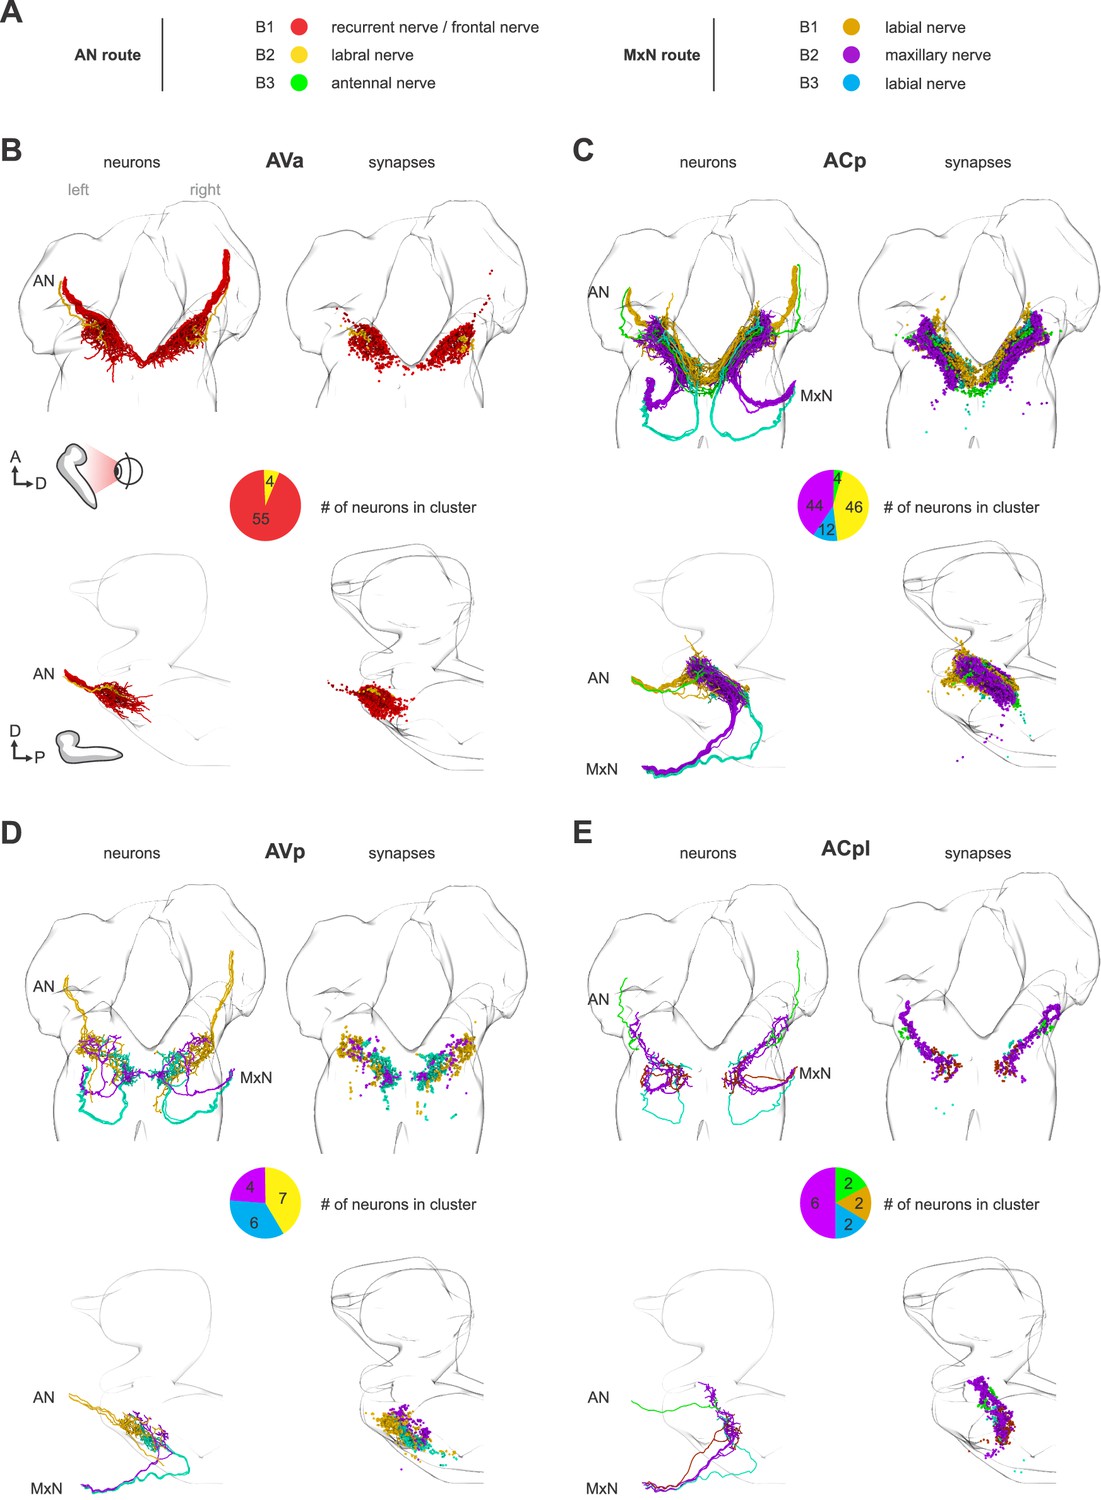
(A) See Figure 2—figure supplement 3 for nomenclature of the nerves. (B,C,D,E) AVa, ACp, AVp, ACpl, EM reconstruction and distribution of synaptic sites of afferent neurons as clustered in Figure 2—figure supplement 1. Each dot represents a synaptic site. Neurons and synapses are colored based on their peripheral origin (nerve). Numbers in colored circles represent number of sensory neurons in cluster. ACp and ACpl show convergence of 4 different neuronal paths (nerves).
Figure 2—figure supplement 5

EM reconstruction of compartment forming sensory neurons and their synaptic sites.
(A) See Figure 2—figure supplement 3 for nomenclature of the nerves. (B) VM, EM reconstruction and distribution of synaptic sites of afferent neurons as clustered in Figure 2—figure supplement 1. Each dot represents a synaptic site. Neurons and synapses are colored based on their peripheral origin (nerve). (C) Numbers in colored circles represent number of sensory neurons in cluster. VM is the sensory compartment with the highest degree of convergence of different neuronal paths (nerves).
Figure 2—figure supplement 6
Identification of serotonergic output neurons (Se0) in the EM volume.
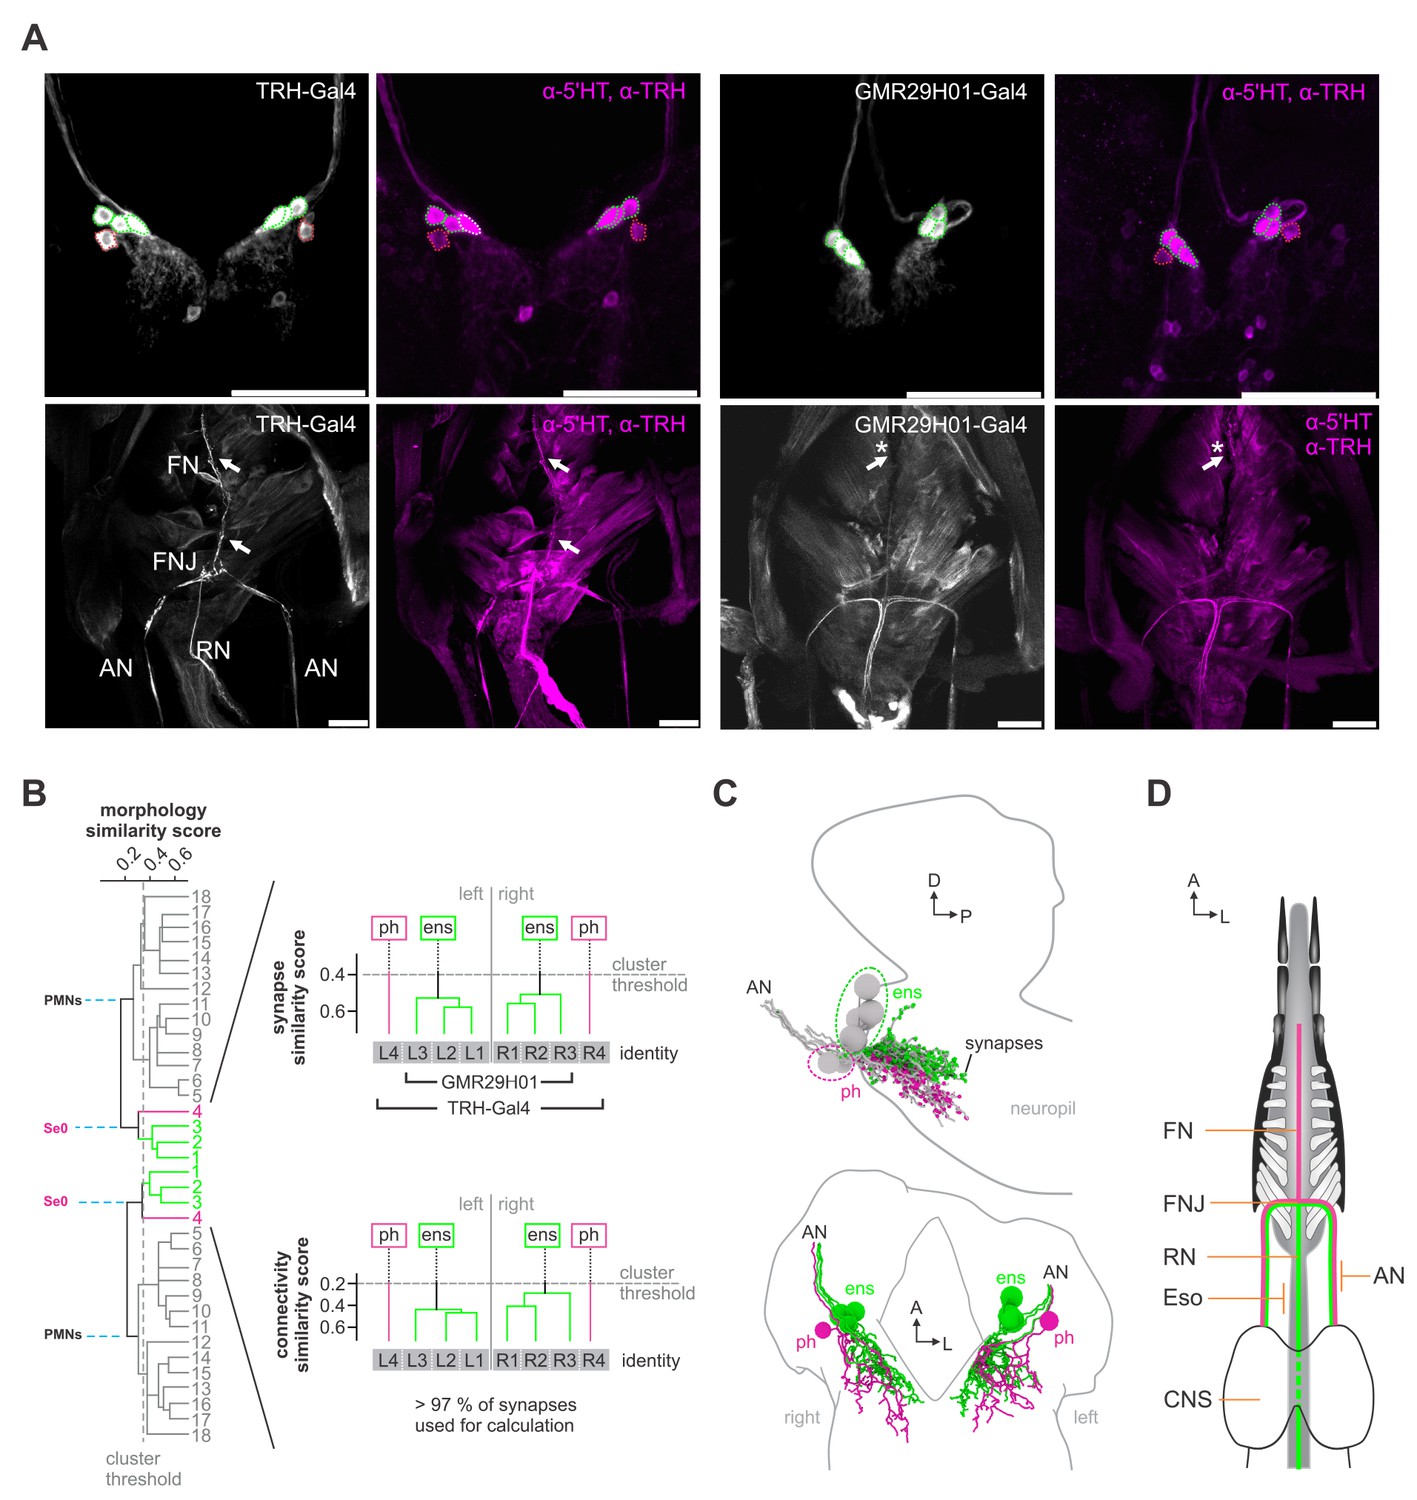
(A) Analysis of serotonergic GAL4 lines. Expression of TRH and Serotonin in TRH-Gal4 and GMR29H01-Gal4 driving GFP. TRH-Gal4 shows expression in all 4 cells of the Se0 cluster. In contrast, GMR29H01-Gal4 shows expression in only 3 of the 4 Se0 cells. In comparison with the THR-Gal4 line, GMR29H01-Gal4 does not shows expression in the frontal nerve (FN). Thus, the frontal nerve is innervated by Se0ph neurons. (B) All output neurons of the left and right antennal nerve (except seven pioneer neurons) are ordered by a dendrogram of morphological similarity between each neuron. Dendrograms are split into pharyngeal motor neurons (PMNs) and serotonergic output neurons (Se0) (left panel). Synapse similarity score and connectivity similarity score of the Se0 cluster (right panel). Morphology, synapse and connectivity clustering revealed two subclusters within the Se0 cluster consistently across both hemi sides that match the 3 Se0ens and 1 Se0ph neurons. (C) Distribution of synaptic sites (upper panel) and EM reconstruction (lower panel) of the clustered Se0 neurons. (D) Summarizing representation of the Se0 projections in the periphery. Se0ph projects into the CDM via the frontal nerve (FN), whereas Se0ens projects to the enteric nervous system via the recurrent nerve (RN).
Figure 3 with 5 supplements

Monosynaptic circuits between sensory and output neurons.
(A) Lateral schematics of the presynaptic sensory compartments and postsynaptic terminals for each output neuron type (upper panel). EM reconstruction of respective neurons (lower panel). Left: sensory neurons are color-coded based on total number of synapses to their monosynaptic targets. Right: output neurons are color-coded based on total number of synapses from sensory neurons. Lateral views show neurons of the right side. (B) Percentage of sensory neurons of the respective sensory compartment forming monosynaptic circuits. About 90% of all sensory neurons of ACa, AVa, AVp are part of monosynaptic circuits; in contrast, ACp, ACal, ACpl and VM show little to none. (C) Connectivity diagram of axo-dendritic connections between sensory and output neurons. Circles represent previously defined sensory and output compartments (Figure 2). Sensory compartments with no monosynaptic reflex connections are faded. (D) Connectivity between sensory neurons of different compartments (ACa, AVa, AVp, ACp and VM) and postsynaptic output targets. Each column represents an output target. Whiskers represent standard deviation. (E) Left: percentage of synapses of sensory neurons to monosynaptic targets. Right: percentage of synapses of output neurons from sensory neurons. (F) Summarizing representation of monosynaptic input-to-output ratio viewed from the sensory neuron side (top) or from the output neuron side (bottom). See Figure 3—figure supplements 1–5 for detailed connectivity.
Figure 3—figure supplement 1

The elemental feeding circuit.
Force-directed connectivity graph of all axo-dendritic connections between sensory neurons and output neurons. Each node represents a single neuron. Nodes are colored based on their broader identity (sensory compartment, motor, modulatory and neuroendocrine groups). Effectors of neurosecretory, modulatory and motor output neurons (lower panel): mNSCs target the ring gland and release Drosophila insulin-like-peptides (Dilps), Dromyosuppressin (DMS) and diuretic hormone 44 (DH44); Pharyngeal motor and Se0ph neurons target the pharyngeal pump; Se0ens neurons target the enteric nervous system; MxN motor neurons control mouth hook movement, labial retraction and opening of the salivary gland ductus; PaN motor neurons tilt the whole CPS.
Figure 3—figure supplement 2

Connectivity principles of monosynaptic reflex connections.
(A) Specialists target exclusively one output group. Generalists diverge onto different output groups. (B,C,D) Connectivity between presynaptic sensory neurons of mNSCs (Dilps, DMS, DH44), the Se0 Cluster (Se0ens, Se0ph) and feeding motor neurons (PMNs, MxN-, PaN motor neurons). Each column across the graphs represents a presynaptic partner of the output neurons. Whiskers represent standard deviation. (E) Venn diagrams show overlap and difference between presynaptic sensory neurons of the different target groups. (F) Amount of monosynaptic downstream partners per sensory neuron, using a synaptic threshold of 1–3 synapses. (G) Percentage of output neurons targeted in a hierarchical or reciprocal manner. Only Se0ph (2 cells) and a few pharyngeal motor neurons (7 cells) show presynaptic sites. Therefore, reciprocal contacts only occur in these cases (left panel). Percentage of all unidirectional connections from all sensory neurons to a given output target, relative to the number of synapses between two neurons (middle panel). Amount of reciprocal connection combinations from all sensory neurons to a given output target, or vice versa (right panel).
Figure 3—figure supplement 3
Sensory-to-mNSC connectivity.
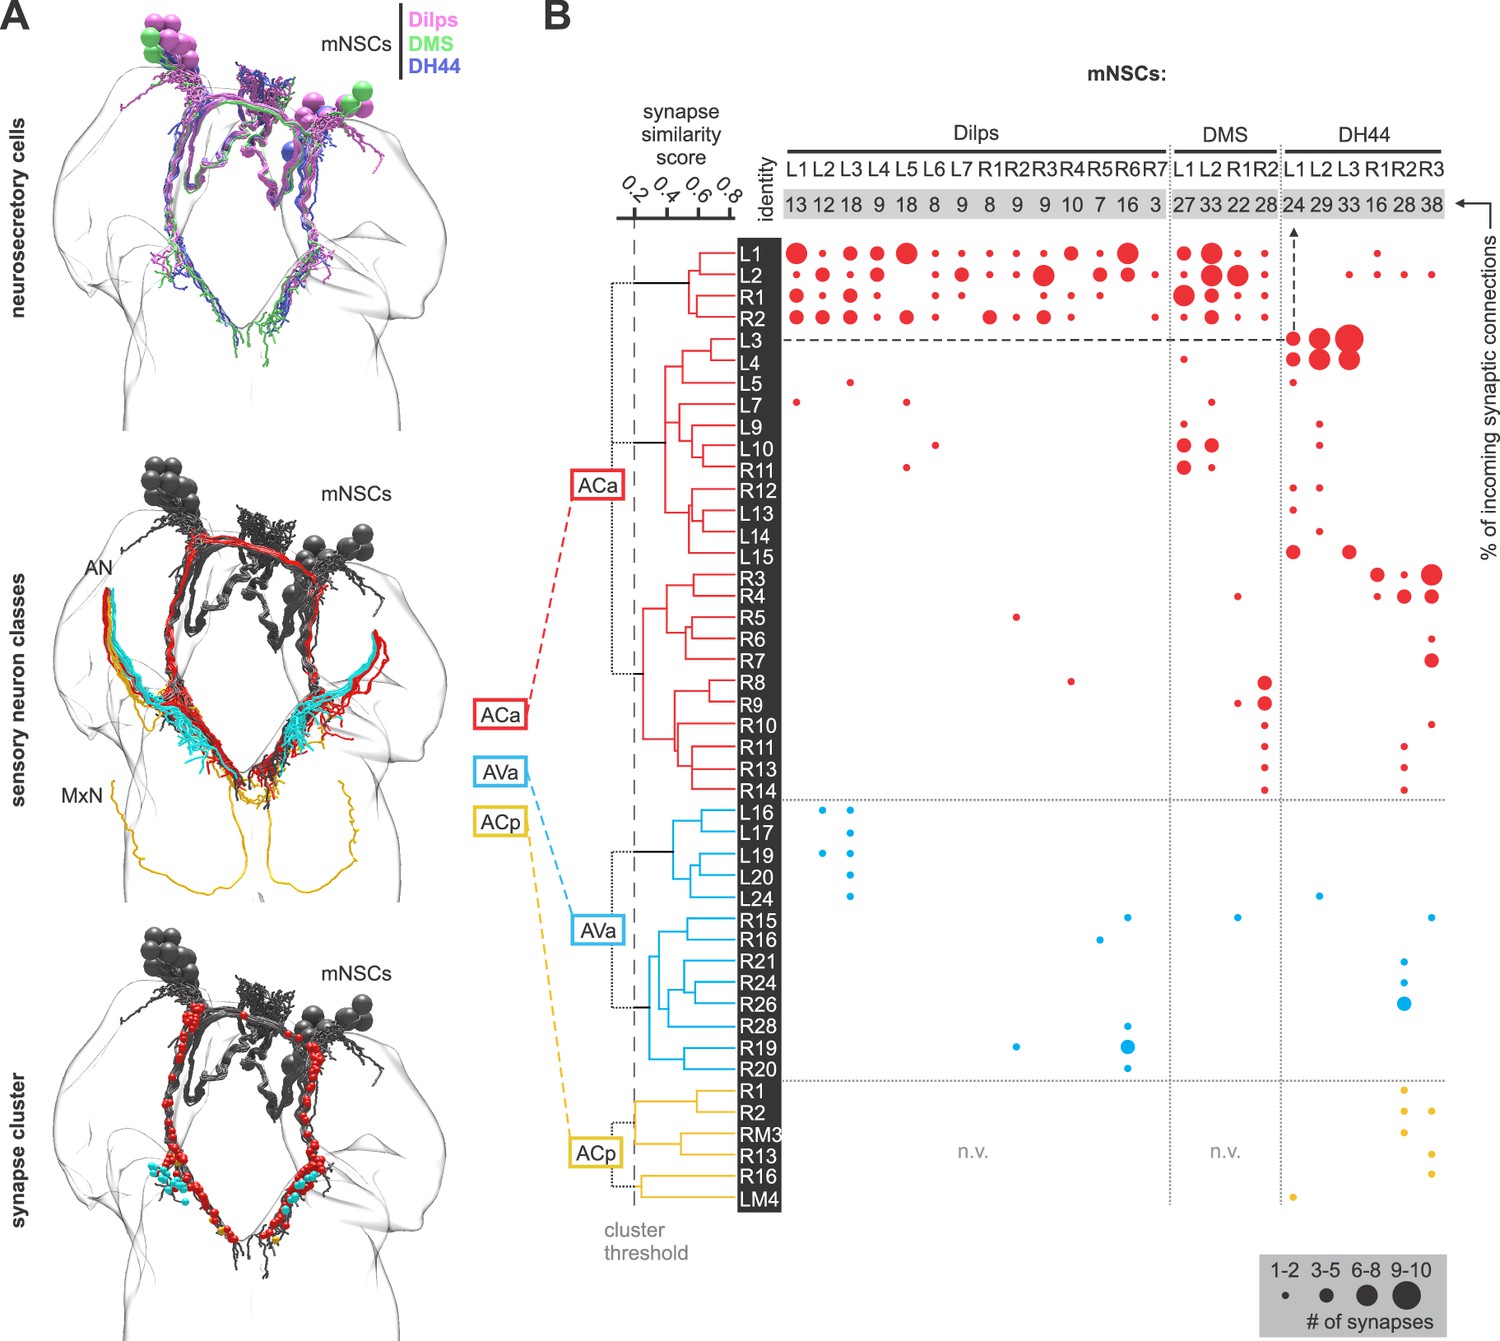
(A) EM reconstruction of mNSCs (Dilps, DMS, DH44). The mNSCs were clustered based on connectivity similarity since they are not anatomically distinguishable (Schlegel et al., 2016) (upper panel). EM reconstruction of sensory neurons (middle panel) and their synaptic contacts (lower panel) with mNSCs. Each dot represents a synaptic site. Neurons and synaptic sites are colored based on their sensory compartment (ACa, AVa and ACp). (B) All presynaptic sensory neurons of mNSCs clustered based on synapse similarity. Connectivity matrix shows that Dilps- and DMS-producing cells receive monosynaptic contacts from 2 of the 7 SEZ sensory compartments. DH44-producing neurons are the only cells that receive a very limited number of monosynaptic inputs from the primary gustatory center (ACp).
Figure 3—figure supplement 4
Sensory-to-Se0 connectivity.
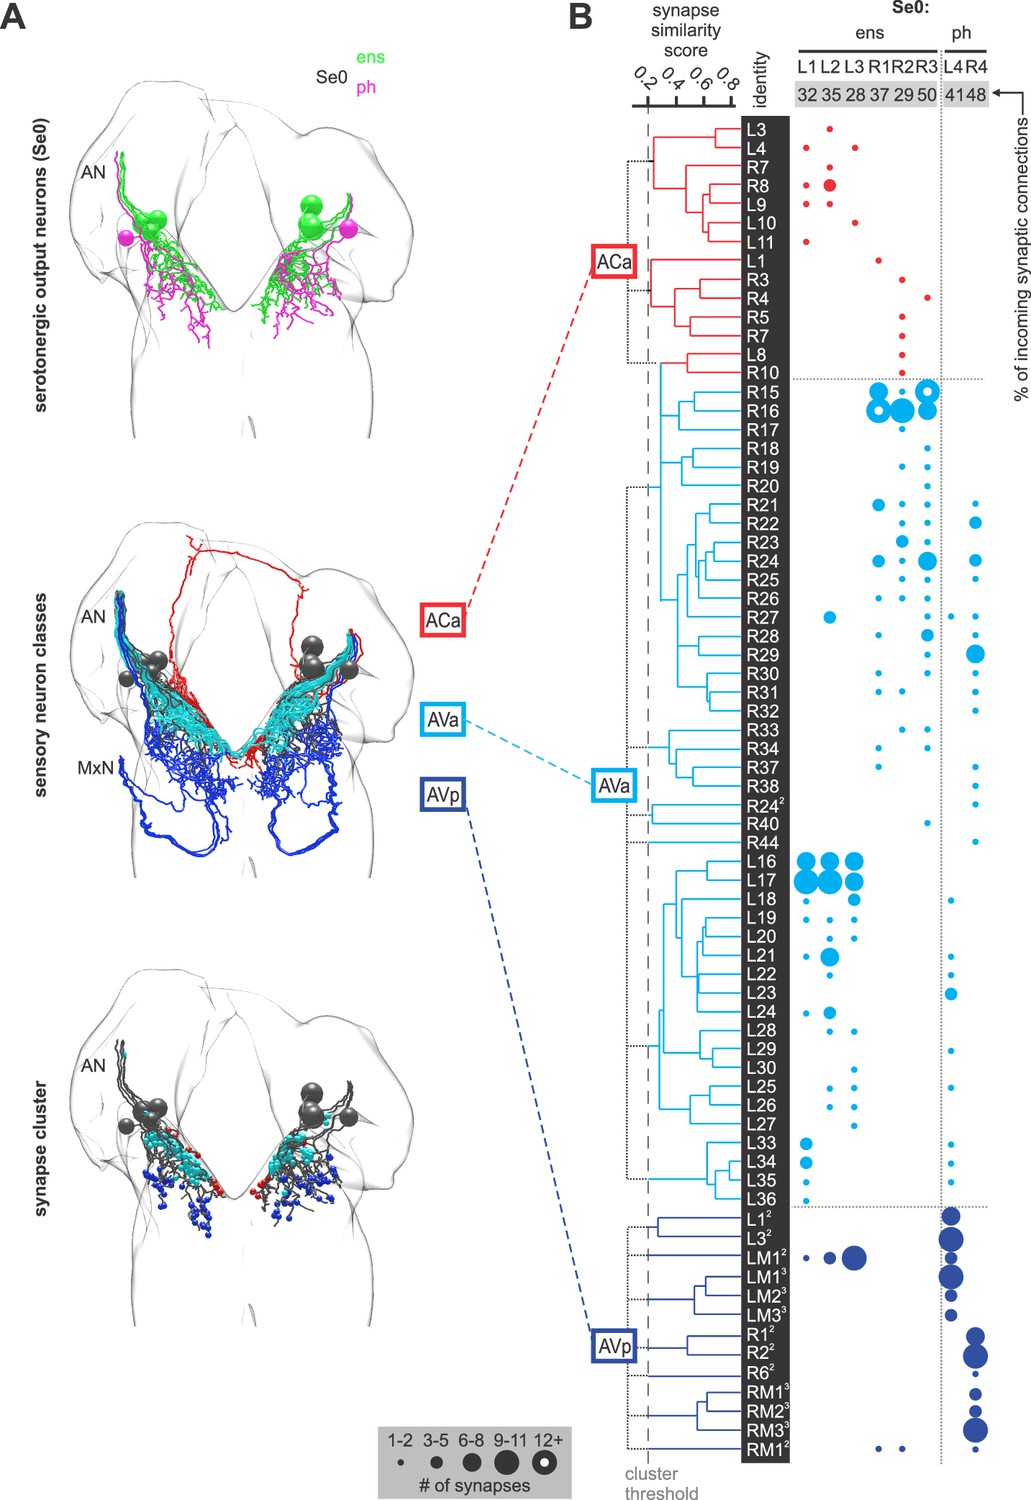
(A) EM reconstruction of the Se0 cluster (Se0ens, Se0ph) (upper panel). EM reconstruction of sensory neurons (middle panel) and their synaptic contacts (lower panel) with Se0. Each dot represents a synaptic site. Neurons and synaptic sites are colored based on their sensory compartment (ACa, AVa and AVp). (B) All presynaptic sensory neurons of Se0 clustered based on synapse similarity. Connectivity matrix shows that up to 50% of all incoming synaptic connections to the Se0 cells are made by sensory neurons from 3 of the 7 SEZ sensory compartments. Se0ens and Se0ph are mainly targeted by AVa and AVp sensory neurons, respectively.
Figure 3—figure supplement 5
Sensory-to-PMN connectivity.
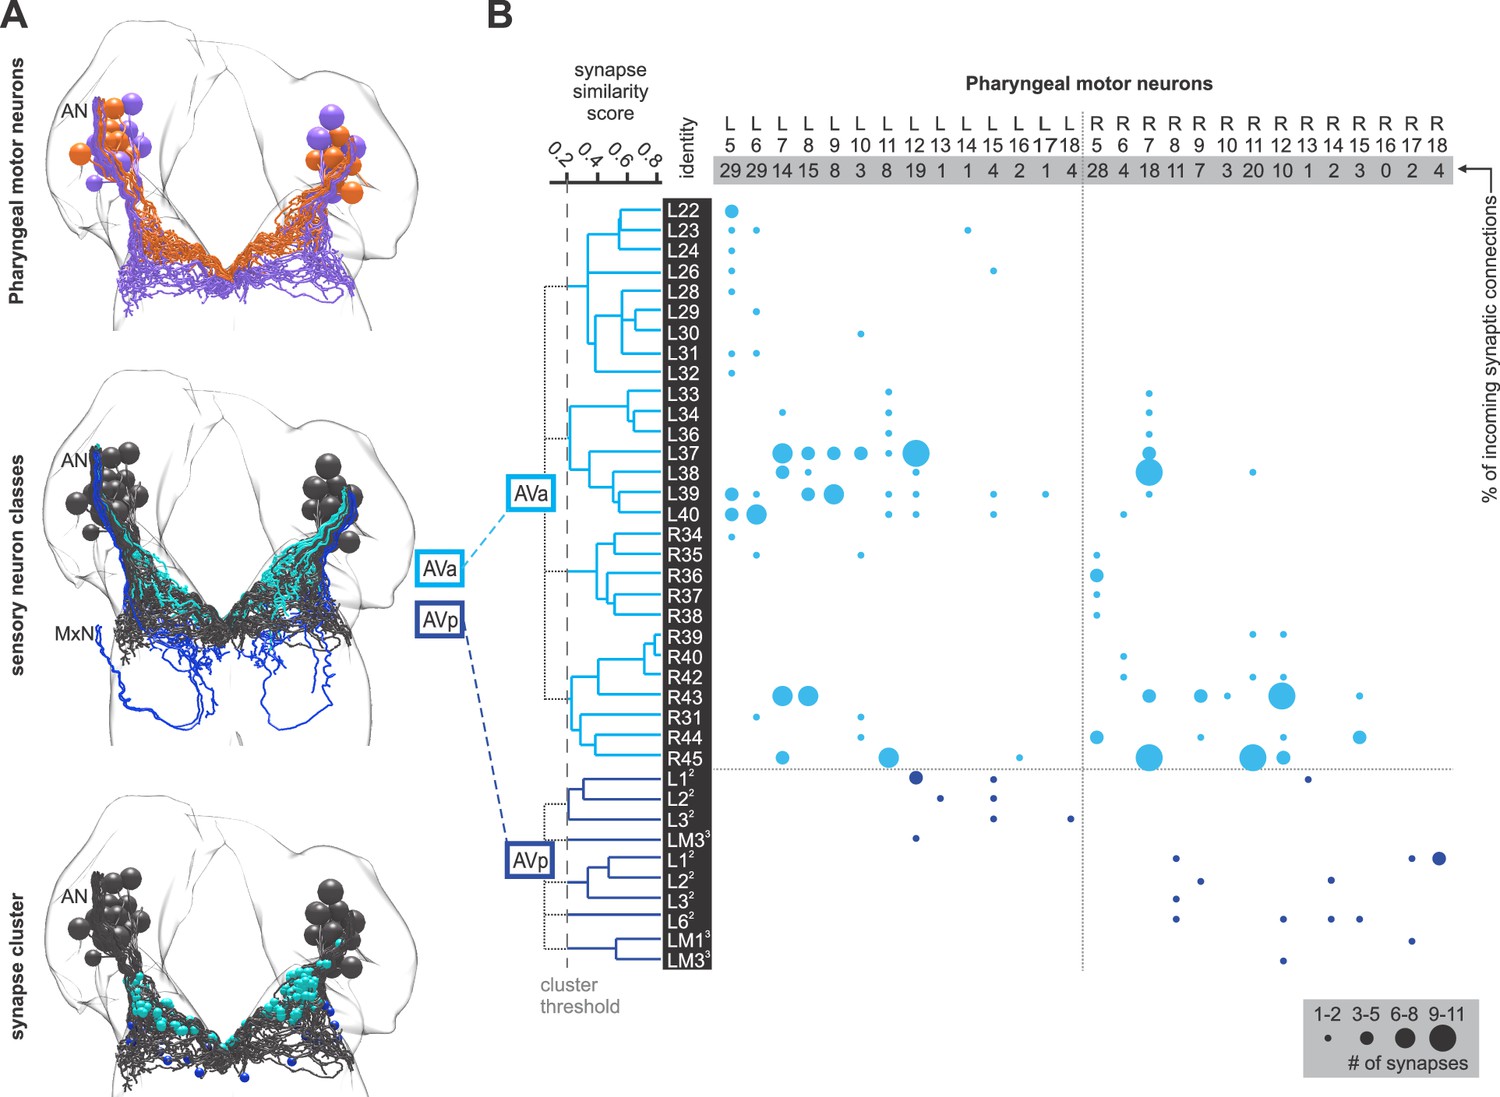
(A) EM reconstruction of the pharyngeal motor neurons (upper panel). EM reconstruction of sensory neurons (middle panel) and their synaptic contacts (lower panel) with pharyngeal motor neurons. Each dot represents a synaptic site. Neurons and synaptic sites are colored based on their sensory compartment (AVa and AVp). (B) All presynaptic sensory neurons of pharyngeal motor neurons clustered based on synapse similarity. Connectivity matrix shows that pharyngeal motor neurons receive monosynaptic contacts from 2 of the 7 SEZ sensory compartments. Most of the AVa contacts are made to motor neurons 5–12 consistently across both hemi sides.
Figure 4 with 2 supplements
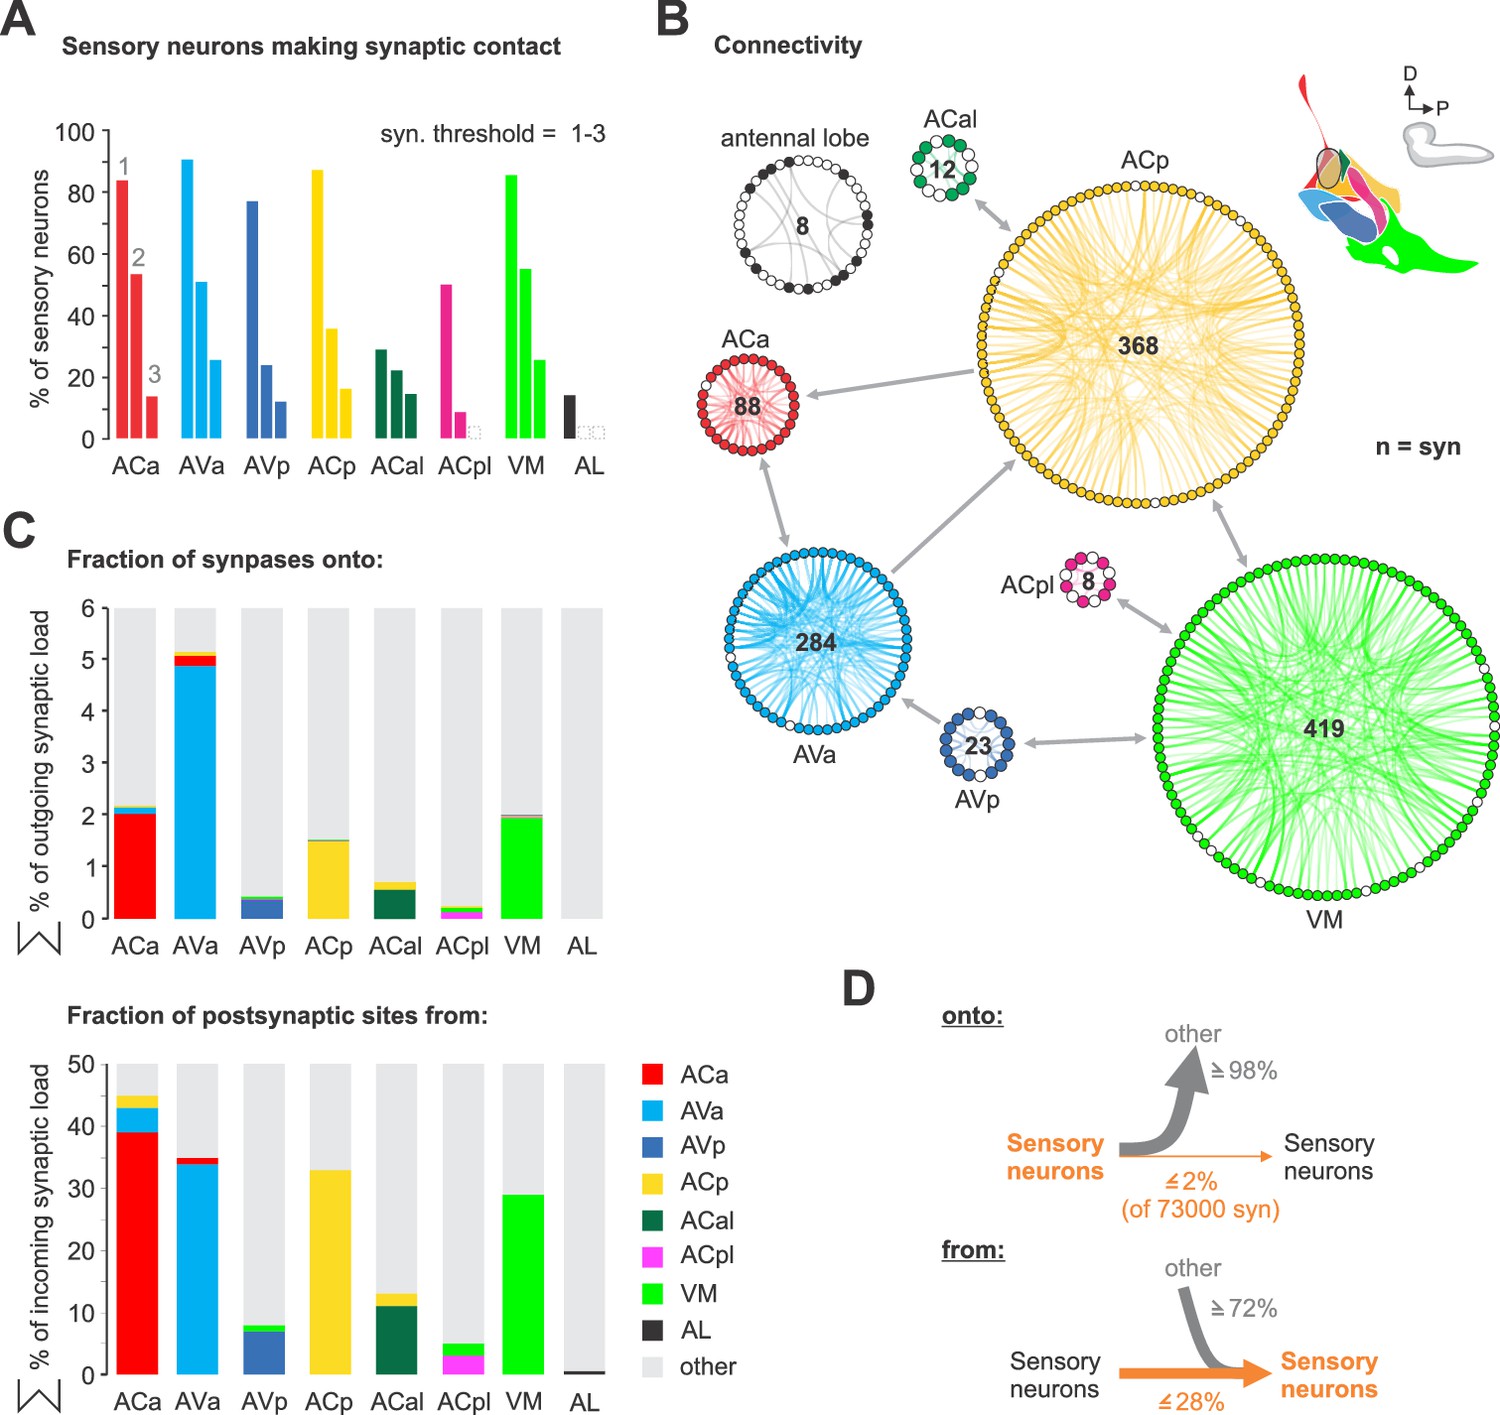
Sensory-sensory communication.
(A) Percentage of sensory neurons of sensory compartments involved in intra compartment sensory connections. Around 80% of all sensory neurons in ACa, AVa, AVp, ACp and VM form intra sensory connections. ACal and ACpl have the lowest number of neurons and also show low number of intra sensory contacts. (B) Connectivity diagram of axo-axonic connections between sensory neurons. The circular wheel arrangements represent previously defined sensory compartments (see Figure 2). Each small circle within a wheel represents a single neuron. Gray links show inter-cluster connections (max. 10 synapses in one direction). Note that sensory to sensory contacts are made mainly between sensory neurons of the same class, not between classes. (C) Percentage of synapses of sensory neurons from and onto sensory neurons. (D) Summarizing representation of axo-axonic contact input-to-output ratio viewed from the presynaptic neuron side (top) or from the postsynaptic neuron side (bottom). See Figure 4—figure supplements 1–2 for detailed connectivity.
Figure 4—figure supplement 1
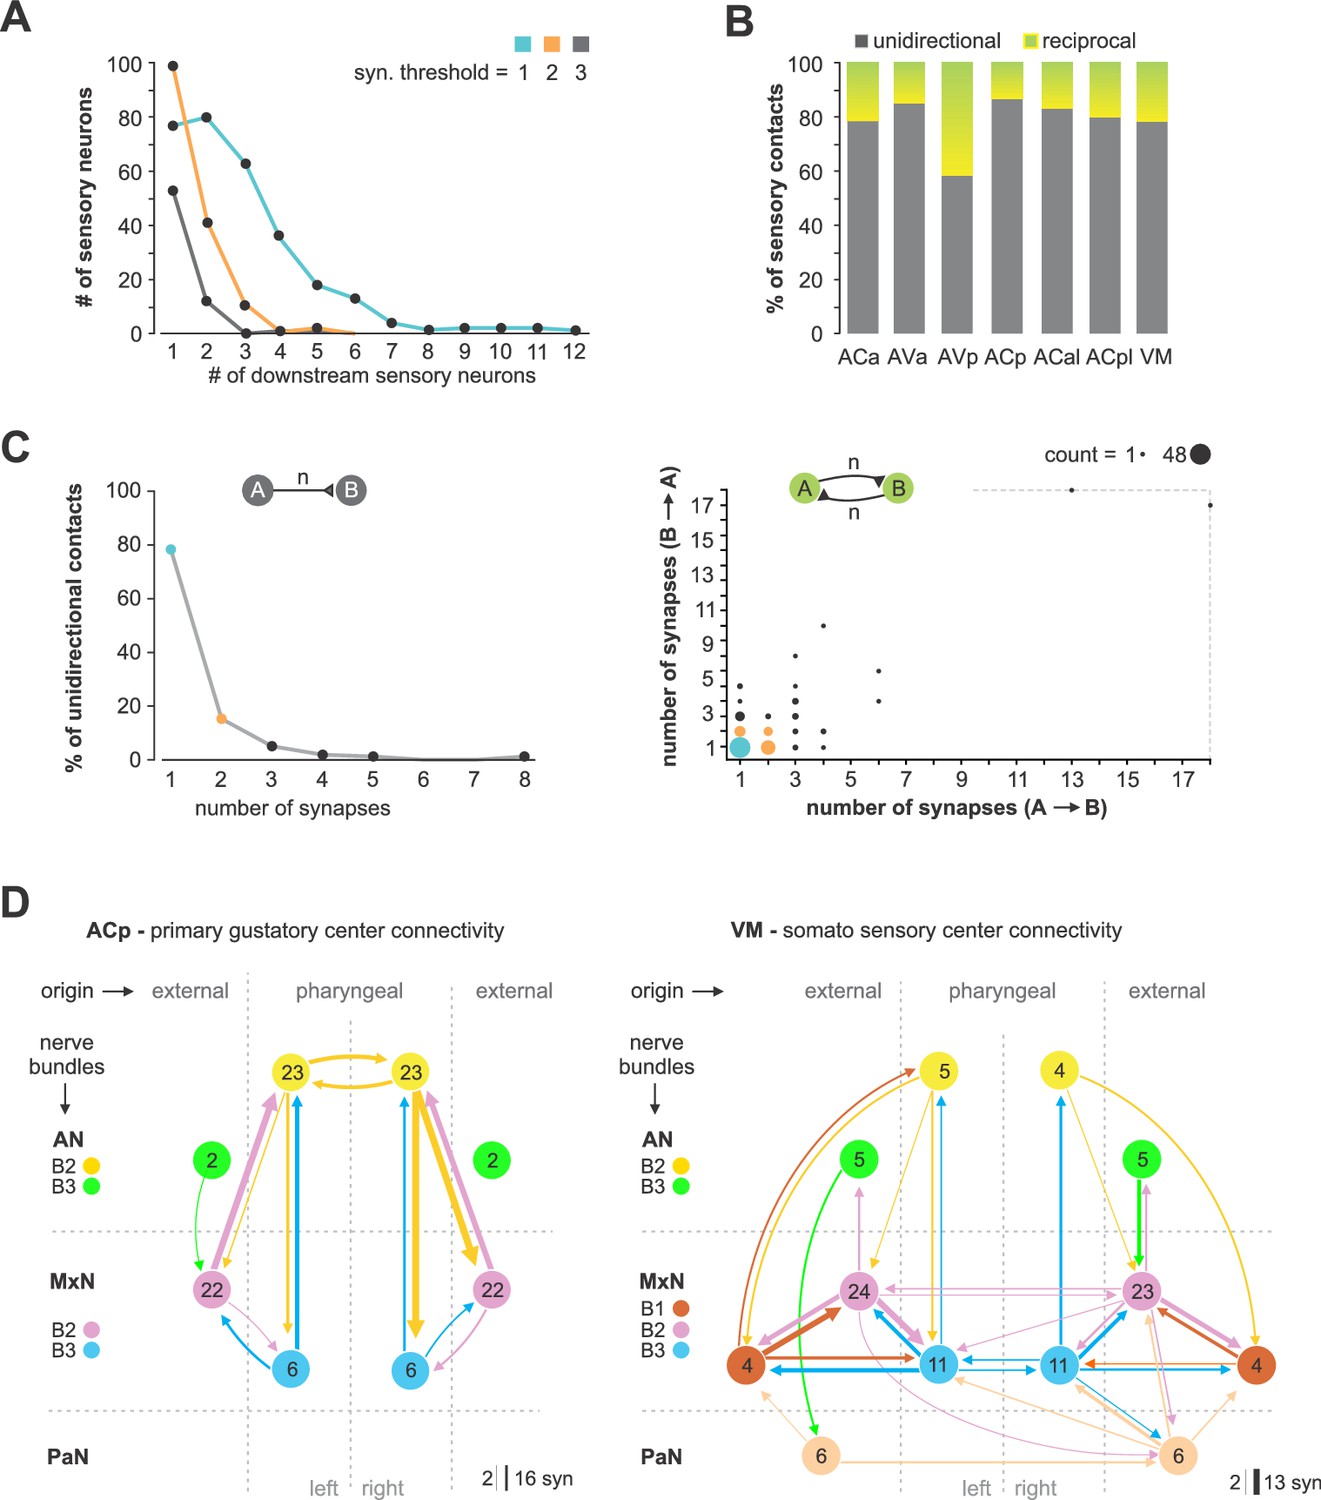
Connectivity principles of inter-sensory connections.
(A) Amount of monosynaptic downstream partners (sensory neurons) per sensory neuron, using a synaptic threshold of 1–3 synapses. (B) Percentage of neurons per sensory compartment showing hierarchical or reciprocal inter sensory connections. Most of the sensory neurons are connected in a hierarchical manner. (C) Percentage of all unidirectional connections across all sensory clusters in relation to synaptic strength between two sensory neurons (left panel). Amount of reciprocal connection combinations between two sensory neurons (right panel). (D) Connectivity graph of all inter-sensory contacts of ACp and VM neurons using a synaptic threshold of 2. Sensory information with different peripheral origin (nerves, organs) is integrated at the sensory level. Node numbers indicate amount of sensory neurons.
Figure 4—figure supplement 2
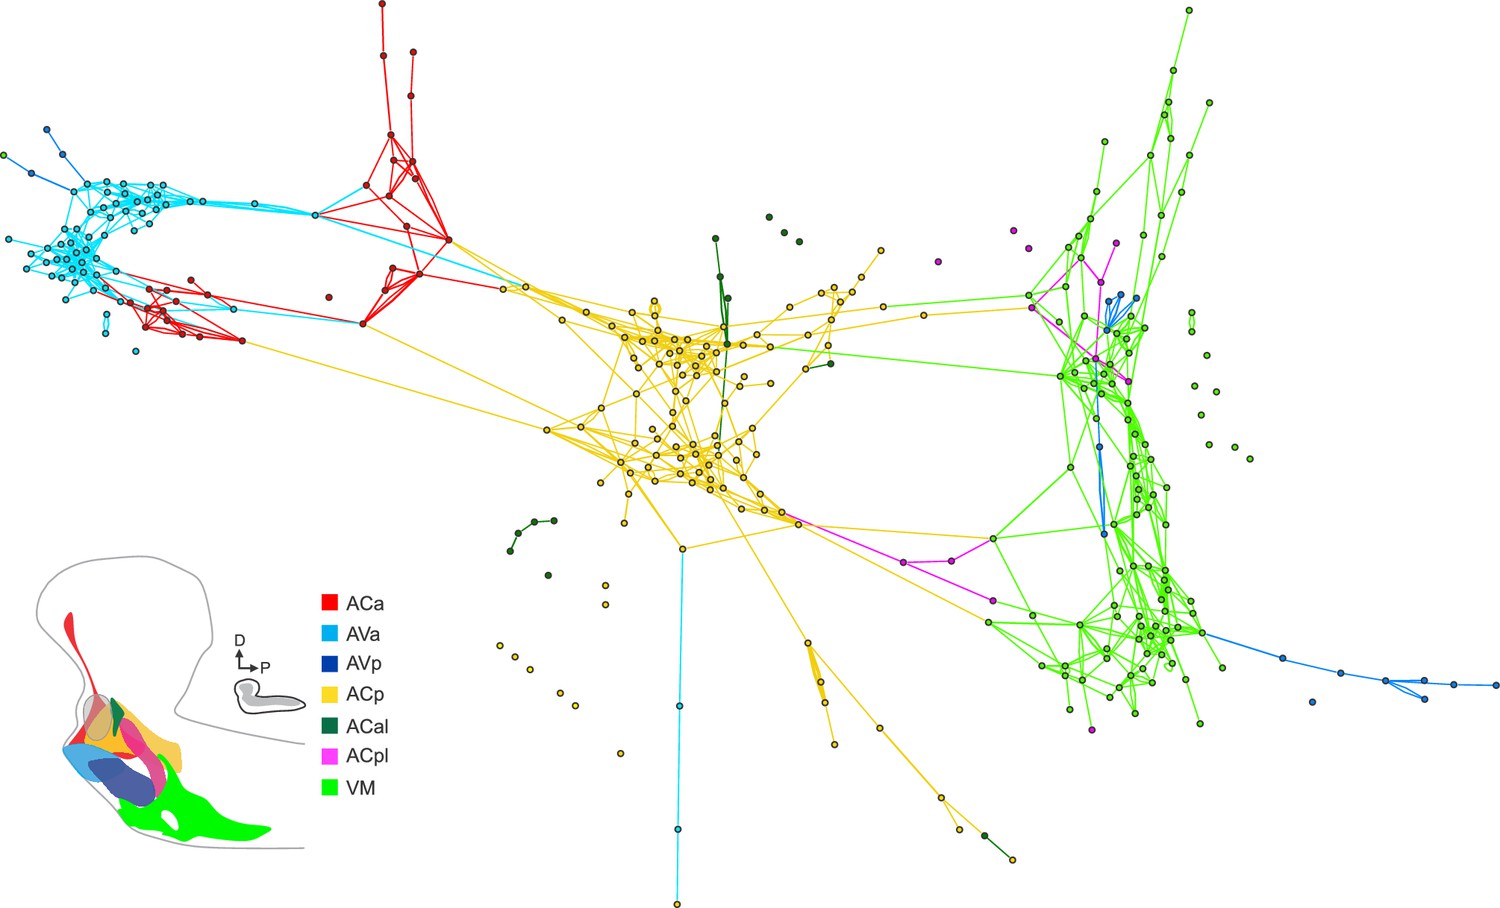
Map of inter-sensory connections.
Force-directed connectivity graph of all axo-axonic connections between sensory neurons. Each node represents a single neuron. Nodes are colored based on their broader identity (sensory compartments).
Figure 5 with 9 supplements
Mapping peripheral origin of sensory neurons.
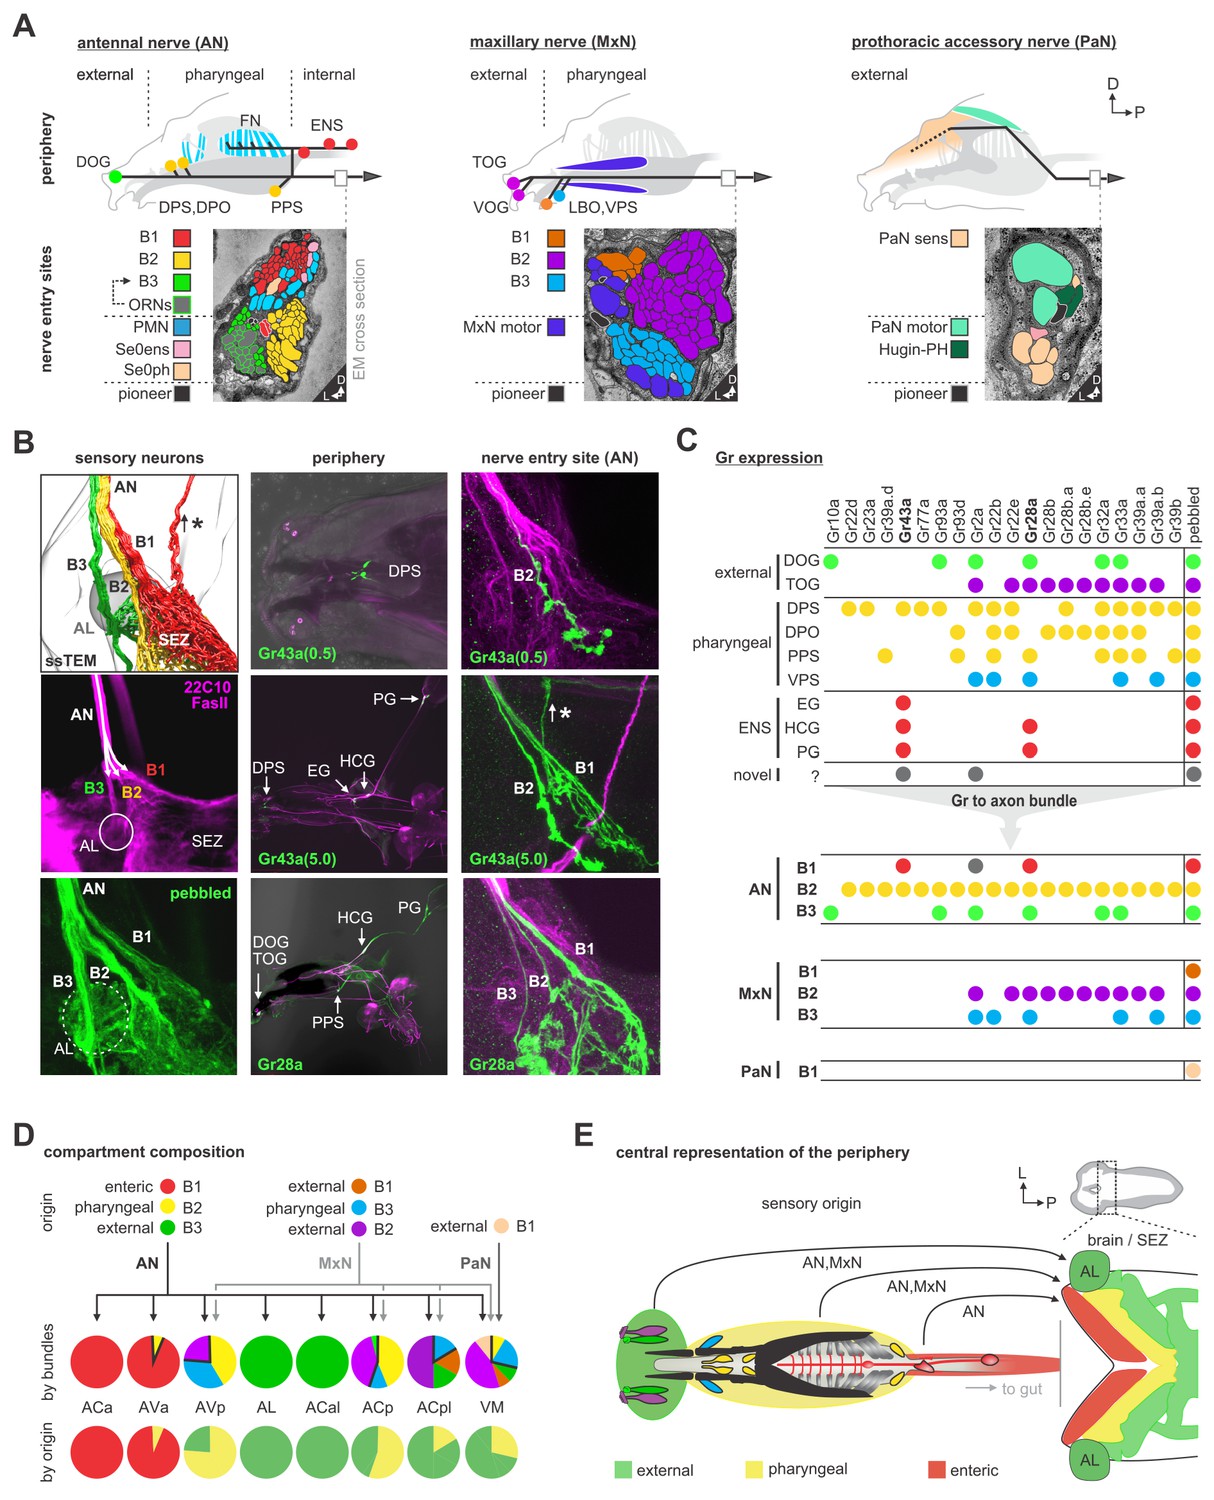
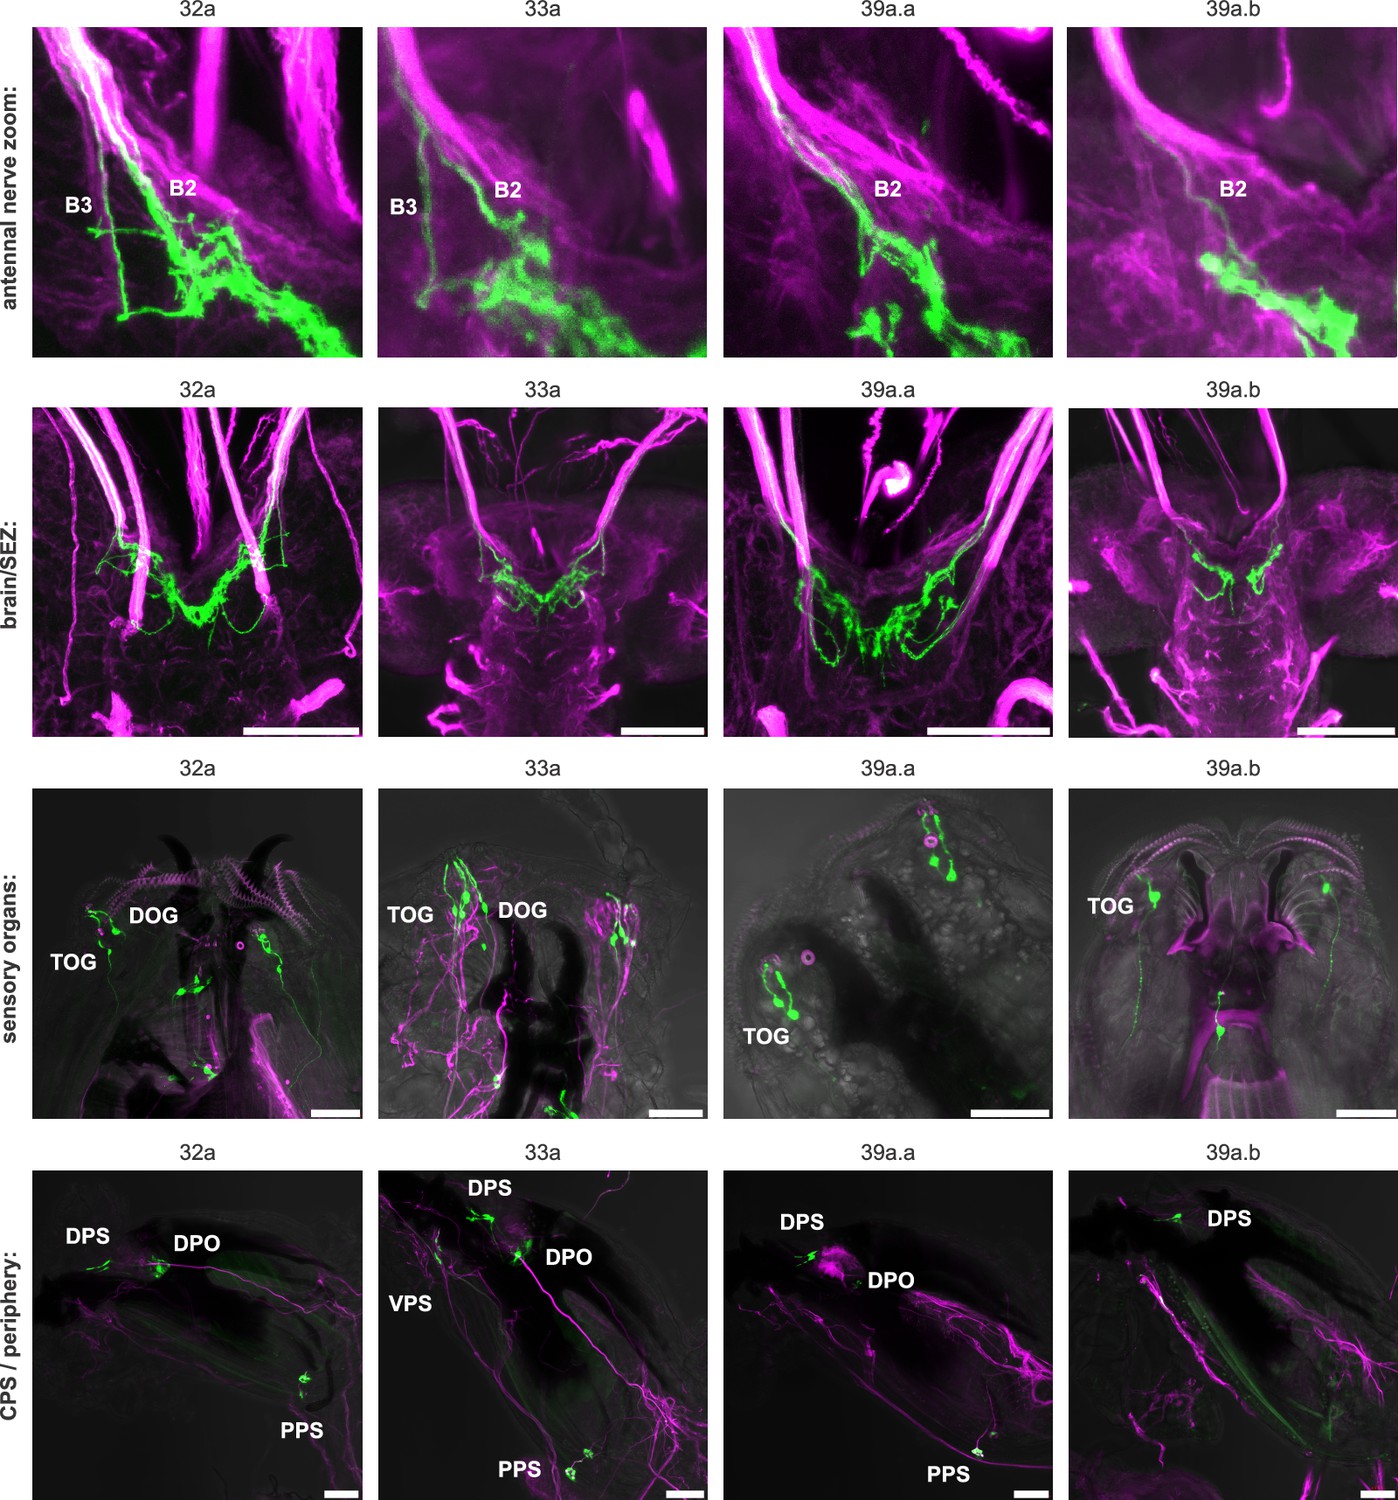
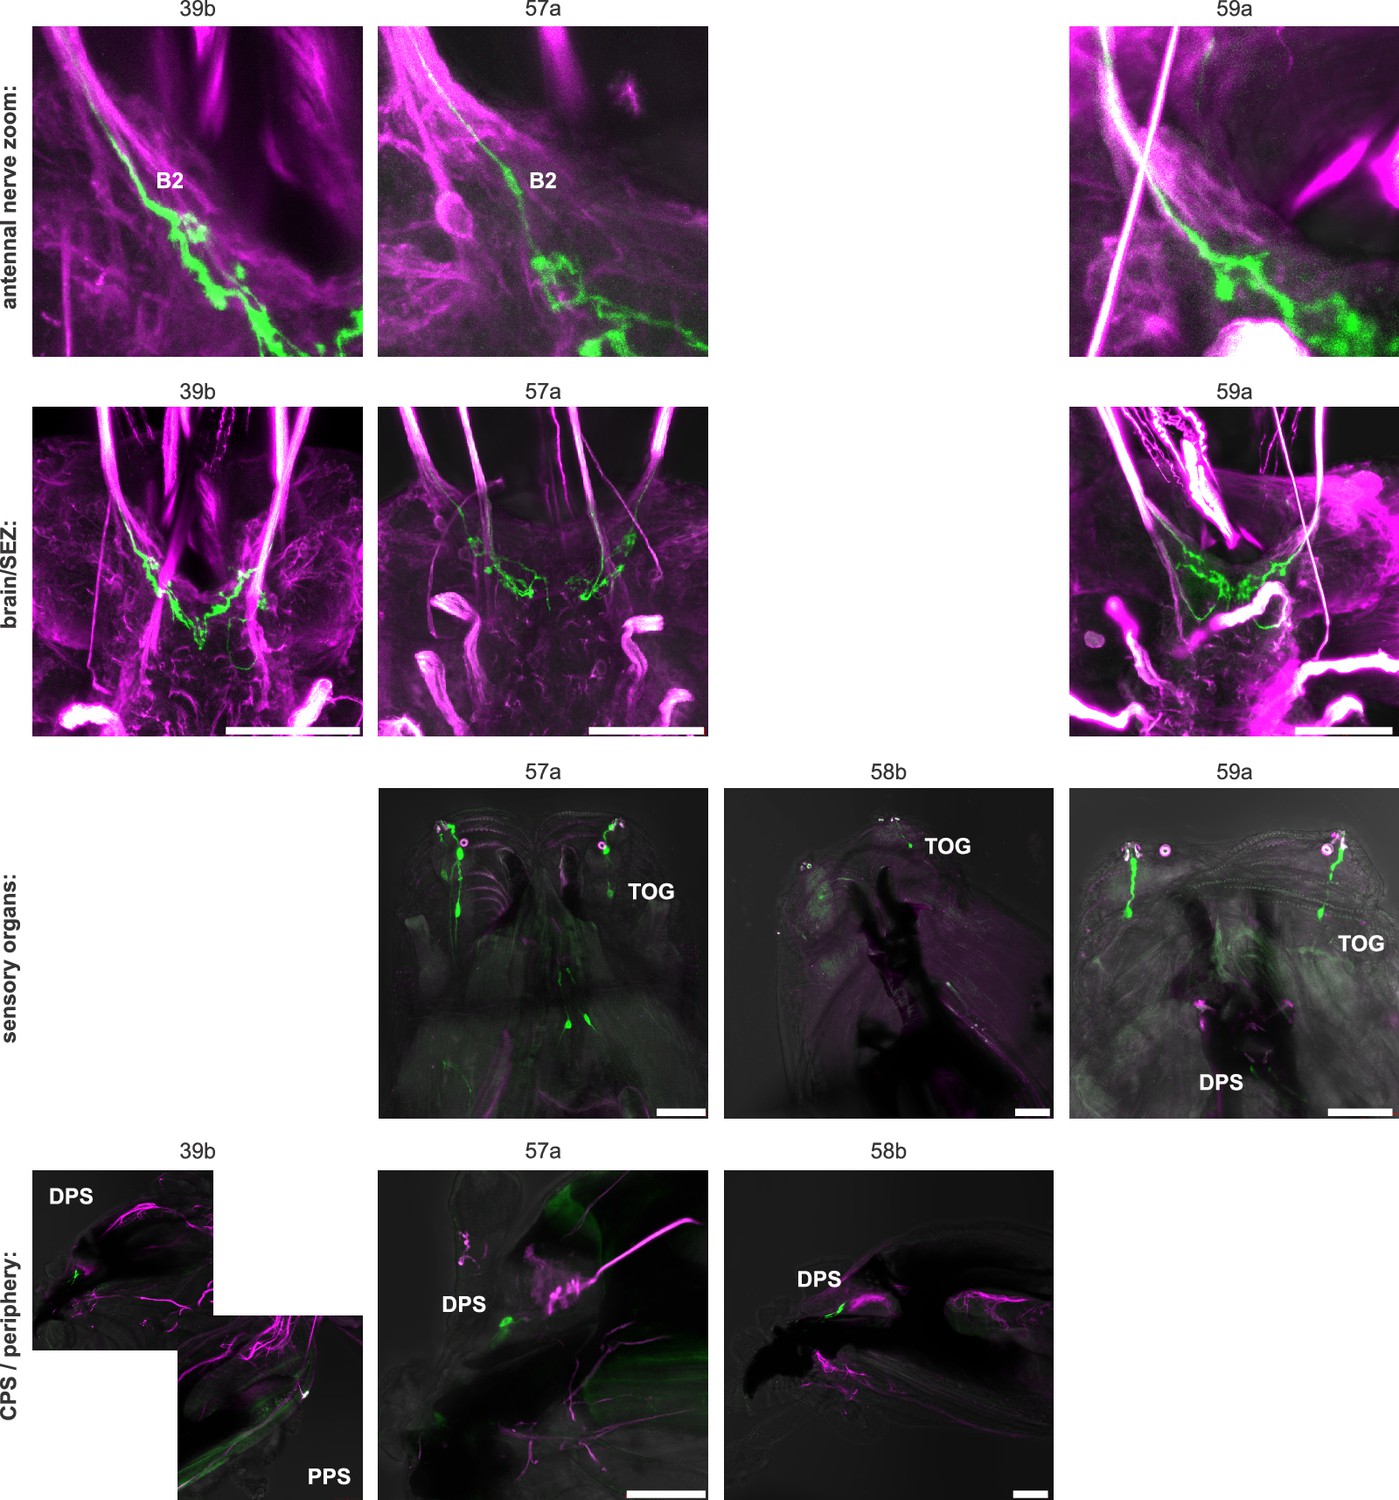
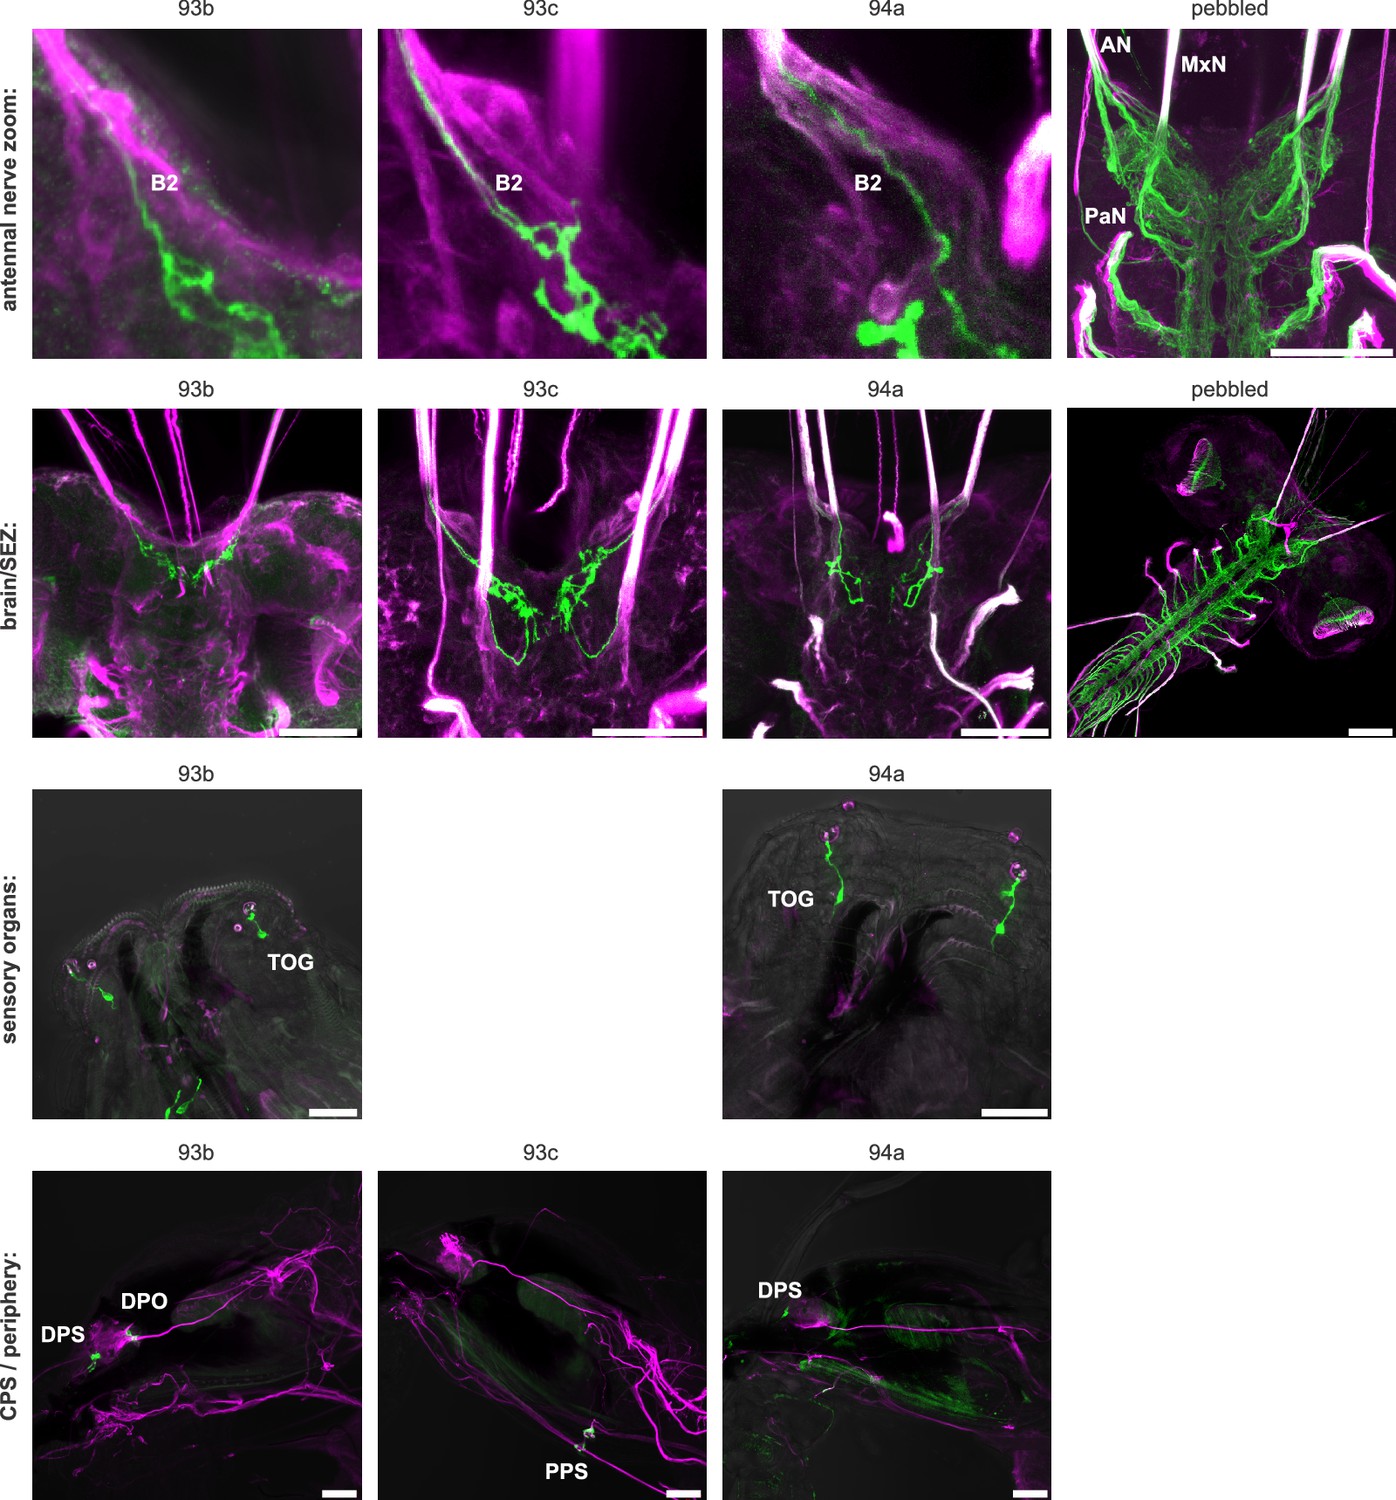
(A) Origins and targets of feeding related sensory and motor neurons. The AN comprises motor axons innervating the cibarial dilator muscles (blue striped region) and sensory axons from the dorsal organ ganglion (DOG), pharyngeal sensilla (DPS, DPO, PPS), frontal nerve (FN) and enteric nervous system (ENS). The MxN comprises motor axons innervating the mouth hook elevator and depressor (in purple), labial retractor and salivary gland ductus opener; and sensory axons from the terminal organ ganglion (TOG), ventral organ ganglion (VOG), labial organ (LBO) and pharyngeal sensilla (VPS). The PaN comprises motor axons innervating the dorsal protractor (in green), and sensory neurons with an hypothesized origin in the anterior pharyngeal region (in beige). EM cross section of the right AN, MxN and PaN at nerve entry site (lower panels). Neuronal profiles of all neurons are colored based on their morphological class and origin. (B) Mapping of Gr28a and Gr43a gustatory receptor neuron projection through distinct bundles of the AN from the enteric nervous system. Pebbled-Gal4 was used as a pan-sensory neuronal marker to shows expression in all 3 bundles of the AN. Asterisk marks sensory projections into the protocerebrum. (C) Summary table of selected Gr expression patterns from the peripheral origin (sensory organs and ganglia), and their expression in respective nerve entry site. Note that Gr28a and Gr43a show expression in the ENS (EG, esophageal ganglion; HCG, hypocerebral ganglion; PG, proventricular ganglion), which results in projections through bundle 1 (B1). (D) Sensory compartment composition by peripheral origin. ACa, ACal and AL each derive from a single sensory origin. In contrast, AVa, AVp, ACp, ACpl and VM integrate several sensory origins. Percentage compartment composition is shown by nerve bundles and by origin (enteric, pharyngeal, external). (E) Somatotopic arrangement of sensory axon in the brain and SEZ, showing a layered arrangement that mirrors the antero-posterior layout of innervated body structures. The internal layer (red) represents the enteric system. See Figure 5—figure supplements 1–9 for detailed gustatory receptor expression.
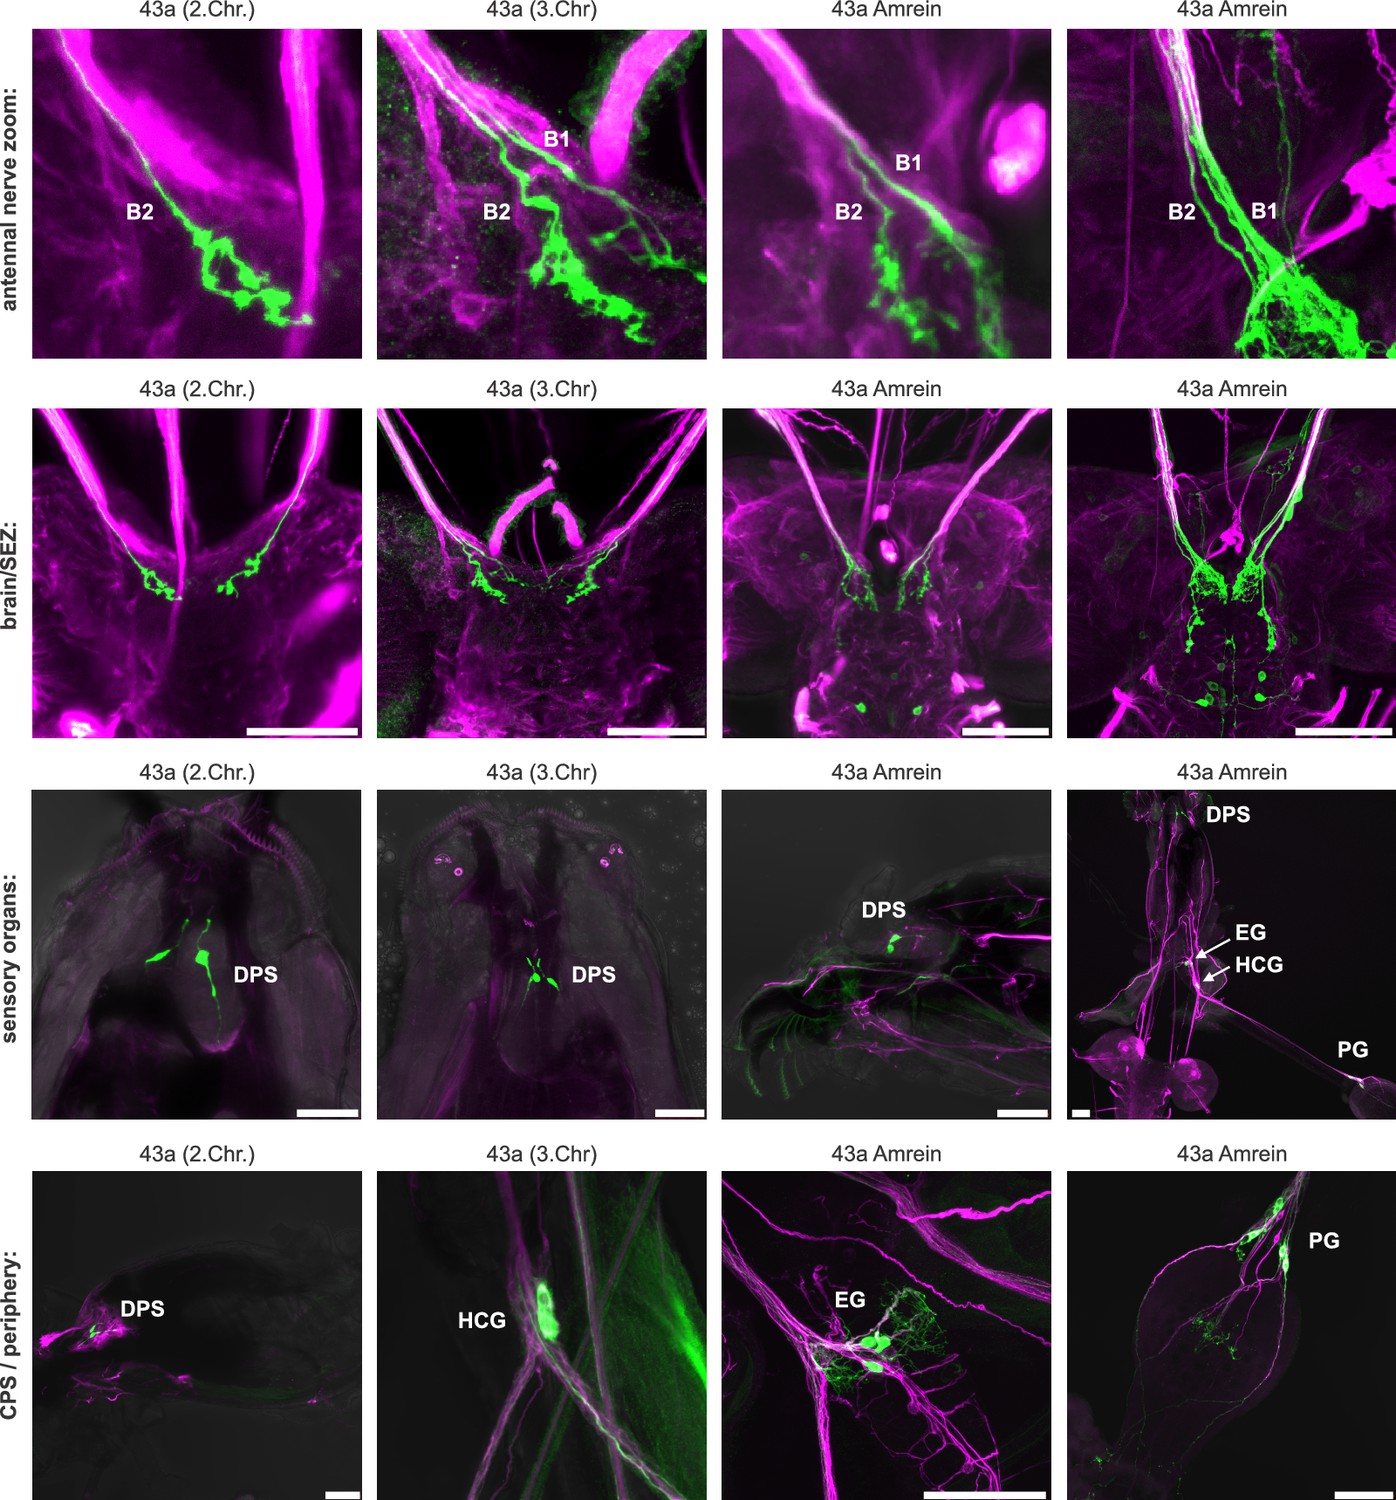
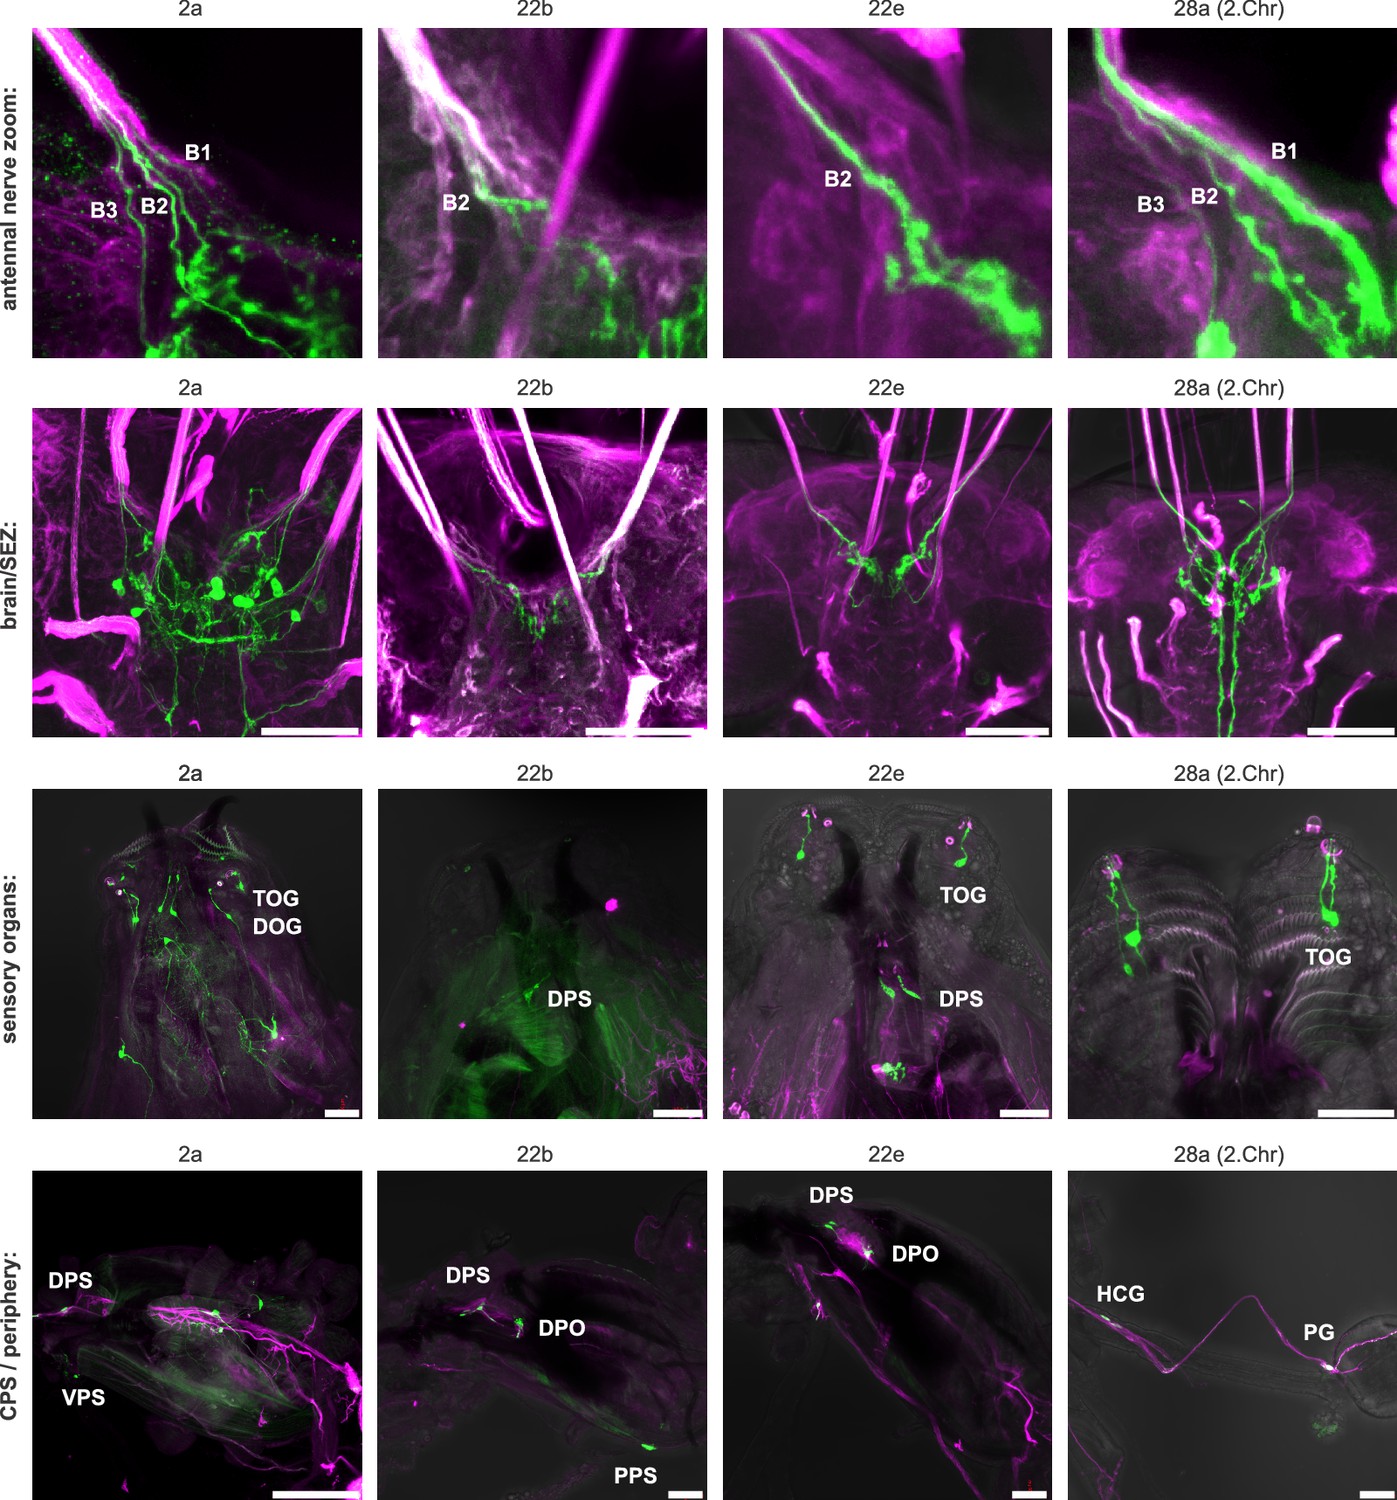
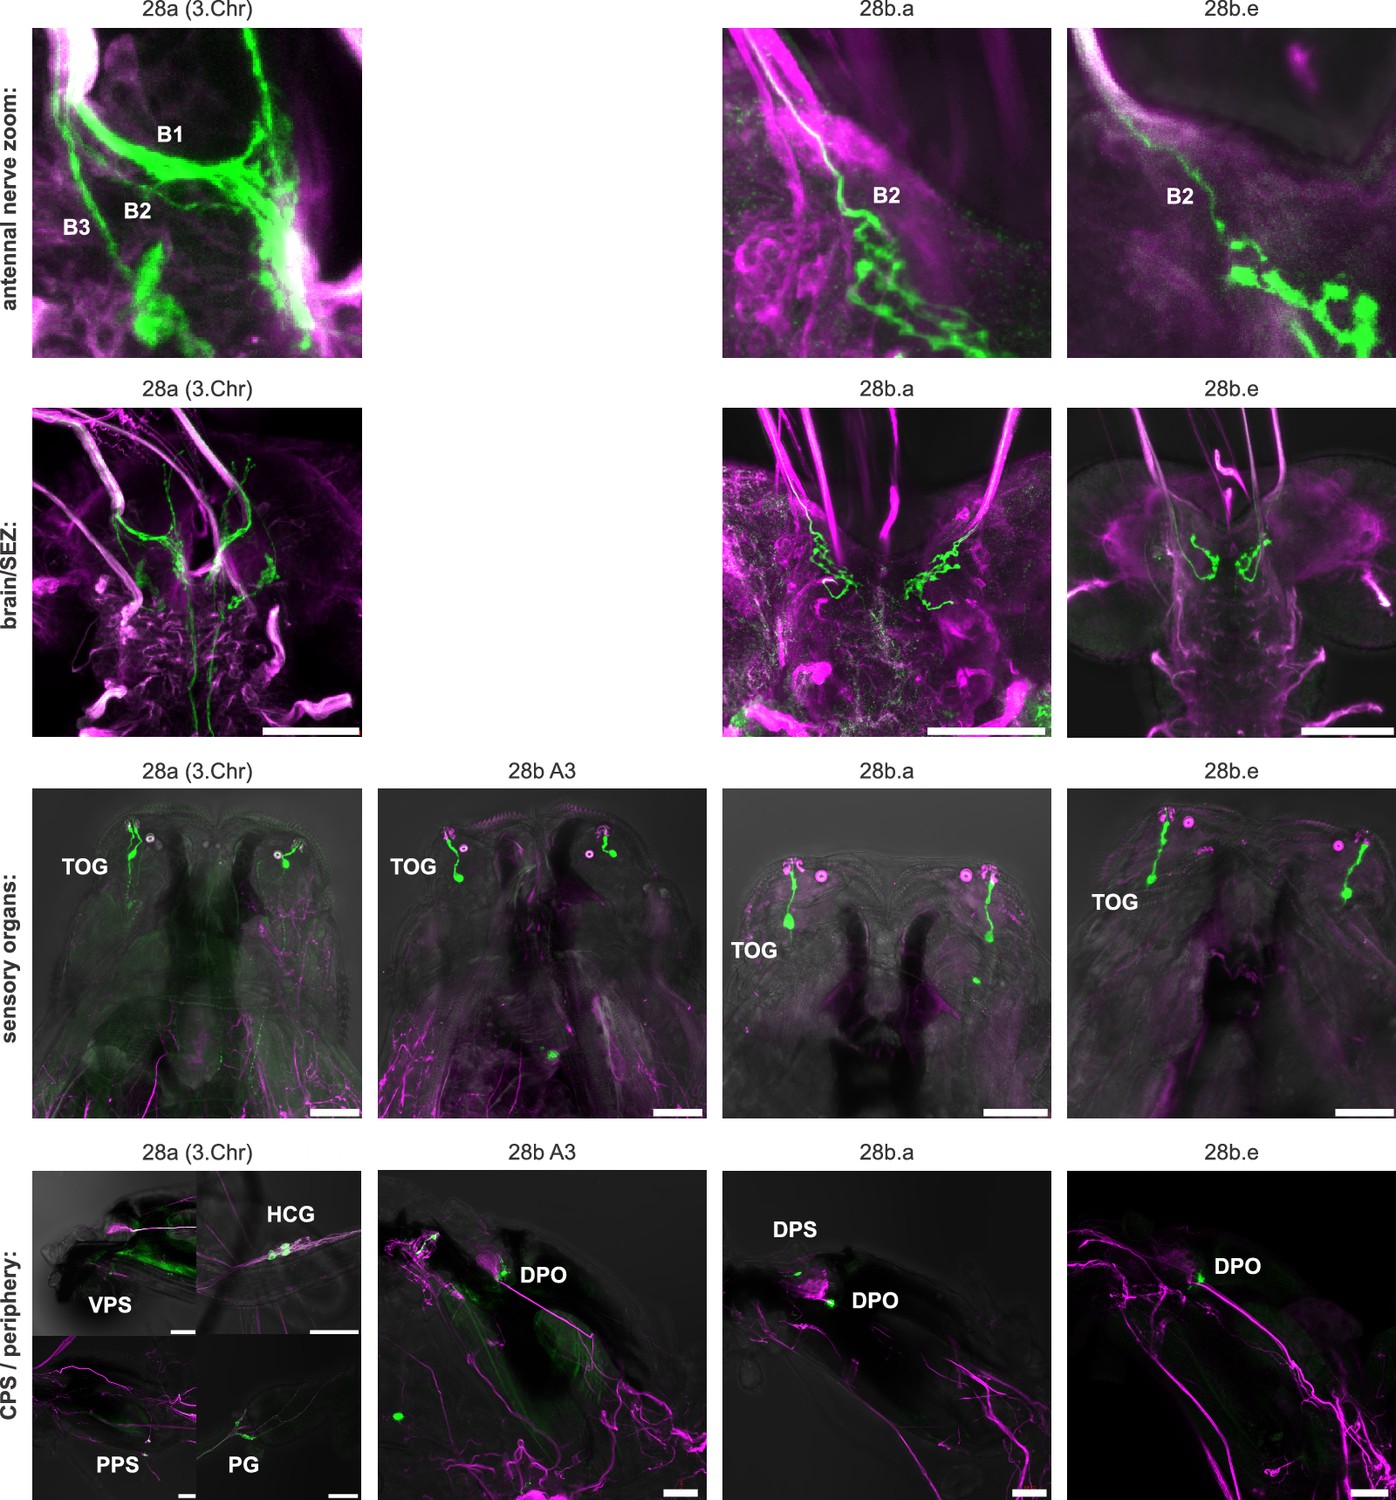
Figure 5—figure supplement 1
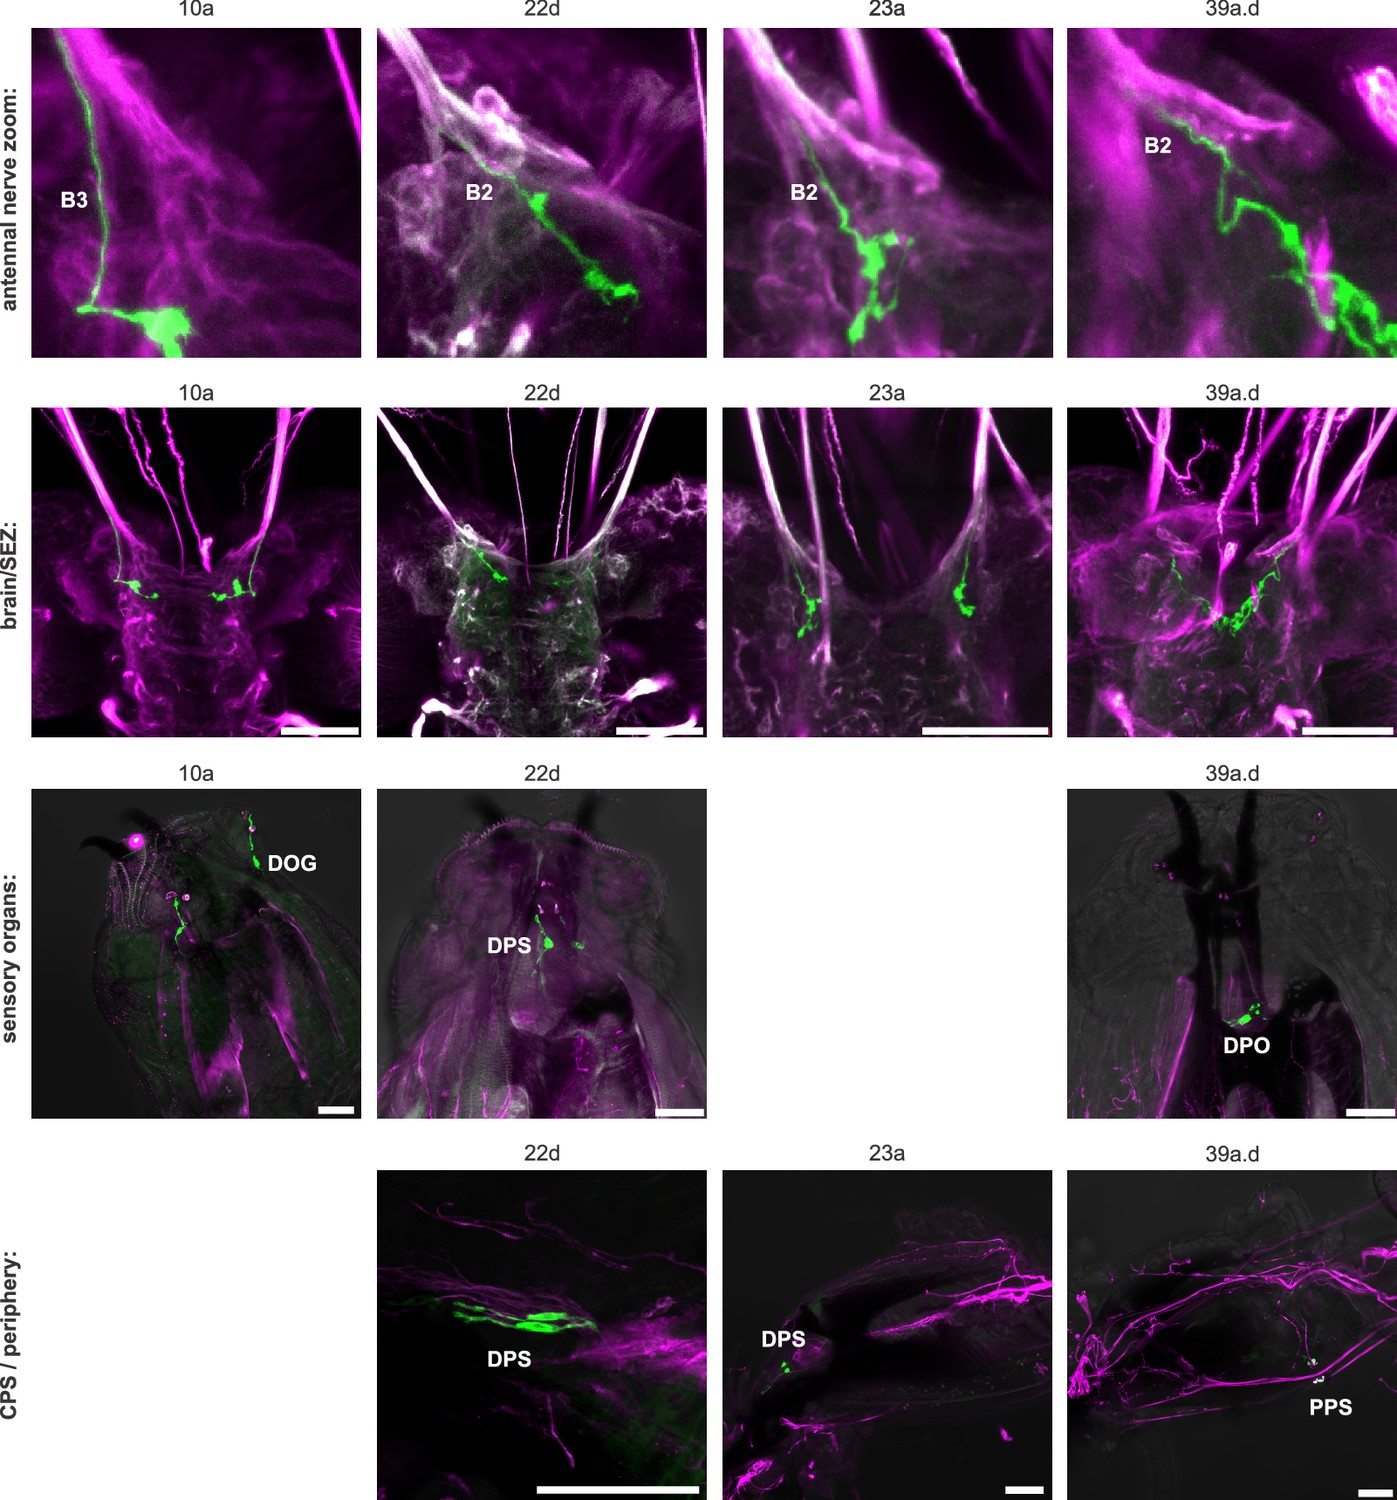
Gustatory receptor expression.
Top row scale and all scale bars = 50 µm.
Figure 5—figure supplement 2
Gustatory receptor expression.
Top row scale and all scale bars = 50 µm.
Figure 5—figure supplement 3

Gustatory receptor expression.
Top row scale and all scale bars = 50 µm.
Figure 5—figure supplement 4
Gustatory receptor expression.
Top row scale and all scale bars = 50 µm.
Figure 5—figure supplement 5
Gustatory receptor expression.
Top row scale and all scale bars = 50 µm.
Figure 5—figure supplement 6
Gustatory receptor expression.
Top row scale and all scale bars = 50 µm.
Figure 5—figure supplement 7
Gustatory receptor expression.
Top row scale and all scale bars = 50 µm.
Figure 5—figure supplement 8

Gustatory receptor expression.
Top row scale and all scale bars = 50 µm.
Figure 5—figure supplement 9
Gustatory receptor expression.
Top row scale and all scale bars = 50 µm.
Figure 6

Multisynaptic sensory inputs onto mushroom body circuits.
(A) Schematic of major monosynaptic routes (top panel). Connectivity between presynaptic sensory neurons (ACa, AVa and AVp) and postsynaptic outputs (mNSCs, Se0ens, Se0ph and PMNs). Schematic of multisynaptic routes to the mushroom body (middle panel). Connectivity between presynaptic sensory neurons (antennal lobe, ACal, ACp, ACpl) and postsynaptic projection neurons to the calyx (PNs to KCs). EM reconstruction of respective neurons (lower panel); Left: sensory neurons (olfactory receptor neurons are excluded) are color-coded based on total number of synapses to the projection neurons. Right: projection neurons are color-coded based on total number of synapses from sensory neurons. Lateral views show neurons of the right brain hemisphere. (B) Adjacency matrix showing sensory-to-PN connectivity, color-coded by percentage of inputs on PN dendrites. Or35a-PN is essentially the only olfactory projection neuron that receives multisensory input from non-olfactory receptor neurons of the ACp (primary gustatory center). (C) Left: percentage of presynapses of sensory neurons to PNs. Right: percentage of postsynapses of PNs from sensory neurons.
Figure 7 with 5 supplements
Integration of polysynaptic connections onto monosynaptic circuits.
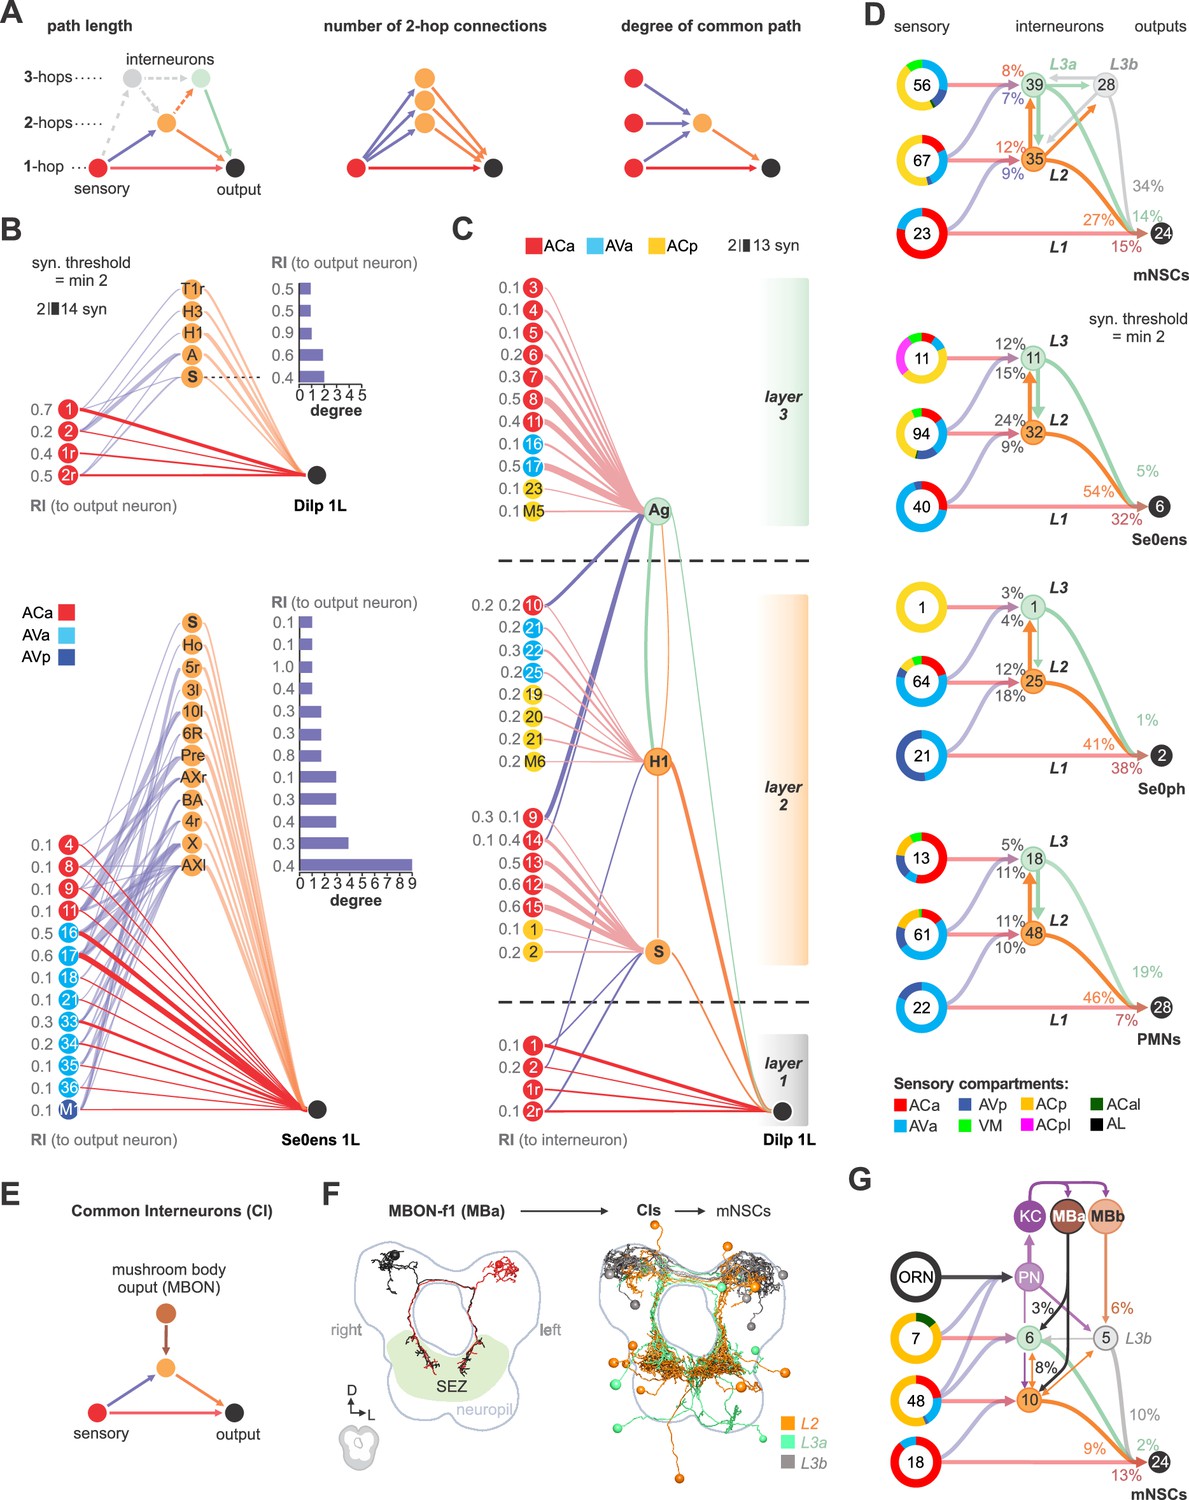
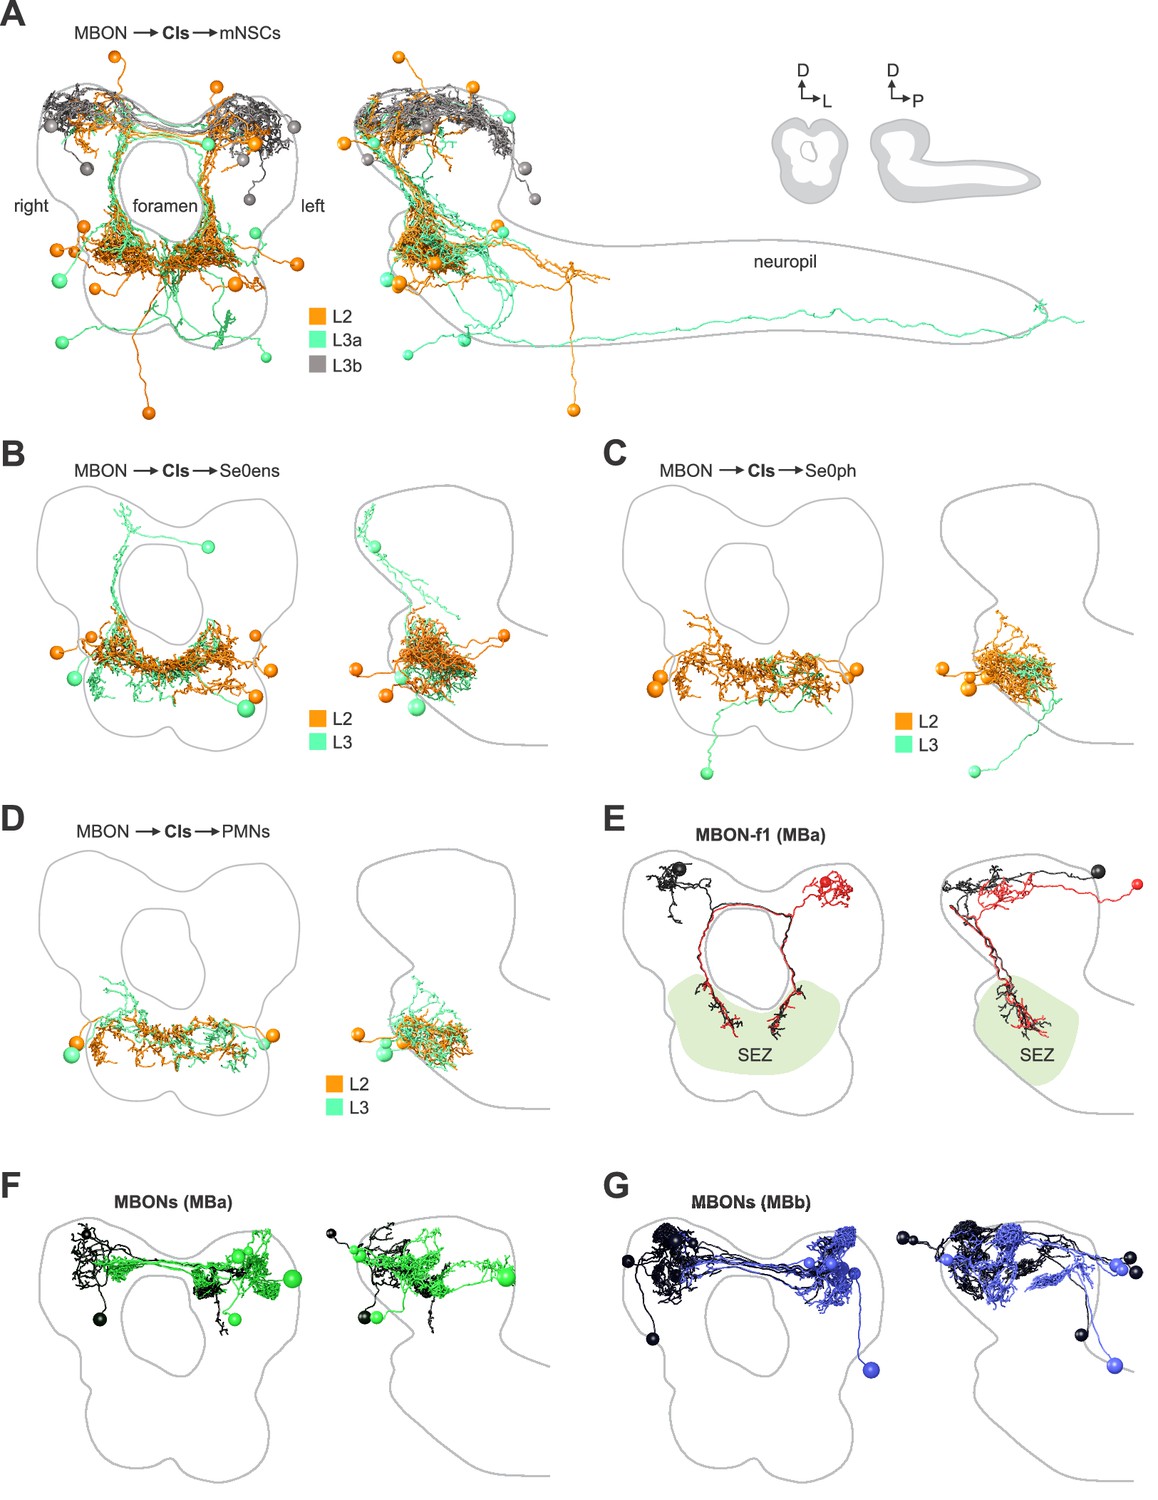
(A) Left panel: Illustration of direct (1-hop) sensory to output neuron connections and indirect (2-hop, 3-hop) paths which involve 1 or 2 interneurons to reach the same output neuron. 3-hop connections through interneurons which are not part of the direct upstream of the output neurons were not considered. Middle panel: Illustration of sensory divergence, which defines the number of possible paths to reach the same target neuron through different interneurons. Right panel: Illustration of sensory convergence, which defines how often (degree) a common path is used by different sensory neurons to reach the same output neuron. (B) Upper panel: All 1- and 2-hop connections for one cell of the Dilp cluster of neurosecretory output cells (Dilps, DMS and DH44), using a synaptic threshold of 2. Lower panel: All 1- and 2-hop connections for one cell of the Se0 cluster, using a synaptic threshold of 2. Ranking index (RI) shows the relative synaptic strength of every connection compared to the total synaptic input of the output neuron (1.0 represents the highest from all possible inputs to the output neuron). (C) Superimposition of selected 2- and 3-hop paths. Layer 1 shows a basic sensory-to-Dilp circuit. Layer 2 represents alternative paths through directly (2-hop) connected interneurons (‘S’ and ‘H1/HuginPC left 1’) and their sensory inputs, using a synaptic threshold of 2. Both interneurons integrate a completely different set of sensory neurons from different sensory compartments to connect onto the basic sensory-to-Dilp circuit. Layer 3 represents paths through indirectly connected interneurons (‘Ag’) and their sensory inputs, using a synaptic threshold of 2. This interneuron receives sensory information from layer 2 and also integrates a completely different set of sensory neurons onto the basic sensory-to-Dilp circuit. Ranking index (RI) shows the relative synaptic strength of every sensory-to-interneuron connection compared to the total synaptic input of the interneurons. (D) Summarizing representation of all monosynaptic sensory-to-output connections (grouped targets: mNSCs, Se0ens, Se0ph and PMNs), and their alternative paths through interneurons to reach one cell of the target group, using a synaptic threshold of 2. Note that nearly all alternative paths (interneurons) of layer 2 and 3 (L2, L3) receive monosynaptic input from other sensory neurons (synaptic threshold = 2), thus integrating a completely different set of sensory neurons onto the basic reflex circuits. For mNSCs: Layer 3 is divided into interneurons which receive monosynaptic sensory inputs (L3a) and those which do not receive monosynaptic input from any sensory neuron (L3b), Figure 7—figure supplement 2B). Percentages represent fraction of synapses from upstream neurons (arrows). Numbers within circles represent number of neurons. Percentage sensory composition (the three left donut circles) is shown by sensory compartment. See Figure 7—figure supplements 1–3 for detailed connectivity and path numbers. (E) Illustration of direct (1-hop) sensory to output neuron connections and indirect (2-hop) paths which connect mushroom body output neurons (MBONs) to reach the same output neuron, thus representing final common interneurons (CI) (F) Left: EM reconstruction of MBON-f1 (part of MBa, Figure 7—figure supplement 4A,D) which is the only MBON with projections to the SEZ. Right: EM reconstruction of all presynaptic interneurons to the mNSCs that also receive monosynaptic contacts from MBONs (synaptic threshold = 2). Interneurons are color coded based on mNSC path layers (L2, L3a, L3b) (G) Summarizing representation of all common interneurons to mNSCs that receive monosynaptic input from MBONs. MBONs are divided into two groups. MBa, which synapses onto interneurons (L3a) that receive monosynaptic contacts from sensory neurons and MBb, which synapses onto interneurons (L3b) that do not integrate sensory information onto the basic sensory-to-mNSC circuit. Note that projection neurons to the mushroom body calyx (PN, KC, Figure 7) also act as part of 3-hop paths from layer 2 and layer 3 sensory neurons to the mNSCs. Percentages represent fraction of synapses from MBONs to CIs and CIs to mNSCs. Numbers within circles represent number of neurons. Percentage sensory composition (the four left donut circles) is shown by sensory compartment. Exclusive sensory-to-output connections are not shown See Figure 7—figure supplements 4–5 for detailed connectivity and neuroanatomy.
Figure 7—figure supplement 1
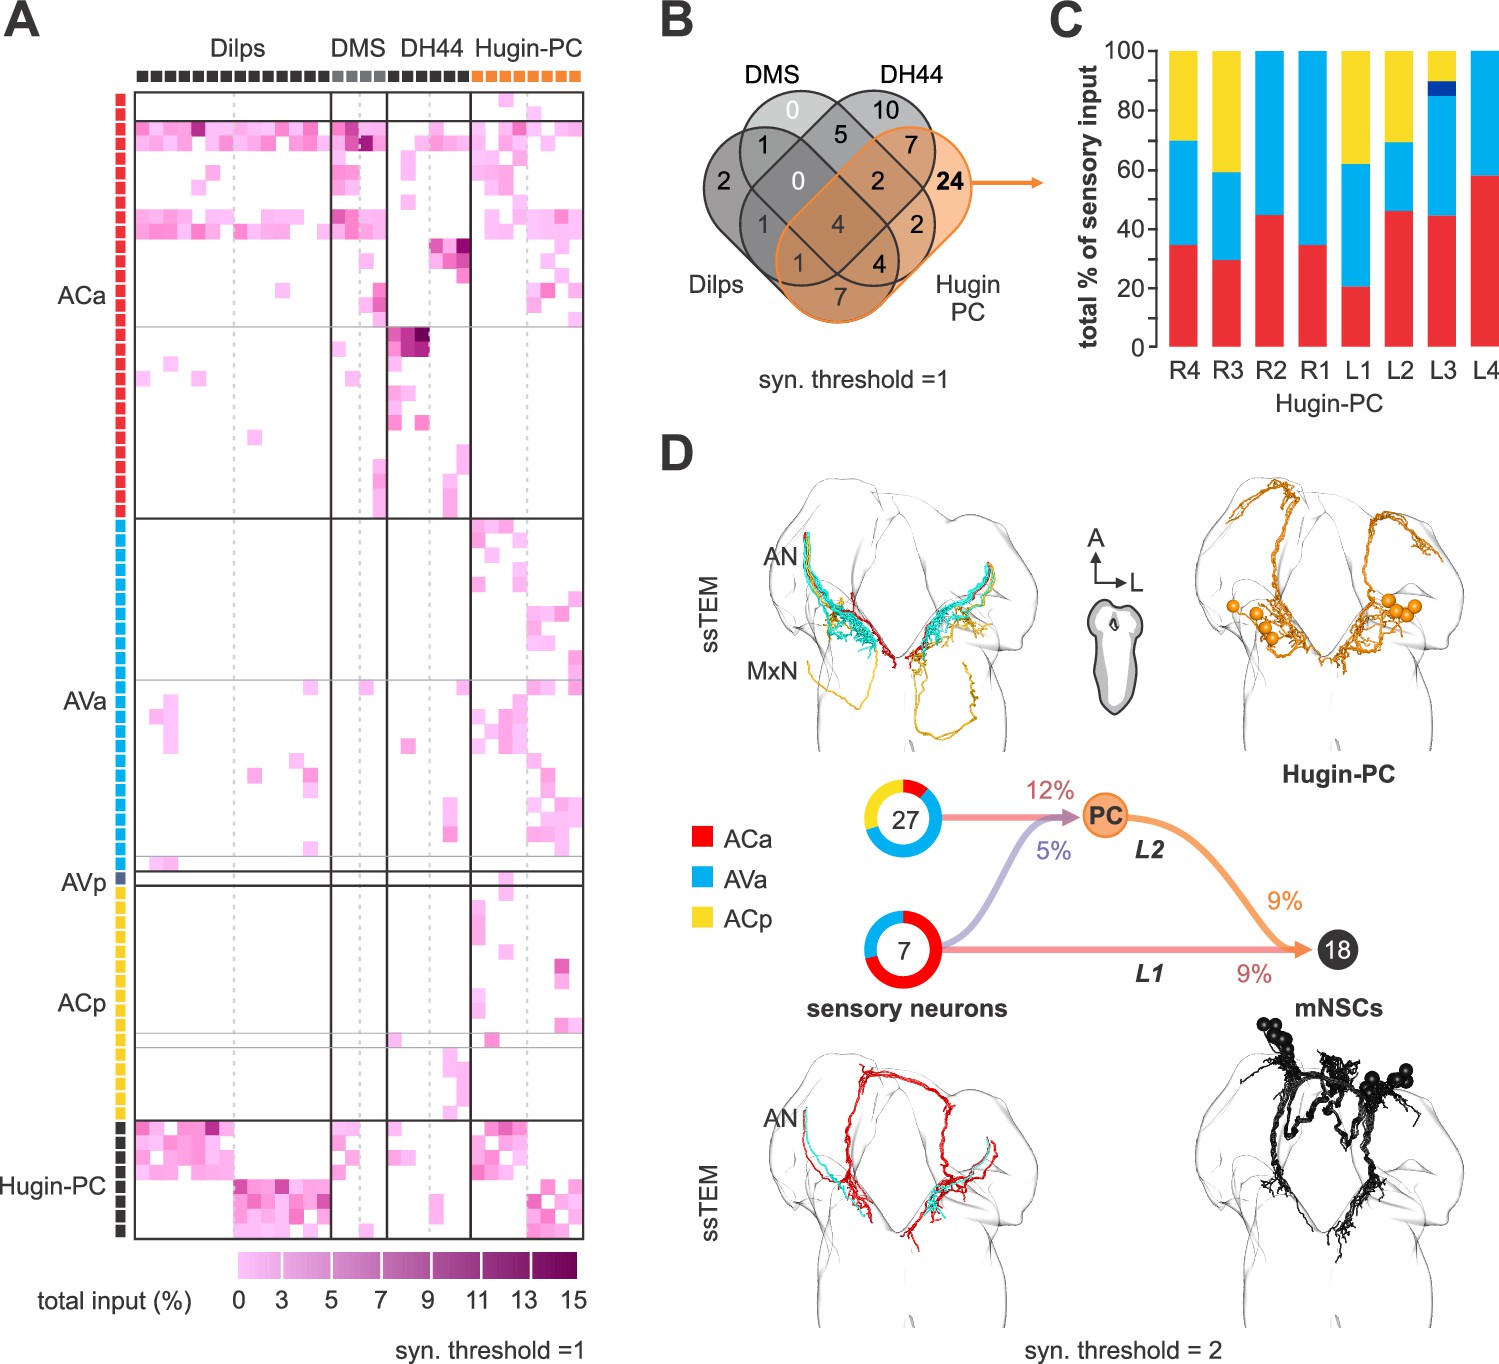
Connectivity between presynaptic sensory neurons of mNSCs and huginPC neurons.
(A) Adjacency matrix showing sensory-to-mNSCs and huginPC connectivity, color-coded by percentage of inputs on mNSC and huginPC dendrites. Sensory neurons are ordered based on synapse similarity score (sensory compartments, Figure 2); they are listed based on their connectivity patterns to their targets. Dotted lines separate left and ride targets. (B) Venn diagram shows overlaps and differences between presynaptic sensory neurons of the different target groups. (C) Sensory profile of each individual huginPC neuron. On average 80% of the total incoming synaptic load from sensory neurons made by enteric sensory neurons, and 20% by pharyngeal and external sensory neurons. (D) Summarizing representation of all seven monosynaptic sensory-to-mNSCs paths, which concurrently use huginPC neurons as an alternative route to target the mNSCs using a synaptic threshold of 2. HuginPC neurons receive sensory information from 27 other sensory neurons, thus integrating a completely different set of sensory neurons onto a basic reflex circuit. Figure shows EM reconstructions of respective neuron groups.
Figure 7—figure supplement 2
Connectivity of interneurons within the feeding circuits.
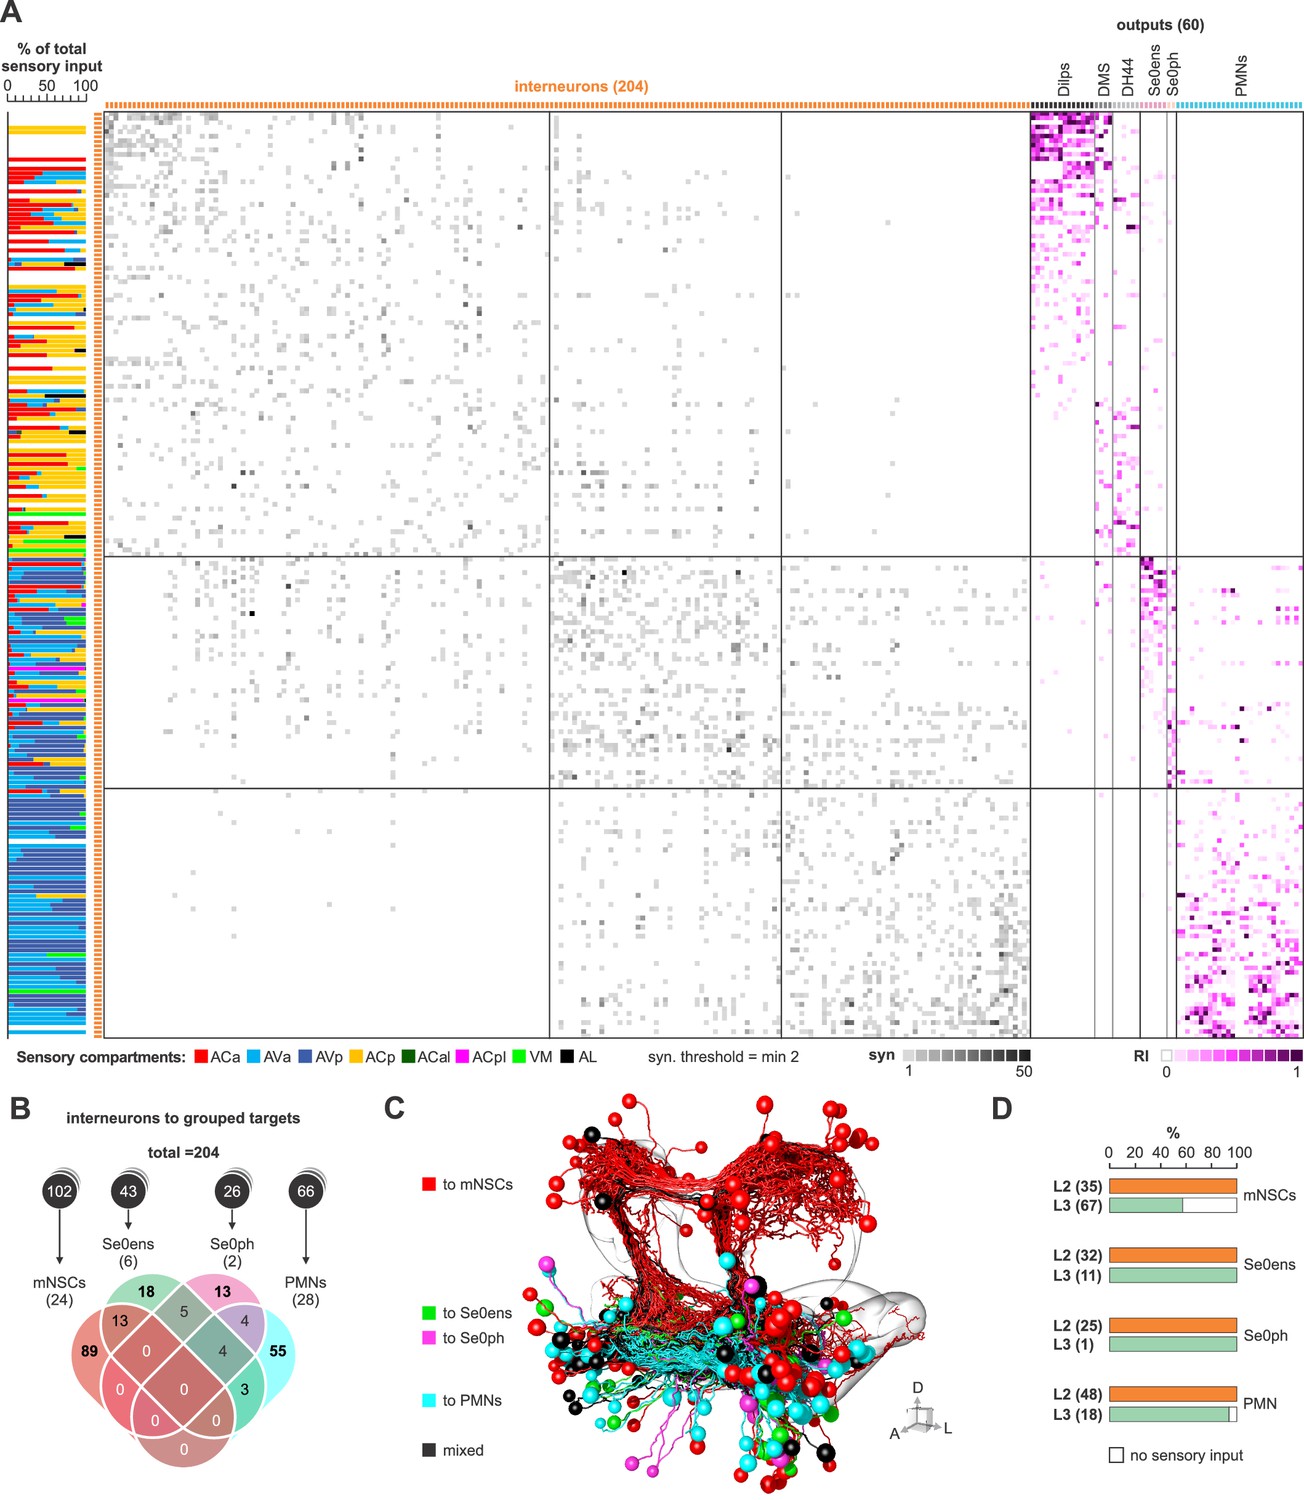
(A) Adjacency matrix showing all 204 ‘layer 2’ - and ‘layer 3’ interneurons, their sensory input and their connections to mNSCs, Se0ens, Se0ph and PMNs. Left panel represents the percentage sensory composition (as shown by sensory compartments) of the total sensory input of each interneuron. Interneuron-to-interneuron connections (orange): each entry represents the number of synapses from a row neuron to a column neuron. Interneurons are arranged by their connectivity to the output target groups. Ranking index (RI) for interneuron-to-output connections shows the relative synaptic strength of every connection compared to the total synaptic input of a single output neuron (1.0 represents the highest from all possible inputs to the output neuron). (B) Venn diagram shows overlap and difference between presynaptic interneurons of the different target groups. (C) EM reconstruction of all interneurons that act as paths to the different output neuron classes. Neurons are color coded based on their output targets. (D) Percentage of different interneurons (2- and 3-hop paths) to respective output neuron classes receiving sensory input. Interneurons are divided into two groups. Layer 2 represents interneurons that act as alternative paths (2-hop) for basic sensory-to-output circuits using a synaptic threshold of 2. Layer 3 represents indirectly connected interneurons which are part of 3-hop paths to connect onto the basic sensory-to-output circuits using a synaptic threshold of 2. Note that, just for the case of L3-interneurons to mNSCs, 40% do not receive monosynaptic connections from any sensory neuron (‘L3b’; as opposed to those which do, ‘L3a’ in Figure 7).
Figure 7—figure supplement 3
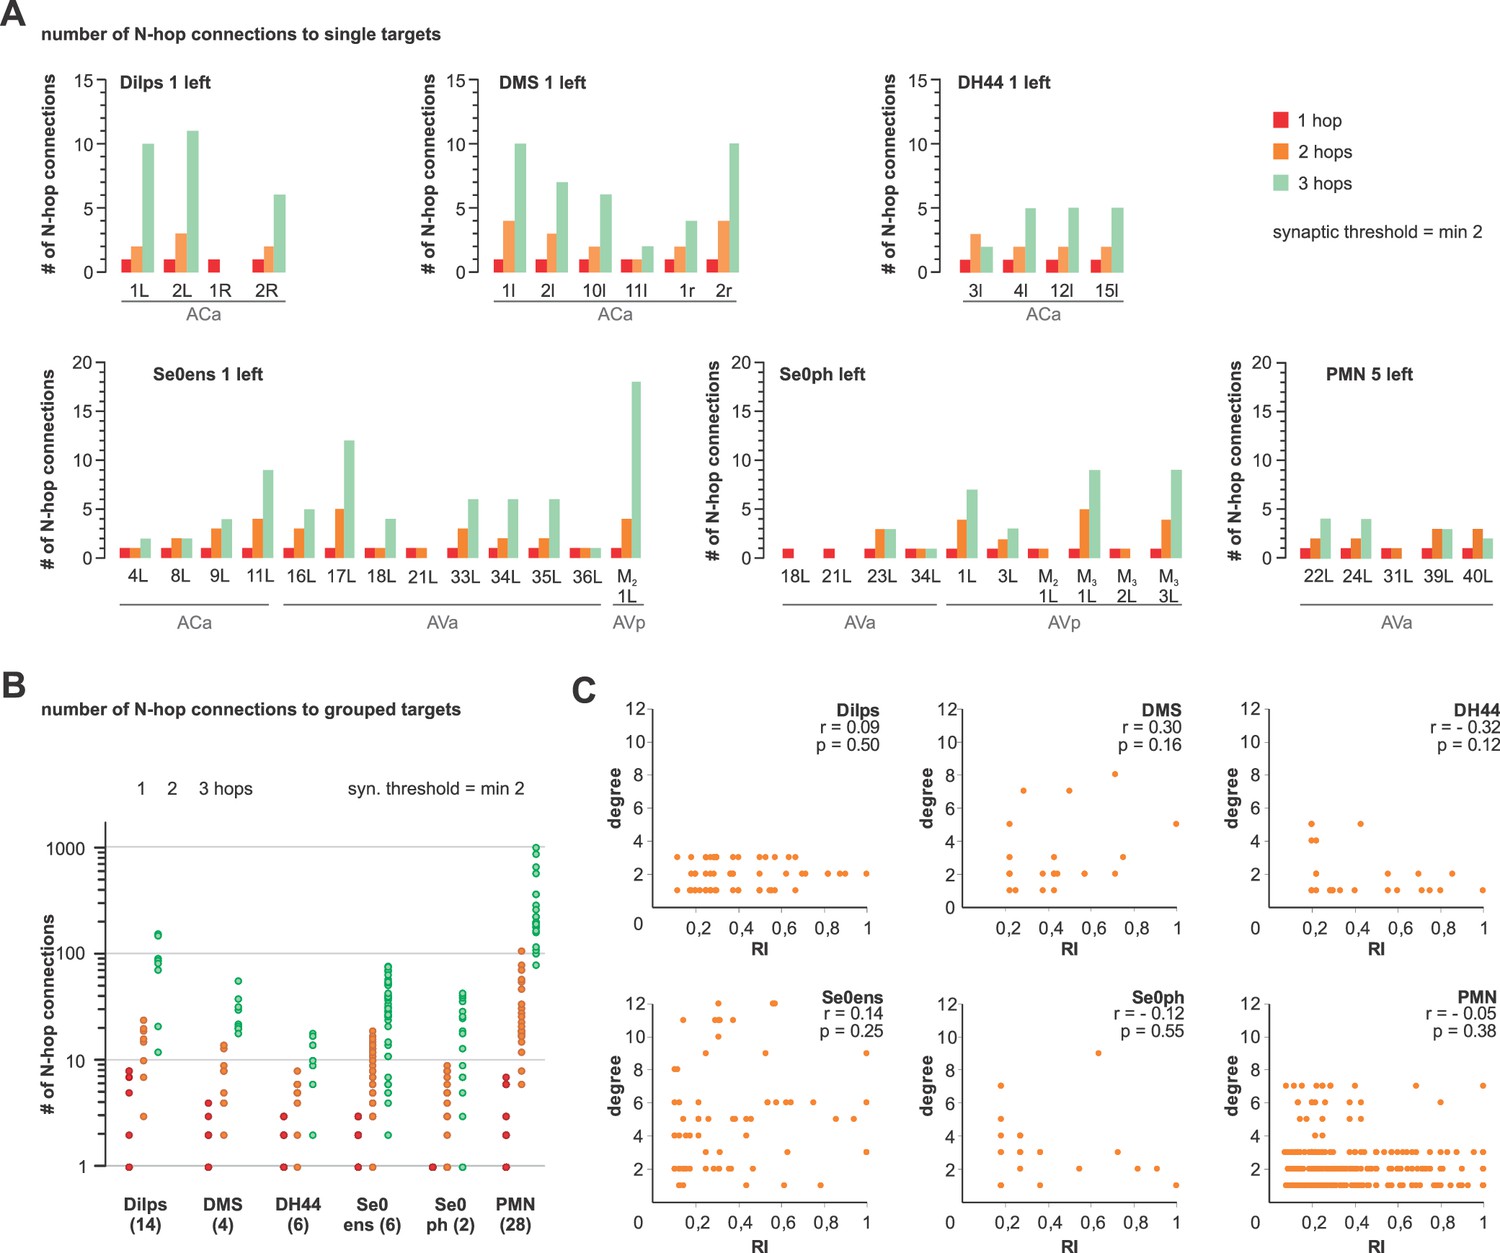
Quantification of alternative paths onto output neurons.
(A) Number of alternative N-hop connections for each monosynaptic sensory-to-target connection. Paths are calculated for one cell from each of the output neuron clusters. (B) Number of alternative N-hop connections for each monosynaptic sensory-to-target connection. Paths are calculated for grouped targets. Paths to PMNs are calculated based on a to 70% reconstructed CNS. (C) Relationship between degree and ranking index of the different presynaptic interneurons of the different target groups. r = Pearson’s r, p=p value.
Figure 7—figure supplement 4
Connectivity of mushroom body output neurons onto the feeding circuits.
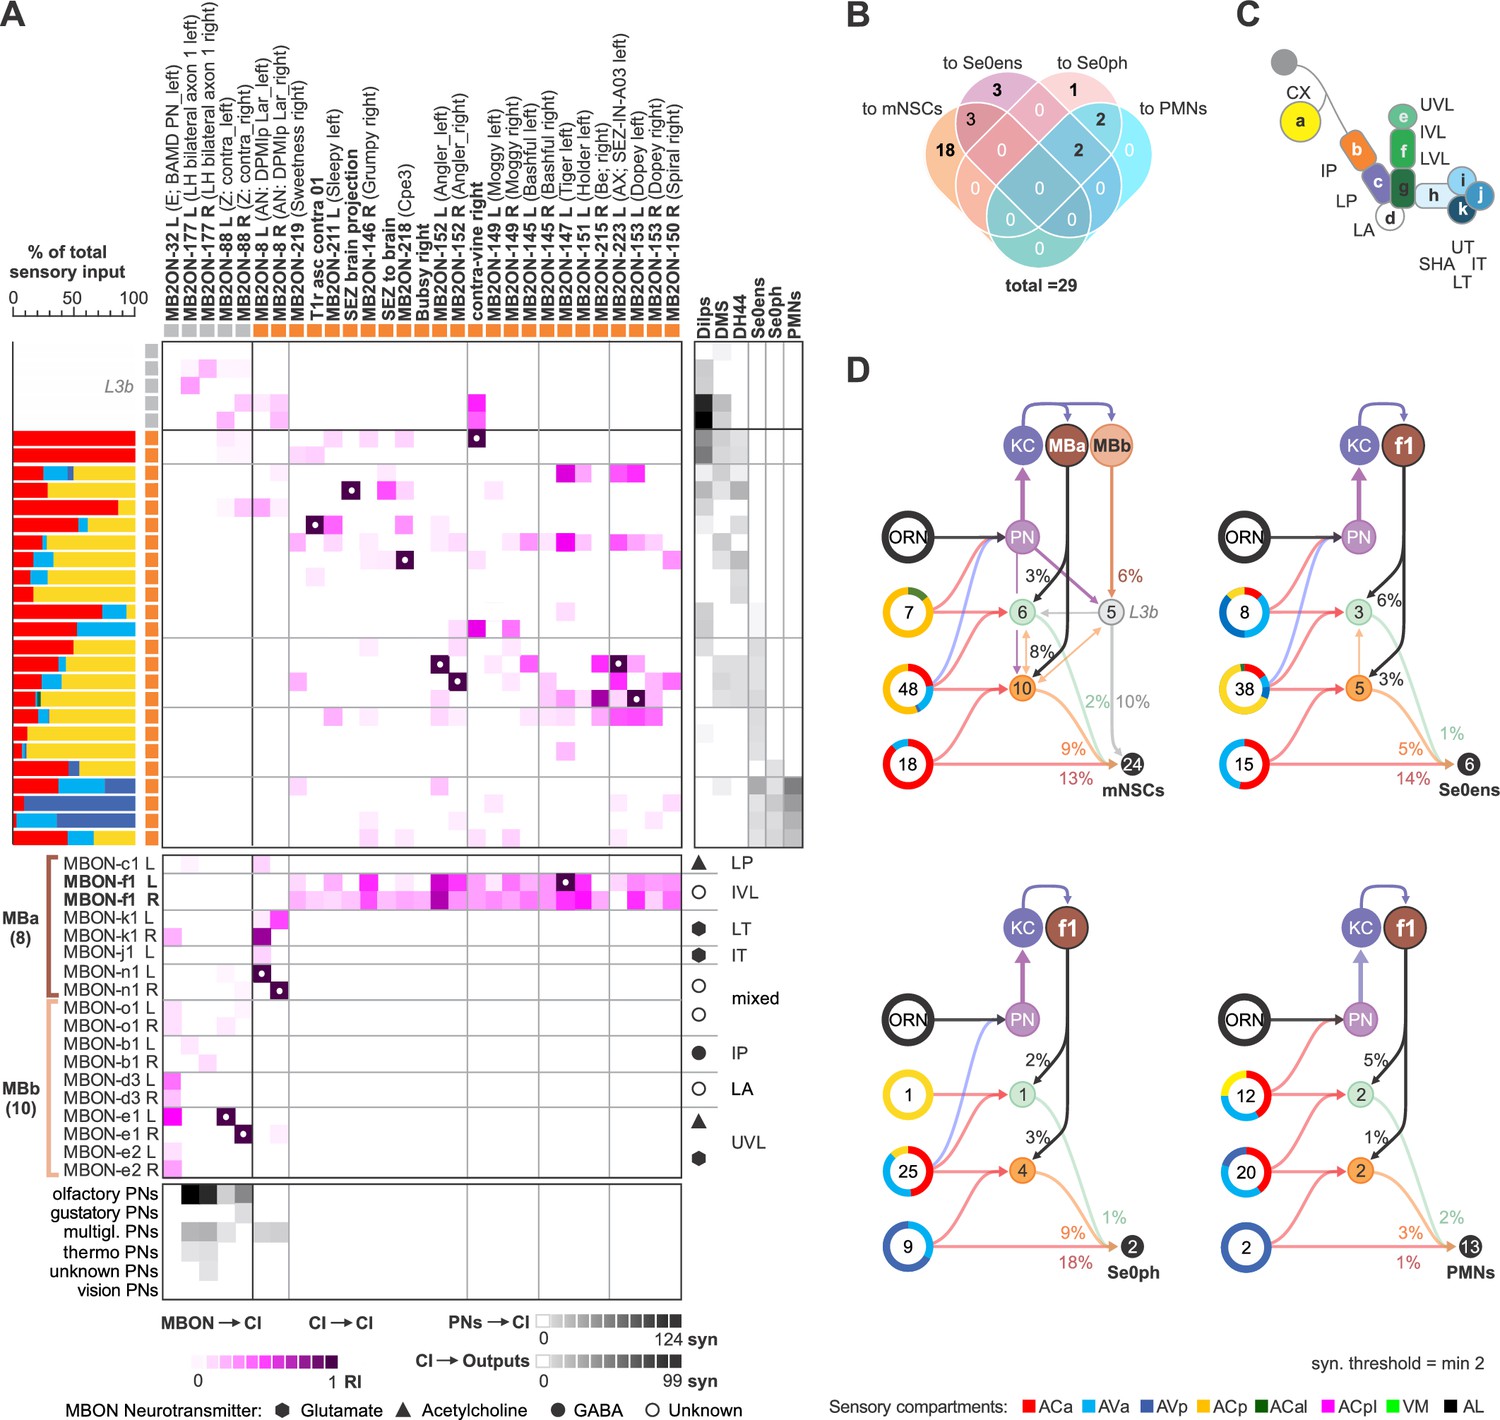
(A) Connectivity matrix showing connections between projection neurons to the MB calyx (PNs), mushroom body output neurons (MBONs), common interneurons (CI) and output neurons (mNSCs, Se0ens, Se0ph and PMNs). Left panel represents the percentage sensory composition (shown by sensory compartment) of the total sensory input of each CI. 5 of the CIs (L3b) do not receive monosynaptic contacts from sensory neurons. Each entry for MBON-to-CI and CI-to-CI connections represents the ranking index (RI). Ranking index (RI) shows the relative synaptic strength of every connection compared to the total synaptic input of a single interneuron. Each entry for PN-to-CI and CI-to-output connections represents the number of synapses from a row to a column neuron. CIs are arranged by their connectivity to the output target groups. MBONs are divided into two groups: MBa, 8 MBONs which primarily synapse onto interneurons that receive monosynaptic contacts from sensory neurons and MBb, 10 MBONs which synapse onto interneurons that do not receive monosynaptic sensory input. (B) Venn diagram shows overlap and difference between presynaptic common interneurons of the different target groups. (C) Schematic of the different larval mushroom body compartments. Calyx (CX), intermediate and lower peduncle (IP, LP), lateral appendix (LA), upper, intermediate and lower peduncle (UVL, IVL, LVL), shaft, upper, intermediate and lower toe of the medial lobe (SHA, UT, IT, LT) (Eichler et al., 2017; Saumweber et al., 2018). These abbreviations are used in (A). (D) Summarizing representation of all common interneurons to mNSCs, Se0ens, Se0ph and PMNs that receive monosynaptic input from MBONs. Exclusive sensory-to-output connections are not shown. Note that the PNs to the calyx (PN) also act as part of 3-hop paths from layer 2 and layer 3 sensory neurons to the mNSCs. The MBON-f1 (IVL) connects to a wide range of interneurons that essentially target all feeding output neurons. Percentages represent fraction of synapses from MBONs to CIs and CIs to outputs. Numbers within circles represent number of neurons. Percentage sensory composition (the four left donut circles) is shown by sensory compartment.
Figure 7—figure supplement 5
EM reconstruction of common interneurons.
(A,B,C,D) EM reconstruction of all common interneurons (CIs) to mNSCs, Se0ens, Se0ph and PMNs that receive monosynaptic input from MBONs. Neurons are color coded based on path layers to respective output neurons. (E,F,G) EM reconstruction of all MBONs which target interneurons that connect to the feeding output neurons. Note that MBON-f1 is the only MBON with projections to the SEZ. MBONs are divided into two groups. MBa, which primarily synapses onto interneurons that receive monosynaptic contacts from sensory neurons and MBb, which synapses onto interneurons that do not receive monosynaptic sensory input.
Figure 8
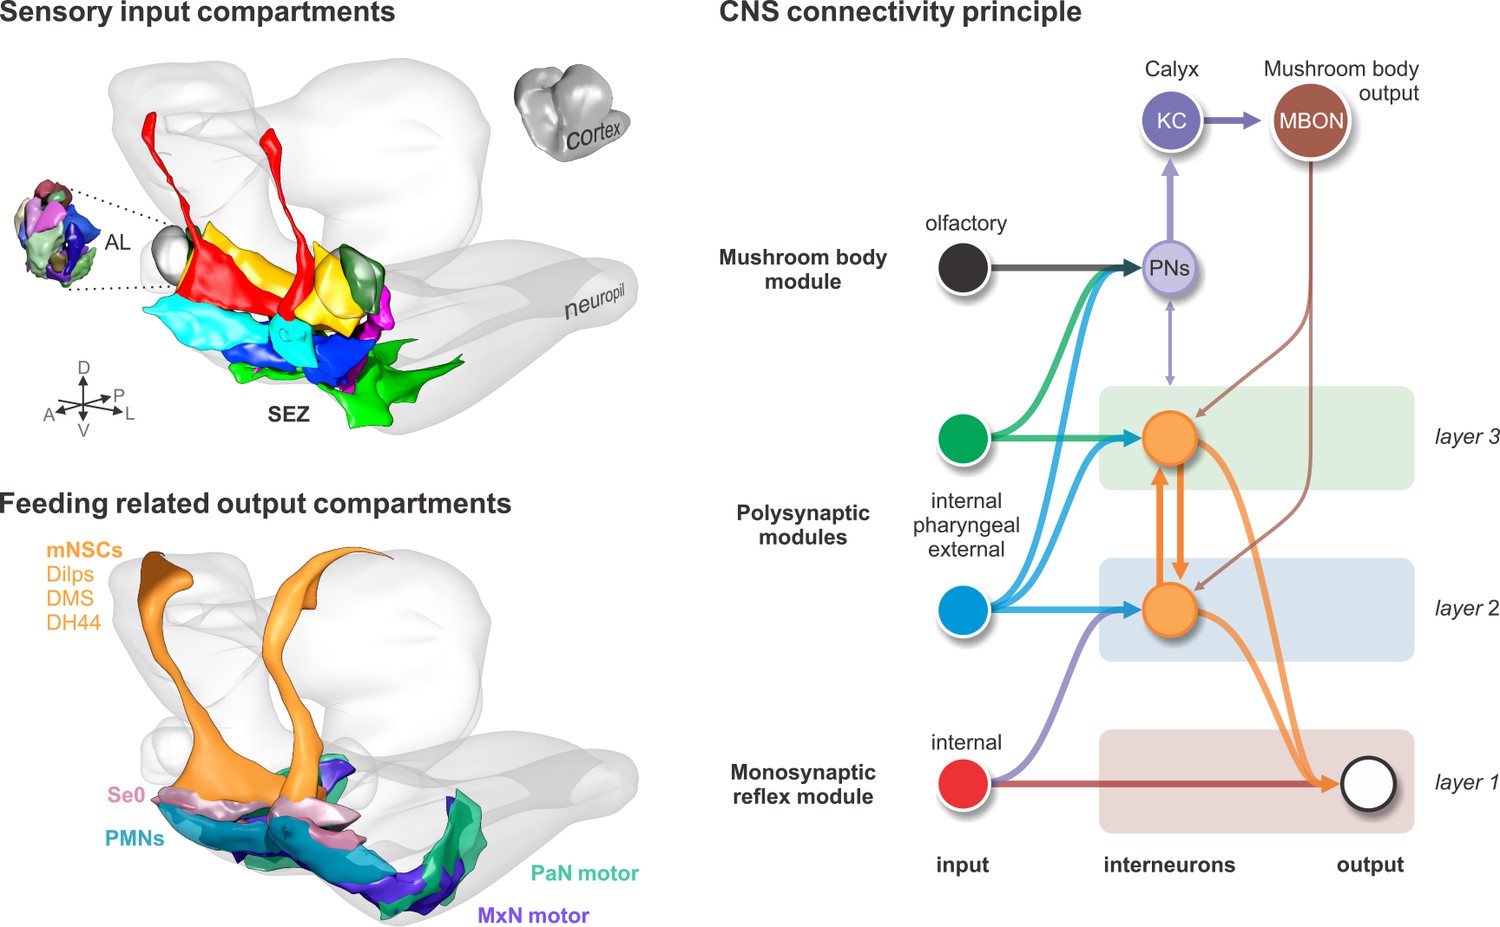
Input-output synaptic organization of the larval feeding system and its connectivity architecture in the brain.
Sensory input compartments: Glomerular compartmentalization of the larval antennal lobe (AL) compared to glomerular-like compartmentalization of the subesophageal zone (SEZ). Non-overlapping digital 3D model delineates compartments based on synapse similarity score. Feeding related output compartments: 3D model summarizes the synaptic compartments of median neurosecretory cells (mNSCs), modulatory serotonergic output neurons (Se0) and feeding motor neurons (PMNs, MxN motor and PaN motor). CNS connectivity principle: Different polysynaptic modules are integrated onto existing monosynaptic circuits, or added separately as new multisynaptic circuits, for example the mushroom body module.
Additional files
-
Supplementary file 1
PDF Neuron Atlas – Morphology and connectivity of reconstructed neurons.
Reconstructions of antennal nerve (AN) sensory neurons, maxillary nerve (MxN) sensory neurons, prothoracic accessory nerve (PaN) sensory neurons, serotonergic modulatory output neurons (Se0), pharyngeal motor neurons (PMN/e .g. AN-L-motor-05), maxillary nerve motor neurons (MxN motor) and prothoracic accessory nerve motor neurons (PaN motor). A dorsal view of each neuron is shown on the left, and a lateral view on the right. Neuron IDs (e.g. ‘123456’) and names (e.g. AN-L-Sens-B1-Aca-01) are provided. Digital 3D model of the neuropil is shown in grey. 3D models of synaptic input and output compartments are colored based on Figure 2. Outline of the nervous system is not shown. Table shows number of synapses of a given row neuron to a column neuron group. Column groups represent sensory neurons (ACa, AVa, AVp, ACal, ACp, ACpl, VM), neuroendocrine output neurons (Dilps, DMS, DH44), serotonergic modulatory output neurons (Se0ens, Se0ph), pharyngeal motor neurons (PMN), MxN motor neurons, PaN motor neurons and projection neurons to Kenyon cells (olfactory PNs, gustatory PNs, multiglomerular PNs, unknown PNs, thermo PNs, visual PNs).
- https://doi.org/10.7554/eLife.40247.042
-
Supplementary file 2
Connectivity of reconstructed neurons.
Adjacency matrix with the complete connectivity of sensory neurons of the pharyngeal nerves (ACa, AVa, AVp, ACal, ACp, ACpl, VM), neuroendocrine output neurons (Dilps, DMS, DH44), serotonergic modulatory output neurons (Se0ens, Se0ph), pharyngeal motor neurons (PMN), MxN motor neurons, PaN motor neurons, alternative path interneurons (Figure 7), mushroom body output neurons (MBONs, MBa, MBb, Figure 7—figure supplement 4) and projection neurons to Kenyon cells (olfactory PNs, gustatory PNs, multiglomerular PNs, unknown PNs, thermo PNs, visual PNs).
- https://doi.org/10.7554/eLife.40247.043
-
Transparent reporting form
- https://doi.org/10.7554/eLife.40247.044
Download links
A two-part list of links to download the article, or parts of the article, in various formats.
Downloads (link to download the article as PDF)
Open citations (links to open the citations from this article in various online reference manager services)
Cite this article (links to download the citations from this article in formats compatible with various reference manager tools)
Convergence of monosynaptic and polysynaptic sensory paths onto common motor outputs in a Drosophila feeding connectome
eLife 7:e40247.
https://doi.org/10.7554/eLife.40247


