Is it possible to reconstruct an accurate cell lineage using CRISPR recorders?
- University College London, United Kingdom
- École Normale Supérieure de Lyon, France
- Centre National de la Recherche Scientifique (CNRS), France
Figures
Figure 1
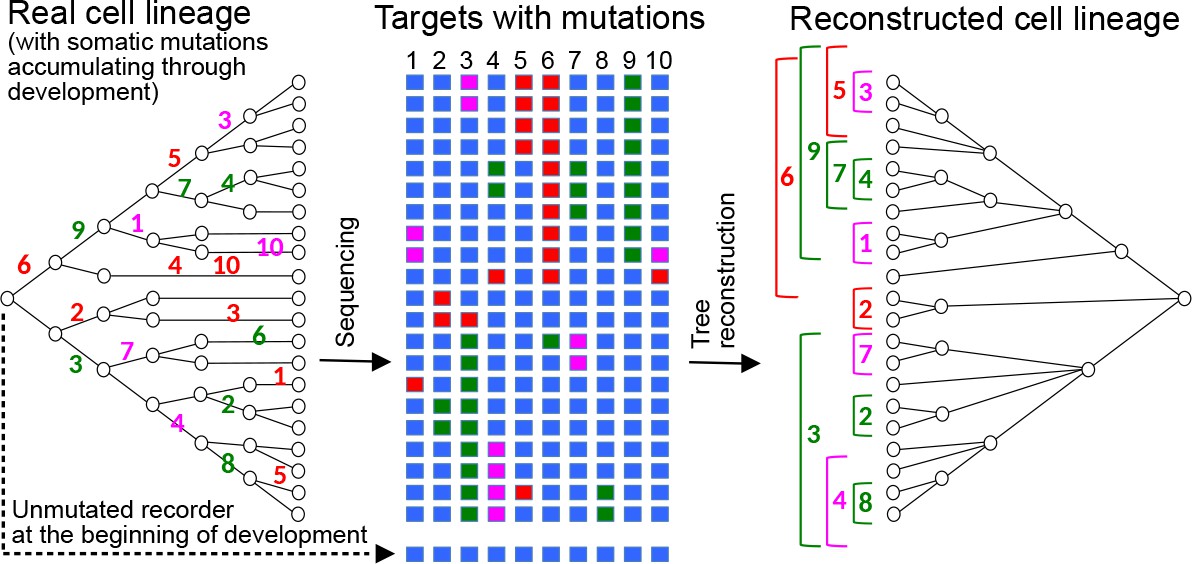
Reconstructing cell lineages using CRISPR-induced somatic mutations.
Left: Development begins with a zygote carrying in its genome a lineage recorder composed of a series of CRISPR targets (blue boxes). During subsequent cell divisions, any target of the recorder can be cleaved by Cas9 in any cell, leaving a specific mutational signature on the target which will be inherited by all the descendants of the cell. Numbers represent the the cleaved target in the recorder and its mutational signature is represented by a colour. Middle: At the end of development, the recorder of every cell is sequenced, recovering the pattern of accumulated mutations in each of the targets (coloured boxes). Right: The pattern of mutations is used to reconstruct the cell lineage, in a similar way to how a phylogenetic tree is inferred from the sequences of homologous genes.
Figure 2 with 1 supplement
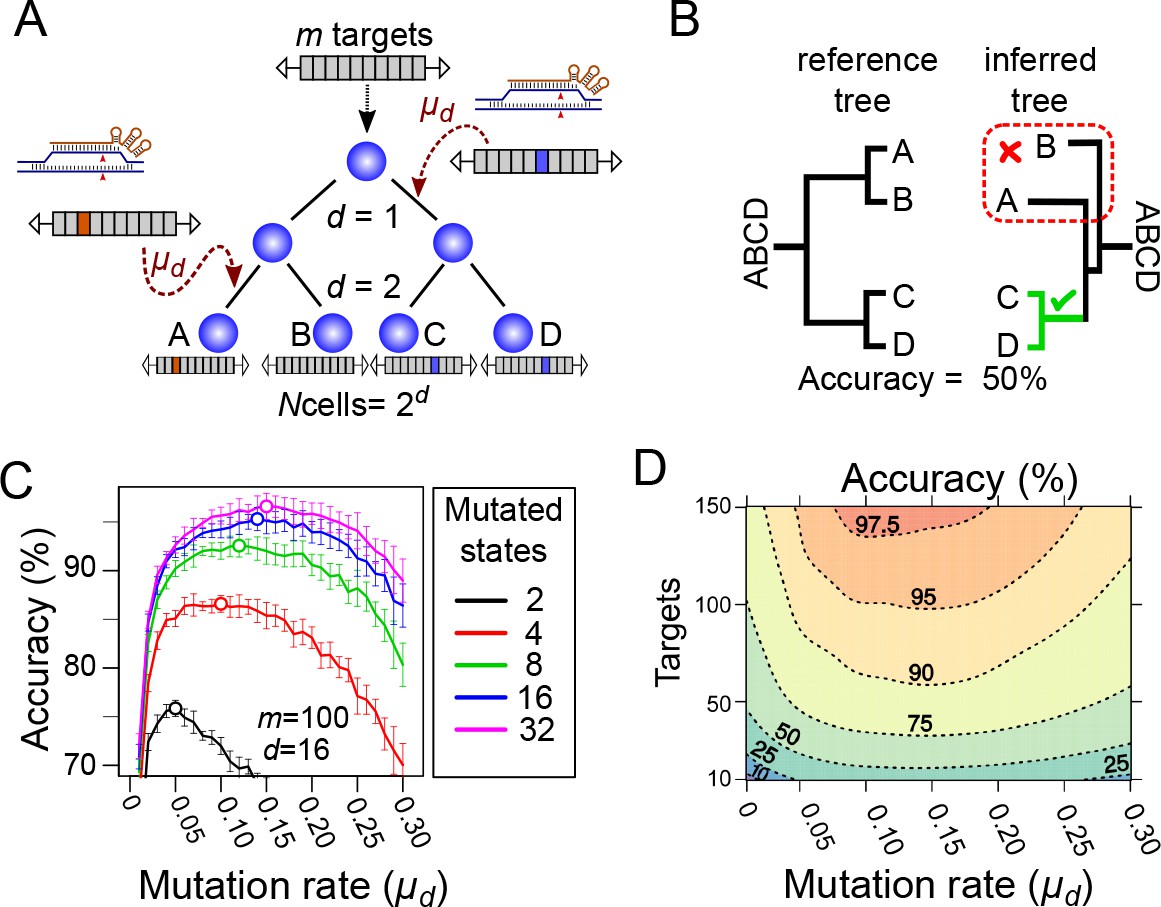
Computational simulation of CRISPR recorders (A).
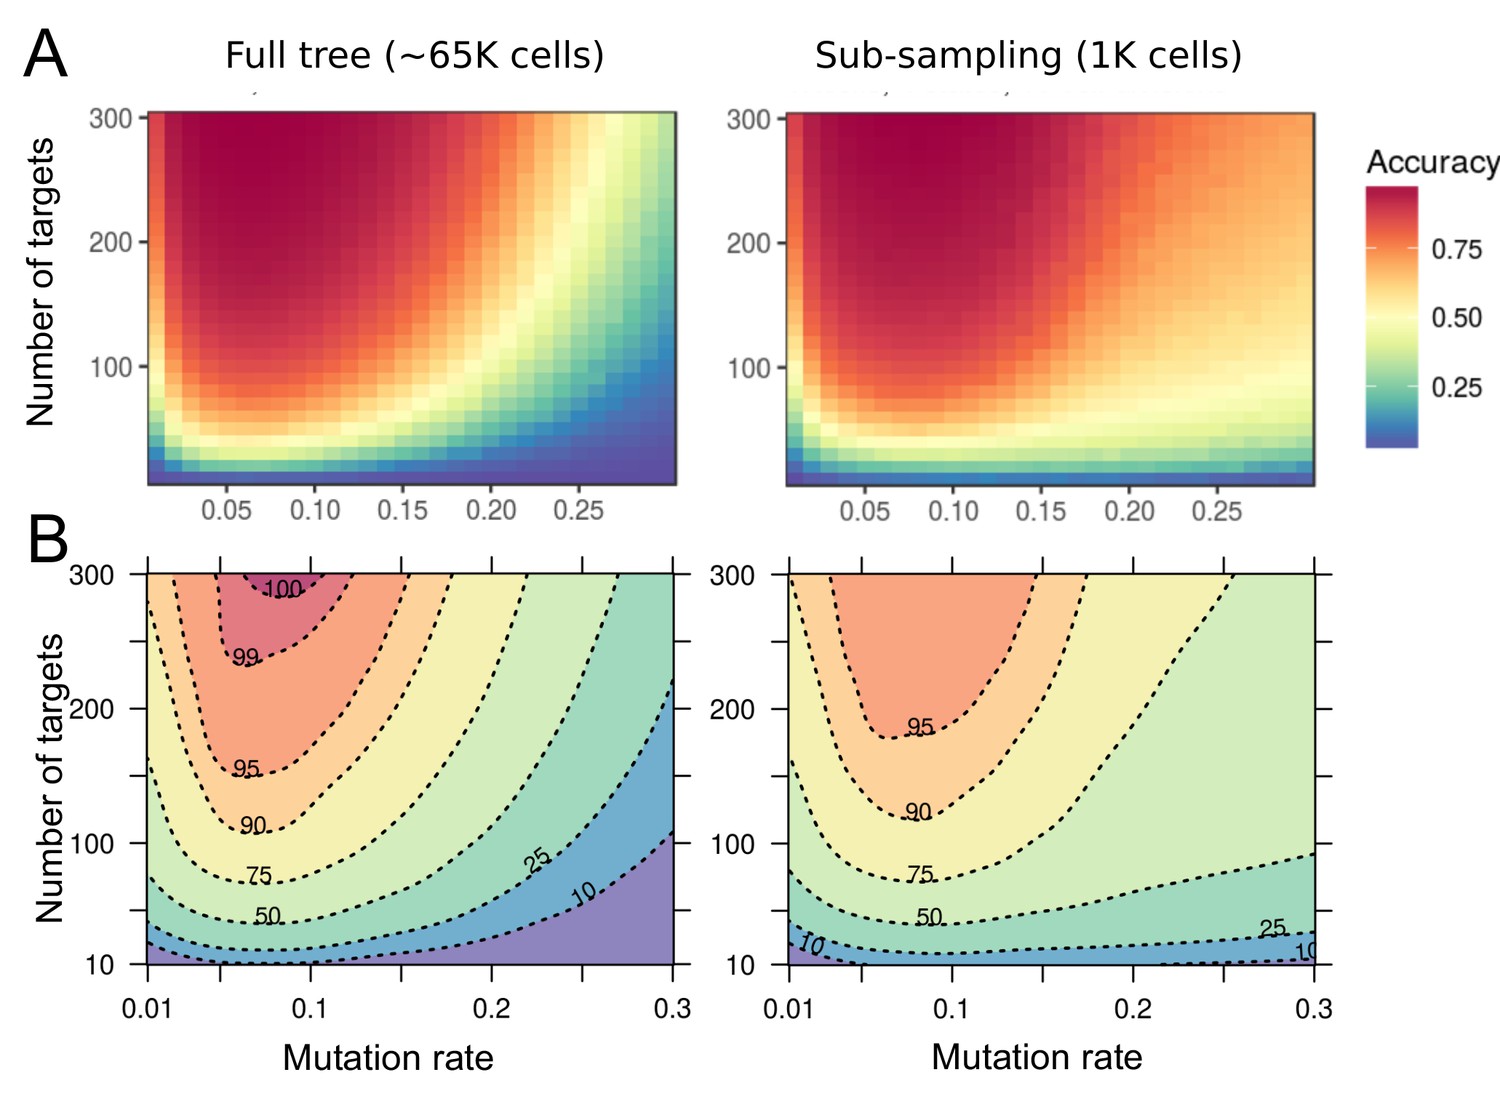
In our simulations, an initial cell with multiple CRISPR targets () yields cells after a given number of cell divisions (). The recorder accumulates independent CRISPR-induced mutations with a probability, in each target, of per cell division; the mutations are inherited in subsequent cell divisions. The pattern of mutations accumulated in each cell is used to infer the lineage tree. (B) The accuracy of lineage reconstruction was determined by comparing the inferred tree with the reference tree using using a measure related to the Robinson Foulds method. The unmutated state of the recorder was used to root the tree. (C) Accuracy of lineage reconstruction with a recorder of 100 CRISPR targets after 16 cell divisions (yielding 65,536 cells) over a range of mutation rates. Each line represents the mean accuracy (10 simulations) for simulations resulting in different numbers of equiprobable mutated states. The optimal mutation rate for each number of mutated states is indicated with an open circle. Vertical lines represent 95% confidence intervals. (D) Accuracy of lineage reconstruction for different mutation rates and numbers of CRISPR targets. Mutations were set to result in 16 equiprobable mutated states. Dashed lines represent different accuracy thresholds (levelplot) after a LOESS regression. For each parameter combination, we plot the mean accuracy of 10 simulations after 16 cell divisions.
Figure 2—figure supplement 1
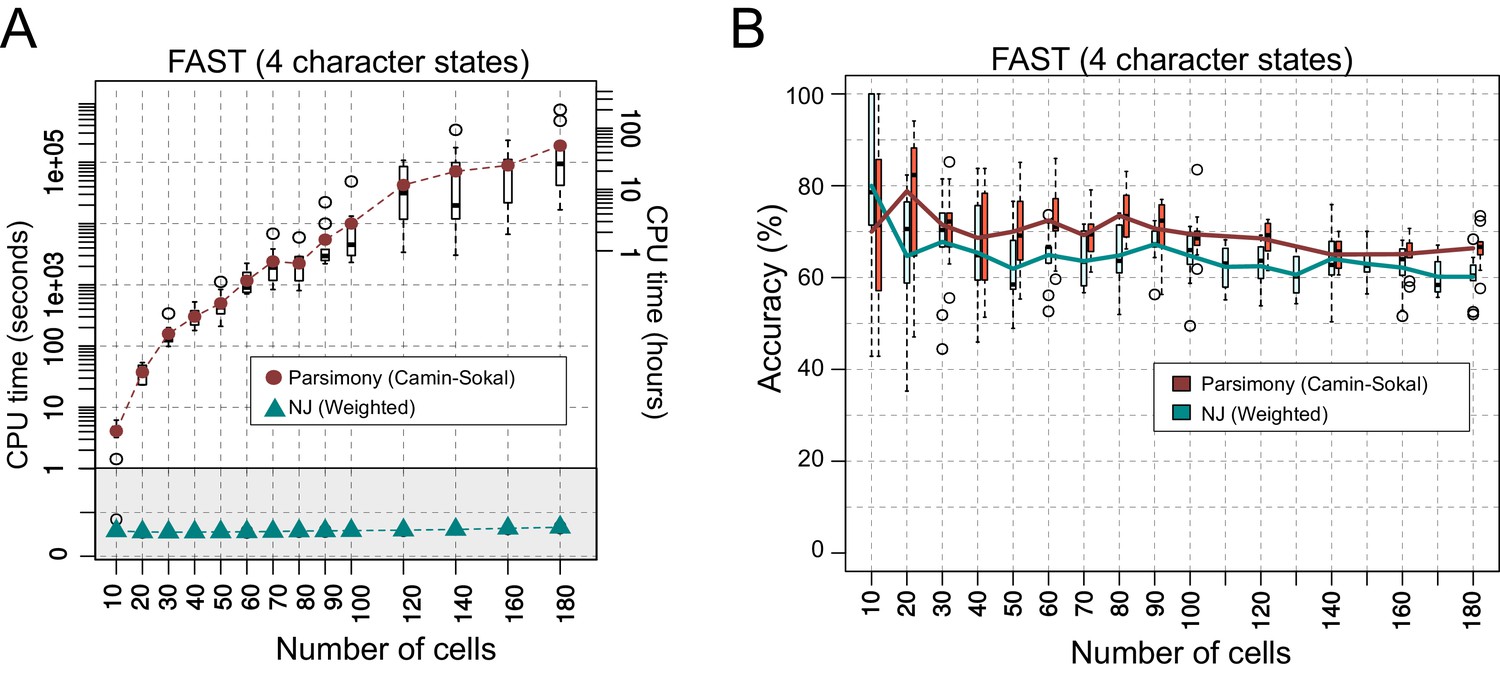
Comparing the performance of Neighbor Joining and Maximum Parsimony in lineage reconstruction.
(A) CPU time (shown in seconds at the left and in hours at the right of the Y-axis) required for tree reconstruction with a given number of cells (X-axis). Boxplots show the distribution of times taken to reconstruct 10 trees. Brown circles and cyan triangles indicate the average CPU time for Parsimony and NJ, respectively. Each reconstruction was performed on a single CPU thread. (B) Accuracy of the reconstructed trees from A. The brown and cyan lines represent the mean accuracy of 10 trees for a given number of cells (X-axis) with their distributions shown as a boxplot.
Figure 3
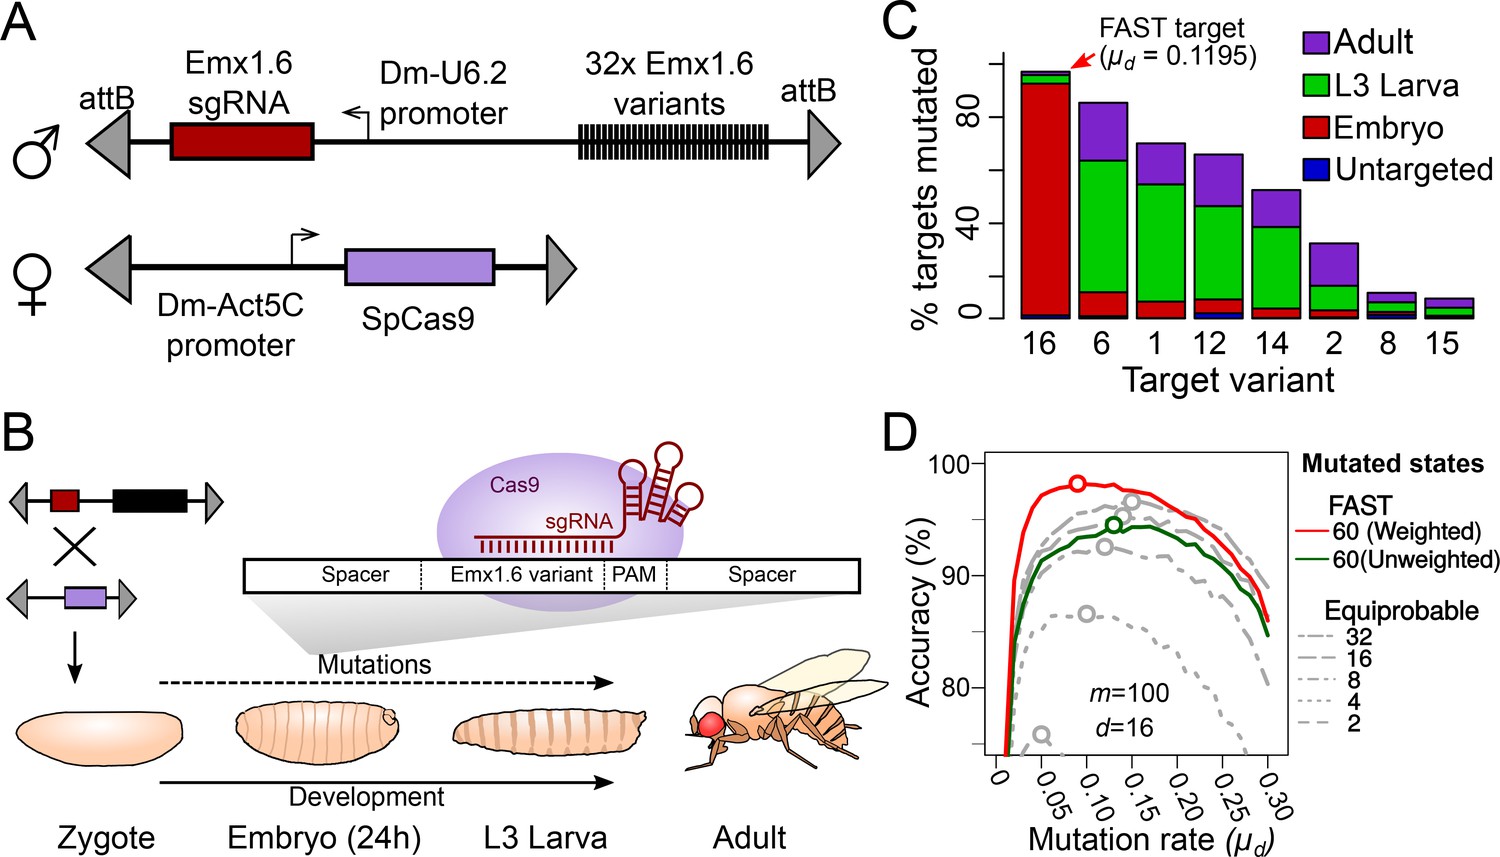
Tuning the mutation rate of a CRISPR recorder in vivo.
(A) CRISPR recorder designed to test the mutation rates of 32 variants of the Emx1.6 target in Drosophila. The recorder consists of two transgenic constructs brought together by genetic crosses. The first construct carries an array of the 32 target variants and a transgene expressing the Emx1.6 sgRNA under the constitutive Drosophila U6.2 promoter (Port et al., 2014). The second construct expresses the Streptococcus pyogenes Cas9 gene under the constitutive Drosophila Act5C promoter (Port et al., 2014). (B) Double heterozygotes carrying both constructs were collected at embryonic, late larval (L3) and adult stages and analysed for mutations in the target array by PCR amplification and sequencing of the recorder. (C) Proportion of targets mutated at different stages, for the eight most efficient target variants. ‘Untargeted’ represents background mutations or sequencing errors observed in the absence of the Cas9 transgene. (D) Estimates of cell lineage accuracy from computer simulations (as in Figure 2C) using the mutational outcomes observed in vivo on the FAST target.
Figure 4 with 1 supplement
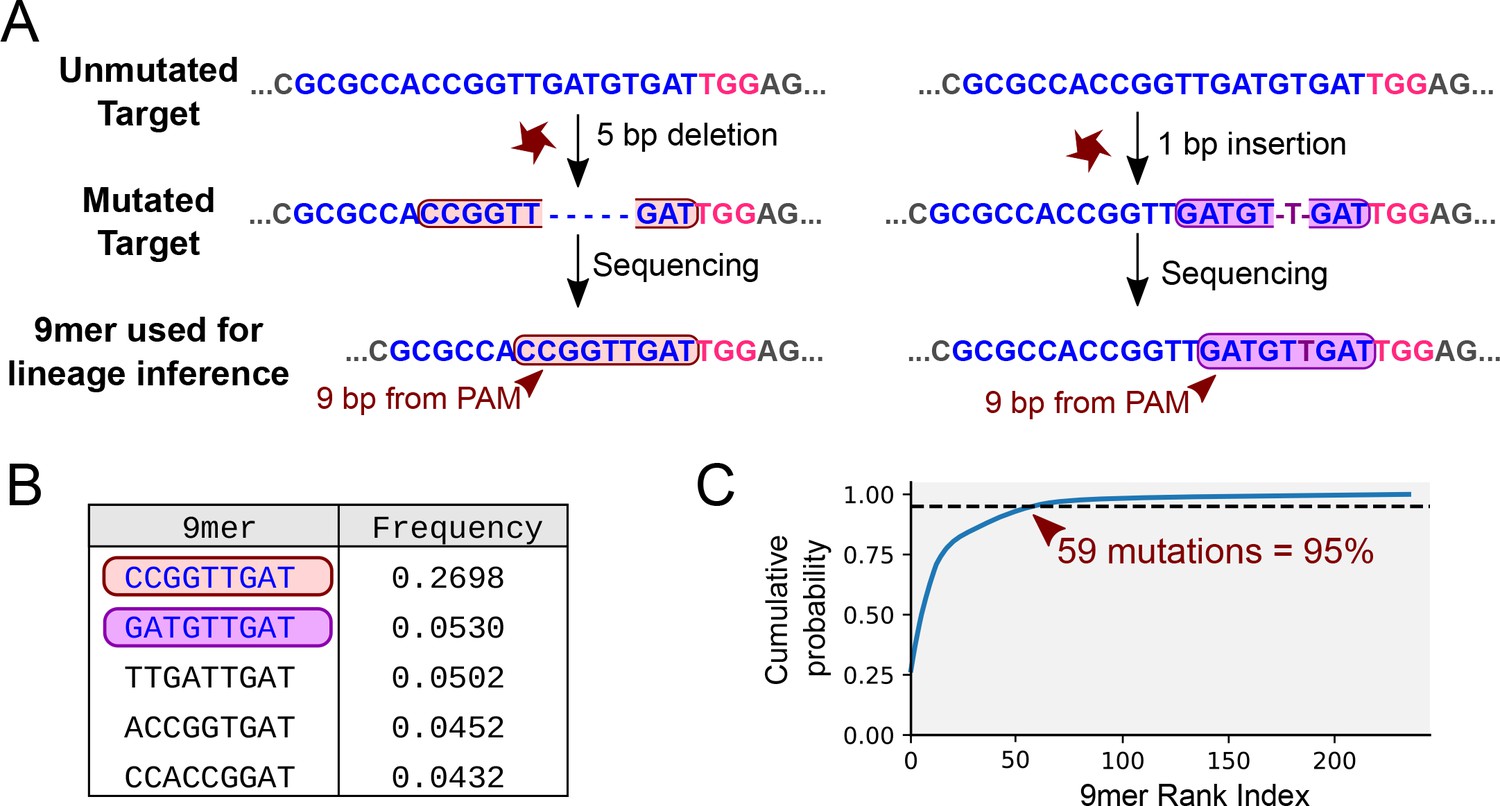
Mutational outcomes of CRISPR in vivo.
(A) Examples of two mutational outcomes after CRISPR cleavage. The 9-nucleotide sequence located immediately upstream of the PAM (coloured box) captures most of the variation resulting from CRISPR-induced mutations (Figure 4—figure supplement 1). The target sequence is shown in blue, PAM sequence in pink, flanking sequence in grey. (B) Relative frequencies of the five most common mutational outcomes in the FAST target. (C) Cumulative probability of the mutational outcomes. 59 mutations account for 95% of the total number of mutations.
Figure 4—figure supplement 1
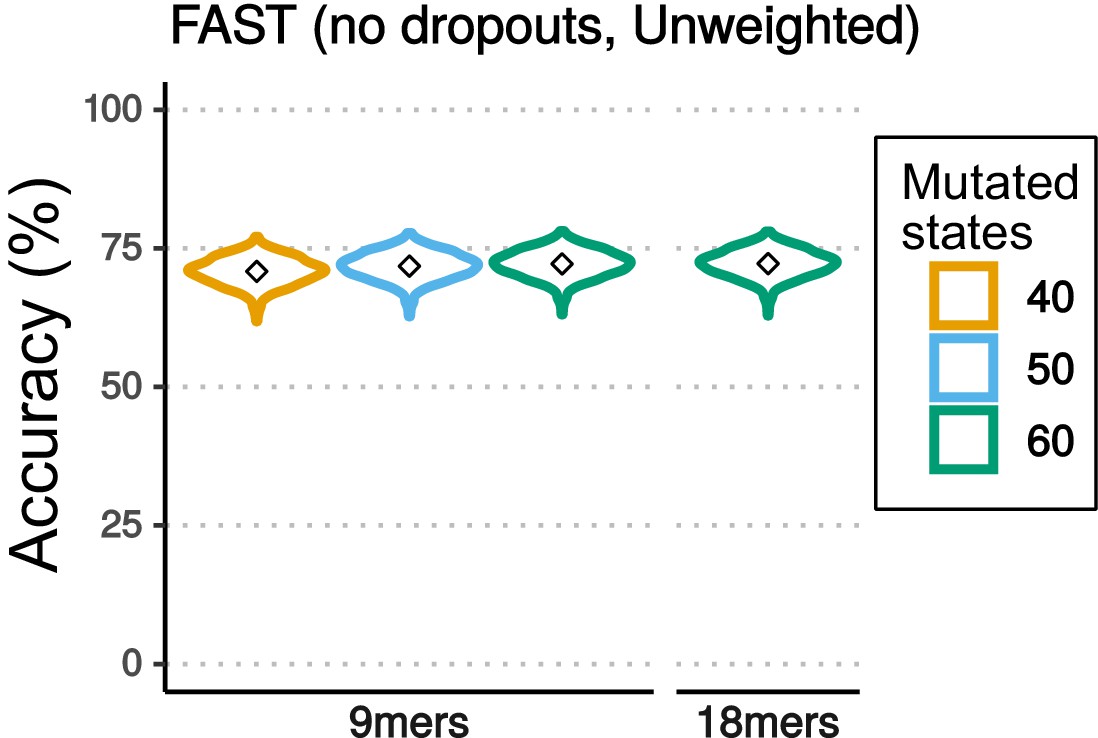
Accuracy of reconstruction varying the number of character states and nucleotides (Nmers) used for reconstruction.
Violin plots comparing the accuracy of lineage reconstruction when the mutational outcomes are reduced to the 40, 50 and 60 most common mutated character states observed when reading nine nucleotides (9mers), and 60 character states when reading 18 nucleotides (18mers). In each case, the the lowest frequency outcomes have been merged into a single character state.
Figure 5 with 1 supplement
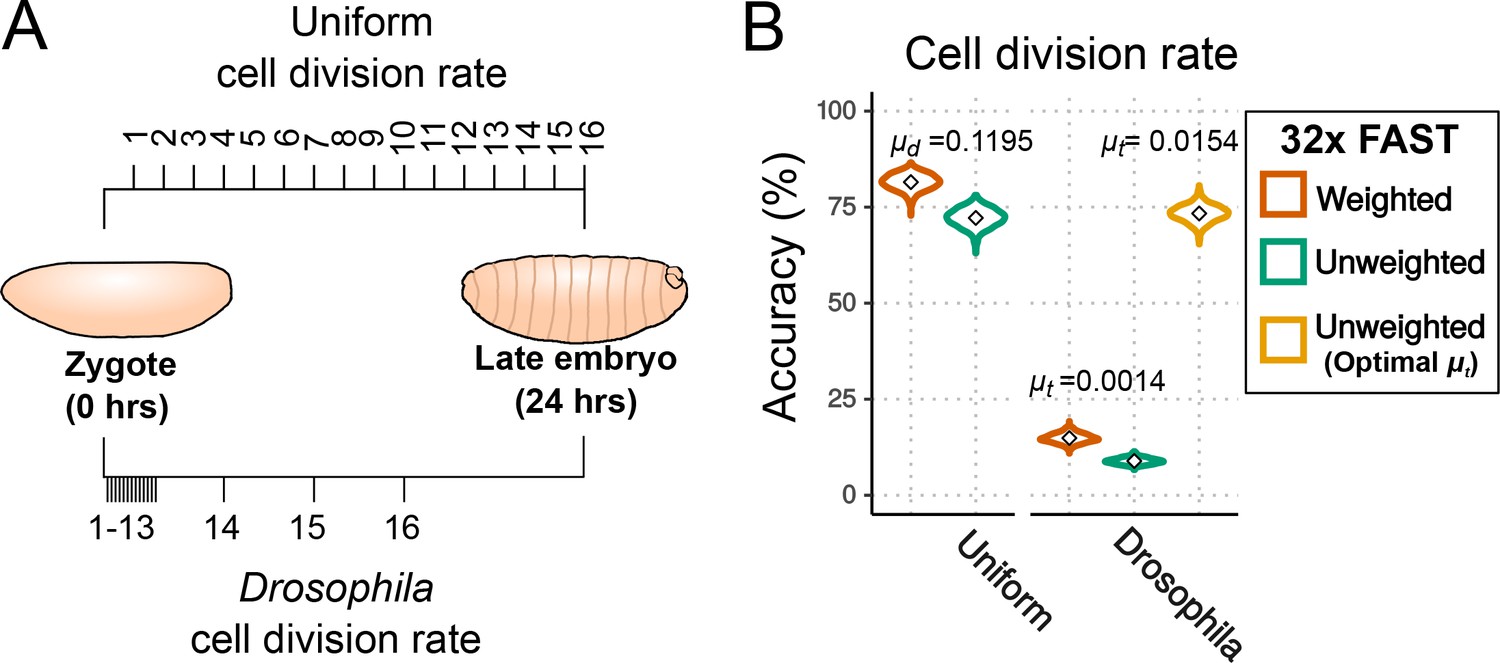
Effects of cell division rate on lineage reconstruction.
(A) Scheme of the comparison between uniform and actual cell division rates in Drosophila embryos. (B) Accuracy of lineage reconstruction under a uniform cell division rate (left) compared to rates that approximate those actually observed during Drosophila development (right) (Zalokar and Erk, 1976; Foe, 1989), using mutation rates calculated from real experiments for the FAST target ( = 0.0014), or optimised for accuracy of reconstruction ( = 0.0154). Violin plots represent the distribution of reconstruction accuracies of 1000 simulations after 16 cell divisions. The accuracy of reconstruction using 32 FAST targets, with or without weighting of mutations, is represented in orange and green respectively. In yellow is the accuracy of 32 targets with an optimal (with no weighting).
Figure 5—figure supplement 1

Finding the optimal mutation rate for the real rates of cell division in Drosophila embryos.
Accuracy of lineage reconstruction is given for different mutation rates (). Simulations were performed to approximate Drosophila's known cell division rate over 16 cell divisions, under a Poisson model. Boxplots represent the distribution of 1000 simulations.
Figure 6 with 1 supplement

Effects of dropouts on lineage reconstruction.
(A) Schematic representing how targets can be dropped out by simultaneous CRISPR edits. (B) Accuracy of lineage reconstruction without dropouts (left) or with the presence of dropouts (right), using a = 0.1195. Violin plots represent the distribution of reconstruction accuracies of 1000 simulations after 16 cell divisions. The accuracy of reconstruction using 32 FAST targets, with or without weighting of mutations, is represented in orange and green respectively. In black is the accuracy when simulating the 10 targets of the Gestalt v7 construct (with no weighting; see Figure 6—figure supplement 1).
Figure 6—figure supplement 1
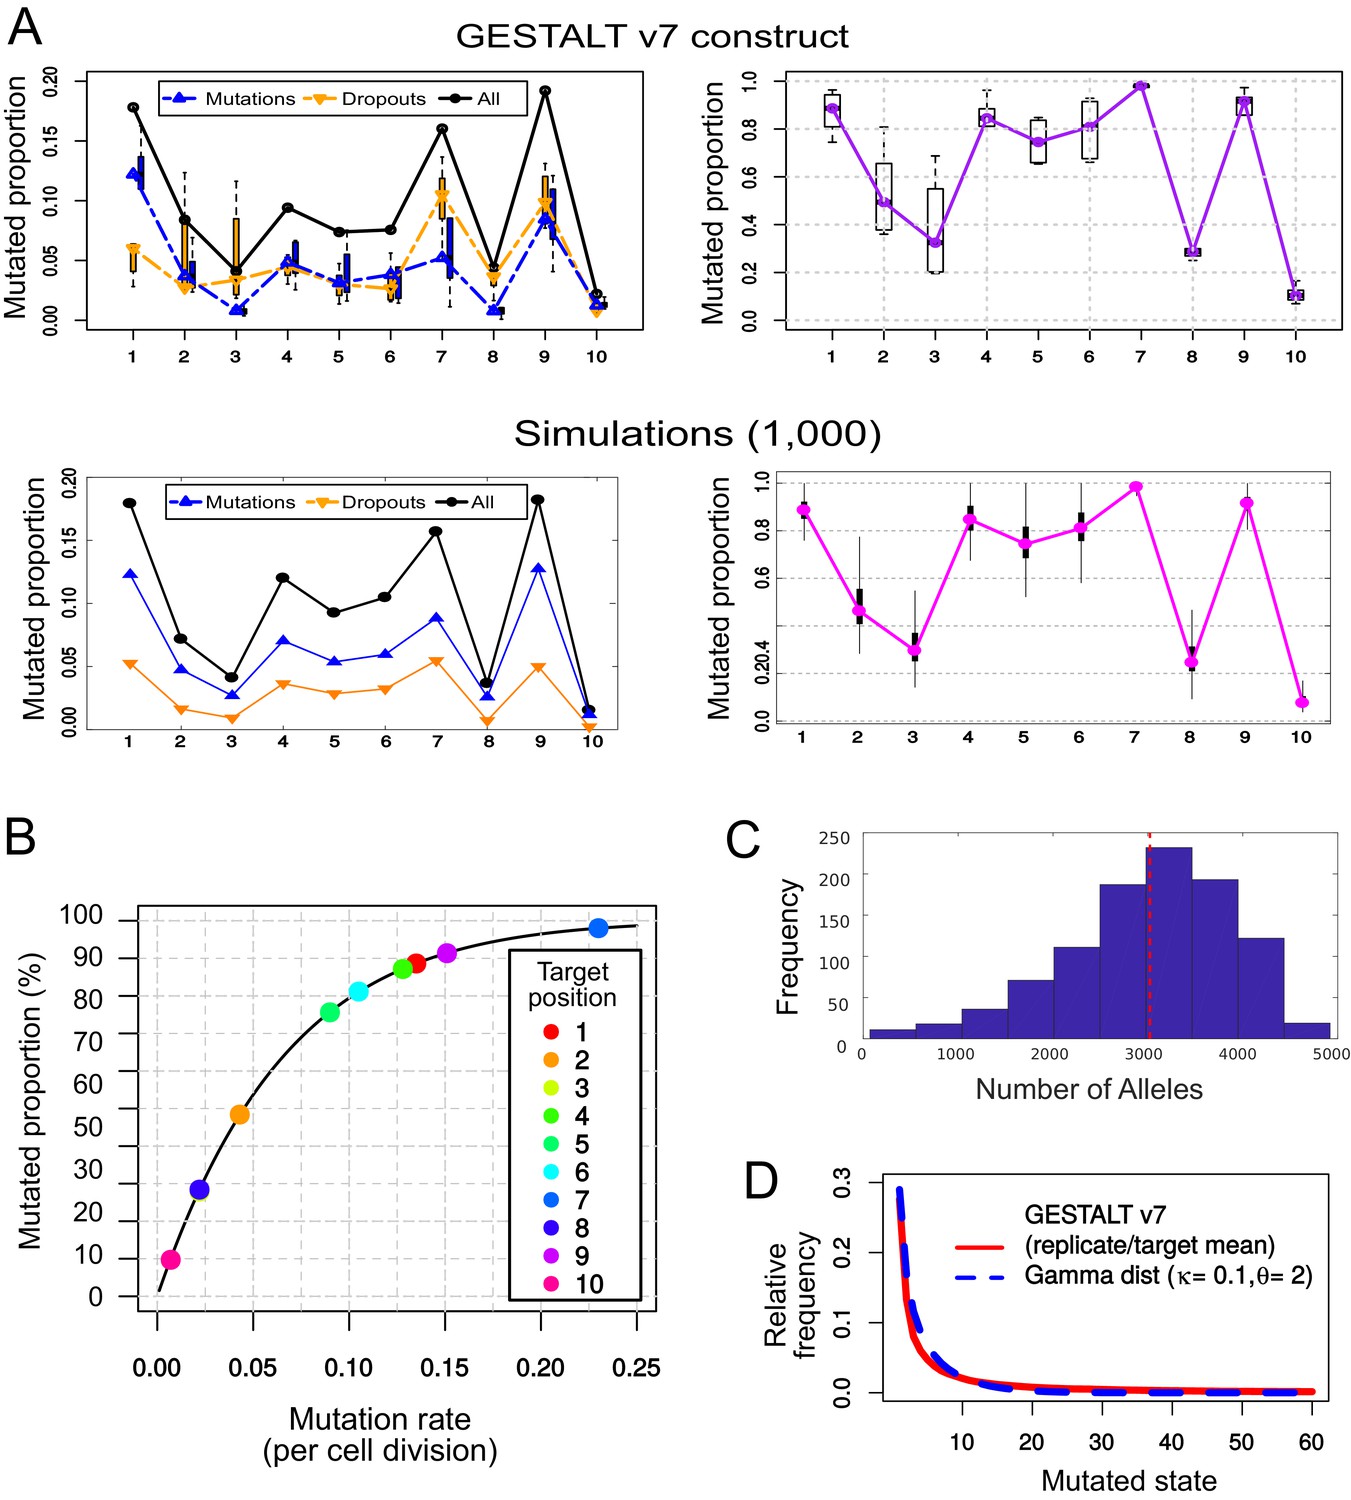
Simulating the mutational outcomes of the GESTALT v7 recorder.
(A) Comparison between the observed target saturation of the GESTALT v7 recorder (top) and our simulations (bottom). Left: Relative frequency of mutations and dropouts affecting each target after 15 cell divisions. Right: Proportion of targets (remaining after dropouts) carrying a mutation. (B) Mutation rate () necessary to produce the proportion of mutations observed in each target after 15 cell divisions, assuming a geometric distribution. (C) Histogram of the number of ‘alleles’ found per simulation, in 1,000 GESTALT simulations. The red dashed line represents the mean number of alleles per simulation. 100 samples of 10,000 cells were analysed per simulation. (D) The relative frequencies of the 60 most common mutated states (mean values for all replicates and targets, in red) follow a gamma distribution with shape parameter = 0.1 and scale parameter = 2 (in blue).
Figure 7 with 2 supplements
Combining CRISPR lineaging with in situ sequencing.
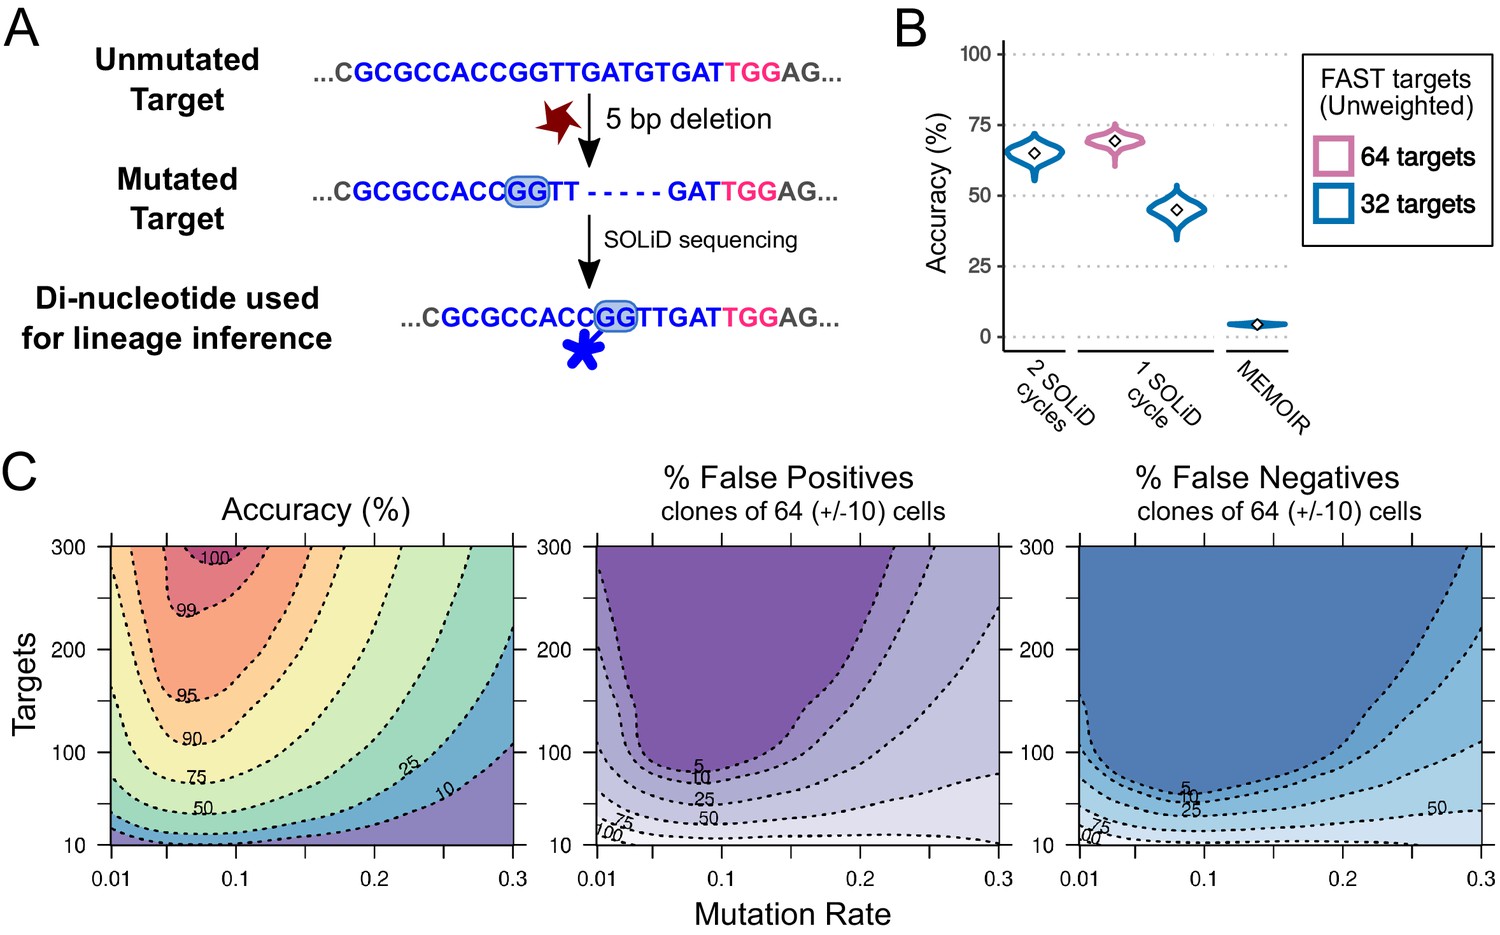
(A) The most common mutational outcome of the FAST target is shown. The coloured box highlights the most informative dinucleotide position to read by SOLiD sequencing (6–7 bp from PAM after CRISPR cleavage) and its SOLiD colour code (see Figure 7—figure supplement 1). Sequence colours as in Figure 4. (B) Accuracy of lineage reconstruction after sequencing with 2 SOLiD sequencing reads (left), 1 SOLiD read (center) and as in MEMOIR (right) using a = 0.1195. In blue and pink are the accuracy of a construct with 32 and 64 FAST targets, respectively. (C) Accuracy of lineage reconstruction using all cells after 16 cell divisions ( = 65,536) and in situ SOLiD sequencing, for different mutation rates and numbers of CRISPR targets, using a = 0.1195 and assuming equiprobable colour frequencies after 1 SOLiD read; accuracy (left), false positives (center) and false negatives (right). Dashed lines represent different accuracy thresholds (levelplot) after a LOESS regression. For each parameter combination, we used the mean accuracy of 10 simulations after 16 cell divisions. We found the global accuracy to be similar when subsampling 1,000 cells (Figure 7—figure supplement 2).
Figure 7—figure supplement 1
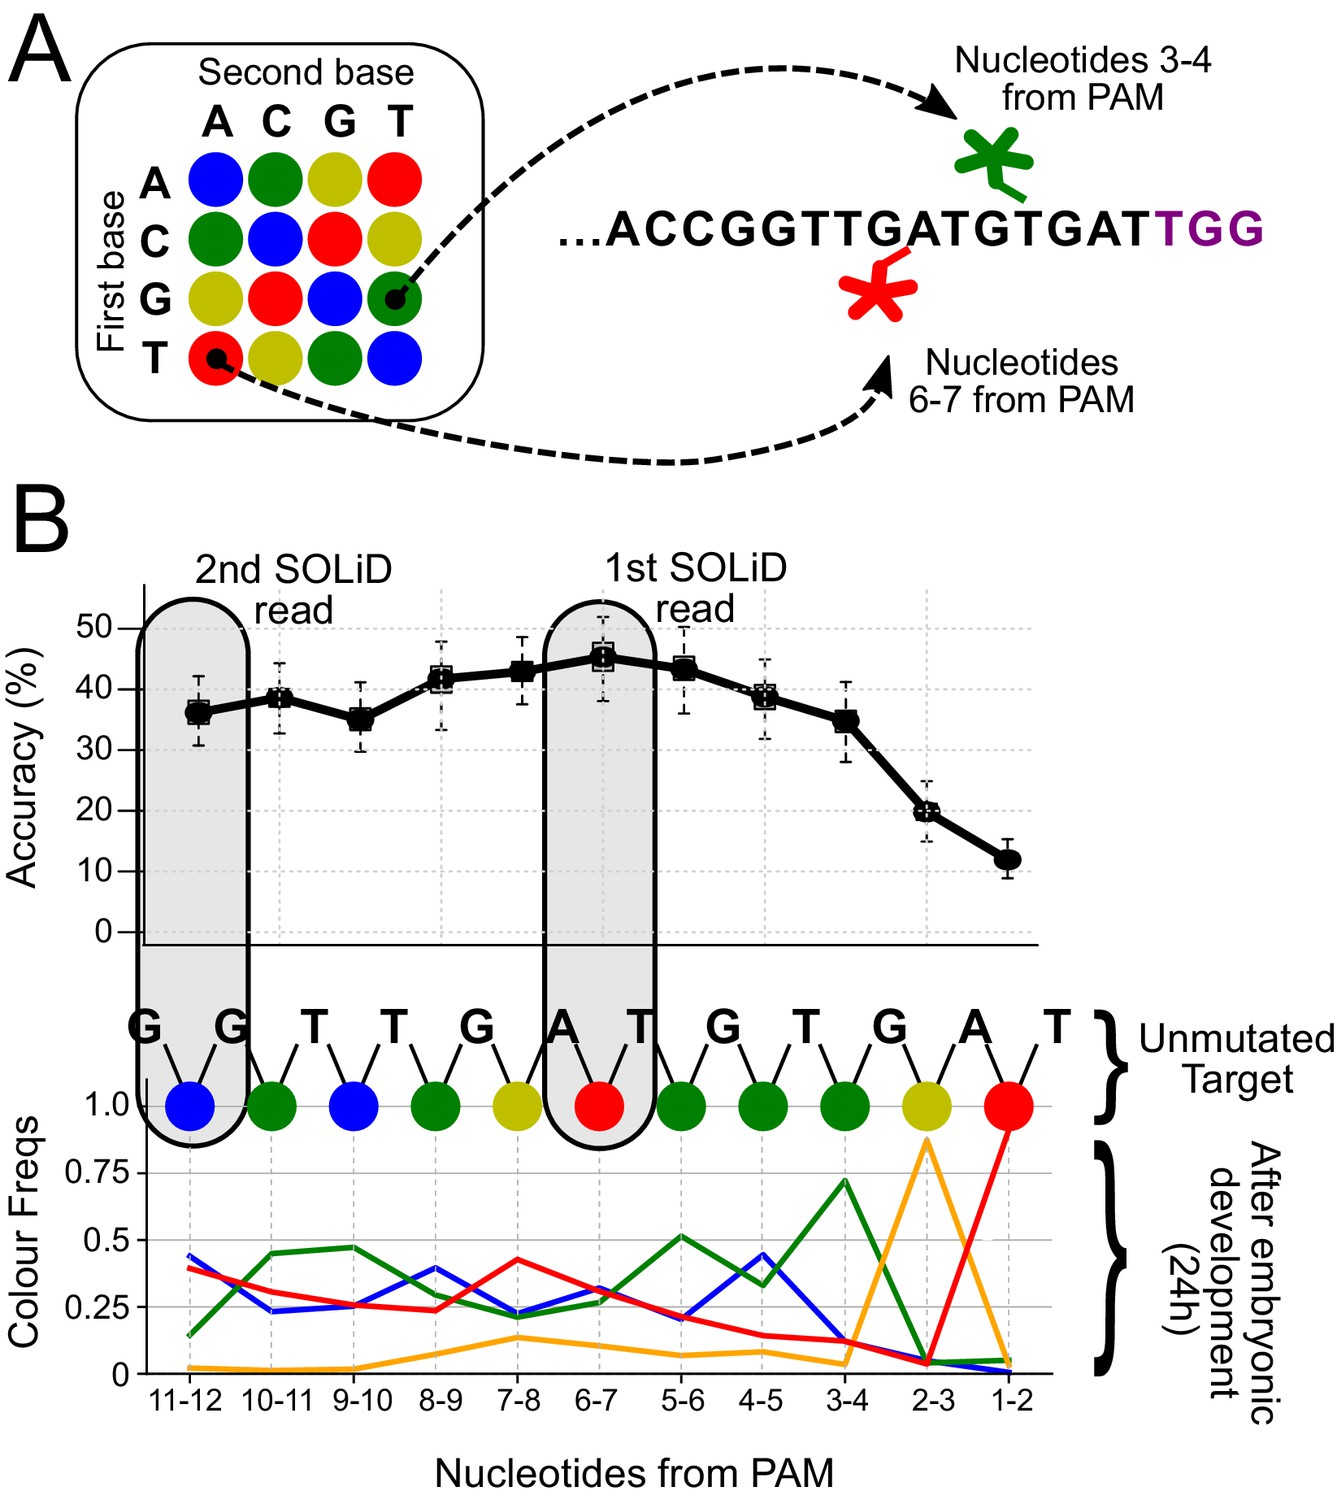
Distribution of SOLiD sequencing outcomes on the FAST target, to identify the most informative sites.
(A) SOLiD colour-space coding. Each dinucleotide-specific probe is labelled with 1 of 4 fluorescent markers. The colour code for the 16 possible dinucleotides is shown on the left. The outcome of interrogating two different dinucleotides in the unmutated target is shown on the right; positions 3–4 (green) and 6–7 (red) from the PAM sequence (in purple). (B) The frequencies of experimentally observed mutational outcomes on the FAST target are shown, using the SOLiD colour code. For reference, the sequence of colours for the unmutated target is shown at the top. The dinucleotide located 6–7 nucleotides upstream of the PAM is the most informative for lineage reconstruction. The grey boxes highlight the dinucleotides used for the SOLiD simulations.
Figure 7—figure supplement 2
Accuracy of lineage reconstruction using a single-read of SOLiD sequencing.
(A) Accuracy of lineage reconstruction, for different mutation rates and numbers of CRISPR targets, after a single read of SOLiD sequencing at positions 6–7 of the FAST target (see Figure 7—figure supplement 1). For each parameter combination, accuracy values represent the average of 10 simulations. (B) Accuracy thresholds after applying a Loess regression on the same data.
Figure 8
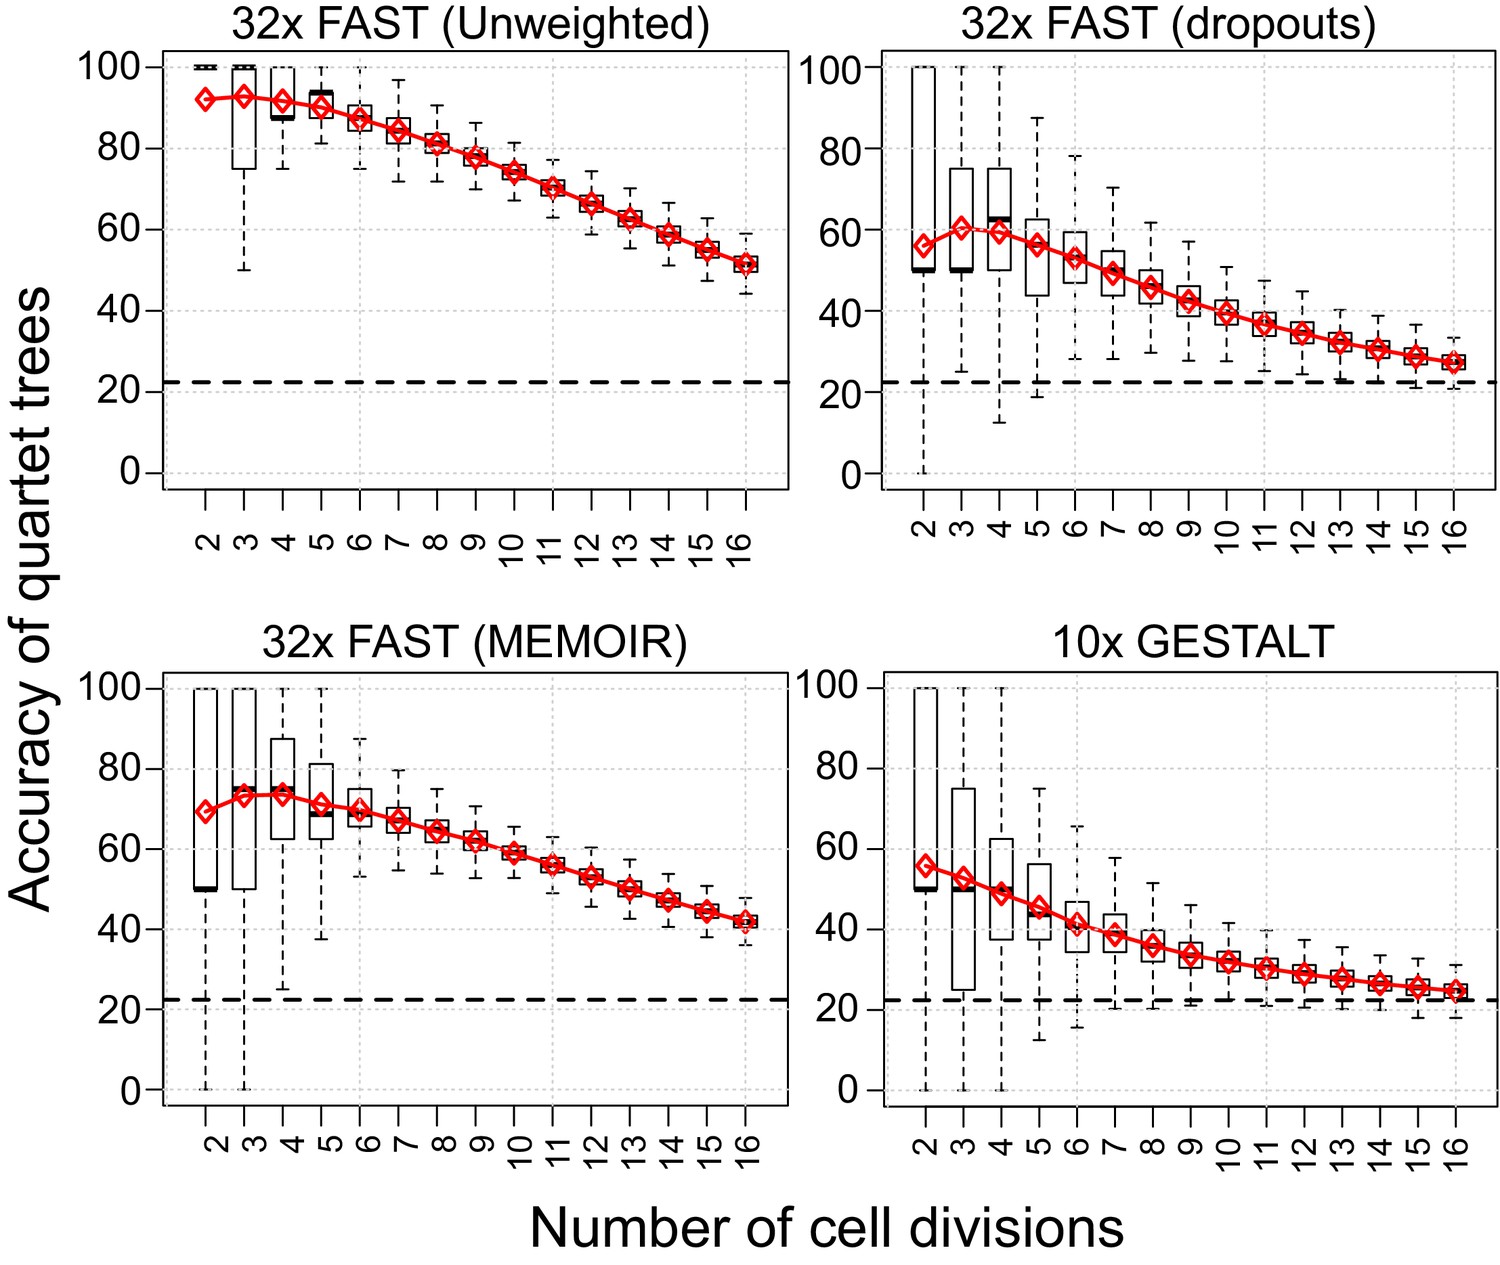
Quartet analysis.
Boxplots showing the percentage of correct splits in quartet trees measured at cell divisions 2 to 16. Red diamonds represent the average of up to 250 randomly sampled groups of quartet trees from the different simulations. The black dashed line indicates the average percentage of correct splits observed in 100,000 random quartet trees.
Figure 9 with 1 supplement
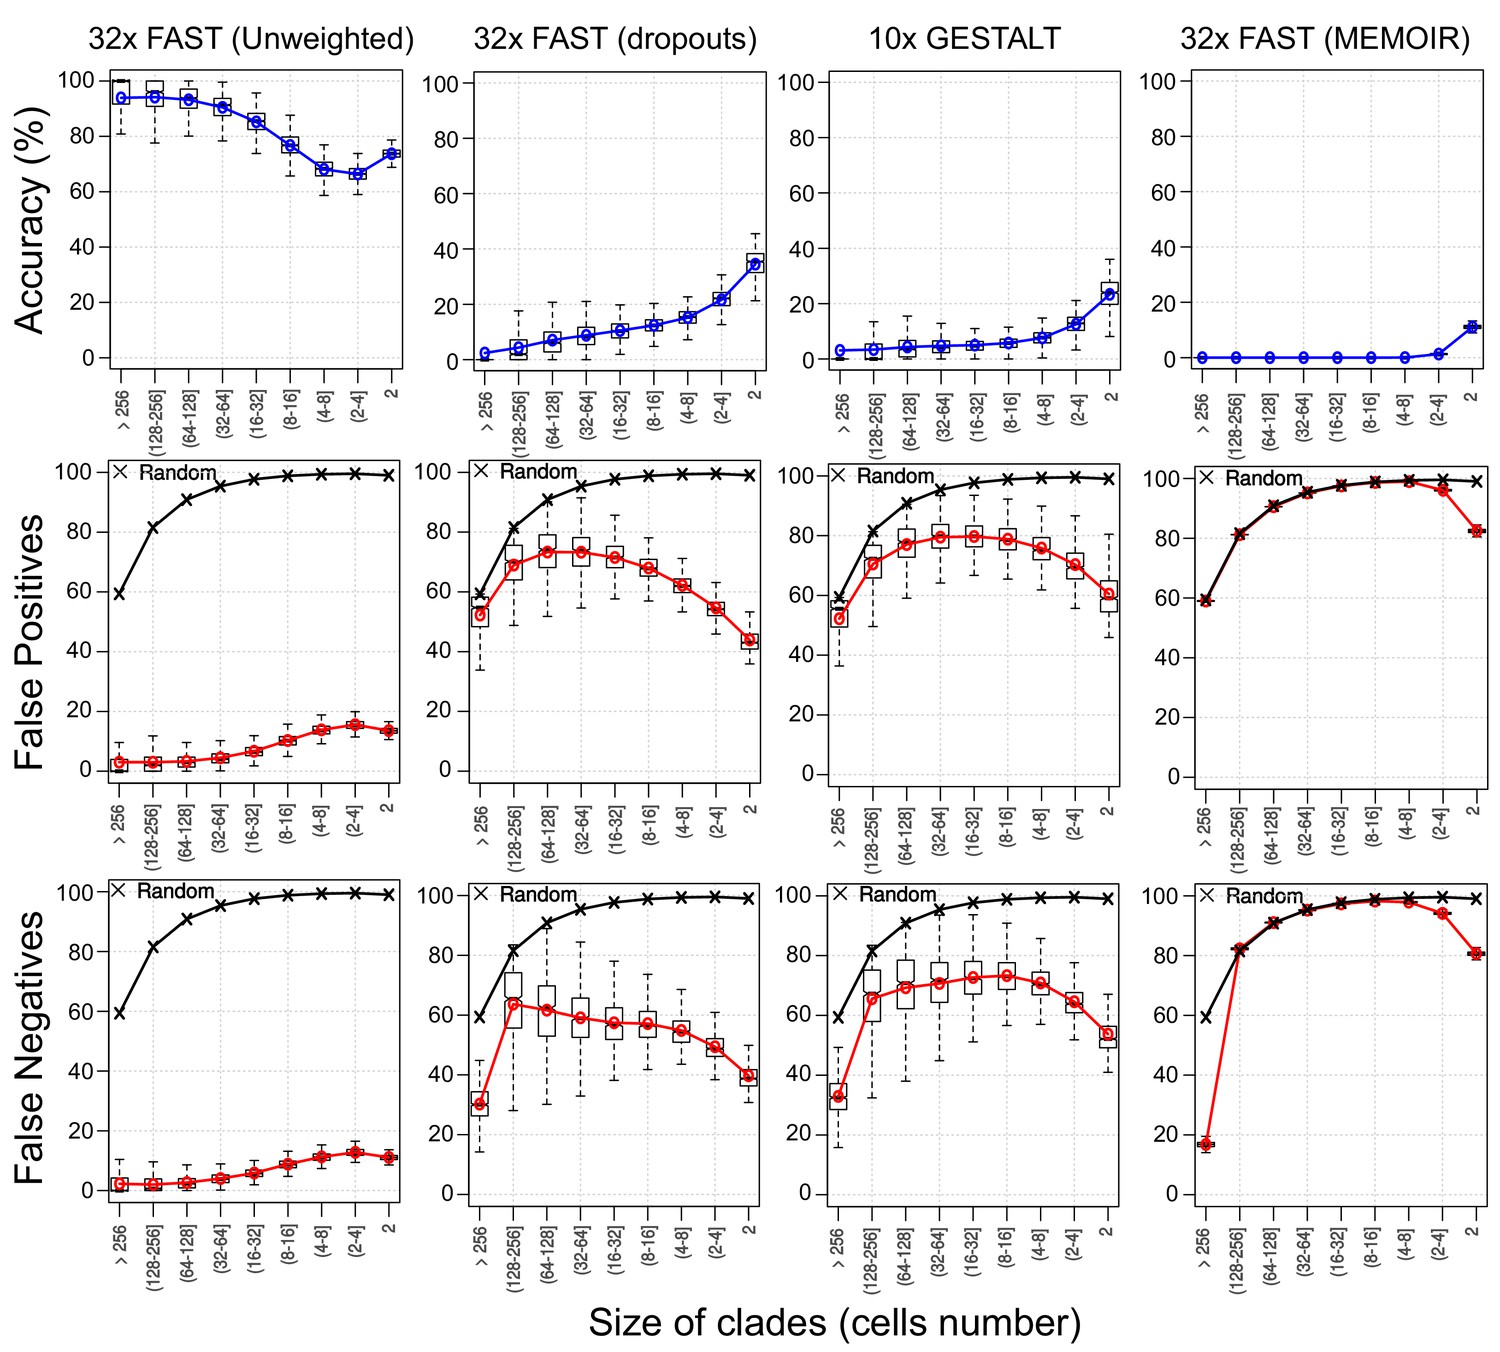
Assessing reconstruction accuracy at different tree depths.
Three different measures of reconstruction accuracy (rows) are shown for four set of simulations (columns). The x-axis in each plot indicates the size of the clade of cells that is being assessed. In the False Positives and Negatives plots, black crosses show the average values of 1000 random trees.
Figure 9—figure supplement 1

Method to estimate false positives and false negatives.
False positives were measured by counting the proportion of cells that need to be pruned from a branch of the inferred tree to match a given branch in the reference tree. Similarly, false negatives were measured by counting the proportion of cells that need to be pruned from a branch of the reference tree to match a given branch of the inferred lineage tree. For details see Materials and methods.
Additional files
-
Supplementary file 1
Supplementary Table 1. Proportion of mutated targets (target saturation) for each of the 32 Emx1.6 target variants, sampled at different developmental stages (embryos, L3 larvae, adults) and in the absence of Cas9 (untargeted). Targets 13, 17, 18, 21 and 23 were not analysed further because there were no good quality reads in the untargeted condition or because the targets showed a high proportion of sequencing errors. Supplementary Table 2. Proportion of mutated targets (target saturation) in the embryo after correcting for sequencing errors and estimated mutation rates per cell division, for the target variants showing the highest mutation rates. Supplementary Table 3. PCR primers used for preparation of the sequencing libraries. Forward primers (F) carry adapter sequences (uppercase), barcodes specific for each condition (underlined, BC1 to BC6), and sequences annealing to the spacers of the repeat construct (lowercase). Reverse primers (R) carry adapters (uppercase) and sequences annealing to the spacers of the repeat construct (lowercase); see Figure 3B and Materials and methods.
- https://doi.org/10.7554/eLife.40292.018
-
Transparent reporting form
- https://doi.org/10.7554/eLife.40292.019
Download links
A two-part list of links to download the article, or parts of the article, in various formats.
Downloads (link to download the article as PDF)
Open citations (links to open the citations from this article in various online reference manager services)
Cite this article (links to download the citations from this article in formats compatible with various reference manager tools)
Is it possible to reconstruct an accurate cell lineage using CRISPR recorders?
eLife 8:e40292.
https://doi.org/10.7554/eLife.40292


