Developmental NMDA receptor dysregulation in the infantile neuronal ceroid lipofuscinosis mouse model
- University of Illinois at Chicago, United States
Figures
Figure 1

ALs deposit immediately following eye opening in visual cortex of Ppt1-/- mice.
(A) Representative composite confocal images through area V1 of visual cortex in WT (top) and Ppt1-/- mice (bottom) during development and into adulthood. DAPI nuclear stain (blue, 405 nm excitation) and AL signals (red, 561 nm excitation) are visualized. Cortical layers are marked (left). Scale = 50 μm. Note that scale bars for P11 and P14 images are enlarged to account for reduced cortical thickness at these ages. (B) Quantification of the mean percent area occupied by ALs through all cortical layers (see Materials and methods). Ppt1-/- and WT were compared (n = 4–6 animals/group) at each age using t-test and the significance was indicated as follows: *p<0.05, **p<0.01, and ***p<0.001. Differences between two consecutive ages (e.g. Ppt1-/- P14 vs. (P11) is denoted: *p<0.05 and **p<0.01 where indicated. Error bars represent s.e.m. (C) Cortical layer-specific quantification of area occupied by ALs separated by each cortical layer (x-axis) and age (z-axis). Averaged values, s.e.m., and n for each condition are represented in Supplementary file 1.
Figure 2 with 1 supplement

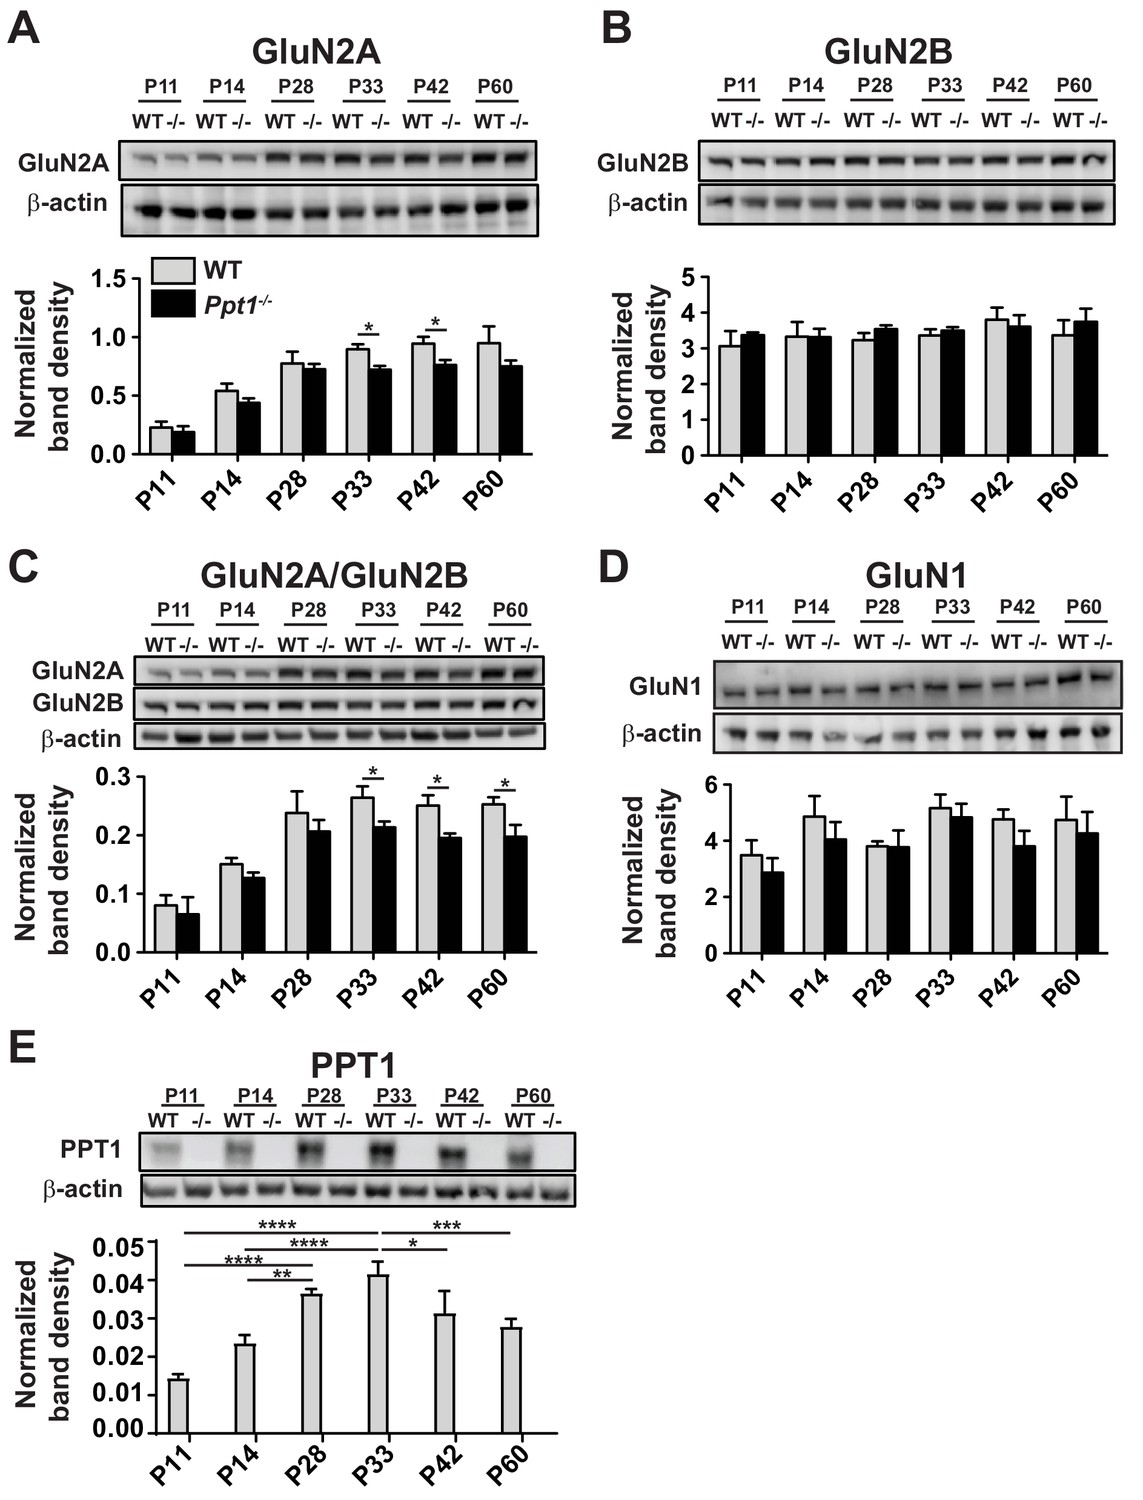
NMDAR subunit composition is biased toward immaturity in Ppt1-/- visual cortex.
(A) Representative immunoblots from synaptosomes of GluN2 subunits, GluN2A and GluN2B across age (P11–P60) and genotype as indicated (top) and quantification of band density (bottom) normalized to β-actin loading control within lane. (B) Representative immunoblots from synaptosomes of GluN2A and GluN2B (top) and quantification of the ratio of GluN2A/GluN2B band density within animal normalized to β-actin loading control within lane (bottom). (C) Representative immunoblot of GluN1 from synaptosomes across age and genotype as indicated (top) and quantification of band density (bottom) normalized to β-actin loading control within lane. (D) Representative immunoblots from synaptosomes of the scaffolding molecules PSD-95 and SAP102 across age and genotype as indicated (top) and quantification of band density (bottom) normalized to β-actin loading control within lane. (E) Representative immunoblot from synaptosomes of PPT1 across age and genotype as indicated (top) and protein expression level (bottom) normalized to β-actin. For experiments in Figure 2A–D, Ppt1-/- and WT were compared (n = 4 independent experiments/animals with two repetitions/group) at each age using t-test and the significance was indicated as follows: *p<0.05, and **p<0.01. In Figure 2E, WT expression levels at each age were compared (n = 4 independent experiments/animals with two repetitions/group) by ANOVA followed by Tukey’s post-hoc test. Significance between ages is indicated: *p<0.05. Error bars represent s.e.m.
Figure 2—figure supplement 1
NMDAR subunit composition is immature in whole lysates from Ppt1-/- visual cortex.
(A) Representative immunoblots of the GluN2A in whole lysates across age and genotype as indicated (top) and quantification of band density (bottom) normalized to β-actin loading control within lane. (B) Representative immunoblots of the GluN2B in whole lysates across age and genotype as indicated (top) and quantification of band density (bottom) normalized to β-actin loading control within lane. (C) Representative immunoblots of GluN2A and GluN2B (top) from whole lysates across age and genotype and quantification of the ratio of GluN2A/GluN2B band density within animal (bottom). (D) Representative immunoblots of GluN1 in whole lysates across age and genotype as indicated (top) and quantification of band density (bottom) normalized to β-actin loading control within lane. (E) Representative immunoblot from whole lysates of PPT1 across age and genotype as indicated (top) and protein expression level (bottom) normalized to β-actin. For experiments in Figure 2—figure supplement 1A–C, Ppt1-/- and WT were compared (n = 4 independent experiments/animals with two repetitions/group) at each age using t-test and the significance is indicated: *p<0.05. In Figure 2D, WT expression levels at each age were compared (n = 4 independent experiments/animals with two repetitions/group) by ANOVA followed by Tukey’s post-hoc test. Significance between ages is indicated: *p<0.05, **p<0.01, ***p<0.001, ****p<0.0001. Error bars represent s.e.m.
Figure 3
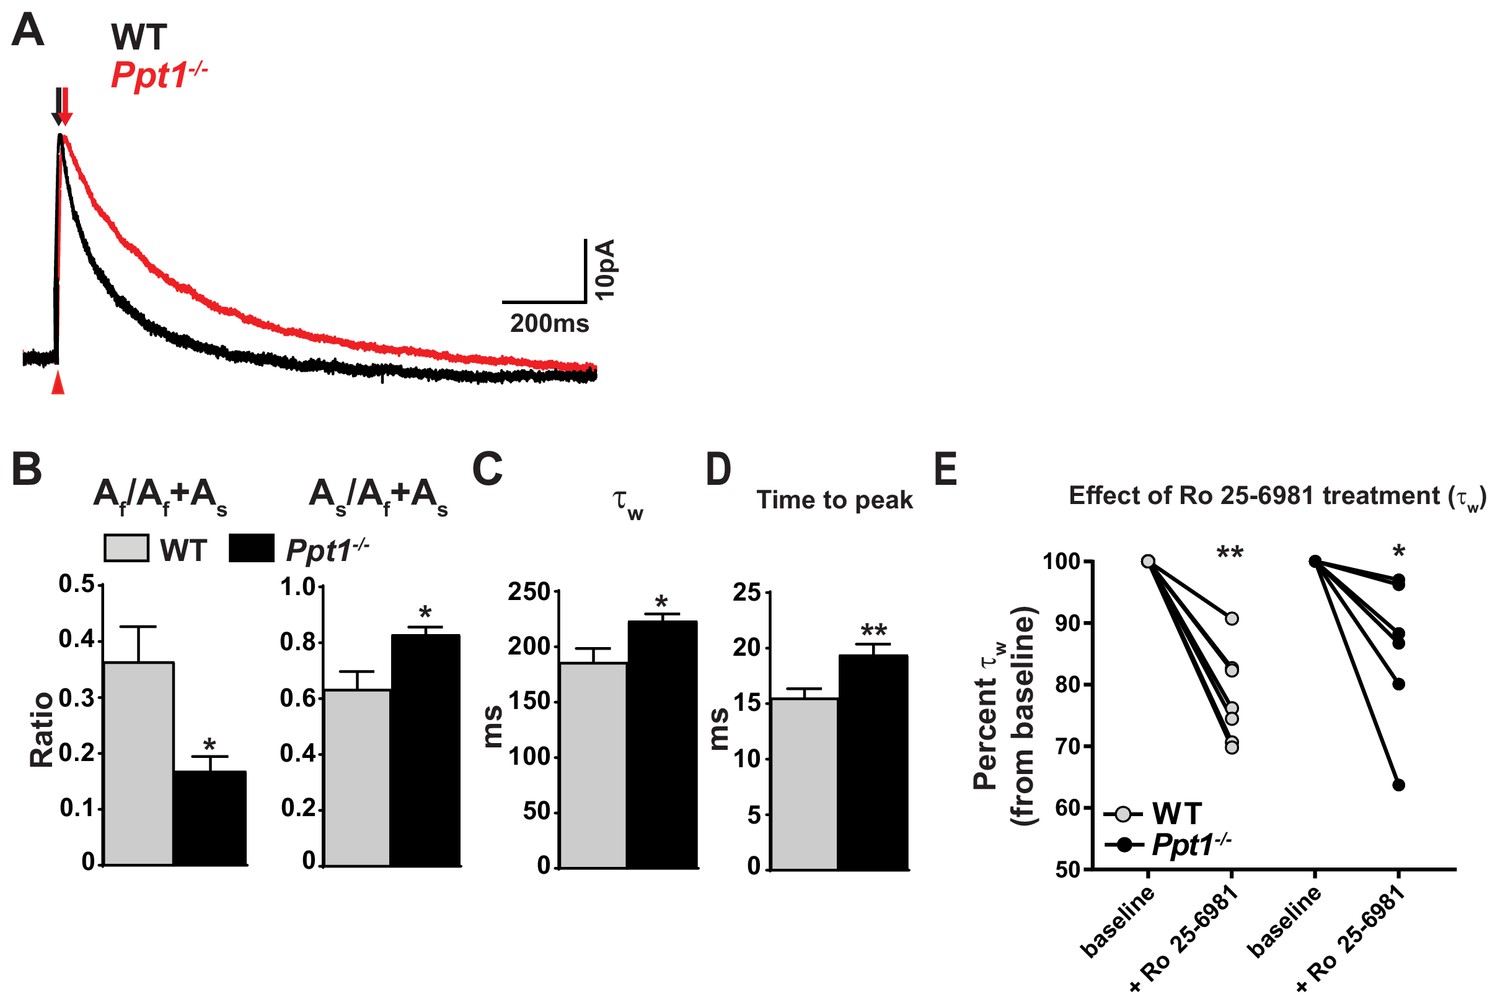
NMDAR-mediated EPSCs are altered in Ppt1-/- visual cortex.
(A) Representative traces of amplitude-scaled NMDAR-EPSCs recorded from pyramidal neurons in layer II/III of the visual cortex (V1) of WT and Ppt1-/- mice. Black and red arrows above traces indicate EPSC rise time for WT and Ppt1-/- responses, respectively. Red arrow below traces indicates onset of evoked stimulus. Neurons were voltage clamped at +50 mV and NMDAR-EPSCs evoked in layer IV. Neurons were voltage clamped at +50 mV and NMDAR-EPSCs evoked in layer IV. (B) Quantification of the ratio of the amplitude (A) of the fast component, Af/Af +As, and As/Af +As derived from fitting the decay phase of the evoked NMDAR-EPSCs with the double exponential function: Y(t) = Af*e –t/tfast + As*e-t/tslow. (C) Quantification of the weighted decay constant, τw derived from fitting the decay phase of the amplitude-scaled evoked NMDAR-EPSCs with the double exponential function: Y(t) = Af*e –t/tfast + As*e-t/tslow. (D) Quantification of the NMDAR-EPSC time to peak amplitude. (E) Percent change in τw following bath application of Ro 25–6981 (3 μM, 30 min) for each cell in WT and Ppt1-/- neurons. For experiments in Figure 3A–D, Ppt1-/- and WT were compared (n = 8 cells, four mice (WT); n = 8 cells, five mice (Ppt1-/-)) using t-test and the significance was indicated as follows: *p<0.05, and **p<0.01. For experiments in Figure 3E, the change in τw from baseline induced by Ro 25–6981 were compared in WT and Ppt1-/- neurons (n = 7 cells, four mice (WT); n = 6 cells, four mice (Ppt1-/-)) using repeated measures two-way ANOVA followed by Tukey’s post-hoc test and significance was indicated as follows: *p<0.05, and **p<0.01 vs. baseline. Error bars represent s.e.m.
Figure 4

Dendritic spine morphology is immature in Ppt1-/- layer II/III visual cortical neurons.
(A) Schematic of in utero electroporation procedure and timeline (bottom) (B) coronal diagram from Paxinos’ mouse brain atlas demonstrating areas of visual cortex (left) and representative low-magnification (10x) confocal image of a successfully transfected group of layer II/III neurons in visual cortex (right). Scale bar = 100 μm. (C) Representative confocal images of GFP-transfected dendritic segments from WT and Ppt1-/- neurons at P33. Arrows mark mature, mushroom-type spines; arrowheads mark thin, filopodial spines or stubby, headless spines. Scale bar = 10 μm. (D) Semi-automated quantification of dendritic spine length in WT and Ppt1-/- visual cortical neurons at P33. (E) Semi-automated quantification of dendritic spine volume and spine head volume (inset) in WT and Ppt1-/- visual cortical neurons at P33. (F) Semi-automated quantification of dendritic spine density per 10 μm of dendrite in WT and Ppt1-/- visual cortical neurons at P33. For experiments in Figure 4, WT and Ppt1-/- were compared (n = 3–4 cells/animal, three animals/group) using t-test and the significance was indicated as follows: *p<0.05, **p<0.01, ***p<0.001, Ppt1-/- vs. WT. Error bars represent s.e.m.
Figure 5

GluN2B to GluN2A NMDAR switch and Ppt1-/--induced synaptic deficits are recapitulated in primary cortical neurons.
(A) Representative immunoblot (top) and quantification of GluN2B levels in WT and Ppt1-/- neurons at DIV7, 10, and 18. (B) Representative immunoblot (top) and quantification of GluN2A levels (bottom) in WT and Ppt1-/- neurons at DIV7, 10, and 18. (C) Representative immunoblot (top) and quantification of PSD-95 levels (bottom) in WT and Ppt1-/- neurons at DIV7, 10, and 18. (D) Representative immunoblot (top) and quantification of the GluN2A/2B ratio (bottom) in WT and Ppt1-/- neurons at DIV7, 10, and 18. For all experiments in Figure 5, Ppt1-/- and WT were compared (n = 2 independent experiments with two repetitions/group) at each time point using t-test and the significance indicated as follows: *p<0.05 where indicated. Error bars represent s.e.m.
Figure 6
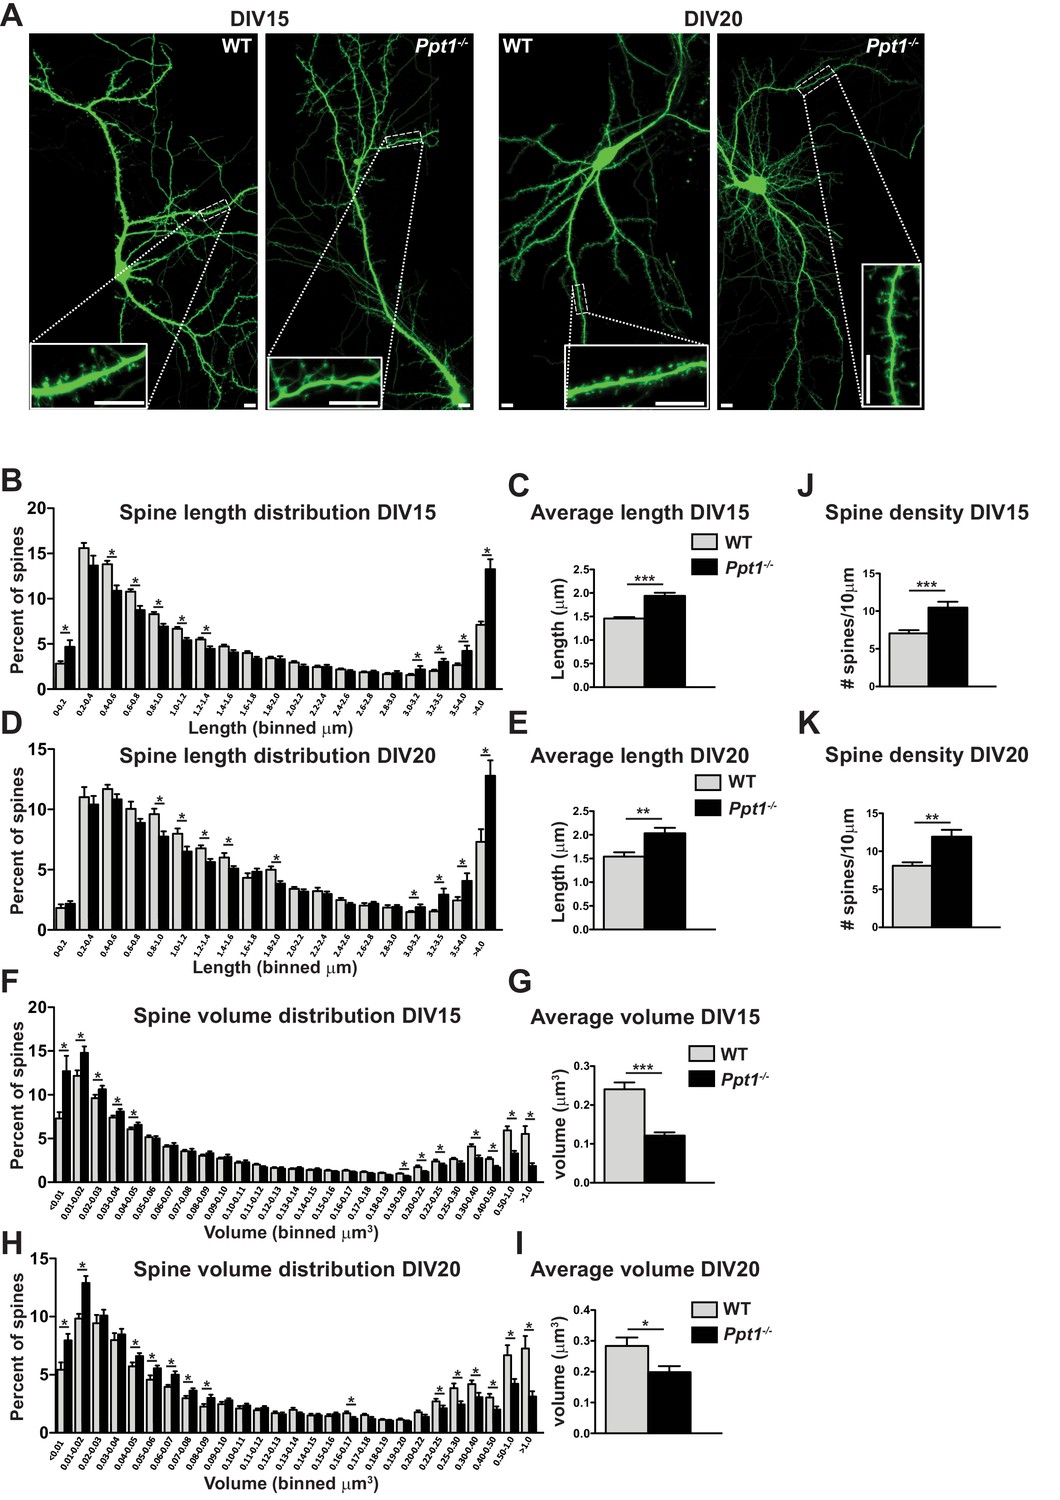
Dendritic spine morphology is immature in Ppt1-/- neurons in vitro.
(A) Representative composite confocal images of live DIV15 (left) and DIV20 (right) GFP-transfected, cultured WT and Ppt1-/- neurons. Insets represent dendrite segments within dotted line. Scale bar = 10 μm. (B) Quantification of dendritic spine length in WT and Ppt1-/- neurons at DIV15. Spine length is binned into 19 discrete groups from 0 - > 4 μm. (C) Mean length of all spines in cultured WT and Ppt1-/- neurons at DIV15. (D) Quantification of dendritic spine length in WT and Ppt1-/- neurons at DIV20. Spine length is binned into 19 discrete groups from 0 - > 4 μm. (E) Mean length of all spines in cultured WT and Ppt1-/- neurons at DIV20. (F) Semi-automated quantification of dendritic spine volume in WT and Ppt1-/- cultured neurons at DIV15. Spine volume is binned into 27 discrete groups form 0 - > 1 μm3. (G) Mean volume of all spines in cultured WT and Ppt1-/- neurons at DIV15. (H) Semi-automated quantification of dendritic spine volume in WT and Ppt1-/- cultured neurons at DIV20. Spine volume is binned into 27 discrete groups form 0 - > 1 μm3. (I) Mean volume of all spines in cultured WT and Ppt1-/- neurons at DIV20. (J) Semi-automated quantification of dendritic spine density per 10 μm of dendrite in WT and Ppt1-/- cultured neurons at DIV15. (K) Semi-automated quantification of dendritic spine density per 10 μm of dendrite in WT and Ppt1-/- cultured neurons at DIV20. For experiments in Figure 6, Ppt1-/- and WT were compared (For DIV15: n = 4–5 neurons/group, three-independent experiments, WT = 21,514 spines; Ppt1-/- = 18,013 spines. For DIV20: n = 3 neurons/group, two-independent experiments, WT = 11,335 spines; Ppt1-/- = 9958 spines) using t-test (within bin in the case of distribution graphs) and the significance was indicated as follows: *p<0.05, **p<0.05, ***p<0.001 where indicated. Error bars represent s.e.m.
Figure 7

Calcium imaging reveals extrasynaptic calcium dynamics in Ppt1-/- neurons.
DIV16-18, WT and Ppt1-/- cortical neurons transfected with GCaMP3 and imaged in the absence of Mg2+ for 5 min. (A) Single frames from Videos 1 and 2 of WT (left, note that cell is rotated 90° from Video 1) and Ppt1-/- (right) cultured neurons. Dendritic segments within the dotted-lines represent zoomed-in images of a single spine (left, WT) or dendritic shaft segment (right, Ppt1-/-) at baseline (top) and active (bottom) states. Scale = 10 μm. (B) Representative heat maps of ΔF/F0 values at one synaptic site from WT (left) and Ppt1-/- (right) dendrite segments during a portion the imaging session (350 frames, 50 s). (C) Representative averaged ΔF/F0 responses at one synaptic site from WT (left) and Ppt1-/- (right) neurons. Area under the curve represents calcium influx and is shaded in red. (D) Quantification of calcium transient area under the curve WT and Ppt1-/- neurons. (E) Quantification of calcium transient diffusion distance from WT and Ppt1-/- neurons. (F) Quantification of average correlation coefficient (synaptic synchrony) across time between sites of synaptic activity in WT and Ppt1-/- neurons. (G) Representative heat maps of ΔF/F0 values at one synaptic site from WT (left) and Ppt1-/- (right) dendrite segments before (top) and after (bottom) treatment with Ro 25–6981 (130 frames, 18 s). (H) Quantification of calcium transient area under the curve WT and Ppt1-/- neurons before and after treatment with Ro 25–6981. (I) Quantification of calcium transient diffusion distance from WT and Ppt1-/- neurons before and after treatment with Ro 25–6981. For experiments in Figure 7D–E, Ppt1-/- and WT were compared (n = 185 synaptic sites (WT), n = 131 synaptic sites (Ppt1-/-), three neurons/group, three individual experiments) by t-test and the significance was indicated as follows: ***p<0.001 vs. WT by t-test. For experiments in Figure 7F, Ppt1-/- and WT were compared (n = 100 synaptic sites (WT), n = 100 synaptic sites (Ppt1-/-); three neurons/group, two individual experiments) by t-test and the significance was indicated as follows: ***p<0.001 vs. WT by t-test. For experiments in Figure 7H–I, Ppt1-/- and WT were compared (n = 25 synaptic sites (WT), n = 28 synaptic sites (Ppt1-/-); three neurons/group, two individual experiments) by t-test and the significance was indicated as follows: ***p<0.001 vs. WT by t-test. 65 pixels is representative of 10 μm. Error bars represent s.e.m.
Figure 8
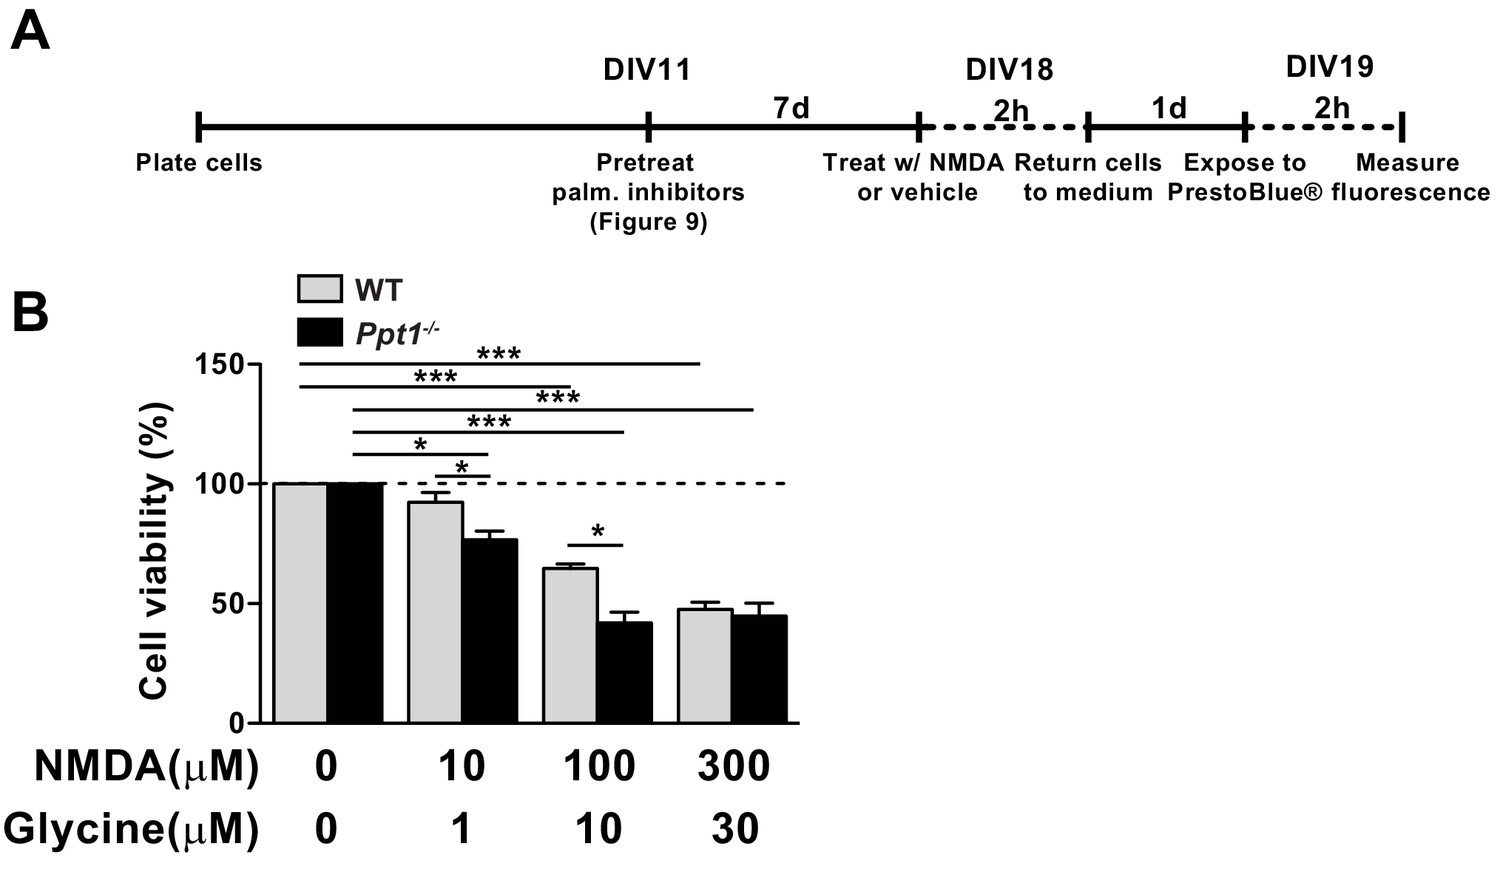
Ppt1-/- cultured neurons show enhanced vulnerability to NMDA-mediated excitotoxicity.
(A) Schematic of cellular toxicity experimental design. Briefly, neurons were grown to DIV11, treated with vehicle of palmitoylation inhibitors for 7 days (every 48 hr) and neuronal viability was measured by PrestoBlue cellular viability assay following exposure (2 hr exposure, 22 hr incubation in medium) to NMDA and glycine. (B) Quantification of cellular viability in WT and Ppt1-/- neurons at DIV19 treated with increasing concentrations of NMDA and glycine (10/1, 100/10, and 300/30 μM). Ppt1-/- and WT were compared (n = 4 independent experiments, in duplicate) by two-way ANOVA followed by Tukey’s post hoc test and significance was indicated as follows: *p<0.05 and ***p<0.001 where indicated. Error bars represent s.e.m.
Figure 9 with 1 supplement
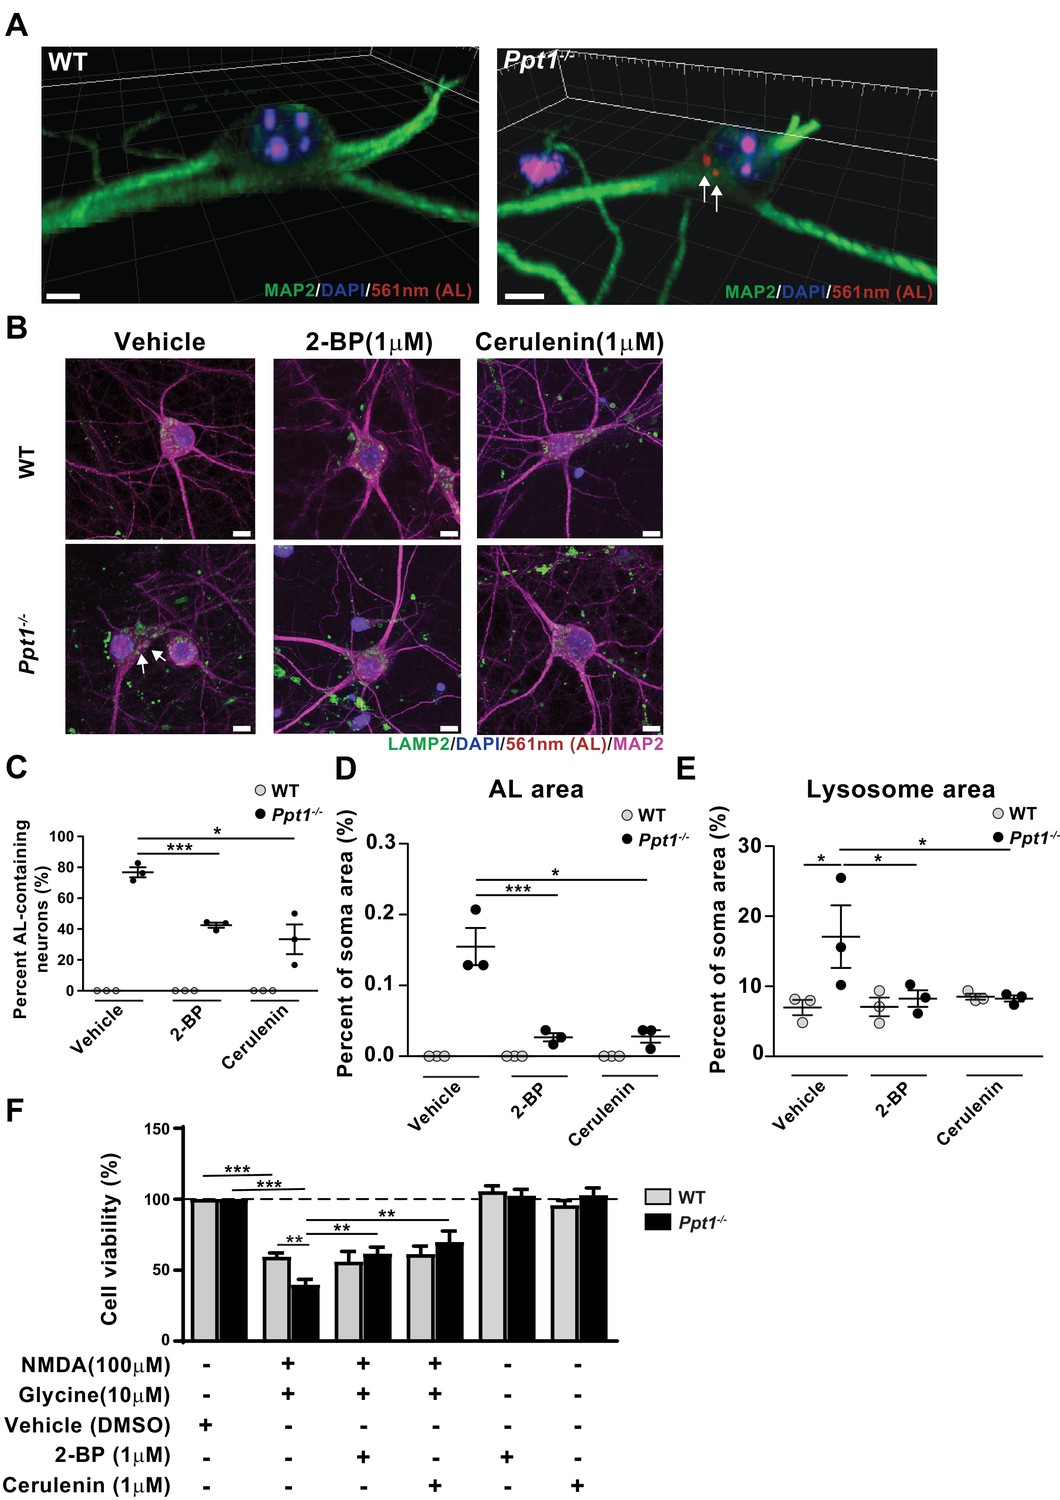
Palmitoylation inhibitors rescue enhanced vulnerability to NMDA-mediated excitotoxicity in Ppt1-/- cultured neurons.
(A) 3D reconstructions of a WT and Ppt1-/- neuron at DIV20. Arrows point to AL deposits. Scale bar = 5 μm (B) Representative collapsed z-stacks of WT and Ppt1-/- DIV20 neurons, demonstrating accumulations of ALs (arrows) within the soma, particularly within LAMP2-positive vesicles, of Ppt1-/- neurons. Note the enlarged lysosomes in Ppt1-/-, vehicle-treated neurons (see Figure 9—figure supplement 1). Scale bar = 10 μm (C) Quantification of the percentage of AL-containing neurons at DIV20 with or without the palmitoylation inhibitors, 2-bromopalmitate (2 BP, 1 μM) and cerulenin (1 μM), treatment for 6d. (D) The percentage of soma area occupied by ALs with or without the palmitoylation inhibitors, 2 BP (1 μM) and cerulenin (1 μM), treatment for 6d. (E) Quantification of the percentage of soma area occupied by lysosomes (LAMP-2-positive vesicles) with and without palmitoylation inhibitor, 2 BP (1 μM) and cerulenin (1 μM), treatment for 6 days. WT, Ppt1-/-, and drug treatment conditions were compared (7–10 neurons/group/experiment, n = 3 independent experiments) by two-way ANOVA followed by Tukey’s post-hoc test and significance indicated as follows: *p<0.05, ***p<0.001 where indicated. (F) Quantification of cellular viability in DIV18-20 WT and Ppt1-/- neurons treated with NMDA and glycine (100/10 μM) with or without pretreatment with vehicle (DMSO) only, 2 BP (1 μM) or cerulenin (1 μM). Values for treatment with 2 BP (1 μM) or cerulenin (1 μM) in the absence of NMDA and glycine are also shown. WT, Ppt1-/-, and drug treatment conditions were compared (n = 4 independent experiments, in duplicate) by two-way ANOVA followed by Tukey’s post-hoc test and significance indicated as follows: **p<0.01, ***p<0.001 where indicated. Error bars represent s.e.m.
Figure 9—figure supplement 1
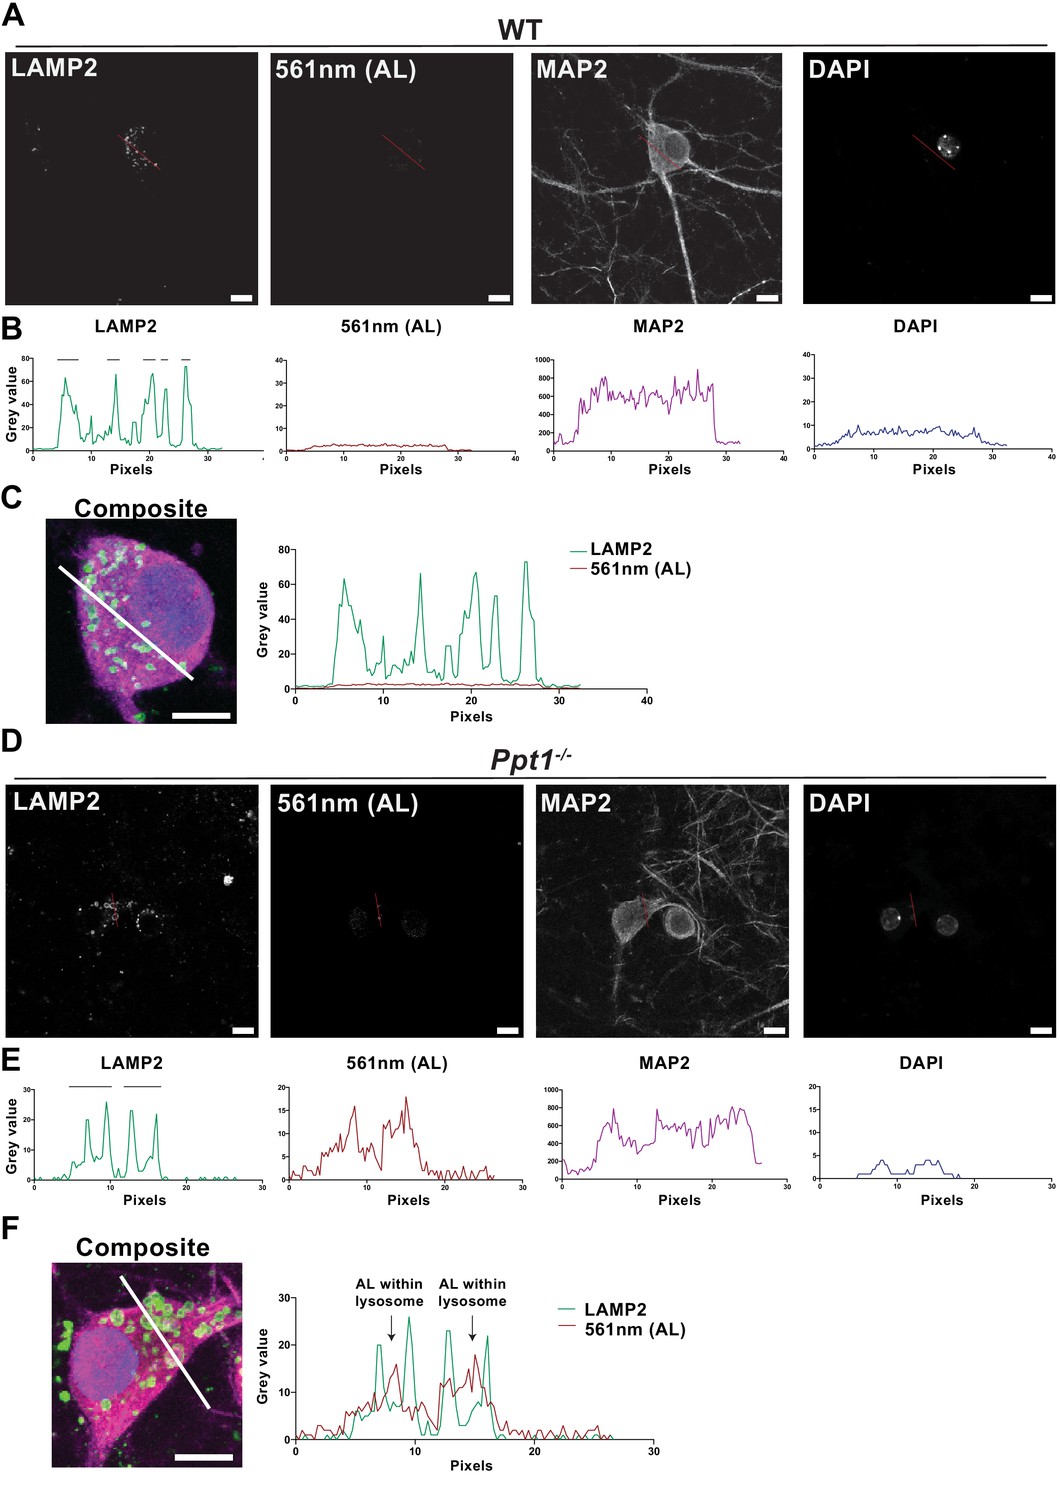
ALs accumulate in enlarged lysosomes of Ppt1-/- neurons.
(A) Single-channel greyscale images of the WT, vehicle-treated representative composite image from Figure 9B displaying LAMP2, 561 nm (AL), MAP2, and DAPI signals individually. Red lines in images correspond to line scans in (B). Scale bar = 10 μm. (B) Fluorescence intensity plots (grey value plots) of the line scans through the WT, vehicle-treated soma for each channel. Note: black bars above the LAMP2 signal plot denote the diameter in pixels of each lysosome captured by the line scan for that cell. (C) Left, magnified composite image of the WT, vehicle-treated soma demonstrating the location of the line scan. Right, line scans for the LAMP2 and 561 nm (AL) channels plotted together. Note the lack of signal in the 561 nm (AL) channel in the WT cell. Scale bar = 10 μm. (D) Single-channel greyscale images of the Ppt1-/-, vehicle-treated representative composite image from Figure 9B displaying LAMP2, 561 nm (AL), MAP2, and DAPI signals individually. Red lines in images correspond to line scans in (E). Scale bar = 10 μm. (E) Fluorescence intensity plots (grey value plots) of the line scans through the Ppt1-/-, vehicle-treated soma for each channel. Note: black bars above the LAMP2 signal plot denote the diameter in pixels of each lysosome captured by the line scan for that cell. (F) Left, magnified composite image of the Ppt1-/-, vehicle-treated soma demonstrating the location of the line scan. Right, line scans for the LAMP2 and 561 nm (AL) channels plotted together. Arrows denote AL deposits (increases in 561 nm (AL) fluorescence) within the enlarged lysosomes (see black bars above LAMP2 line scan) of the Ppt1-/-, vehicle-treated cell. Scale bar = 10 μm.
Figure 10
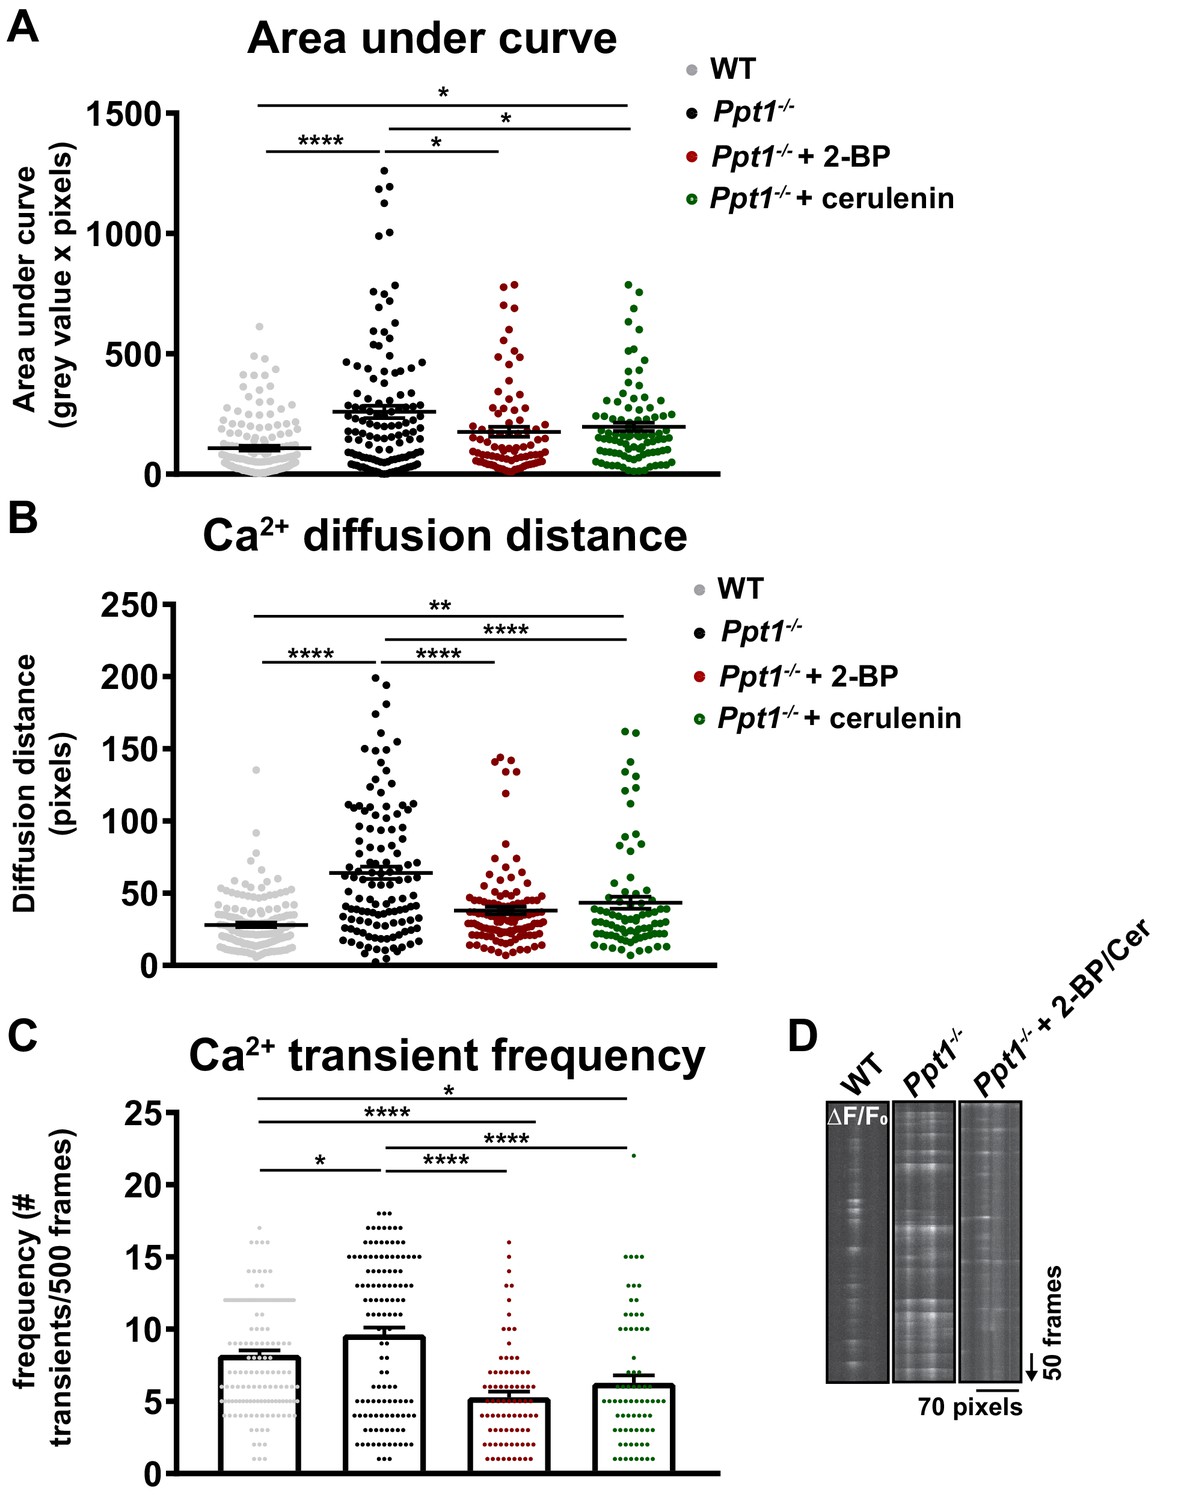
Palmitoylation inhibitor treatment partially reverses pathological calcium dynamics in Ppt1-/- neurons.
A subset of Ppt1-/- cells treated with the palmitoylation inhibitors, 2 BP (1 μM) or cerulenin (1 μM) from DIV12-18 were transfected with GCaMP3 and imaged in the absence of Mg2+ for 5 min. Sites of calcium influx (spontaneous synaptic activity, ΔF/F0) were analyzed. These data were compared to WT and Ppt1-/- groups from Figure 7. (A) Quantification of calcium transient area under the curve (AUC) in WT, Ppt1-/-, Ppt1-/- + 2 BP, and Ppt1-/- + cerulenin-treated groups. (B) Quantification of calcium transient diffusion distance from WT, Ppt1-/-, Ppt1-/- + 2 BP, and Ppt1-/- + cerulenin treated groups. (C) Quantification of calcium transient frequency (# transients/500 frames) for each synaptic site between WT, Ppt1-/-, Ppt1-/- + 2 BP, and Ppt1-/- + cerulenin-treated groups. (D) Representative kymographs displaying the calcium influx (ΔF/F0) at one synaptic site (pixels, X-axis) over the course of 500 frames (arrow represents direction of time in frames) from WT (left), Ppt1-/- (middle), and Ppt1-/- + palmitoylation inhibitor treatment groups. For experiments in Figure 10A–C, WT, Ppt1-/-, Ppt1-/- + 2 BP, and Ppt1-/- + cerulenin groups were compared (n = 185 synaptic sites (WT), n = 131 synaptic sites (Ppt1-/-), n = 85 synaptic sites (Ppt1-/- + 2 BP), n = 82 synaptic sites (Ppt1-/- + cerulenin); 3–4 neurons/group; three individual experiments) by one-way ANOVA followed by Tukey’s post-hoc test and the significance was indicated as follows: *p<0.05,**p<0.01 ****p<0.0001 where indicated. Dots represent values for individual synaptic sites. Error bars represent s.e.m.
Figure 11
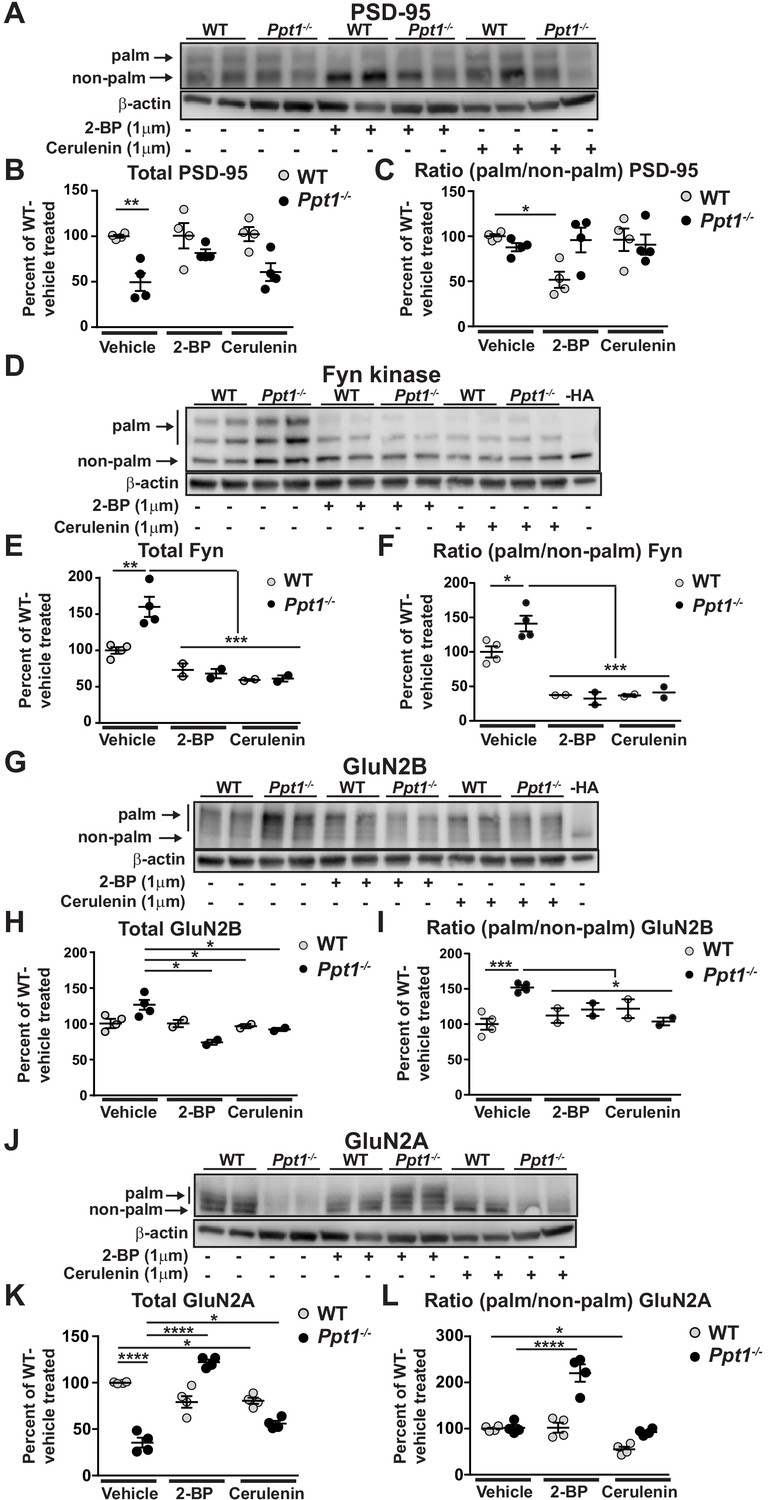
Hyperpalmitoylation of Fyn kinase and GluN2B is reversed in Ppt1-/- primary cortical neurons by palmitoylation inhibitor treatment.
(A) Representative post-APEGS immunoblot of PSD-95 with β-actin loading control. (B) Quantification of total PSD-95 levels following chronic (7d) treatment with vehicle or the palmitoylation inhibitors, 2 BP (1 μM) or cerulenin (1 μM) where indicated. (C) Quantification of the ratio of palmitoylated/non-palmitoylated PSD-95 levels following chronic (7d) treatment with vehicle or the palmitoylation inhibitors, 2 BP (1 μM) or cerulenin (1 μM) where indicated. (D) Representative post-APEGS immunoblot of Fyn kinase with β-actin loading control and minus hydroxylamine (-HA) control. (E) Quantification of total Fyn kinase levels following chronic (7d) treatment with vehicle or the palmitoylation inhibitors, 2 BP (1 μM) or cerulenin (1 μM) where indicated. (F) Quantification of the ratio of palmitoylated/non-palmitoylated Fyn kinase levels following chronic (7 days) treatment with vehicle or the palmitoylation inhibitors, 2 BP (1 μM) or cerulenin (1 μM) where indicated. (G) Representative post-APEGS immunoblot of GluN2B with β-actin loading control and minus hydroxylamine (-HA) control. (H) Quantification of total GluN2B levels following chronic (7d) treatment with vehicle or the palmitoylation inhibitors, 2 BP (1 μM) or cerulenin (1 μM) where indicated. (I) Quantification of the ratio of palmitoylated/non-palmitoylated GluN2B levels following chronic (7 days) treatment with vehicle or the palmitoylation inhibitors, 2 BP (1 μM) or cerulenin (1 μM) where indicated. (J) Representative post-APEGS immunoblot of GluN2A with β-actin loading control. (K) Quantification of total GluN2A levels following chronic (7d) treatment with vehicle or the palmitoylation inhibitors, 2 BP (1 μM) or cerulenin (1 μM) where indicated. (L) Quantification of the ratio of palmitoylated/non-palmitoylated GluN2A levels following chronic (7d) treatment with vehicle or the palmitoylation inhibitors, 2 BP (1 μM) or cerulenin (1 μM) where indicated. DMSO was used for vehicle treatment. For experiments in Figure 11A and D, WT, Ppt1-/-, WT + 2 BP, WT + cerulenin, Ppt1-/- + 2 BP, and Ppt1-/- + cerulenin treatment groups were compared (n = 4 independent experiments) by two-way ANOVA followed by Tukey’s post-hoc test and significance indicated as follows: *p<0.05, **p<0.01, ****p<0.0001 where indicated. For experiments in Figure 11B and C, WT, Ppt1-/-, WT + 2 BP, WT + cerulenin, Ppt1-/- + 2 BP, and Ppt1-/- + cerulenin were compared (n = 2–4 independent experiments) at each time point using two-way ANOVA followed by Tukey’s post-hoc test and the significance was indicated as follows: *p<0.05, **p<0.01, ***p<0.001 where indicated. Error bars represent s.e.m.
Videos
Video 1
Spontaneous calcium activity in DIV16-18 WT neuron.
Representative video of spontaneous neuronal calcium activity in a WT cultured neuron at DIV16-18.
Video 2
Spontaneous calcium activity in DIV16-18 Ppt1-/- neuron.
Representative video of spontaneous neuronal calcium activity in a Ppt1-/- cultured neuron at DIV16-18.
Video 3
Spontaneous calcium activity in DIV16-18 WT neuron before and after treatment with Ro 25–6981.
Representative video of spontaneous neuronal calcium activity in a WT cultured neuron at DIV16-18 prior to, and following, bath application of Ro 25–6981 (1 μM, after 30 s).
Video 4
Spontaneous calcium activity in DIV16-18 Ppt1-/- neuron before and after treatment with Ro 25–6981.
Representative video of spontaneous neuronal calcium activity in a Ppt1-/- cultured neuron at DIV16-18 prior to, and following, bath application of Ro 25–6981 (1 μM, after 31 s).
Video 5
Spontaneous calcium activity in DIV18 Ppt1-/- neuron treated with 2 BP (1 μM, from DIV12-18).
Representative video of spontaneous neuronal calcium activity in a Ppt1-/- cultured neuron that was treated from DIV12-18 with 2 BP, at a dose of 1 μM. The last treatment was 4–6 hr before the imaging session.
Video 6
Spontaneous calcium activity in DIV18 Ppt1-/- neuron treated with cerulenin (1 μM, from DIV12-18).
Representative video of spontaneous neuronal calcium activity in a Ppt1-/- cultured neuron that was treated from DIV12-18 with cerulenin, at a dose of 1 μM. The last treatment was 4–6 hr before the imaging session.
Video 7
Spontaneous calcium activity in DIV18 Ppt1-/- neuron treated with vehicle (DMSO, from DIV12-18).
Representative video of spontaneous neuronal calcium activity in a Ppt1-/- cultured neuron that was treated from DIV12-18 with DMSO as vehicle. The last treatment was 4–6 hr before the imaging session.
Tables
Key resources table
| Reagent type (species) or resource | Designation | Source or reference | Identifiers | Additional information |
|---|---|---|---|---|
| Strain, strain background (Mus musculus) | B6;129-Ppt1tm1Hof/J | Jax stock #: 004313 | Gupta et al., 2001; RRID:MGI:004313 | |
| Antibody | Rabbit polyclonal anti-GluN2A | Novus Biologicals | Cat: NB300-105; RRID:AB_10001400 | (1:1000) |
| Antibody | Mouse monoclonal anti-GluN2B | UC Davis/NIH NeuroMab Facility | Cat: 75/097; RRID:AB_10673405 | (1:1000) |
| Antibody | Mouse monoclonal anti-GluN1 | UC Davis/NIH NeuroMab Facility | Cat: 75/272; RRID:AB_11000180 | (1:1000) |
| Antibody | Mouse monoclonal anti-PSD-95 | UC Davis/NIH NeuroMab Facility | Cat: K28/74; RRID:AB_2315909 | (1:2000) |
| Antibody | Mouse monoclonal anti-SAP102 | UC Davis/NIH NeuroMab Facility | Cat: N19/2; RRID:AB_2261666 | (1:2000) |
| Antibody | Rabbit polyclonal anti-Fyn | Cell Signaling | Cat: 4032 | (1:1000) |
| Antibody | Rabbit polyclonal anti-PPT1 | Gift from Sandra Hofmann | (1:500); Dr. Hofmann | |
| Antibody | Mouse monoclonal anti-β-actin-HRP | ThermoFisher Scientific | Cat: MA5-15739-HRP; RRID:AB_2537667 | (1:2000) |
| Antibody | Rabbit polyclonal anti-MAP2 | Millipore Sigma | Cat: AB5622; RRID:AB_91939 | (1:400) |
| Antibody | Rat monoclonal anti-LAMP2 | abcam | Cat: ab13524; RRID:AB_2134736 | (1:400) |
| Recombinant DNA reagent | pEF-GFP | Addgene | Plasmid: 11154 | Drs. Matsuda and Cepko |
| Recombinant DNA reagent | G-CaMP3 | Addgene | Plasmid: 22692 | Dr. Looger |
| Commercial assay or kit | PrestoBlue cell viability assay | ThermoFisher Scientific | Cat: A13261 | |
| Chemical compound, drug | 2-bromopalmitate | Sigma | Cat: 238422 | Treatment: 1 μM |
| Chemical compound, drug | cerulenin | Cayman Chemicals | Cat: 10005647 | Treatment: 1 μM |
| Software, algorithm | Fiji |
Additional files
-
Supplementary file 1
Mean values, s.e.m., and n for the bar chart in Figure 1C.
Values are represented for each layer, at each age in WT and Ppt1-/- mice.
- https://doi.org/10.7554/eLife.40316.022
-
Transparent reporting form
- https://doi.org/10.7554/eLife.40316.023
Download links
A two-part list of links to download the article, or parts of the article, in various formats.
Downloads (link to download the article as PDF)
Open citations (links to open the citations from this article in various online reference manager services)
Cite this article (links to download the citations from this article in formats compatible with various reference manager tools)
Developmental NMDA receptor dysregulation in the infantile neuronal ceroid lipofuscinosis mouse model
eLife 8:e40316.
https://doi.org/10.7554/eLife.40316


