PLZF targets developmental enhancers for activation during osteogenic differentiation of human mesenchymal stem cells
- University of Copenhagen, Denmark
- Cambridge Institute for Medical Research and Welcome Trust/MRC Stem Cell Institute, University of Cambridge, United Kingdom
- University Medical Center, Netherlands
- Cancer Computational Biology Center, University Medical Center, Netherlands
- The Novo Nordisk Center for Stem Cell Biology, Faculty of Health and Medical Sciences University of Copenhagen, Denmark
- Memorial Sloan Kettering Cancer Center, United States
Figures
Figure 1 with 2 supplements
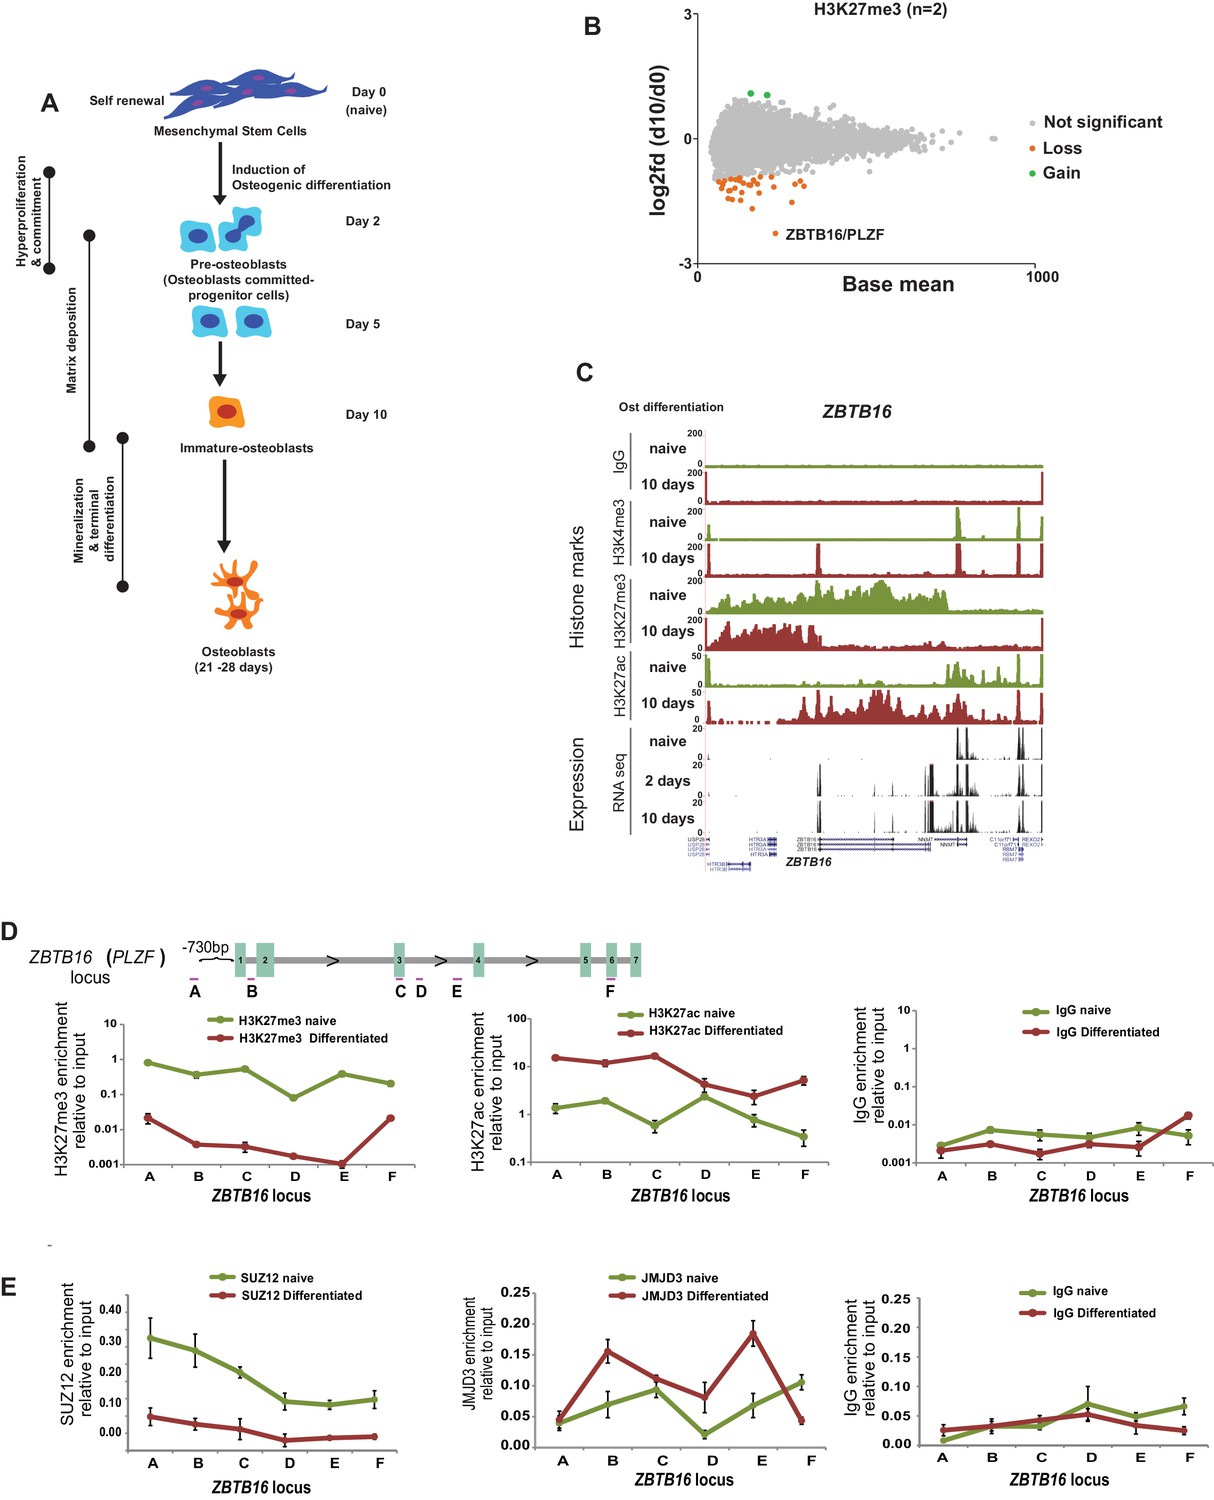
Epigenome and transcriptome profiling in hMSCs during osteogenic differentiation.
(A) Schematic presentation of osteogenic (Ost) differentiation of hMSCs. (B) Scatter diagram of base mean (X-axis) and log2 fold differences in H3K27me3 levels (Y-axis) in immature osteoblasts relative to naive hMSC. Values were quantified from two replicates within ± 5 kbp of each TSS, and genes with a significant gain or loss were colored green or orange, respectively. ChIP-seq signal for H3K27me3 (biological replicates) in naive hMSCs and immature-osteoblasts (day 10 of osteogenic differentiation) were quantified at 8,822 TSS (±5 kbp), and analyzed by Deseq2. Green dots represent gene loci with gain of H3K27me3, while orange dots represent gene loci with loss of H3K27me3 (see details in Materials and methods and Supplementary file 3). As indicated, the largest loss of H3K27me3 was observed at the ZBTB16/PLZF locus in immature osteoblasts. (C) ChIP-seq tracks for histone marks and RNA-seq tracks for transcripts are shown for naive hMSCs (day 0) and immature osteoblasts for the ZBTB16/PLZF gene locus. (D) Upper part is a schematic presentation of the ZBTB16 locus (an upstream region; exons 1–7; coding exons 2–7) showing the position of primers used for ChIP-QPCR (marked A-F). Lower panel represents ChIP-QPCR validation of H3K27me3 loss, and H3K27ac gain. The data shown represents three biological replicates shown as average of triplicate values from QPCR ± SD. (E) Loss of Polycomb (SUZ12) binding and increased JMJD3 enrichment after 2 days of osteogenic differentiation analyzed by ChIP-QPCR. The data shown represents three independent experiments and are averages of triplicate samples from QPCR ± SD. General IgG was used as control in ChIP-QPCR.
-
Figure 1—source data 1
Validation of PLZF antibody in ChIP by PLZF kncokdown.
- https://cdn.elifesciences.org/articles/40364/elife-40364-fig1-data1-v2.xlsx
Figure 1—figure supplement 1
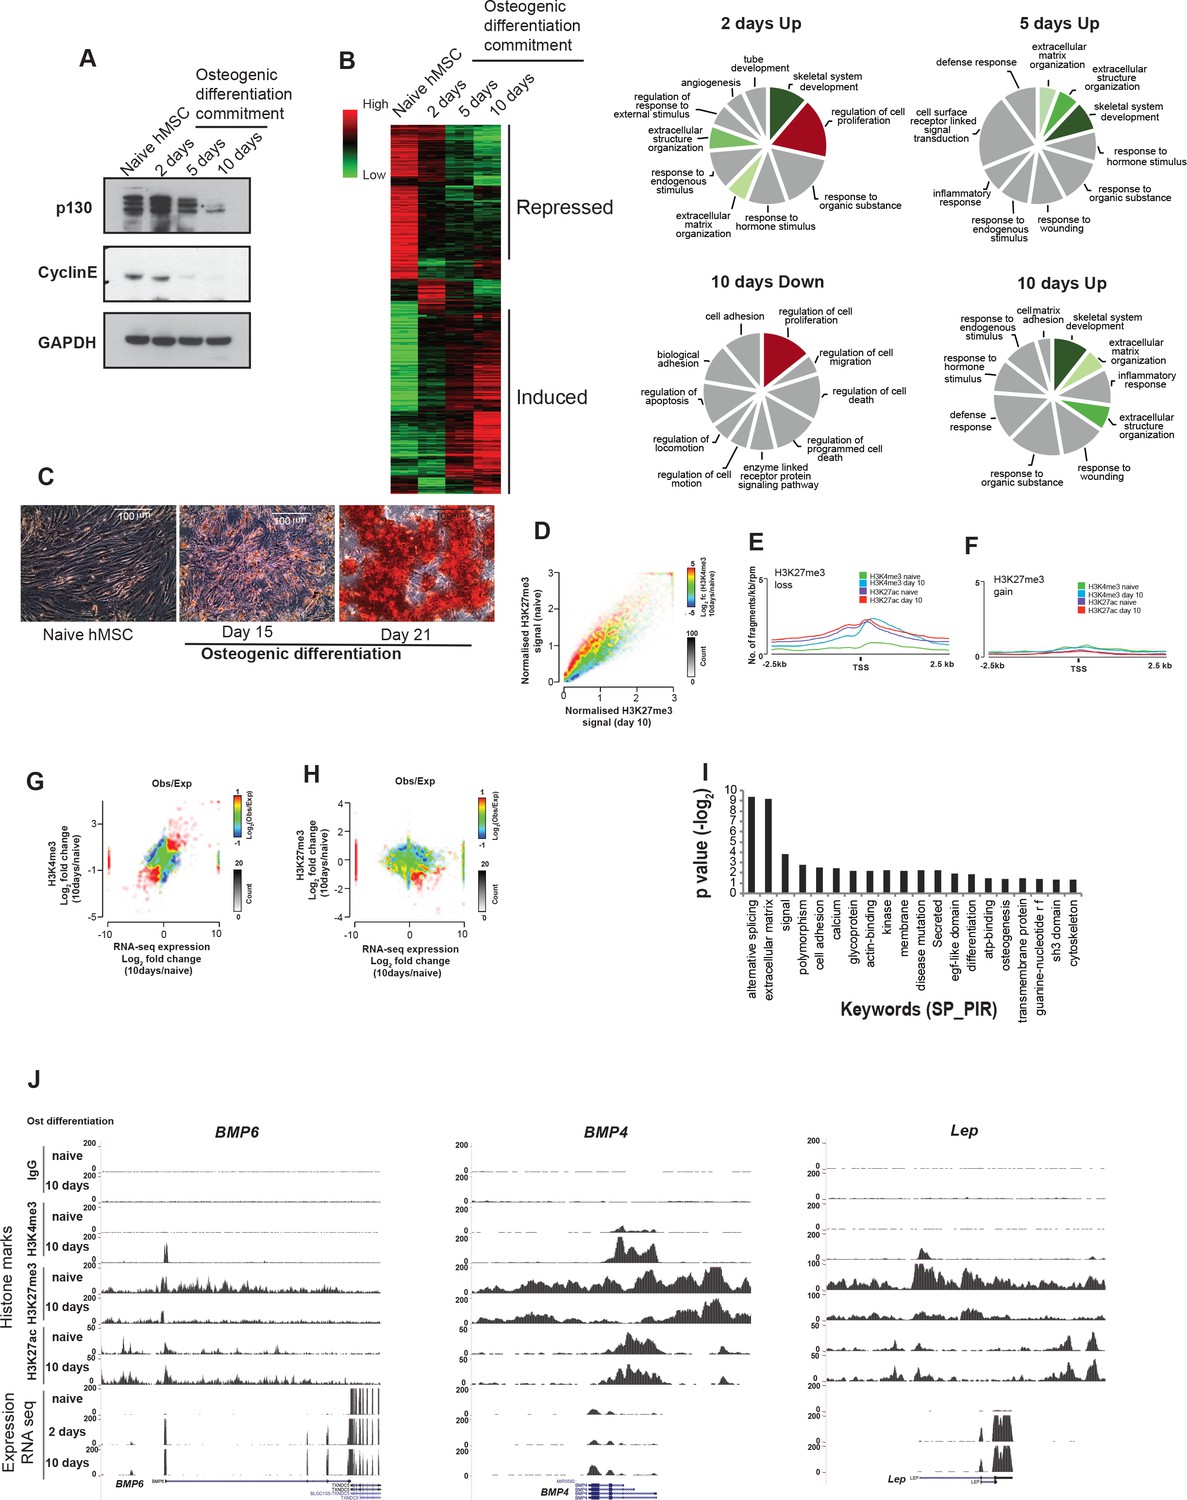
After induction of differentiation, the hMSCs cells undergo a hyperproliferative phase within the first 2 days followed by growth arrest and differentiation.
The dynamics of this transition can be revealed by: (A) Western blot for retinoblastoma2 (pRB2, also known as p130) and Cyclin E. Cyclin E is expressed in naïve proliferating (day0) and hyperproliferating (day2) hMSCs and pRB2 (p130) is abundant and hyper-phosphorylated (marked by*) when cyclin E is present (Howard et al., 2000). pRB2 becomes hypo-phosphorylated and reduced in amounts when cyclin E is downregulated and cells cease to proliferate and start to differentiate. The antibodies used for Western blotting are pRB2 (Santa Cruz, SC317) CyclinE (mab, HE12). (B) Microarray analyses done in three biological replicates in hMSCs at the indicated time points using Affymetrix gene chips (HT_HG-U133_Plus_PM). The data were analyzed by ‘array tools’ and represented as heatmaps. In the right hand side, the Pie chart represents the enrichment of key words from genes that were significantly induced (1.5 fold) following induction of osteogenic differentiation at day 2 (n = 537), day 5 (n = 590) or day 10 (n = 641) or reduced at day 10 (n = 578) compared to naïve hMSCs analysed by DAVID (Huang et al., 2009). The global gene expression profile showed genes related to ‘induction of cell proliferation’ as well as ‘skeletal system development’ at day 2. The ‘proliferation associated genes’ were downregulated at day 10. ‘Skeletal system developmental genes’ continued to increase in expression at later time points (day 5 and 10). (C) Alizarin red staining in naive or late time points of osteogenic differentiation (15 days and 21 days) shows strong red staining representing calcium precipitates after 21 days. The pictures were taken using Leica camera (EC3) attached to an inverted microscope at 20X. A scale bar (100 µm) is shown in the picture. Together, these results confirmed that the earliest time point (day 2) represents a hyper-proliferative, but committed state (pre-osteoblasts), whereas day 10 reflects the immature-osteoblasts stage). Mineralization and osteoblasts maturation starts to take place after 15 days of differentiation. (D) Pseudo-colored 2D histogram showing the H3K27me3 ChIP-seq signal quantified at gene transcripts from start to end ± 1 Kb (n = 44,451) in naive hMSCs (day 0) (Y-axis) and at day 10 of osteogenic differentiation (X-axis) in relation to changes in H3K4me3 levels. H3K27me3-positive genomic regions (n = 44,451) are pseudo-colored according to the average log2 fold changes in H3K4me3 (day10/naive hMSC) upon osteogenic differentiation. Regions that gain H3K4me3 are colored red, and regions with loss in H3K4me3 are colored blue. A bar showing the relationship between coloring and H3K4me3 changes can be seen at the side of the plot. (E) and (F) Average distribution of H3K4me3 and H3K27ac histone marks at TSS ± 2.5 kb of transcripts that loose (red colored regions in S1E) or gain (blue colored regions in S1E) the H3K27me3 mark during 10 days of osteogenic differentiation (immature-osteoblasts stage). (G and H) Scatter plot of the observed (Obs) to/expected (Exp) ratio indicating the positive correlation between H3K4me3 and gene expression and a negative correlation between H3K27me3 and gene expression (highlighted in red) during osteogenic differentiation.I) GO term analyses of transcripts that lost H3K27me3 and gained H3K4me3 and were induced in expression using DAVID (The Database for Annotation, Visualization and Integrated Discovery, n = 5179). The Y-axis represents the –logP value (with Benjamini correction cut off < 0.05) (J) Genome browser tracks representing ChIP-seq tracks from naive and immature-osteoblasts (10 days of osteogenic differentiation) at gene loci where loss in H3K27me3 and gain in H3K4me3 and H3K27ac at TSS are shown. BMP, Bone Morphogenetic Protein; Lep, Leptin.
Figure 1—figure supplement 2
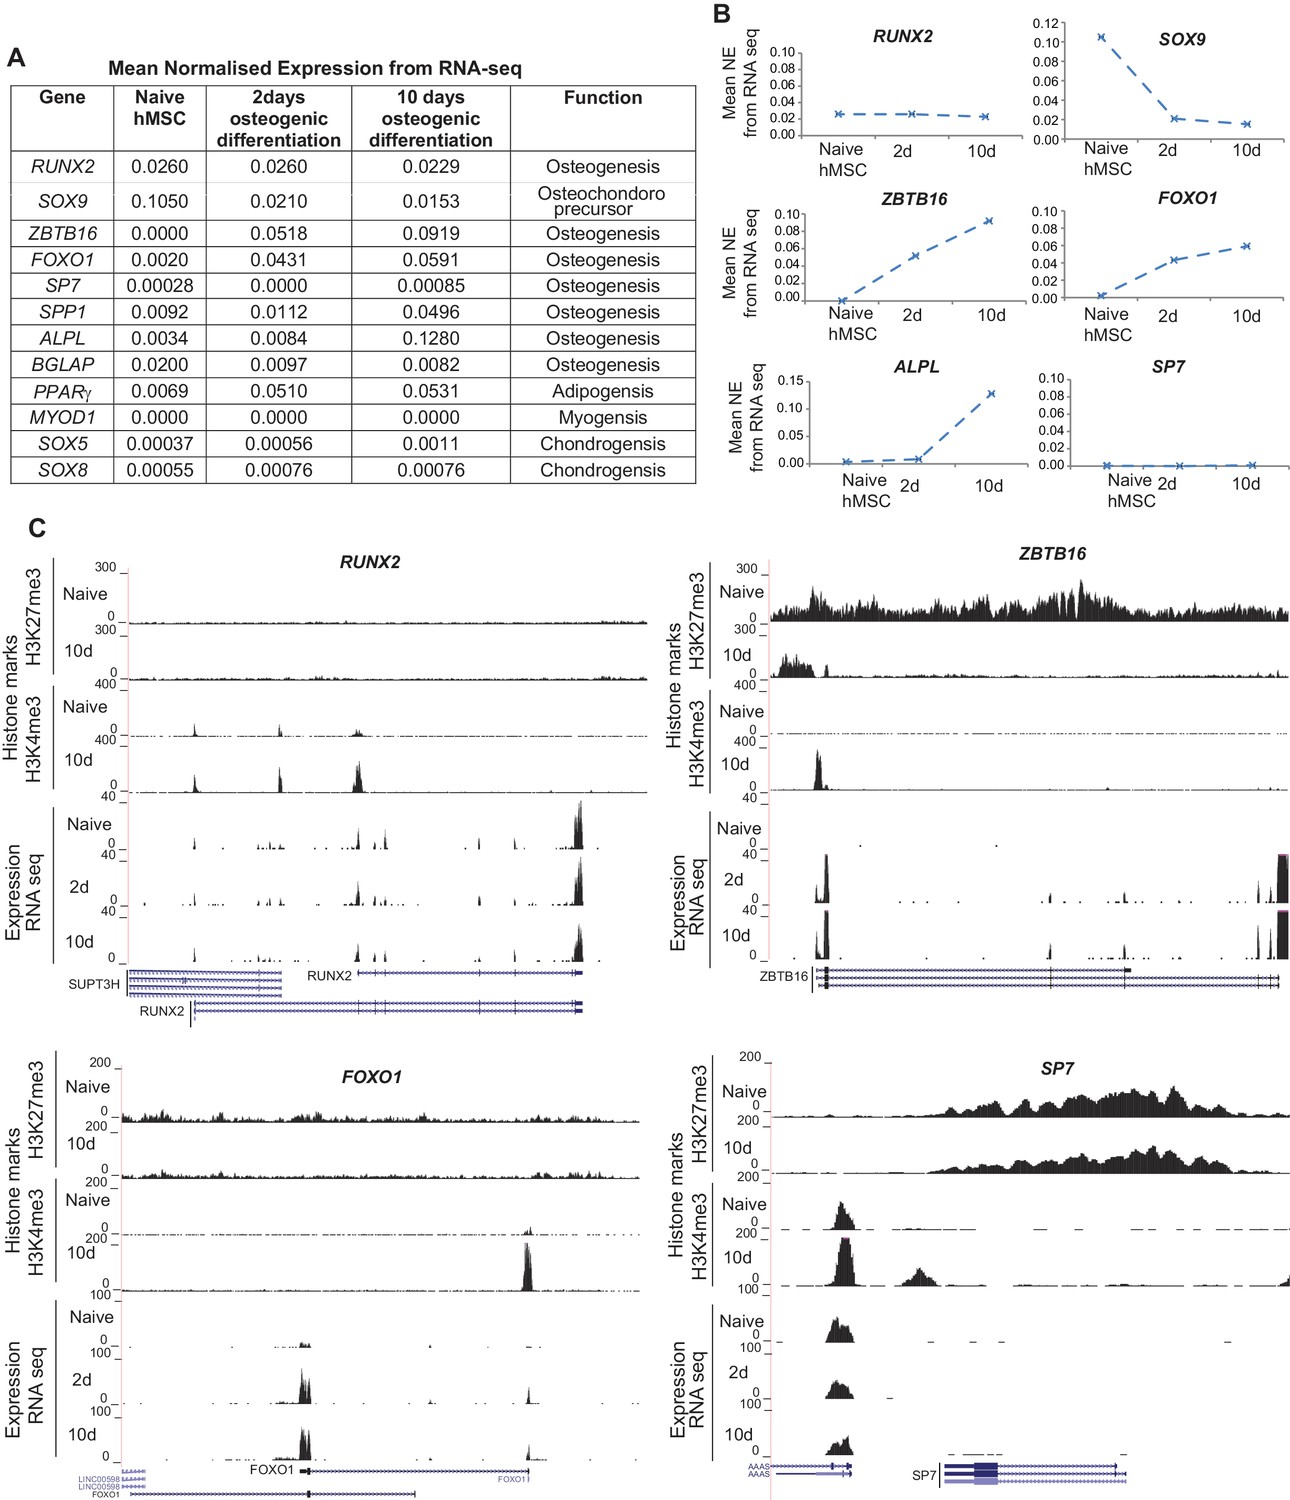
(A) The table shows the mean normalized expression (NE) values for indicated TF and markers obtained from RNA-seq during osteogenic differentiation of hMSCs based on three biological replicates.
(B) On the right hand side, the mean normalized expression values ± SD are plotted and represented as graphs for selected genes. (C) Genome browser tracks showing histone marks obtained from ChIP-seq and expression from RNA-seq for selected gene loci in niave hMSCs and after induction of osteogenic differentiation at the indicated time points. RUNX2, Runt related transcription factor-2; ZBTB16, Zinc finger and BTB domain containing 16; FOXO1, Forkhead box O1; SP7, Transcription factor 7/Osterix.
Figure 2 with 2 supplements
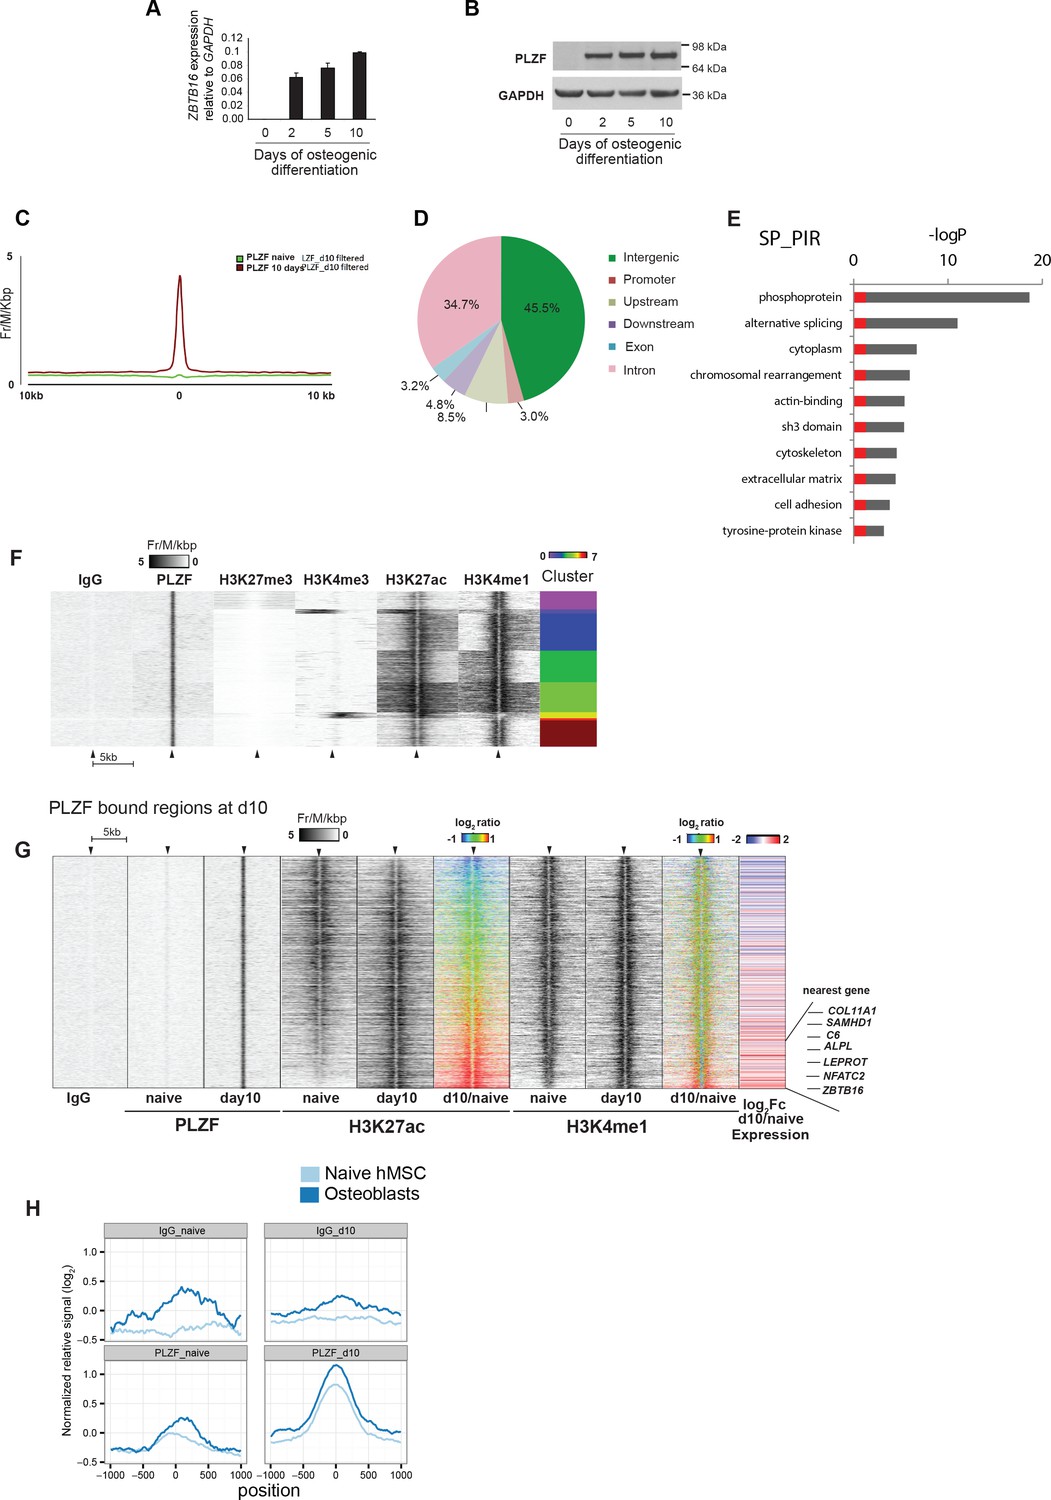
PLZF induction and binding to enhancers during osteoblasts commitment of progenitor cells.
(A) PLZF expression during early osteogenic differentiation of hMSCs shown by (A) RT-QPCR (ZBTB16) and (B) western blot. GAPDH was used as a loading control. (C) Average tag density plot for PLZF peaks from ChIP-seq in naive hMSCs or immature-osteoblasts (day 10). Peak finding revealed 2,282 specific PLZF peaks in immature-osteoblasts (Supplementary file 4). See Supplementary Methods for details regarding peak finding analyses. (D) Pie chart showing the percentage of PLZF peaks (n = 2,282) that overlapped with different genomic regions; promoter (−1 kb to TSS, n = 70); upstream (−10 kb to TSS excluding promoters, n = 195); downstream (+10 kb from the end of the gene, n = 110); exon (n = 75); intron (n = 792); and intergenic (> ± 10 kb from TSS or end of the gene, n = 1,040). (E) GO term analyses of genes nearby to PLZF peaks (n = 2,282) observed by DAVID (The Database for Annotation, Visualization and Integrated Discovery) (Huang da, Bailey et al., 2009). The key words enriched are displayed in the plot. The Y-axis represents the Benjamini Hochberg corrected –LogP value. Grey parts of the bars are above a 0.05 cut-off. (F) Heat-maps at PLZF peaks (n = 2,282) clustered according to local densities of the H3K27me3, H3K4me3, H3K27ac and H3K4me1 histone marks in immature-osteoblasts. ChIP-seq signals from each antibody were normalized to library sizes and visualized at PLZF peaks ± 5 kb. Only PLZF peaks specific for day 10 of osteogenic differentiation were included, and peaks with PLZF signal at day 0 were excluded (for threshold and genomic peak positions please see Supplementary file 3, and Supplementary methods). (G) Heat maps showing the changes in H3K27ac and H3K4me1 at PLZF peaks (n = 2,282), and expression of the nearest gene in naive hMSCs (day 0) and immature osteoblasts. The distribution of normalized H3K27ac or H3K4me1 ChIP seq signal in naïve hMSCs or immature osteoblasts is shown in the heat maps, centered at PLZF peaks identified in immature osteoblasts (± 5 kb). The ratiometric heatmap depicts the changes in H3K27ac and H3K4me1 levels in immature-osteoblasts compared to naive hMSCs (log2fc day10/naïve) and all heatmaps were sorted according to the H3K27ac ratio with the highest day10/naive H3K27ac ratio at the bottom. Gain is colored red (log2 fold ≥ 1, corresponds to 403 PLZF peaks), no change is colored green (log2 fold>-1 and < 1, n = 1,844 PLZF peaks) and loss is colored blue (log2 fold ≤ 1, n = 35 PLZF peaks). The RNA-seq based heat-map shows the log2fc in expression (day10/naive) of nearest transcript mapped to the center of individual PLZF peaks. Transcripts with induced expression are colored red, while blue coloring reflects decreased expression between naïve hMSCs and immature osteoblasts. Examples of genes with increased expression correlating with increased H3K27ac and PLZF binding at nearest genomic region (enhancer) are indicated on the right side. COL11A1, Collagen11A1; SAMHD1, SAM domain and HD domain1; C6, Complement Component 6; NFATC2, nuclear factor of activated T-cells; ALPL, Alkaline Phosphatase; LEPROT, Leptin Receptor Overlapping Transcript; ZBTB16, Zinc Finger and BTB Domain Containing Protein 16. (H) Average normalized ChIP-seq pile-up signal from PLZF or IgG control in naive hMSCs or immature-osteoblasts,± 1 kb around midpoints of enhancers (defined by FANTOM5) transcribed in mesenchymal stem cells (naive hMSCs) and osteoblasts. Pile-up signal was normalized to the average base pair signal across all FANTOM5 enhancers (n = 43,011).
Figure 2—figure supplement 1
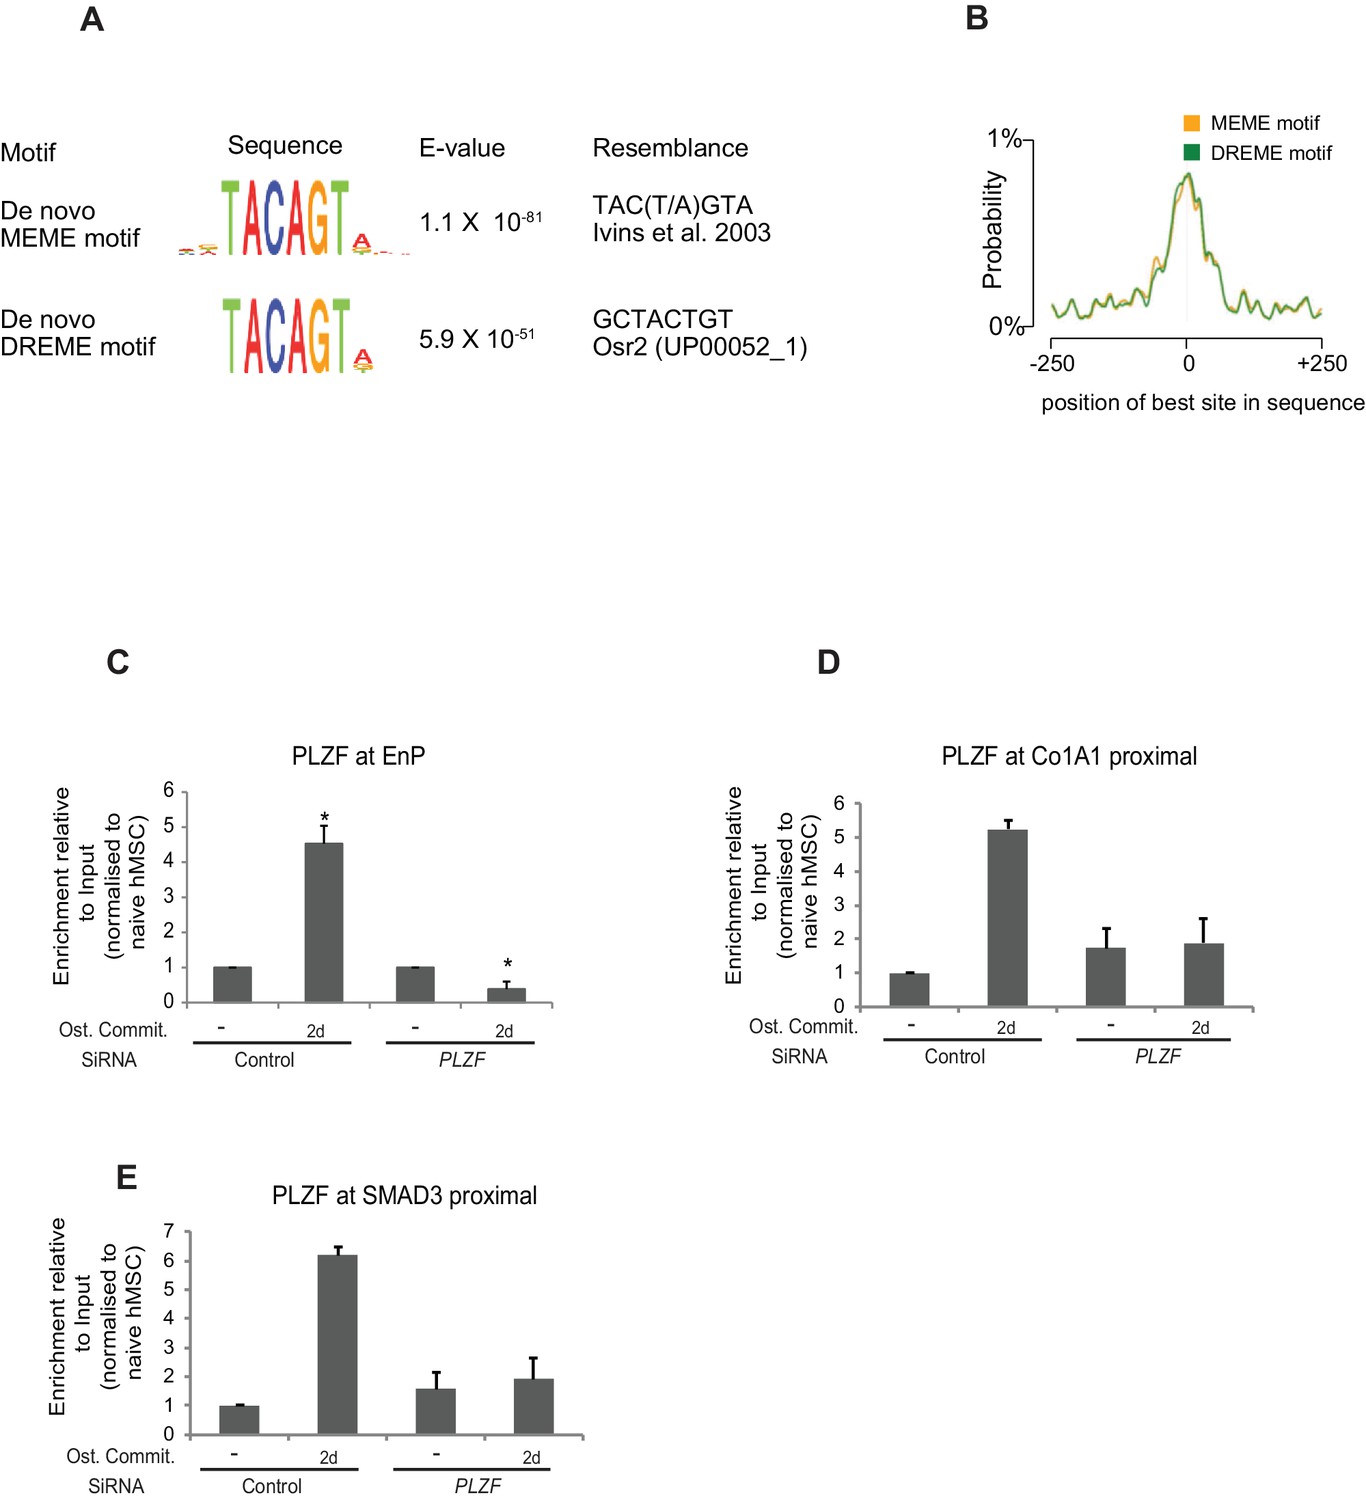
(A) Top motifs and output from discriminative de novo motif analysis of d10 PLZF peaks and random negative control regions matched to the peaks in terms of TSS distance and orientation.
The most significantly enriched motif from two different algorithms are shown. (B) Profile of the average motif enrichment across PLZF peaks. Both output from MEME and DREME are centrally enriched at the PLZF peaks. (C) Validation of specificity of the PLZF antibody in ChIP was performed by siRNA mediated PLZF knockdown followed by osteogenic induction for 2 days. (C) The ChIP-QPCR data is shown in the plot at the EnP element. Data shows mean ± SD from triplicates of QPCR from three biological replicates (p < 0.05, two tailed t-test). DPLZF bound genomic region proximal to Col1A1 gene. Data shows mean ± SD from triplicates of QPCR. (E) PLZF bound genomic region proximal to SMAD3 gene. Data shows mean ± SD from triplicates of QPCR.
-
Figure 2—figure supplement 1—source data 1
Validation of PLZF antibody in ChIP by PLZF kncokdown.
- https://cdn.elifesciences.org/articles/40364/elife-40364-fig2-figsupp1-data1-v2.xlsx
Figure 2—figure supplement 2
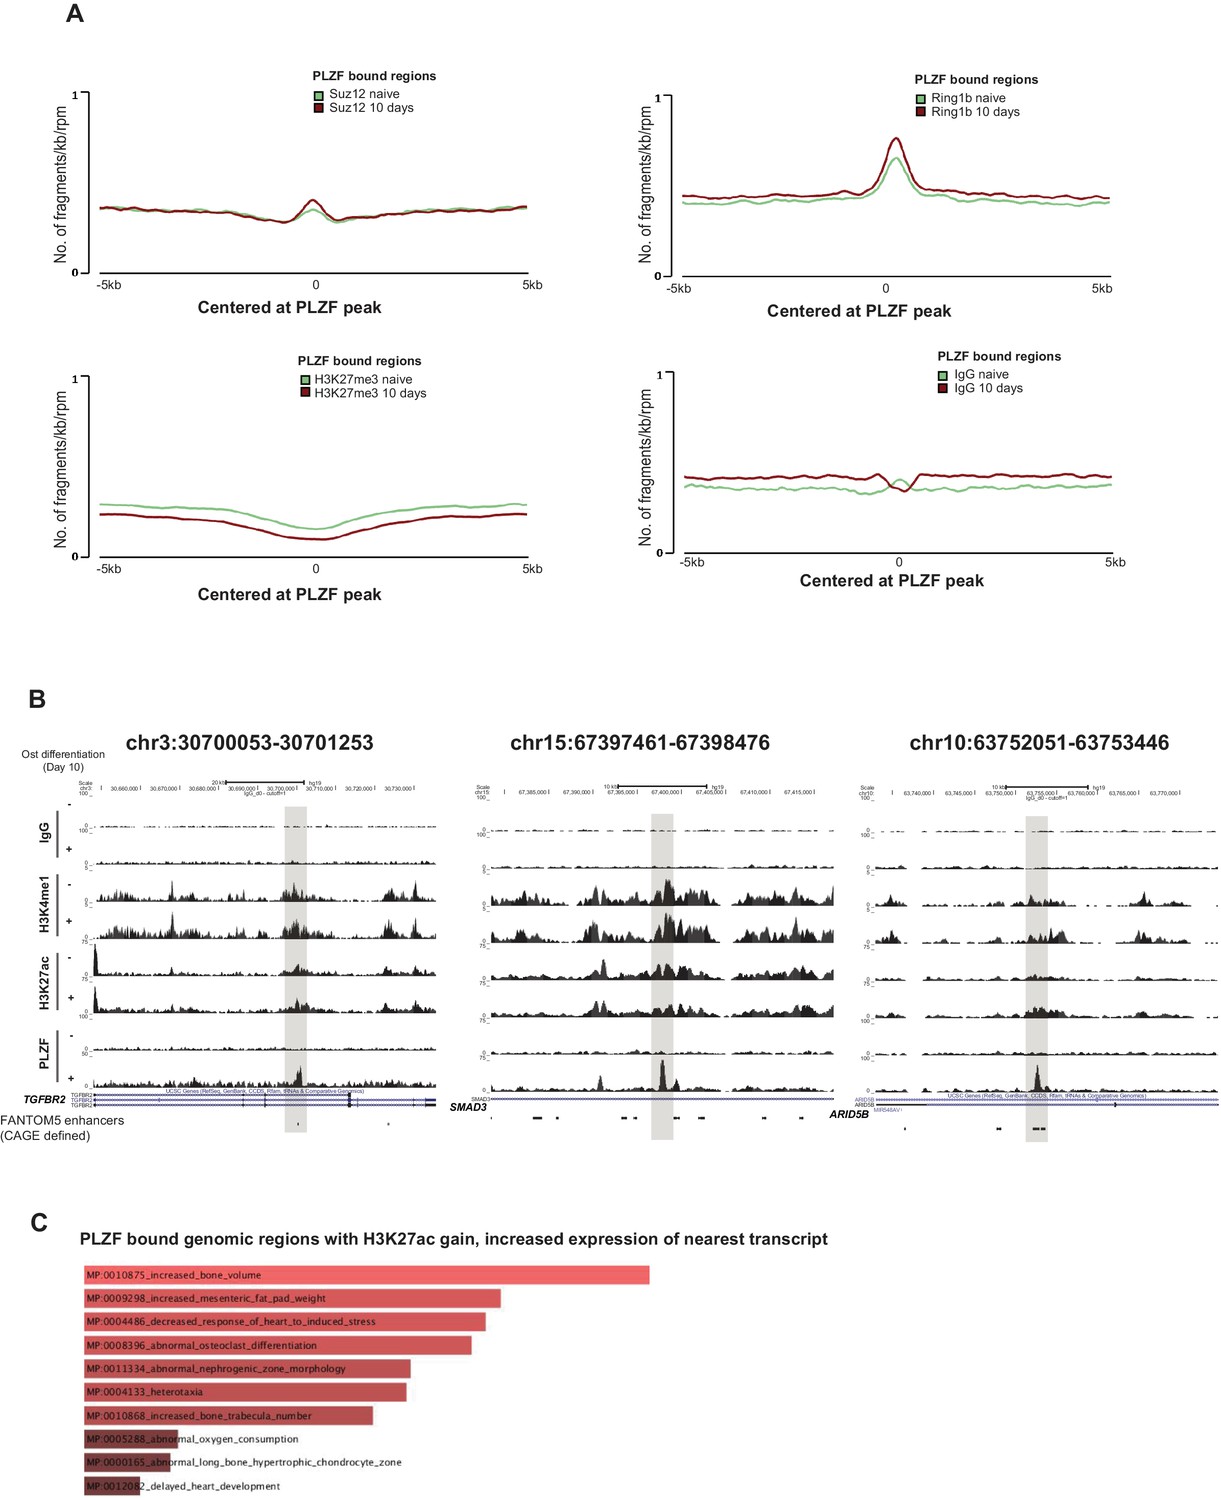
(A) Average tag distribution plots show co-occurrence of PLZF with Polycomb (SUZ12, RING1B) or H3K27me3 in hMSCs before and after osteogenic differentiation for 10 days (immature-osteoblasts) centered at PLZF peak ± 5 kb.
(B) ChIP-seq tracks representing genomic region that gained H3K4me1, H3K27ac and PLZF binding in immature osteoblasts (highlighted in grey box). The overlap with FANTOM5 enhancers are indicated at the bottom of the tracks. (C) Gene ontology analyses using Enrichr (Chen et al., 2013) showing MGI_mammalian phenotype significantly enriched in our data sets of PLZF bound genomic regions that gained H3K27ac and showed increased expression of nearest transcript.
Figure 3 with 1 supplement
PLZF-dependent H3K27 acetylation and osteogenic-specific gene expression.
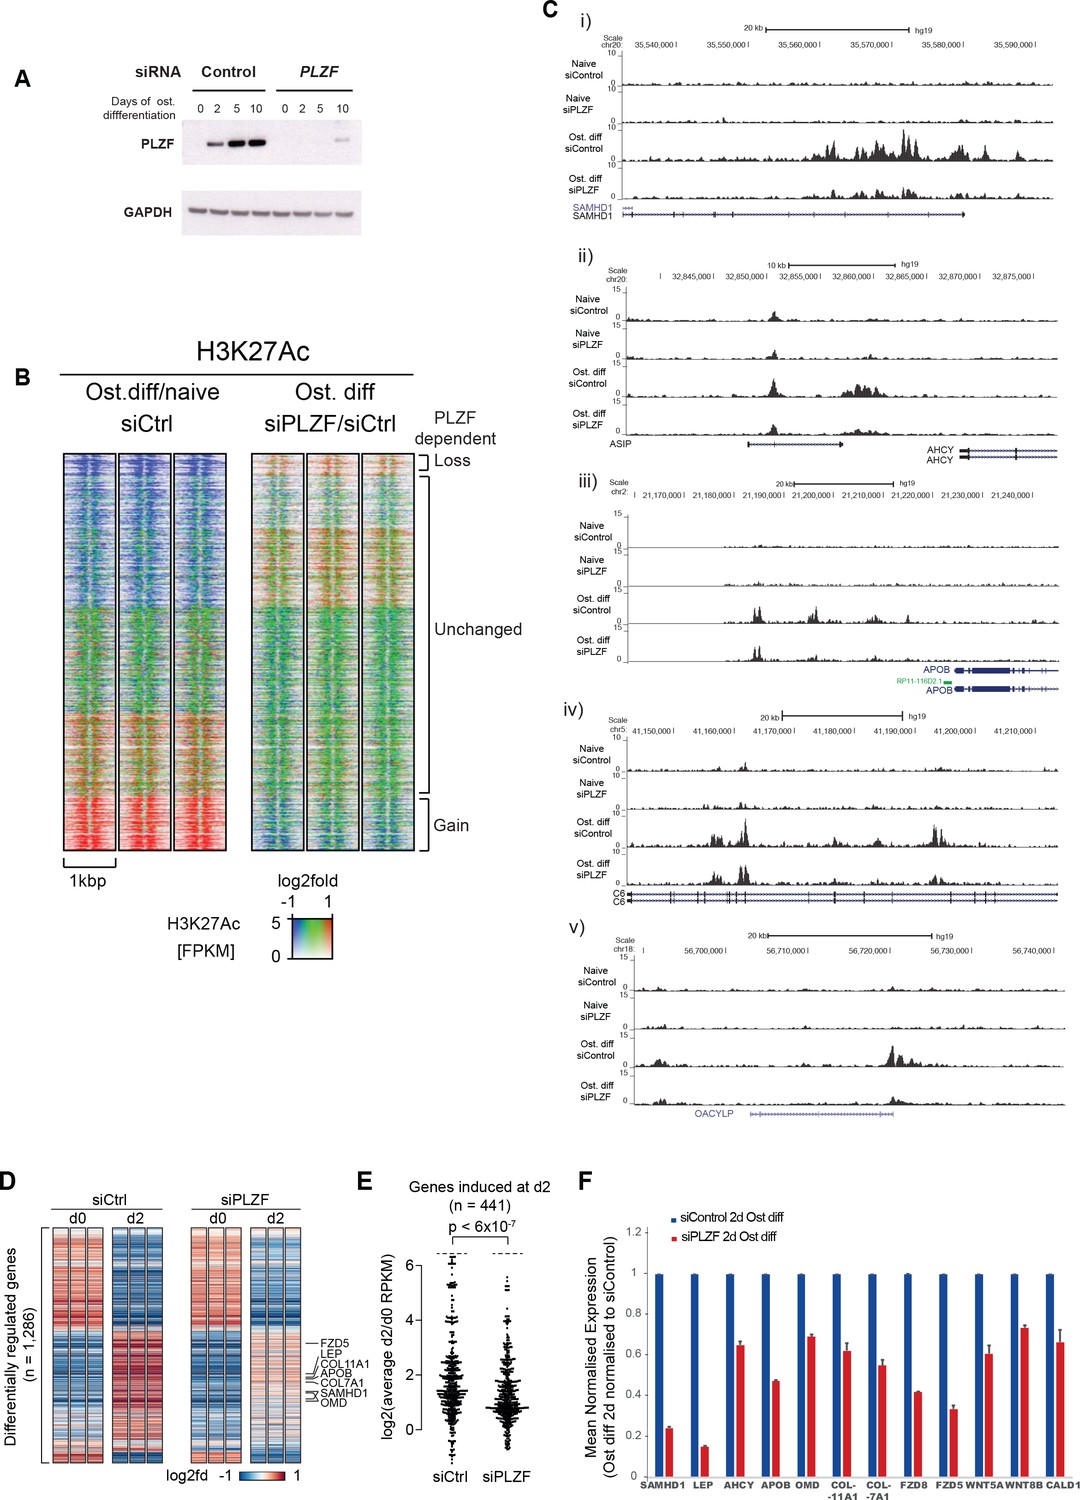
(A) Time course of PLZF expression before and after siRNA mediated knockdown in naïve and osteogenic-induced hMSCs by western blot. GAPDH was used as loading control. (B) Ratiometric heat maps showing the changes in H3K27ac at PLZF peaks (n = 2,282) in control (siCtrl, left side) or the effect of PLZF knockdown (siPLZF, right side) in hMSCs. The distribution of normalized H3K27ac ChIP seq signal in naive or in 2-day osteogenic differentiation-induced hMSCs is shown, centered at PLZF peaks (± 500 bp). Regions were clustered according to the log2fd (compared to average values for all conditions) in each of the three biological replicates for each condition. The regions that loose H3K27ac upon induction of osteogenic differentiation are colored in blue while regions that gain H3K27ac are marked red. Regions without changes are depicted in green. (C) Genome browser tracks representing examples of genomic regions that gain H3K27ac in a PLZF-dependent manner upon induction of osteogenic differentiation (day 2). (D) Genes induced in osteoblast commited progenitor cells had reduced expression in the absence of PLZF, as observed by RNA-seq. Heatmaps representing the RPKM-values of differentially regulated genes from RNA-seq of PLZF knock down or control siRNA transfected hMSCs (done in three biological replicates) at 2 days of osteogenic induction. RPKM-values are log2 normalized to the average signal of all 12 samples (Control siRNA and PLZF siRNA transfected from naive and osteogenic induced 2d). The vertical order is similar to the clustered heatmap from differentially regulated genes from microarray analyses shown in Figure 1—figure supplement 1B (n = 1286 genes). (E) Beeswarm plots comparing the log2 fold difference between PLZF knock down or control siRNA transfected hMSCs harvested at day 0 and day 2. Plots shows the average RPKM values from RNA-seq performed in three biological replicates, and the p-value is calculated using a Mann-Whitney U-test. (F) The mean normalized expression of selected osteogenic lineage-specific genes in hMSCs after induction of osteogenic differentiation (2 days) in control siRNA or PLZF siRNA-transfected hMSCs. The values are averages from three biological replicates ± SD. SAMHD1, SAM and HD domain containing deoxynucleoside triphosphate triphosphohydrolase 1; LEP, Leptin; AHCY, Adenosylhomocysteinase; OMD, Osteomodulin; COL11A1, Collagen Type XI Alpha 1 Chain; COL7A1, Collagen Type VII Alpha 1 Chain; FZD8, Frizzled Class Receptor 8; FZD5, Frizzled Class Receptor 5; WNT5A, Wingless-Type MMTV Integration Site Family, Member 5A; WNT8B, Wingless-Type MMTV Integration Site Family, Member 8B; CALD1, Caldesmon 1.
-
Figure 3—source data 1
Mean normalised expression of selected transcripts from RNA seq analyses.
- https://cdn.elifesciences.org/articles/40364/elife-40364-fig3-data1-v2.xlsx
Figure 3—figure supplement 1
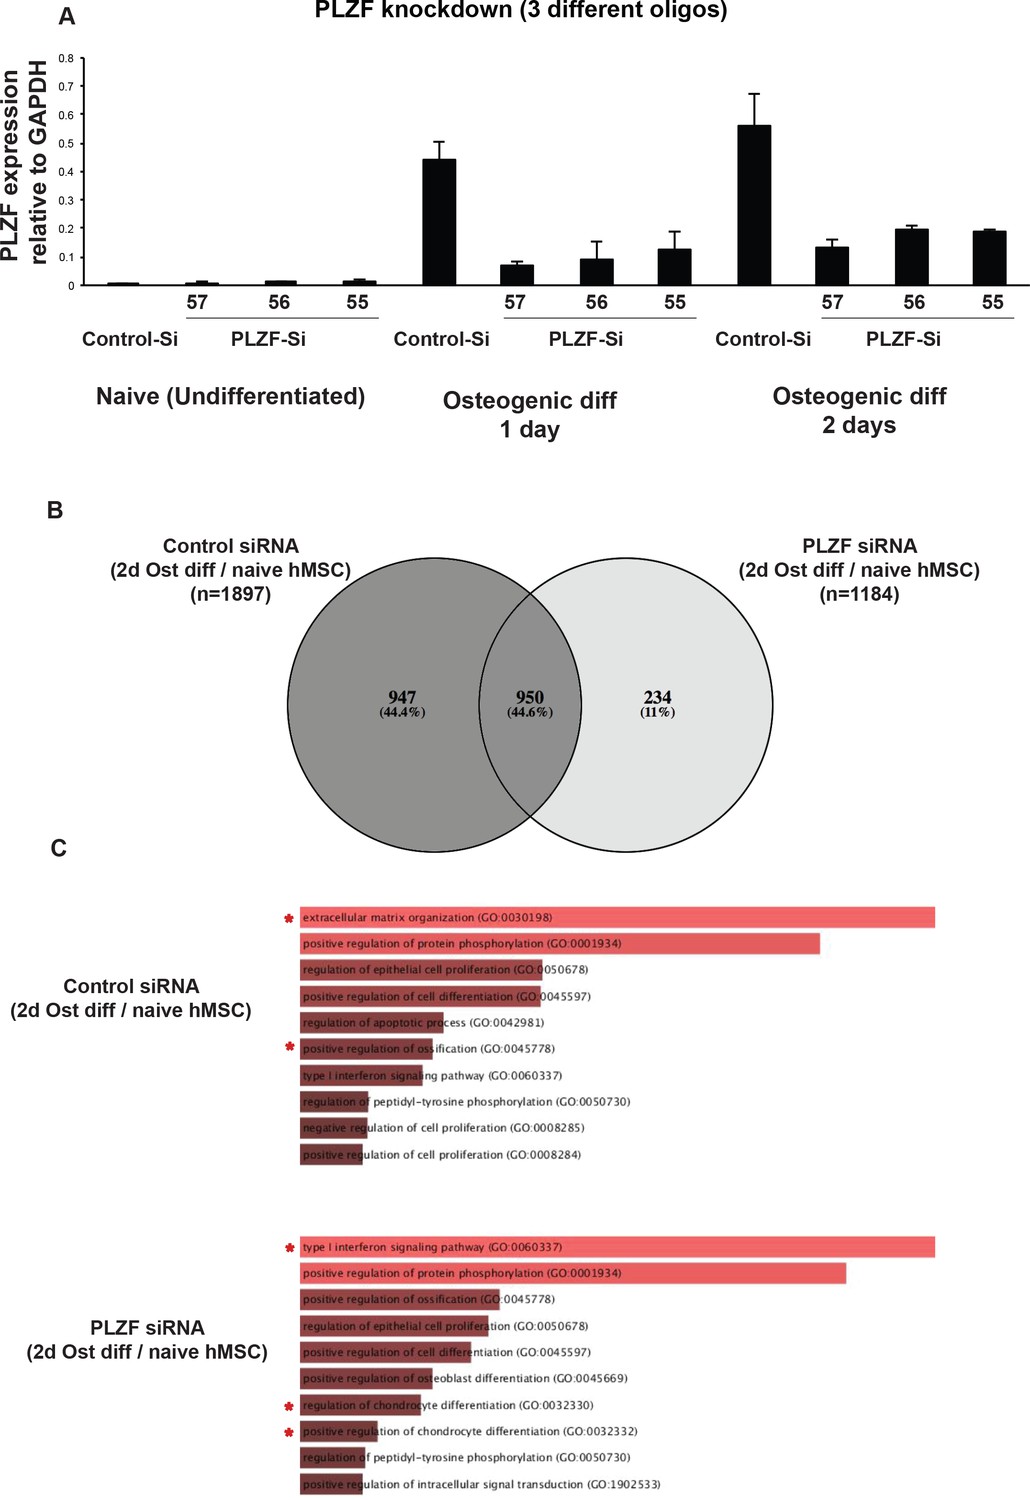
(A) PLZF knockdown using three different siRNA (55, 56, 57) in hMSCs measured by RT-QPCR.
hMSCs were transfected with siRNA oligos against PLZF or scrambled control oligo as indicated. After 24 hr the medium was changed and osteogenic differentiation was induced for 2 days. Relative mRNA levels were calculated after normalization to GAPDH. Data is mean ± SD from triplicates of QPCR experiment. The siRNA oligos were ordered from Sigma mission and oligo IDs are given in Supplementary file 9. (B) The Venn diagram shows the overlap between differentially regulated genes upon induction of osteogenic differentiation from RNA seq analyses in hMSCs, in the presence or absence of PLZF. The diagram was generated using online tool Venny (Oliveros, 2007). (C) The bar graphs show the Gene Ontology (GO, Biological processes) terms enriched for differentially regulated genes from each group; control siRNA or PLZF siRNA transfected hMSCs upon induction of osteogenic differentiation (2d vs naive). The online tool Enrichr was used for the analyses (Chen et al., 2013; Kuleshov et al., 2016). The values in the graph are combined scores computed by multiplying the p-value (Fischer exact test) with z-score of the deviation from the expected rank.
Figure 4 with 1 supplement

Characterization of a PLZF-bound, ZBTB16 intragenic enhancer.
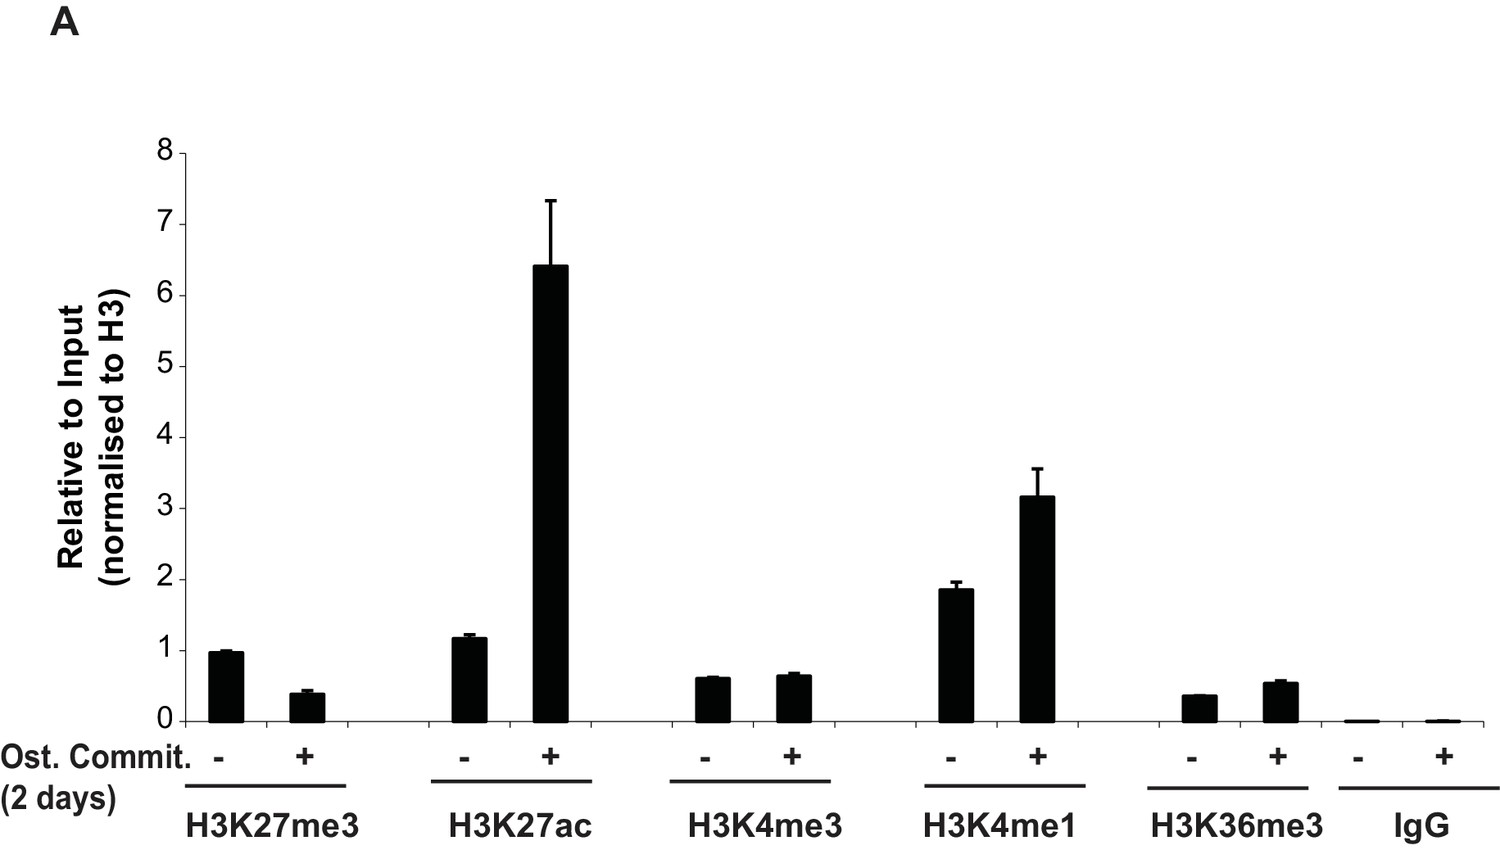
(A) Genome browser tracks representing the genomic region within the ZBTB16 locus that gain H3K4me1, H3K27ac and PLZF binding in immature osteoblasts (highlighted in grey box). The overlap with FANTOM5 enhancers is indicated at the bottom of the tracks. (B) ChIP-QPCR at the ZBTB16 locus showing enrichment of H3K27ac, H3K4me1, H3K4me3 and H3K36me3 histone marks in naive hMSCs and in pre-osteoblasts (2 days of osteogenic differentiation). Data showing mean ± SD from triplicates of QPCR from three biological replicates, ****p < 0.0001, **p = 0.0025 for H3K27ac, not significant for other regions; **p = 0.0092 for H3K4me1, not significant for other regions; **p = 0.0071 for H3K4me3 at TSS, not significant for other regions; ****p < 0.0001, *p = 0.027 for H3K36me3, not significant for other regions; calculated by two-way ANOVA with Sidak’s multiple comparison tests. The regions (promoter, TSS, EnP) amplified using primers A, B and E shown in Figure 1E and primers binding at Exon 2 of the ZBTB16 locus. (C) ChIP-QPCR for the Mediator components MED1 and MED12 as well as p300 in naive or in pre-osteoblasts (2 days of osteogenic differentiation) at the EnP element. Data shows mean ± SD from triplicates of QPCR from three biological replicates, **p < 0.001 calculated by multiple t-tests with FDR 1% and two-stage step-up method of Benjamini, Krieger and Yekutieli. (D) Schematic presentation of the lentiviral enhancer GFP-reporter system used (pSINMIN). EnP (region corresponding to the largest PLZF peak in Figure 4A) or a control region (CtE; region within ZBTB16 locus distal to EnP but without a PLZF peak) was cloned upstream of the minimal TK promoter driving the expression of GFP. (E) Histogram represents GFP expression measured by flow cytometer in hMSCs cells transduced with lentivirus encoding EnP-GFP followed by induction of osteogenic differentiation (2 days). Data is a representative of five biological replicates. The percentage of GFP positive cells from gated live cells are indicated in the upper right corner. (F) Box plot represents the GFP expression obtained by flow cytometer measurements in hMSCs transduced with empty vector (EV), control element (CtE) or enhancer (EnP) cloned in the pSINMIN GFP reporter, before and after induction of osteogenic differentiation for two days. The data shows median calculated from five biological replicates. Median is shown by horizontal line. ****p < 0.0001 calculated by 2-way ANOVA with Sidak’s multiple comparison tests. (G) Integration of the GFP coding sequence was analyzed by QPCR using primers for GFP on genomic DNA isolated from each group of samples. Data shown are mean ± SD from three biological replicates. Untransduced hMSCs were used as a negative control and shown as right most bars in the plot.
-
Figure 4—source data 1
ChIP for Med1, Med12 and P300 in hMSCs.
- https://cdn.elifesciences.org/articles/40364/elife-40364-fig4-data1-v2.xlsx
-
Figure 4—source data 2
H3K4me3 ChIP in hMSCs.
- https://cdn.elifesciences.org/articles/40364/elife-40364-fig4-data2-v2.xlsx
-
Figure 4—source data 3
H3K4me1 ChIP in hMScs.
- https://cdn.elifesciences.org/articles/40364/elife-40364-fig4-data3-v2.xlsx
-
Figure 4—source data 4
H3K27ac ChIP in hMSCs.
- https://cdn.elifesciences.org/articles/40364/elife-40364-fig4-data4-v2.xlsx
-
Figure 4—source data 5
H3K36me3 ChIP in hMSCs.
- https://cdn.elifesciences.org/articles/40364/elife-40364-fig4-data5-v2.xlsx
-
Figure 4—source data 6
Med12 ChIP in hMSCs.
- https://cdn.elifesciences.org/articles/40364/elife-40364-fig4-data6-v2.xlsx
-
Figure 4—source data 7
Med1 ChIP in hMSCs.
- https://cdn.elifesciences.org/articles/40364/elife-40364-fig4-data7-v2.xlsx
-
Figure 4—source data 8
GFP reproter integration analyses.
- https://cdn.elifesciences.org/articles/40364/elife-40364-fig4-data8-v2.xlsx
Figure 4—figure supplement 1
(A) ChIP-QPCR at another PLZF peak observed within the ZBTB16 locus showing enrichment of histone marks (H3K27ac, H3K4me1, H3K4me3 and H3K36me3) in naive hMSCs or in pre-osteoblasts (at day 2 of osteogenic differentiation).
QPCR data is shown as mean values ± SD of triplicates from three biological replicates. Region amplified by QPCR corresponds to the primer D shown in Figure 1D. General IgG was used as negative control.
Figure 5 with 1 supplement
The enhancer EnP loops to the promoter of the nearest gene NNMT and regulates its expression.
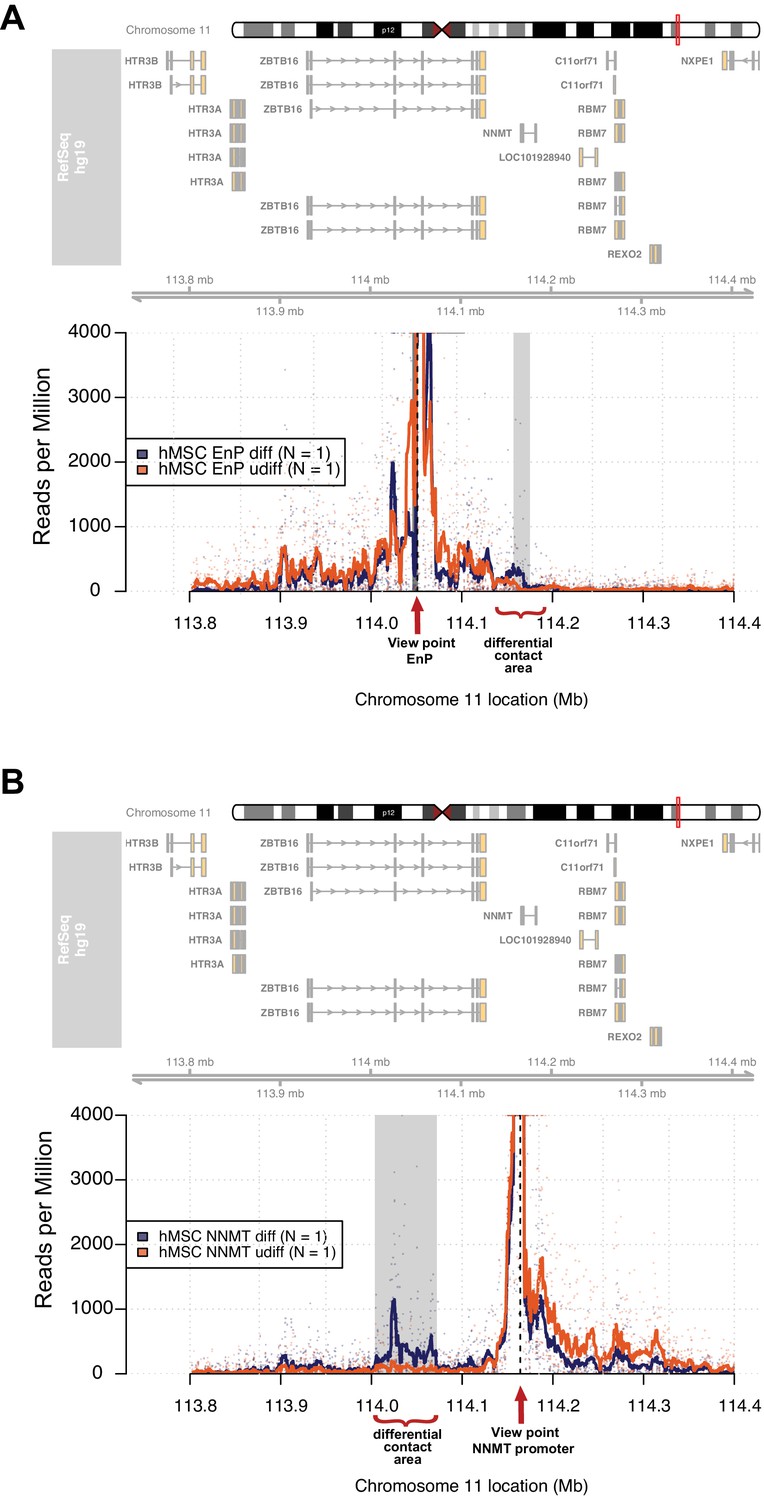
At the top, the ideograms represent the human chromosome 11. The chromosomal location of the 4C-seq profiles is indicated by the red mark. RefSeq hg19 genes are indicated by rectangles (exons) and arrowheads with connecting lines (introns) that point in the direction of transcription. (A) The 4C-seq contact map of the EnP enhancer in naive hMSCs and in pre-osteoblasts (2 days of osteogenic differentiation). The plot represents the overlay between naïve hMSCs and pre-osteoblasts. Data are displayed as reads per million (RPM). The arrow indicates the view point for depicted track and asterisks indicate contact points revealed by 4C-Seq. The plots reveal that EnP physically contacts the NNMT promoter and vice versa (shown in B). Gray rectangles indicate areas with higher contact frequency in pre-osteoblasts over naive hMSCs (X2-test; False Discovery Rate < 0.01). (B) The NNMT promoter as a view point in 4C-Seq revealed a high frequency of contact at a 30 kb region in intron 2 and 3 of the ZBTB16 locus after 2 days of osteogenic differentiation. The data presented here is representative of two biological replicates. Gray rectangles indicate the EnP-enhancer area with higher contact frequency in pre-osteoblasts over naive hMSCs (X2-test; False Discovery Rate < 0.01).
Figure 5—figure supplement 1
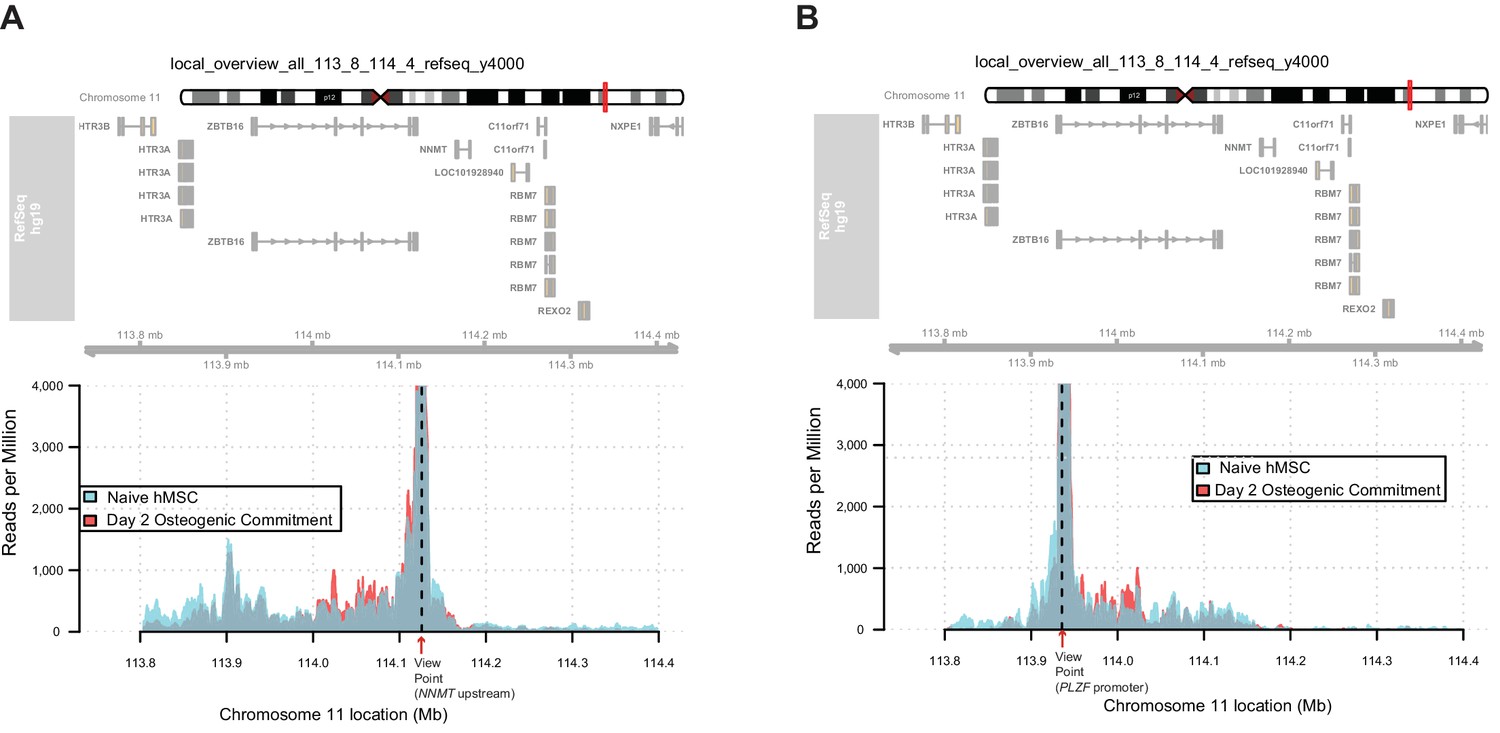
Long range interaction map using control regions as view point revealed by 4C-Seq in hMSCs before (naive) and after induction of osteogenic differentiation (day 2).
The plot represents the overlay between naive and day 2 of osteogenic differentiation. Data are displayed as reads per million (RPM). (A) NNMT promoter upstream region as a control viewpoint, (B) The ZBTB16 promoter as viewpoint.
Figure 6 with 1 supplement
NNMT gene expression is induced during osteogenic differentiation and affects ZBTB16 and ALPL expression.
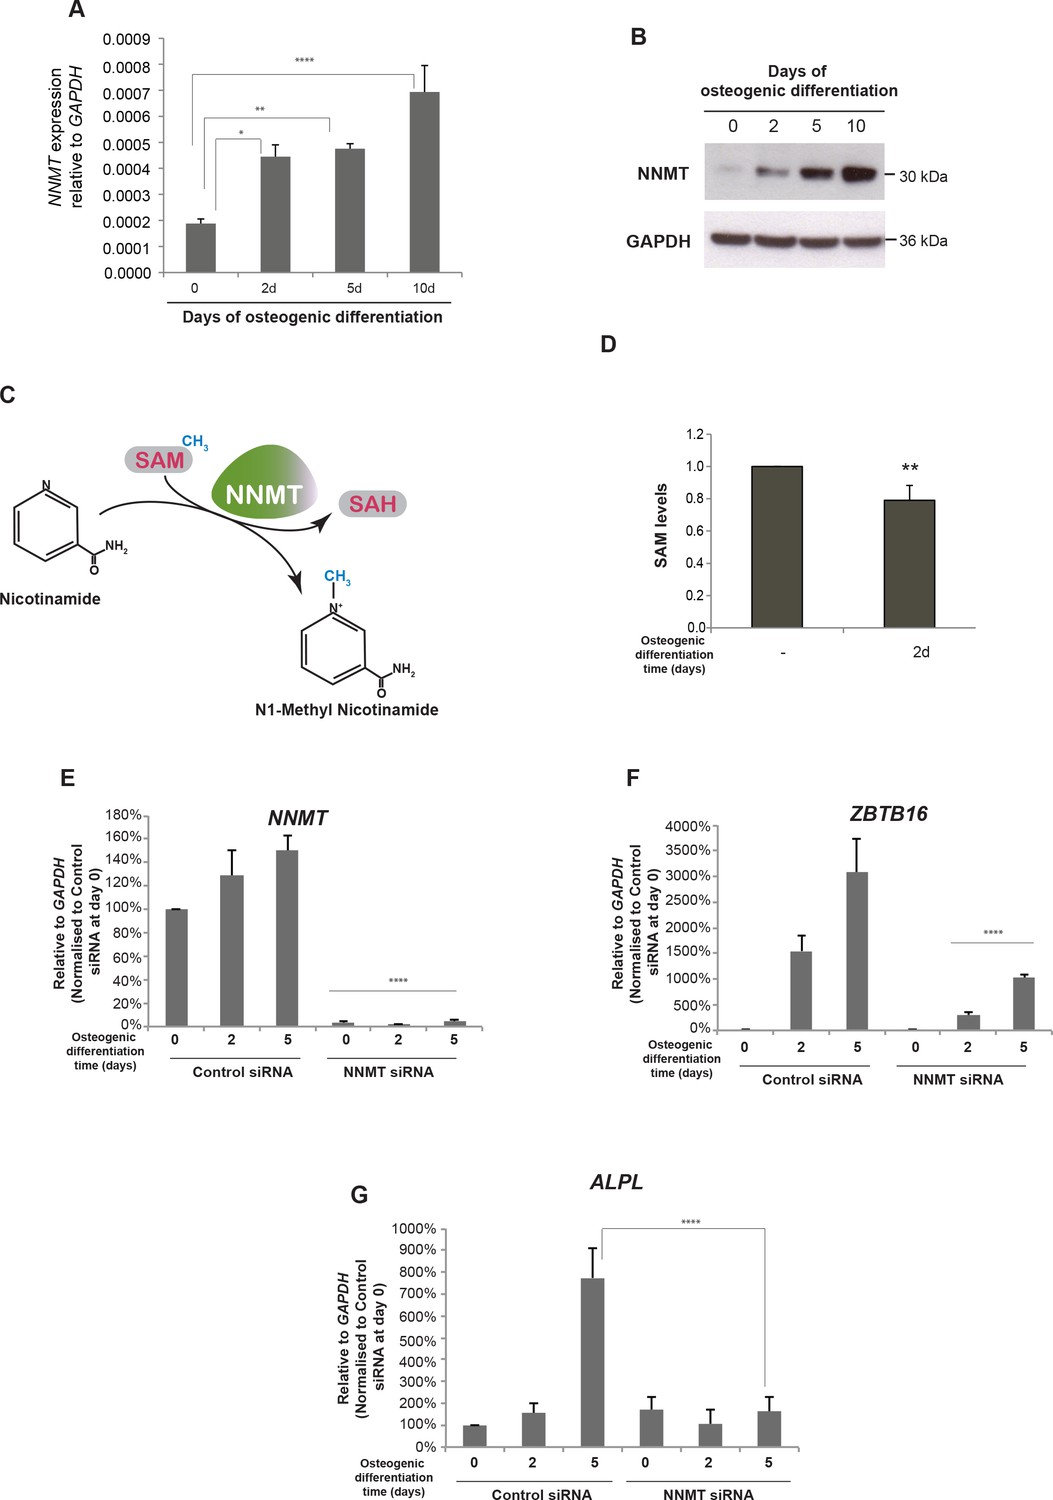
(A–B) NNMT expression during osteogenic differentiation as analyzed by RT-QPCR and western blot. RT-QPCR data represents mean ± SD from three biological replicates. *p = 0.0223, **p = 0.0011, ****p < 0.0001, significance was calculated by two-way ANOVA using Bonferroni's multiple comparisons test. (C) Schematic presentation of the biochemical reaction whereby NNMT transfers a methyl group from SAM (S-adenosyl methionine) to nicotinamide, producing 1MNA (one methyl nicotinamide) and SAH (S-adenosyl homocysteine). (D) SAM levels measured by a fluorescence based assay (Mediomics) in hMSCs before and after osteogenic differentiation for 2 days. The data shown are averages of three biological replicates (p value = 0.01, two tailed t-test). (E) NNMT knockdown using siRNA in naive and osteogenic differentiated hMSCs, assessed by RT-QPCR. Two different siRNAs were used for knockdown of NNMT expression. Experiments shown are mean ± SD from three biological replicates. (F) Expression of ZBTB16 after NNMT knockdown analyzed by RT-QPCR. Experiments shown are mean ± SD from two biological replicates. (G) Expression of ALPL after NNMT knockdown analyzed by RT-QPCR. Experiments shown are mean ± SD from two biological replicates. ****p < 0.0001, statistical significance was calculated by two-way ANOVA using Tukey’s multiple comparisons test.
-
Figure 6—source data 1
NNMT expression by RT-QPCR.
- https://cdn.elifesciences.org/articles/40364/elife-40364-fig6-data1-v2.xlsx
-
Figure 6—source data 2
ALPL expression by RT-QPCR.
- https://cdn.elifesciences.org/articles/40364/elife-40364-fig6-data2-v2.xlsx
-
Figure 6—source data 3
PLZF expression by RT-QPCR.
- https://cdn.elifesciences.org/articles/40364/elife-40364-fig6-data3-v2.xlsx
Figure 6—figure supplement 1
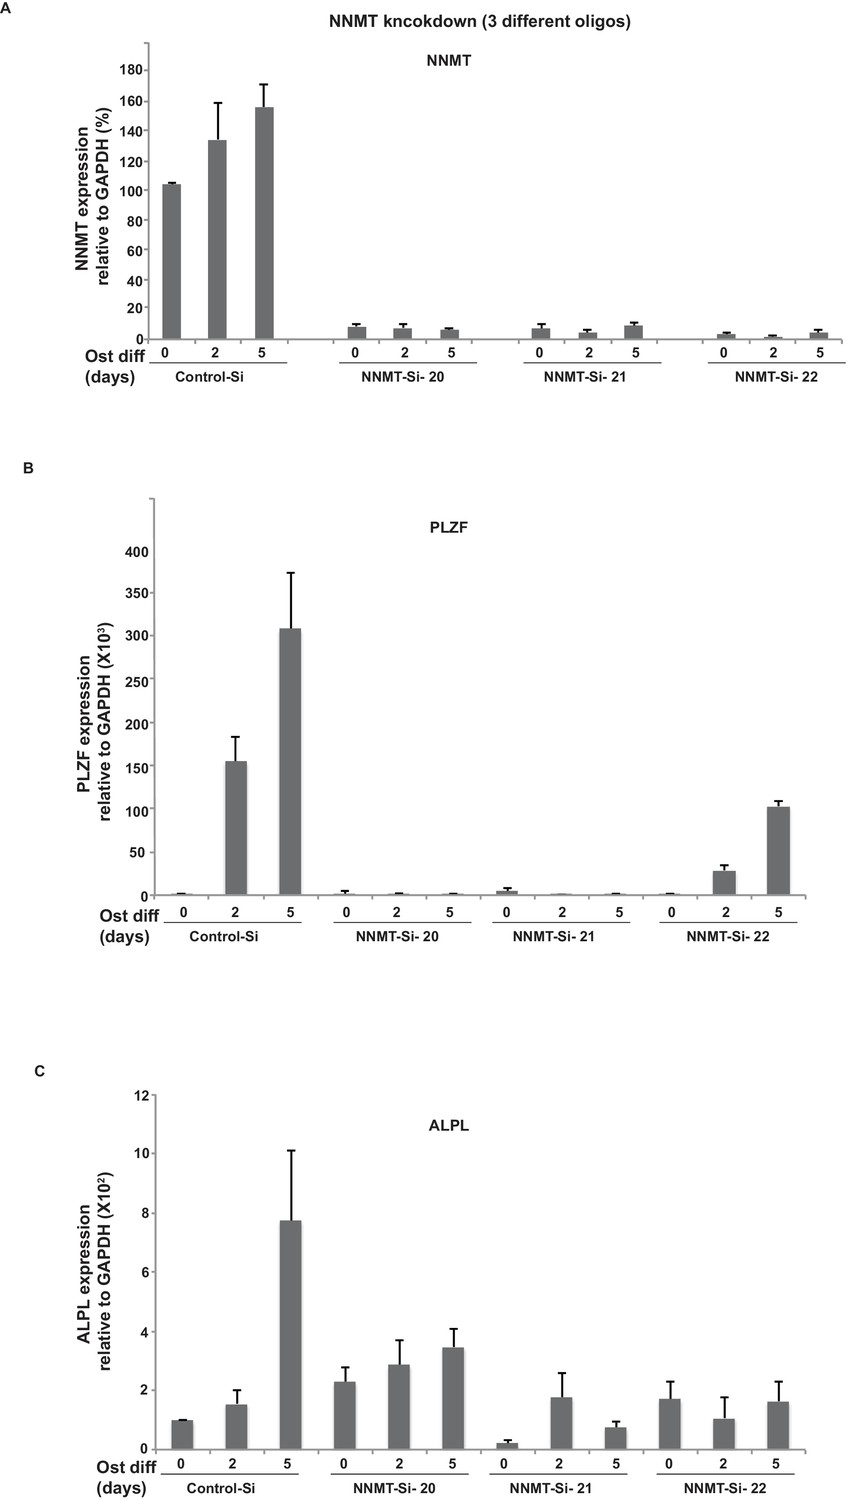
(A) NNMT knockdown using three different siRNA oligos (20, 21, 22) in naïve and osteogenic differentiated (2 and 5 days) hMSCs, assessed by Q-RTPCR.
Experiments shown are mean ± SD from triplicates of Q-PCR experiment. The siRNA oligos were ordered from sigma mission and oligo IDs are given in supplementary file 9. (B) Expression of PLZF/ZBTB16 and C) ALPL, after NNMT knockdown (three siRNA's) analyzed by Q-RTPCR. Experiments shown are mean ± SD from triplicates of Q-PCR experiments.
Figure 7 with 1 supplement

PLZF is required for MED12 and RNA PolII recruitment at the EnP enhancer.
A) Knockdown of PLZF by siRNA prevents efficient induction of the NNMT gene. hMSCs were transfected with siPLZF or control siRNA, left untreated or added osteogenic differentiation medium in a time course experiment. (A) Western blot showing the knockdown efficiency of PLZF and the influence on NNMT expression during osteogenic differentiation (western blot in A, representative blot from two biological replicates and RT-QPCR in B, the data shown are mean ± SD from three biological replicates, ****p < 0.0001). The impact of PLZF knockdown on ALPL expression is shown in the lower part of the panel B. The data shown are mean ± SD from three biological replicates, ****p < 0.0001, significance was calculated by two-way ANOVA using Tukey’s multiple comparisons test. (C) Fluorescence based SAM assay revealed that PLZF knockdown prevented the decline in SAM levels as observed in control siRNA cells (tested as significant p = 0.01 two tailed t-test) during early osteogenic differentiation (day2). The data shown here is an average of three biological replicates. (D) ChIP followed by QPCR for PLZF, RNA PolII, and MED12 at the EnP element before and after PLZF knockdown in hMSCs. Osteogenic differentiation was induced one day after siRNA transfection and cells were fixed for ChIP two days later. The data represents two biological replicates and show averages of triplicate values from QPCR ± SD. ****p < 0.0001, significance was calculated by two-way ANOVA using Tukey’s multiple comparisons test. (E) Model to show that the ZBTB16 locus is repressed by Polycomb protein complexes (PcG) and marked by H3K27me3 in naive hMSCs. Upon induction of osteogenic differentiation, the ZBTB16 locus gets derepressed by losing PcG binding, and H3K27me3 through JMJD3 recruitment, gain H3K27ac which eventually results in high expression of PLZF. The intragenic enhancer ‘EnP’ gets exposed, gains H3K27ac and H3K4me1 histone marks and binds PLZF as well as P300 and the Mediator complex. Subsequently, the EnP element loops to the promoter of the NNMT gene (100 kb downstream) and induce its expression and as a consequence regulates SAM homeostasis during osteogenic differentiation of hMSCs.
-
Figure 7—source data 1
ChIP for enhancer binding proteins in hMSCs, in the absence of PLZF.
- https://cdn.elifesciences.org/articles/40364/elife-40364-fig7-data1-v2.xlsx
Figure 7—figure supplement 1
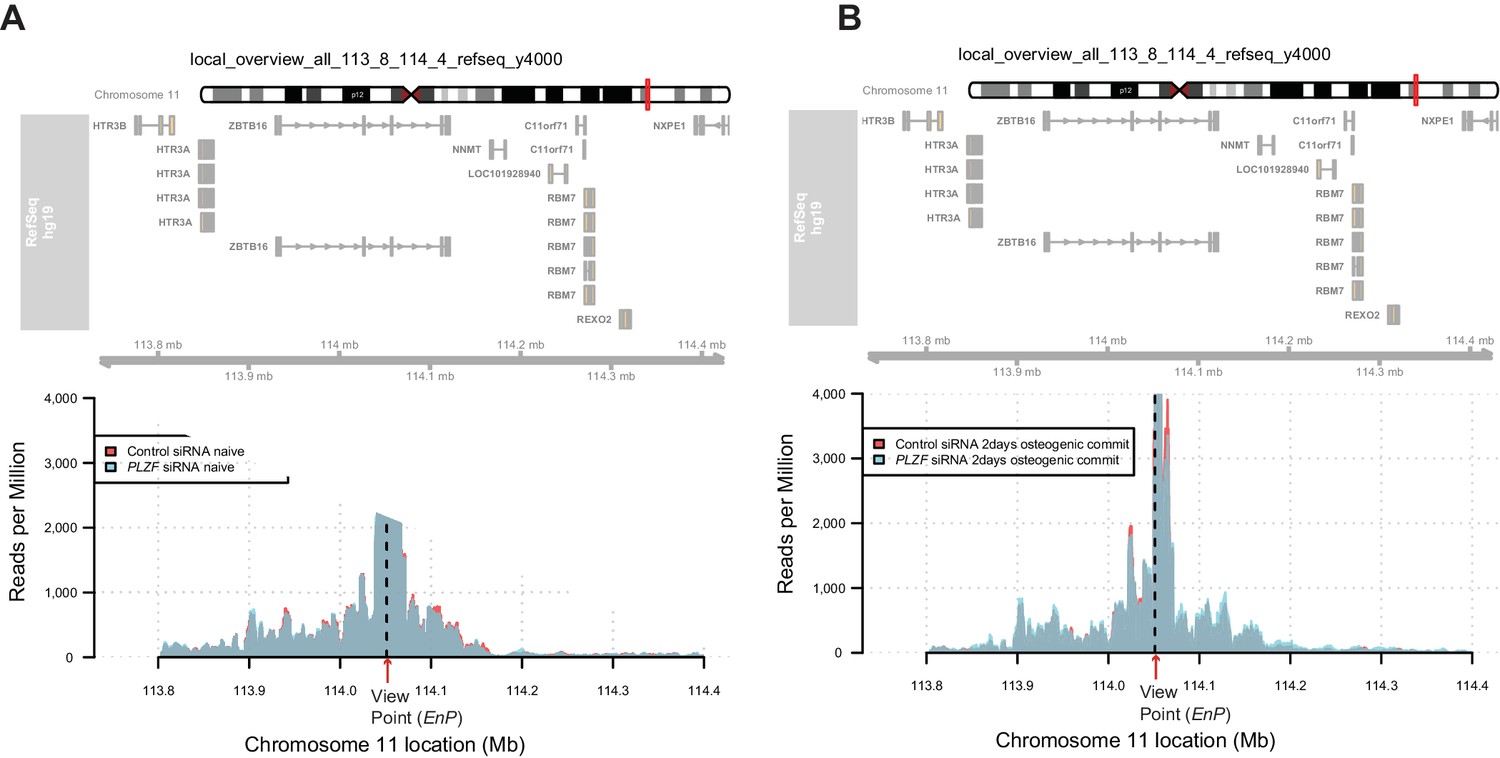
4C-sequencing map revealing that the PLZF knockdown (using siRNA) did not affect the contact frequency between the EnP element and NNMT promoter observed during early osteogenic differentiation (day 2).
Plots show the overlap between control siRNA and PLZF siRNA in naive (A) or in early osteogenic induced hMSCs (day 2) (B).
Author response image 1

ChIP-QPCR at the ZBTB16 locus showing enrichment of H3K27ac histone mark in naive or osteogenic committed (2 days) hMSCs after PLZF knockdown.
Data showing mean ± SD from triplicates of QPCR experiment. The promoter, TSS (Exon1) and EnP corresponds to primers A, B and E in Figure 1C in the submitted manuscript.
Author response image 2
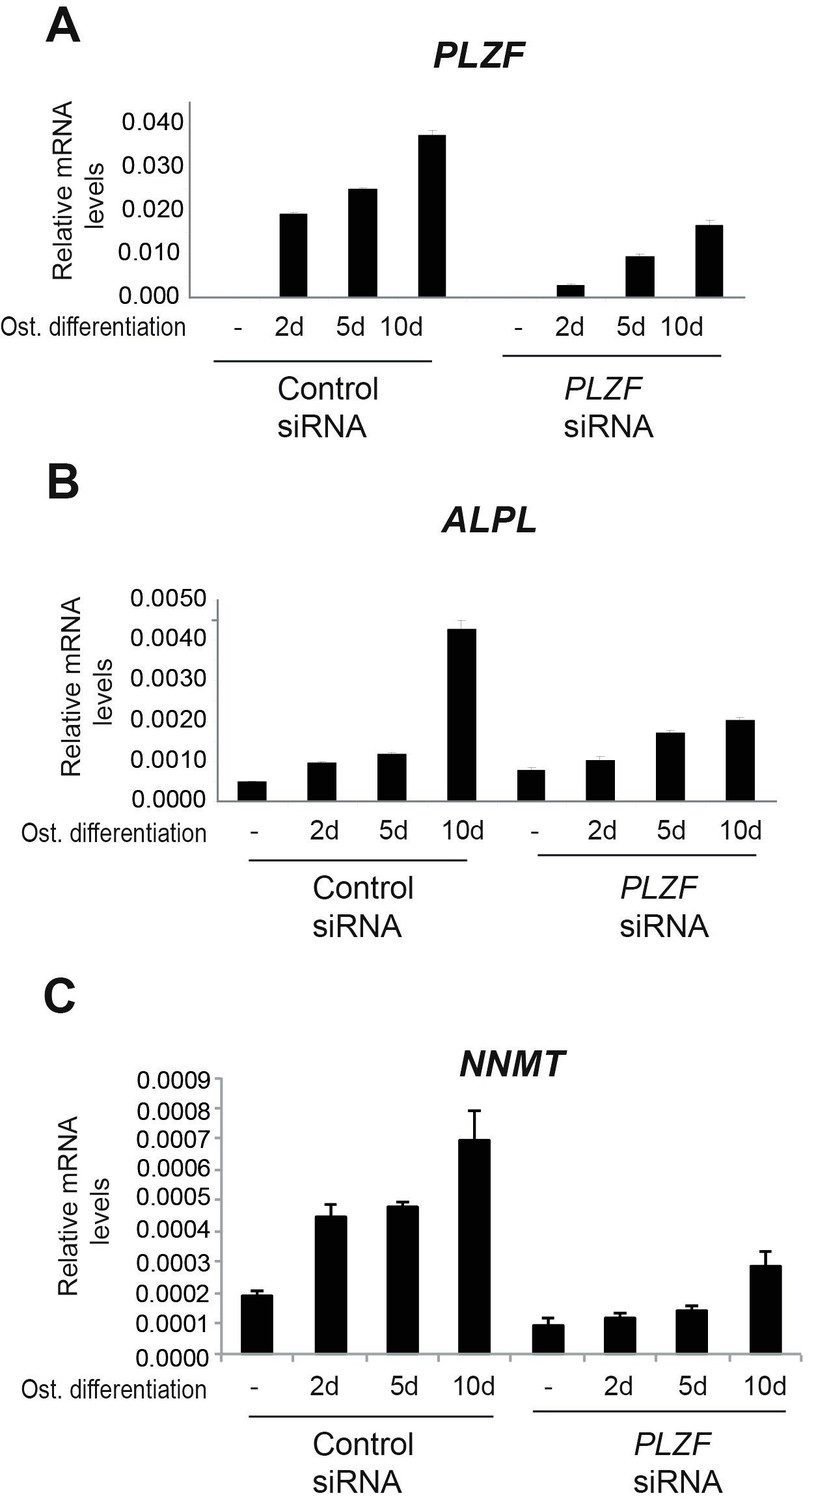
A) PLZF knockdown using siRNA (oligo 57) in hMSCs measured by RT-QPCR at 2, 5 and 10 days of osteogenic induction.
Relative mRNA levels were calculated after normalization to GAPDH. Data is an average from 3 independent biological replicates ± SD. B) ALPL, C) NNMT, mRNA expression analysed by RT-QPCR in hMSCs before and after osteogenic induction for 2, 5 and 10 days in siPLZF or control siRNA transfected cells. Relative mRNA levels are calculated after normalization to GAPDH.Data shows mean ± SD from triplicates of QPCRs from 3 independent experiments.
Author response image 3
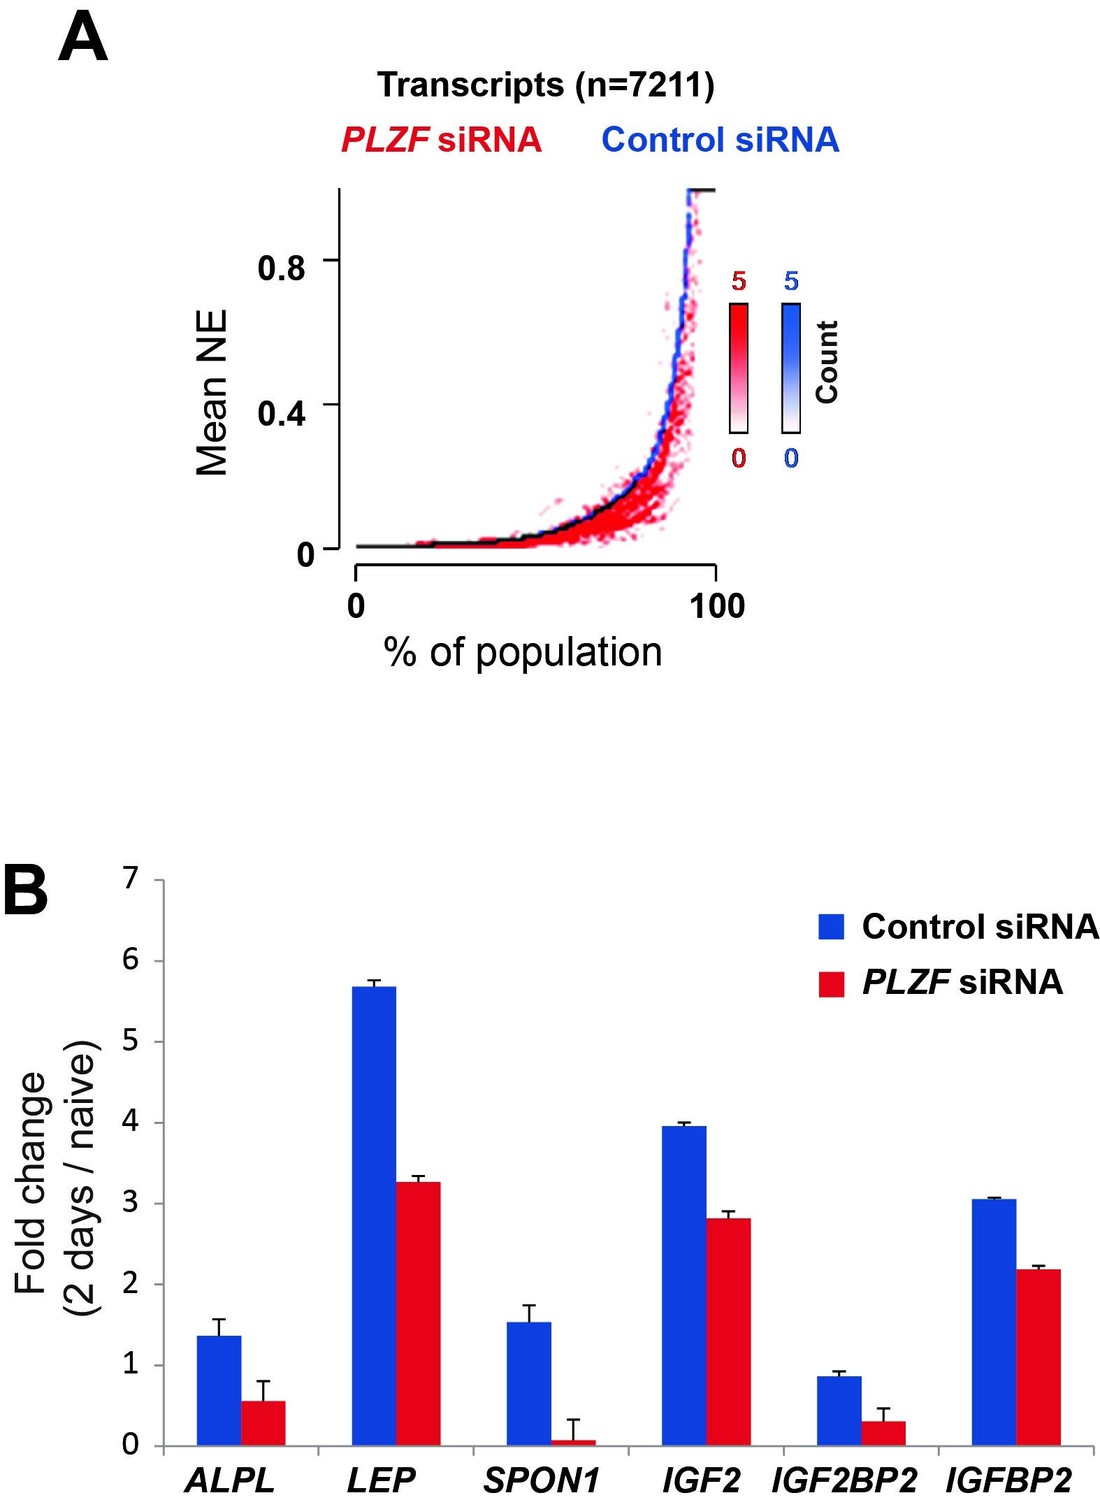
A) Transcriptome analyses by RNA-seq after siRNA (oligo 57) mediated PLZF knockdown followed by osteogenic induction, was performed in biological triplicates.
The normalized expression was calculated using Genomatix software using their guidelines (Expression Analysis for RNASeq Data, GGATM) (Genomatix Software GmbH, Germany). As shown in Figure 5, the expression of genes induced during osteogenic differentiation were reduced in the absence of PLZF. Transcripts that were induced upon induction of osteogenic differentiation in control siRNA treated cells (log2 fold≥1, n=7,211) were sorted according to their expression levels in the control cells (left to right on the X-axis) and the expression levels measured in cells treated with PLZF siRNA was overlaid. The Y-axis indicates the mean normalized expression values from each group, control-siRNA (shown in blue) and PLZF-siRNA (shown in red). B) Fold change (fc) in expression (day 2 of osteogenic diff. /naïve hMSCs) calculated from normalized expression of selected osteogenic lineage specific genes in control siRNA and PLZF siRNA transfected hMSCs. The values are averages from triplicates of 3 independent biological experiments ± SD. ALPL, alkaline phosphatase; LEP, Leptin; SPON1, Spondin1; IGF2, Insulin Like Growth Factor 2; IGF2BP2, Insulin Like Growth Factor 2 mRNA binding Protein 2.
Tables
Key resources table
| Reagent type (species) or resource | Designation | Source or reference | Identifiers | Additional information [RRID] |
|---|---|---|---|---|
| Gene (Homo sapiens) | ZBTB16 (zinc finger and BTB domain containing 16provided by HGNC) | HGNC:HGNC:12930 | Gene ID: 7704, updated on 18-Nov-2018 | |
| Gene (H. sapiens) | NNMT (nicotinamide N-methyltransferaseprovided by HGNC) | HGNC:HGNC:7861 | Gene ID: 4837, updated on 11-Nov-2018 | |
| Cell line (H. sapiens) | Human Mesenchymal Stem Cells (HMSC) | Bone Marrow derived, from Lonza | Lonza, Cat. No. PT-2501 | |
| Recombinant DNA reagent | PCR8 TOPO TA vector | Invitrogen | ||
| Recombinant DNA reagent | pSINMIN lentiviral ‘enhancer reporter vector’ | Johanna Wysoca’s lab | (Rada-Iglesias et al., 2011 | |
| Software, algorithm | Easeq | https://easeq.net | Nature Structural and Molecular Biology Volume 23 No 4 (April 2016), 349–357 | |
| Chemical compound, | Lipofectamin 2000 | Invitrogen | ||
| Chemical compound, | StemPro osteogenesis | Lonza | Gibco A10072-01 | |
| Sequence-based reagents | Mission siRNA oligos ZBTB16 SiRNA | Sigma | SASI_Hs01_00148557 | |
| Sequence-based reagents | Mission siRNA oligos ZBTB16 SiRNA | Sigma | SASI_Hs01_00148556 | |
| Sequence-based reagents | Mission siRNA oligos ZBTB16 SiRNA | Sigma | SASI_Hs01_00148555 | |
| Sequence-based reagents | Mission siRNA oligos NNMT SiRNA | Sigma | SASI_Hs01_00209920 | |
| Sequence-based reagents | Mission siRNA oligos NNMT SiRNA | Sigma | SASI_Hs01_00209921 | |
| Sequence-based reagents | Mission siRNA oligos NNMT SiRNA | Sigma | SASI_Hs01_00209922 | |
| Antibody | PLZF (Rabbit polyclonal) | Santa Cruz | sc-22839 RRID:AB_2304760 | WB-1:600ChIP-5μg |
| Antibody | NNMT (Rabbit polyclonal) | Abcam | ab58743 RRID:AB_881715 | WB (1:1000) |
| Antibody | GAPDH (Mouse monoclonal) | Abcam | ab8245 RRID:AB_2107448 | WB (1:10,000) |
| Antibody | CyclinE (Mouse monoclonal) | Abcam | ab3927 RRID:AB_304167 | WB (1:1000) |
| Antibody | pRB2 (Rabbit polyclonal) | Santa Cruz | sc317 RRID:AB_632093 | WB (1:1000) |
| Antibody | anti-H3K27me3(Rabbit monoclonal) | Cell Signalling | 9733 RRID:AB_2616029 | ChIP-5μl |
| Antibody | anti-SUZ12(Rabbit monoclonal) | Cell Signalling | 3737 RRID:AB_2196850 | ChIP-5μl |
| Antibody | Anti-RNF2 (RING1B) (Rabbit polyclonal) | Home made | Peptide ‘NAST’ RRID:AB_2755047 | ChIP-5μg |
| Antibody | anti-H3K4me3 (Rabbit monoclonal) | Cell Signalling | 9751 RRID:AB_2616028 | ChIP-5μl |
| Antibody | anti-H3K27ac (Rabbit polyclonal) | Abcam | ab4729 RRID:AB_2118291 | ChIP-5μg |
| Antibody | anti-H3K4me1 (Rabbit polyclonal) | Abcam | ab8895 RRID:AB_306847 | ChIP-5μg |
| Antibody | anti-H3K4me1 (Rabbit monoclonal) | Cell Signalling | 5326S RRID:AB_10695148 | ChIP-5μl |
| Antibody | anti-H3K36me3 (Rabbit monoclonal) | Cell Signalling | 4909 RRID:AB_1950412 | ChIP-5μl |
| Antibody | P300 (Rabbit polyclonal) | Santa Cruz | sc-585 RRID:AB_2231120 | ChIP-5μg |
| Antibody | RNA POLII (Rabbit polyclonal) | Santa Cruz | sc 9001X RRID:AB_2268548 | ChIP-5μg |
| Antibody | MED1/TRAP220 (Rabbit polyclonal) | BETHYL | A300-793A RRID:AB_577241 | ChIP-5vg |
| Antibody | MED12 (Rabbit polyclonal) | BETHYL | A300-774A RRID:AB_669756 | ChIP-5μg |
| Antibody | JMJD3 (KDM6B) (Rabbit polyclonal) | home made | Peptide ‘KAKA’ RRID:AB_2755046 | ChIP-5μg |
| Commercial assay or kit | Bridge-It S-Adenosyl Methionine (SAM) Fluorescence Assay Kit | Mediomics | 1-1-1003A (50 measurements) | |
| Commercial assay or kit | DNeasy Blood and tissue kit | QIAGEN | 69504 | |
| Commercial assay or kit | RNeasy Plus Mini kit | QIAGEN | 74106 | |
| Commercial assay or kit | TaqMan Reverse Transcription Reagents | Applied Biosystems | N808-0234 | |
| Commercial assay or kit | Fast SYBR Green Master Mix | Applied Biosystems | 4385612 | |
| Commercial assay or kit | affymetrix gene chips | Affymetrix | HT_HG-U133_Plus_PM | |
| Commercial assay or kit | ChIP seqDNA sample preparation kit | Illumina | Catalog IDs: IP-102–1001 |
Additional files
-
Supplementary file 1
Microarray-Genes-differentially regulated (Osteogenic differentiation induced Vs Naive).
- https://cdn.elifesciences.org/articles/40364/elife-40364-supp1-v2.xlsx
-
Supplementary file 2
K4me3Gain-ExpressionGain-K27meLoss.
- https://cdn.elifesciences.org/articles/40364/elife-40364-supp2-v2.xlsx
-
Supplementary file 3
K27me3 changes.
- https://cdn.elifesciences.org/articles/40364/elife-40364-supp3-v2.xlsx
-
Supplementary file 4
PLZF-Peaks.
- https://cdn.elifesciences.org/articles/40364/elife-40364-supp4-v2.xlsx
-
Supplementary file 5
PLZF peaks-Expression of nearest transcript and H3K27ac changes.
- https://cdn.elifesciences.org/articles/40364/elife-40364-supp5-v2.xlsx
-
Supplementary file 6
FANTOM5-enahncers-overlapping to PLZF peak+−1 kb.
- https://cdn.elifesciences.org/articles/40364/elife-40364-supp6-v2.xlsx
-
Supplementary file 7
PLZF-dependent K27ac.
- https://cdn.elifesciences.org/articles/40364/elife-40364-supp7-v2.xlsx
-
Supplementary file 8
Differentially expressed transcripts/genes from RNA seq-(PLZF-kd 2 days diff-Vs Control Si 2 days diff, OR 2 days differentiation Vs naive).
- https://cdn.elifesciences.org/articles/40364/elife-40364-supp8-v2.xlsx
-
Supplementary file 9
Oligo sequences.
- https://cdn.elifesciences.org/articles/40364/elife-40364-supp9-v2.docx
-
Transparent reporting form
- https://cdn.elifesciences.org/articles/40364/elife-40364-transrepform-v2.pdf
Download links
A two-part list of links to download the article, or parts of the article, in various formats.
Downloads (link to download the article as PDF)
Open citations (links to open the citations from this article in various online reference manager services)
Cite this article (links to download the citations from this article in formats compatible with various reference manager tools)
PLZF targets developmental enhancers for activation during osteogenic differentiation of human mesenchymal stem cells
eLife 8:e40364.
https://doi.org/10.7554/eLife.40364


