High-molecular-weight polymers from dietary fiber drive aggregation of particulates in the murine small intestine
- California Institute of Technology, United States
- Princeton University, United States
Figures
Figure 1 with 1 supplement
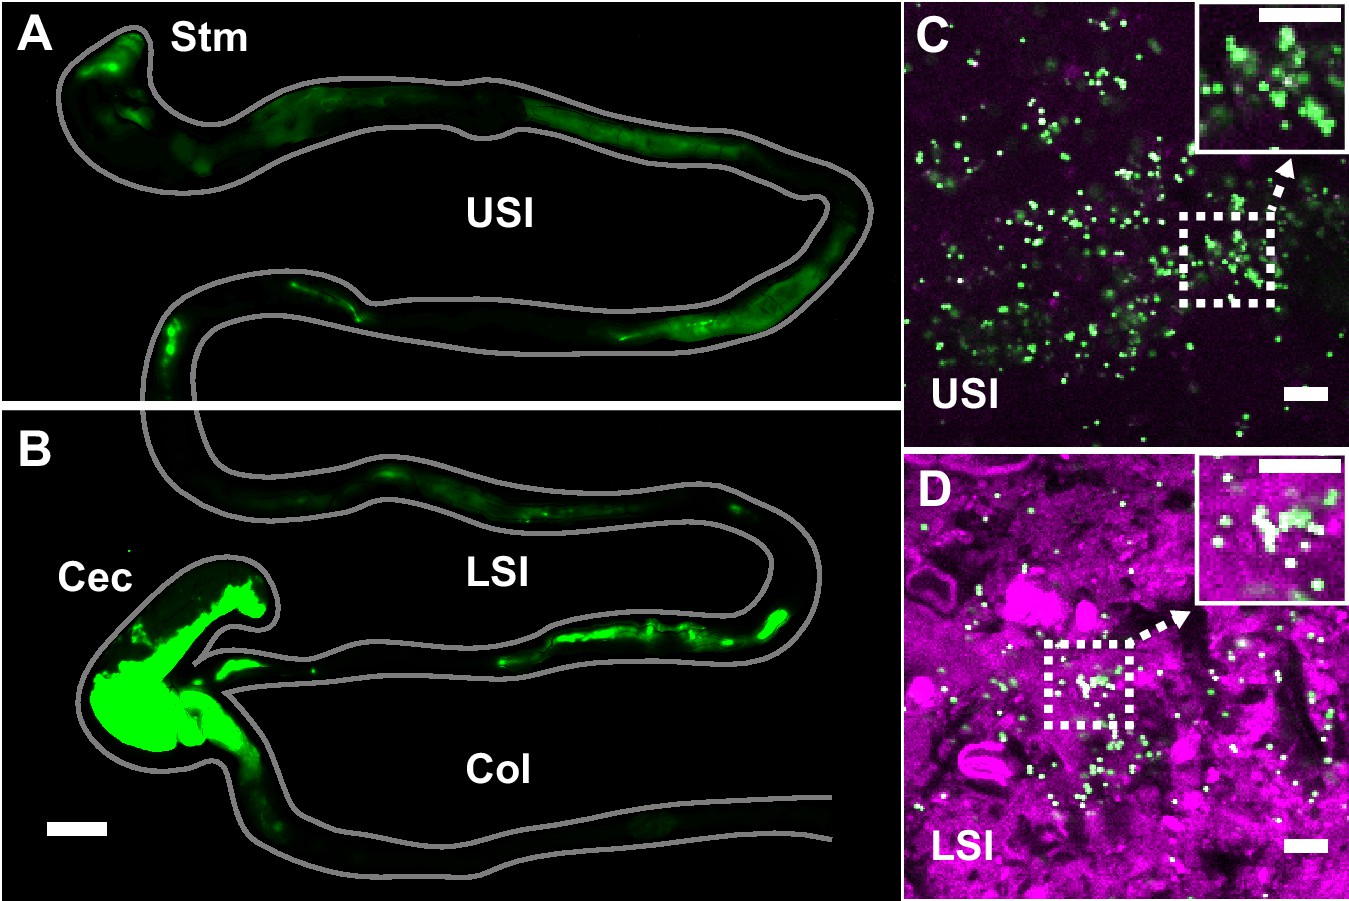
PEG-coated particles aggregate in the murine small intestine (SI).
(A and B) Fluorescent scanner image of gastrointestinal tract (GIT) from a mouse orally administered a suspension of 1 µm diameter PEG-coated particles (green). Scale bar is 0.5 cm. (see Figure 1—figure supplement 1 for image processing steps and how contours of gut were outlined). (C and D) Confocal micrographs of luminal contents from the upper (C) and lower (D) SI of a mouse orally gavaged with PEG-coated particles (green) showing scattering from luminal contents (purple). Scale bars are 10 µm. Stm = Stomach; USI = upper SI; LSI = lower SI; Col = colon.
Figure 1—figure supplement 1
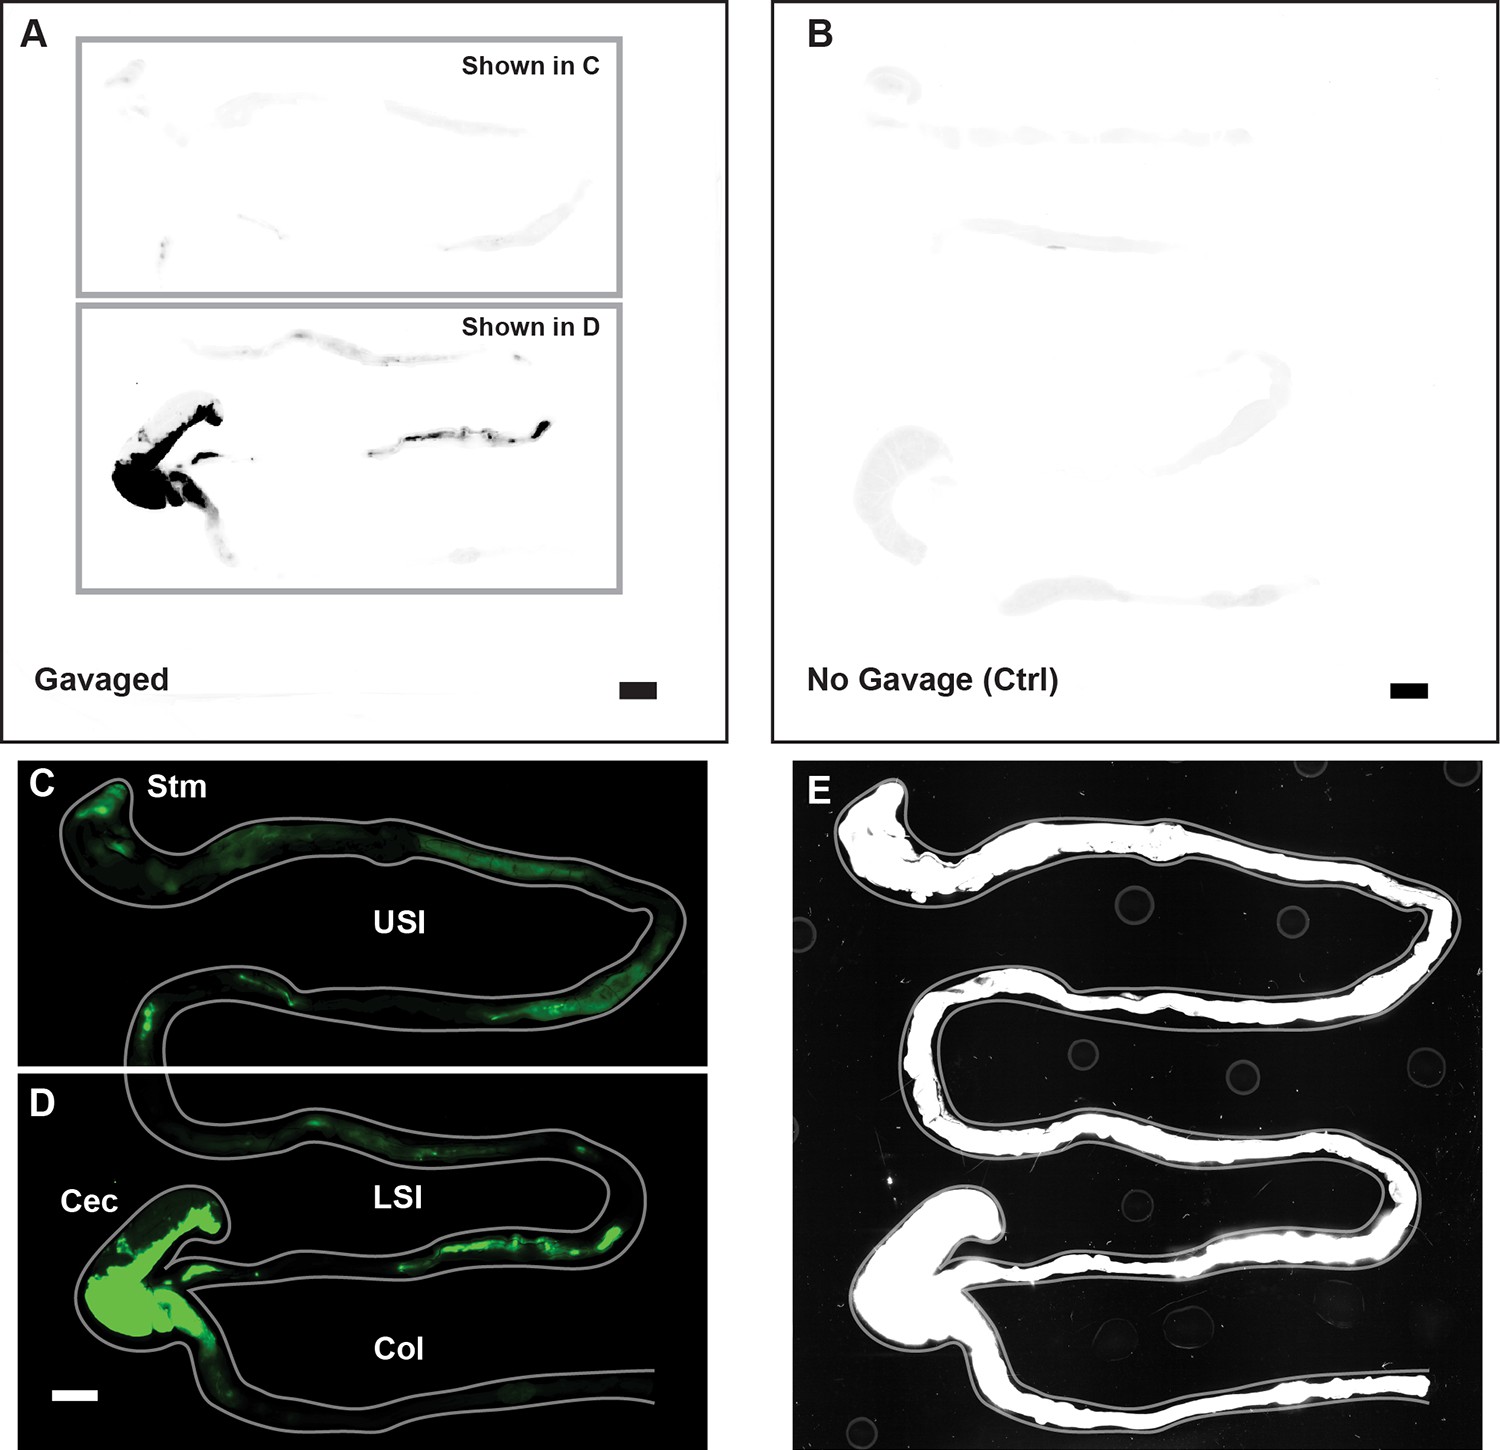
Overview of image processing for fluorescent scanner images appearing in Figure 1.
(A) Unmodified fluorescent scanner images of the gastrointestinal tract of a mouse gavaged with 1 µm-diameter PEG-coated particles (prior to the contrast and color-adjustments shown in Figure 1A-B). Scale bar is 0.5 cm. Boxes indicate the regions that are shown in panels C and D. (B) Unmodified fluorescent scanner image of the gut of a mouse that has not been gavaged with particles. Scale bar is 0.5 cm. (C and D). The contrast and color-adjusted images that appear in Figure 1A-B. (E) Contrast-adjusted image of Figure 1A-B that was used to trace the outline of the gut shown in Figure 1A-B (and panel C and D of this figure). Outline of gut is shown in grey on both C, D, and E.
Figure 2
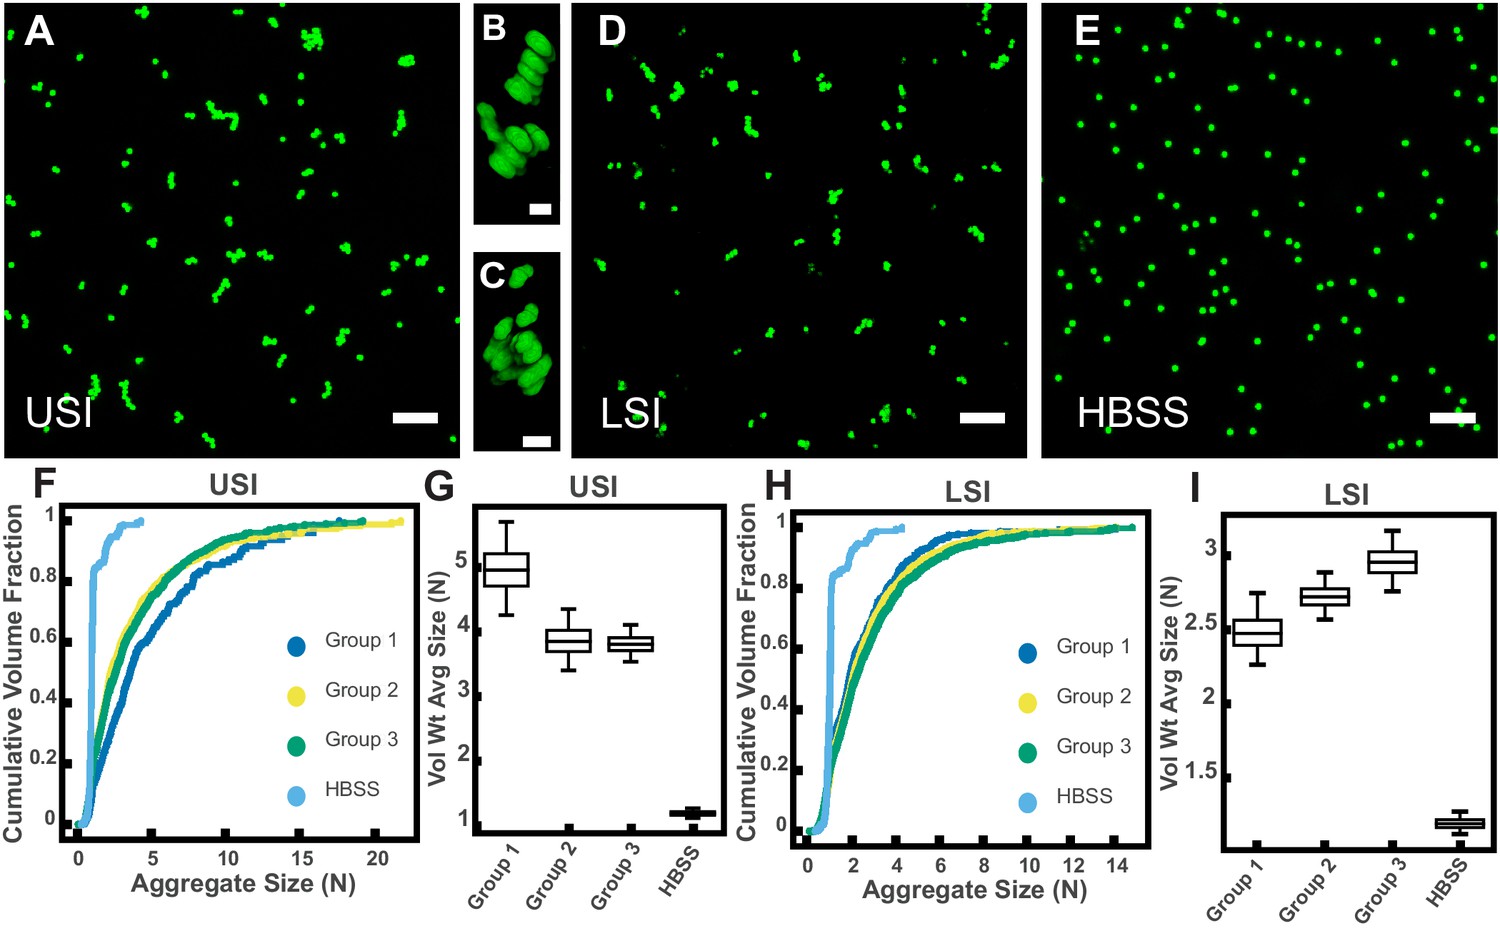
PEG-coated particles aggregate in fluid from the murine small intestine (SI) ex vivo.
The 1-µm-diameter PEG-coated particles form aggregates in fluid collected from the upper (A-C) and lower (D) SI in ~10 min. (A and D) Maximum z-projections of 10 optical slices taken on a confocal microscope. (B and C) 3D renderings of aggregates found in panel A. (E) Maximum z-projection of the same particles in Hanks' balanced salt solution (HBSS). Scale bars are 10 µm in 2D images and 2 µm in 3D images. (F and H) Volume-weighted empirical cumulative distribution functions (ECDFs) comparing aggregation of the particles in pooled samples from the upper (F) and lower (H) SI of three separate groups of male chow-fed mice (each group consisted of three mice) and a control (particles suspended in HBSS). The vertical axis is the cumulative volume fraction of the total number of particles in solution in an aggregate of a given size. The horizontal axis (aggregate size) is given as the number of particles per aggregate (N). (G and I) Box plots depicting the 95% empirical bootstrap CI of the volume-weighted average aggregate size (given in number of particles per aggregate, N) in samples from the upper (G) and lower (I) SI (the samples are the same as those from panels F and H). The line bisecting the box is the 50th percentile, the upper and lower edges of the box are the 25th and 75th percentile respectively, and the whiskers are the 2.5th and 97.5th percentiles. USI = upper SI; LSI = lower SI. See Materials and methods for bootstrapping procedure.
Figure 3

Gel permeation chromatography (GPC) of fluid from the small intestine (SI) and aggregation of PEG-coated particles in fractionated fluid from SI.
(A and D) Chromatograms of samples from the upper (A) and lower (D) SI from a group of three chow-fed mice. Dashed lines indicate the three retention volumes the chromatograms were divided into for analysis: 11–16 mL, 16–20 mL, and >20 mL. Estimated concentrations and molecular weight (MW) are reported in green on the chromatograms for each retention volume. (B and E) Volume-weighted empirical cumulative distribution functions (ECDFs) of aggregate sizes in the upper (B) and lower (E) SI liquid fractions of chow-fed mice which have been run through MW cut-off (MWCO) filters with different MWCOs. As a control, aggregate sizes were also measured for particles placed in HBSS. The vertical axis is the cumulative volume fraction of the total number of particles in solution in an aggregate of a given size. The horizontal axis is aggregate size (number of particles per aggregate, N). (C and F) Box plots depict the 95% empirical bootstrap CI of the volume-weighted average aggregate size (given in number of particles per aggregate, N) in the samples from panels B and E, respectively (see Materials and methods for bootstrapping procedure). The line bisecting the box is the 50th percentile, the upper and lower edges of the box are the 25th and 75th percentile respectively, and the whiskers are the 2.5th and 97.5th percentiles.
Figure 4 with 3 supplements
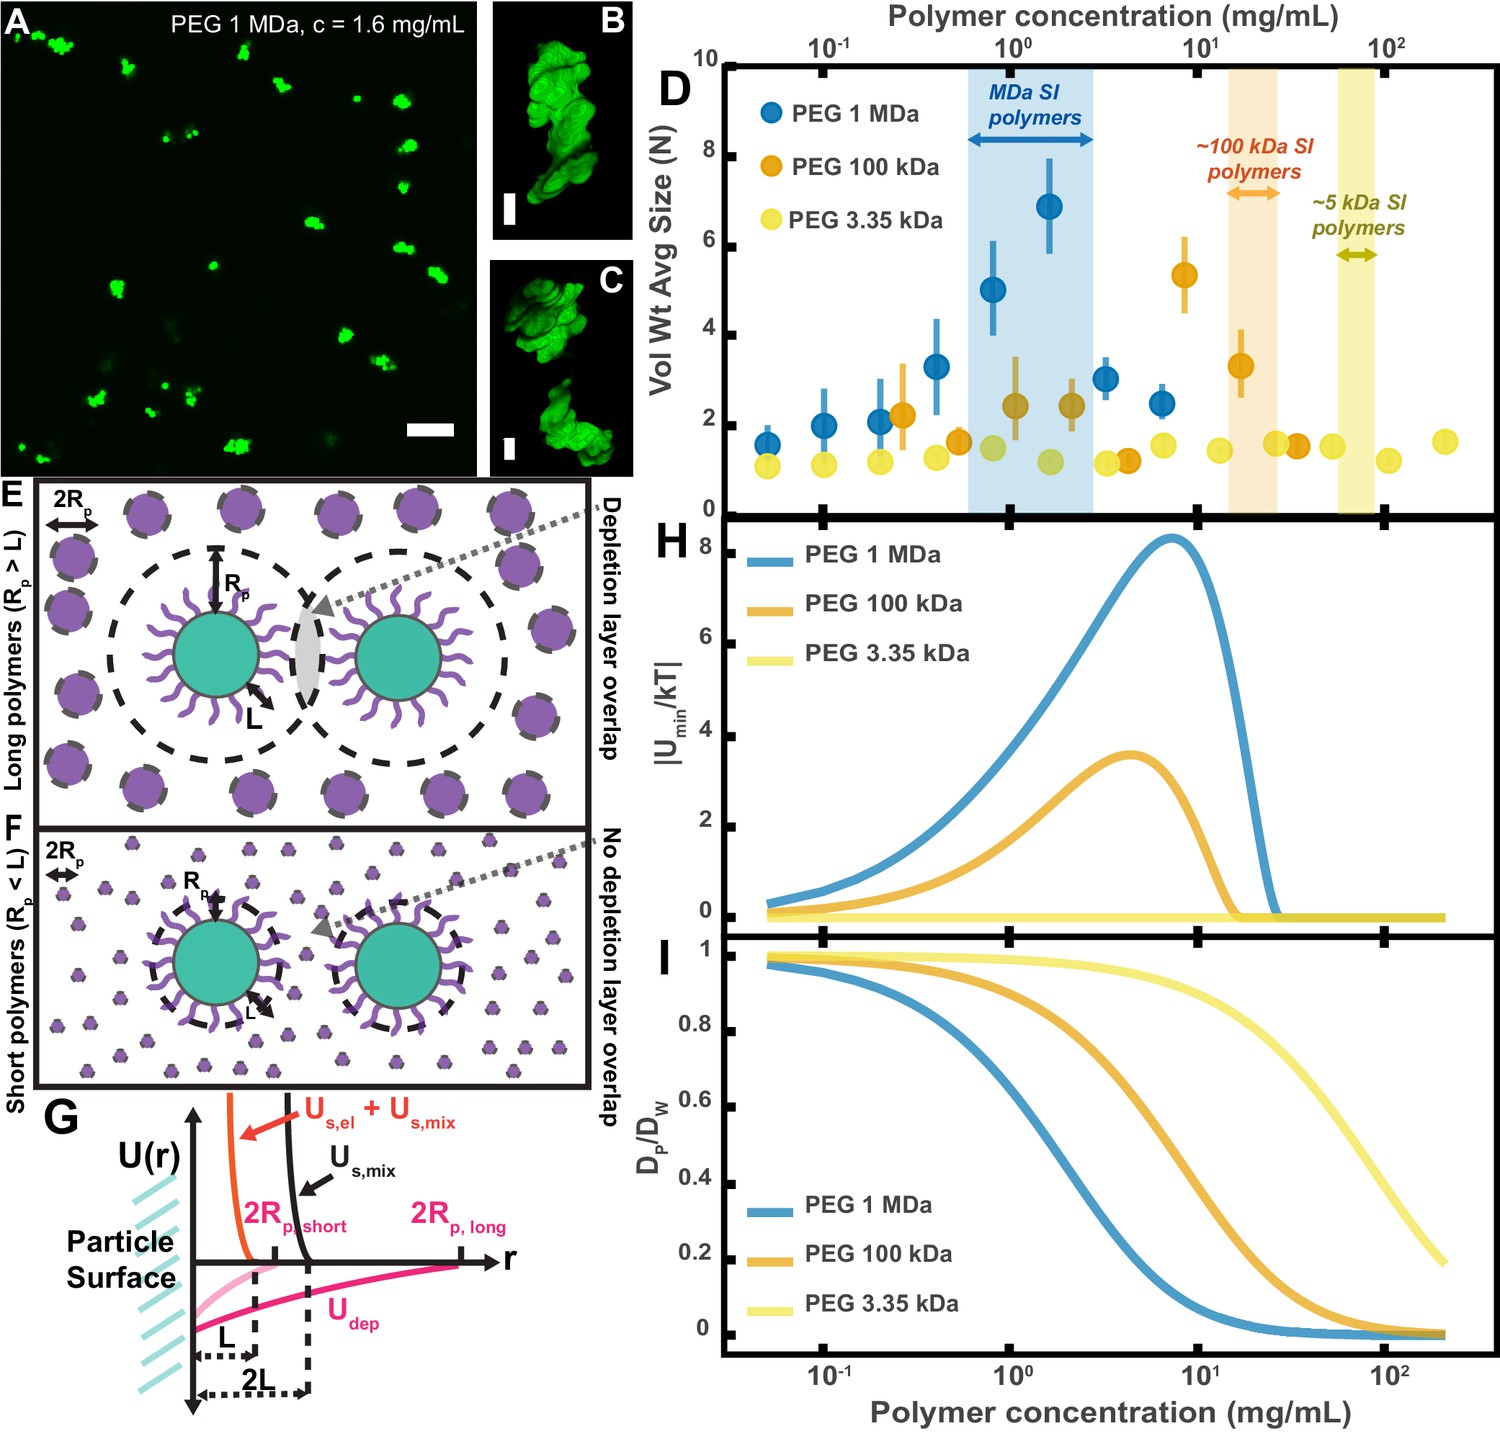
Aggregation of PEG-coated particles in model polymer solutions shows complex dependence on molecular weight (MW) and concentration of PEG.
(A) Aggregates of 1 µm diameter PEG-coated particles in a 1 MDa PEG solution with a polymer concentration (c) of 1.6 mg/mL. Image is a maximum z-projection of 10 optical slices taken on a confocal microscope. Scale bar is 10 µm. (B and C) 3D renders of aggregates found in panel A. Scale bars are 2 µm. (D) Volume-weighted average sizes for serial dilutions of PEG solutions of three MWs (1 MDa, 100 kDa, and 3350 Da). Volume-weighted average sizes are plotted on the vertical axis in terms of number of particles per aggregate (N) against polymer mass concentration (cp) in mg/mL. The vertical error bars are 95% empirical bootstrap CI (see Materials and methods for bootstrapping procedure). Shaded regions indicate the concentration ranges of detected intestinal polymers of similar MW. (E) Schematic depicting depletion interactions induced by ‘long polymers’ (polymer radius (RP) >length of the brush, L). Free polymers are depicted as purple spheres. Colloids are depicted in green with the grafted brush layer in purple. The depletion layer around each colloid is depicted by dashed lines. The overlap region between the two depletion layers is indicated in grey. (F) Schematic depicting depletion interactions induced by ‘short polymers’ (Rp <L). The depletion zone does not extend past the length of the brush and there is effectively no overlap in the depletion layers; the depletion attractions are ‘buried’ within the steric layer. (G) Schematic depicting the different contributions to the inter-particle potential (U(r)) against inter-particle separation distance (r). The hard surfaces of the particles are in contact at r = 0. Udep depicts the depletion potential for a short polymer (RP,short) and a long polymer (RP,long). Us,mix shows the contribution to the steric potential due to mixing. Us,el + Us,mix shows the contribution due to elastic deformations and mixing at close inter-particle separations. (H) The magnitude of the minima of the inter-particle potential (Umin/kT) plotted against polymer concentration for the three PEG solutions in (D). (I) Diffusion coefficients estimated from the Stokes–Einstein–Sutherland equation for 1 µm particles in the PEG solutions used in (D). Diffusion coefficients of particles in polymer solutions (DP) are normalized by the diffusion coefficients in water (DW) and plotted against polymer concentration.
Figure 4—figure supplement 1
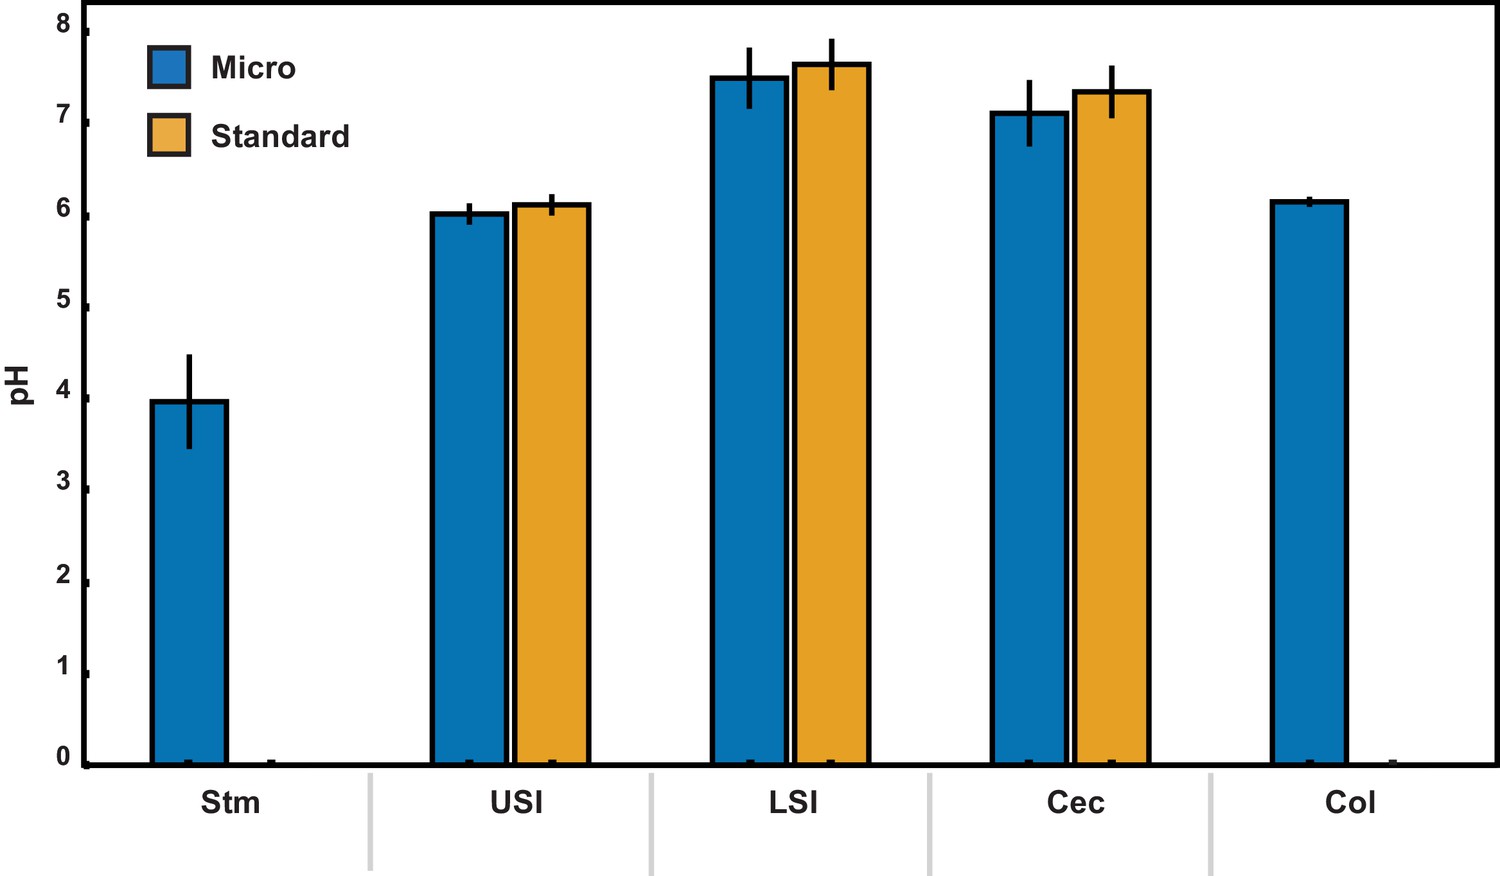
pH measurements of luminal fluid from different sections of the gastrointestinal tract.
Measurements were conducted on pooled samples of luminal fluid collected from two groups of mice. Each measurement was repeated three times, and the error bars are the standard deviation across the six trials (three trials per group). Micro (blue) indicates measurements that were conducted using a micro pH electrode. Standard (orange) indicates measurements that were conducted using a standard pH electrode. For the stomach and colon samples there was insufficient luminal fluid from both groups to submerge the tip of the standard pH electrode, so measurements were only taken with the micro pH electrode. Stm = stomach, USI = upper small intestine. LSI = lower small intestine, Cec = cecum, and Col = colon.
Figure 4—figure supplement 2
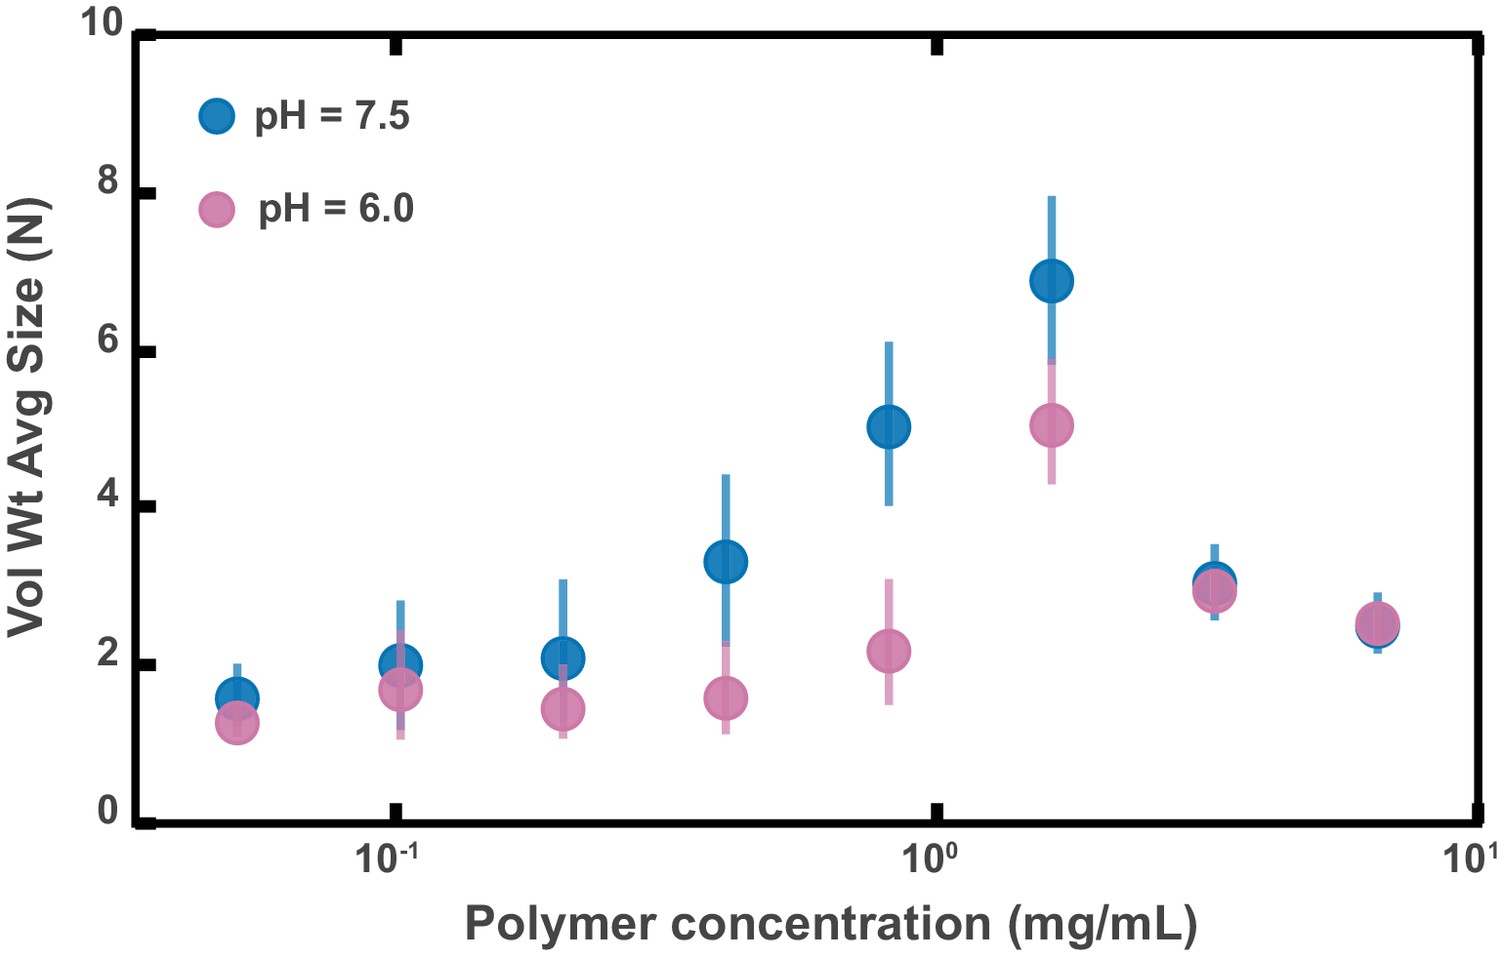
Aggregation of PEG-coated particles in model polymer solutions with different pH.
(A) Volume-weighted average sizes for serial dilutions of 1 MDa PEG solutions in a phosphate buffered saline solution with (labeled pH = 6.0) and in Hanks' balanced salt solution (HBSS) with (same data from Figure 4D). Volume-weighted average sizes are plotted on the vertical axis in terms of number of particles per aggregate (N) against polymer mass concentration (cp) in mg/mL. The vertical error bars are 95% empirical bootstrap CI (see Materials and methods for bootstrapping procedure).
Figure 4—figure supplement 3
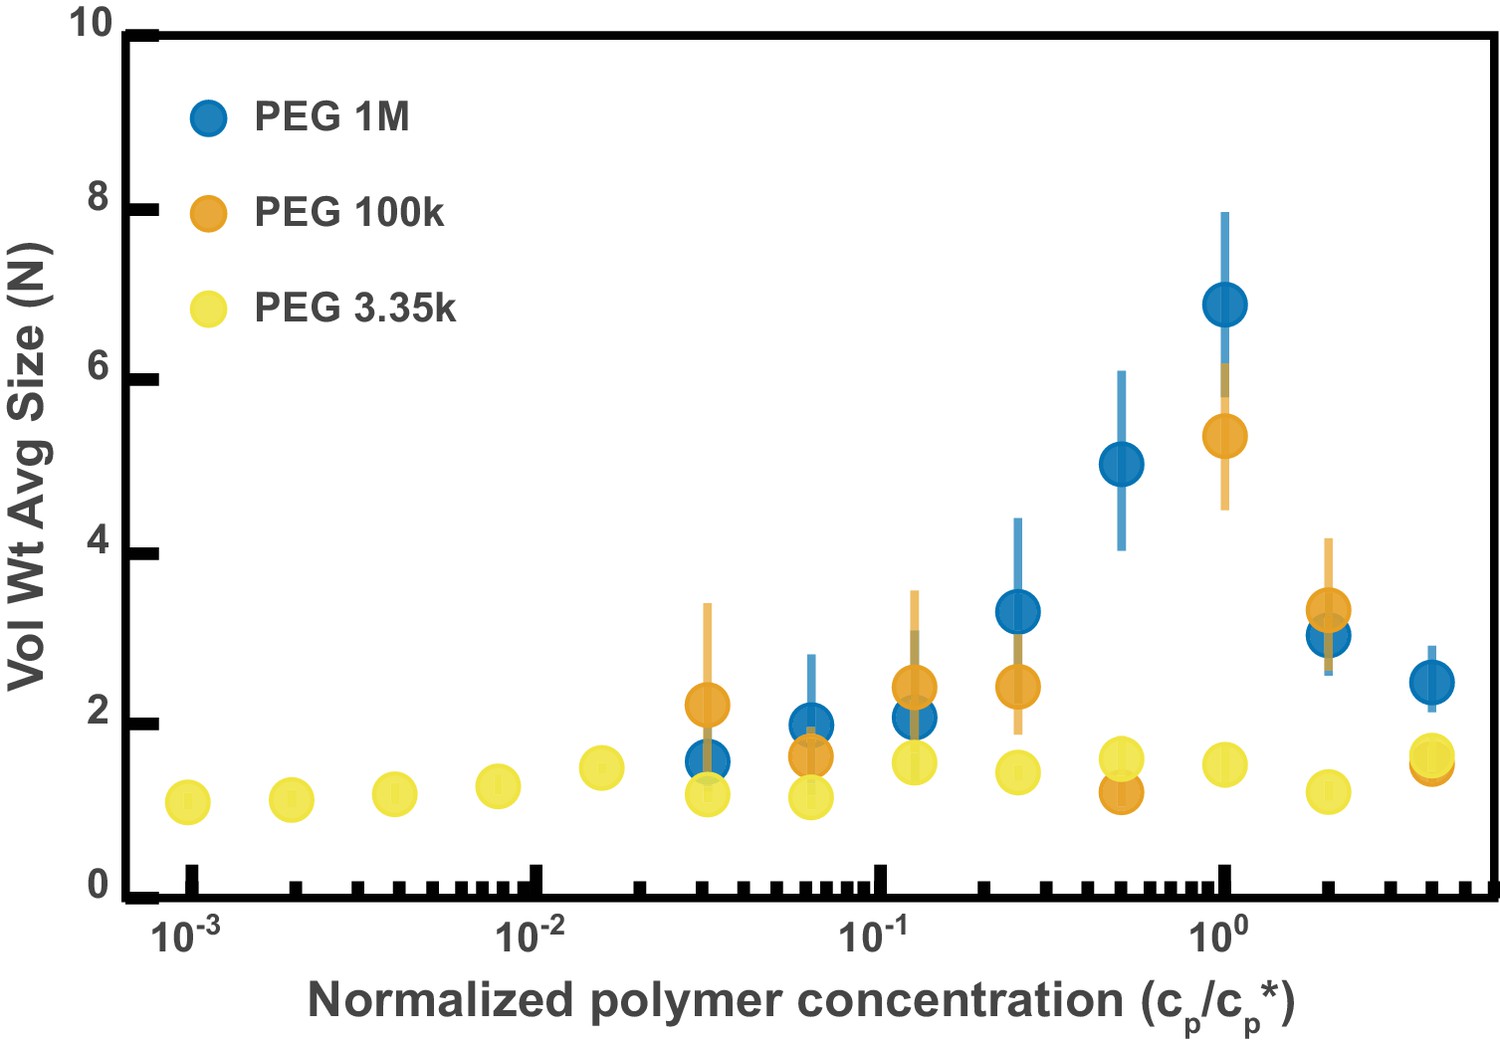
Aggregation of PEG-coated particles in model polymer solutions from Figure 4D normalized by polymer overlap concentration.
Volume-weighted average sizes for serial dilutions of 1 MDa PEG solutions in Hanks' balanced salt solution (HBSS). Volume-weighted average sizes are plotted on the vertical axis in units of number of particles per aggregate (N) against the ‘normalized polymer concentration.’ The normalized polymer concentration is the polymer mass concentration (cp) in mg/mL divided by the overlap concentration of each polymer solution (cp*) in mg/mL. The overlap concentrations for PEG 1 MDa, 100 kDa, and 3350 Da are cp*=1.6, 8.6, and 52.6 mg/mL, respectively. The vertical error bars are 95% empirical bootstrap CI (see Materials and methods for bootstrapping procedure).
Figure 5 with 1 supplement
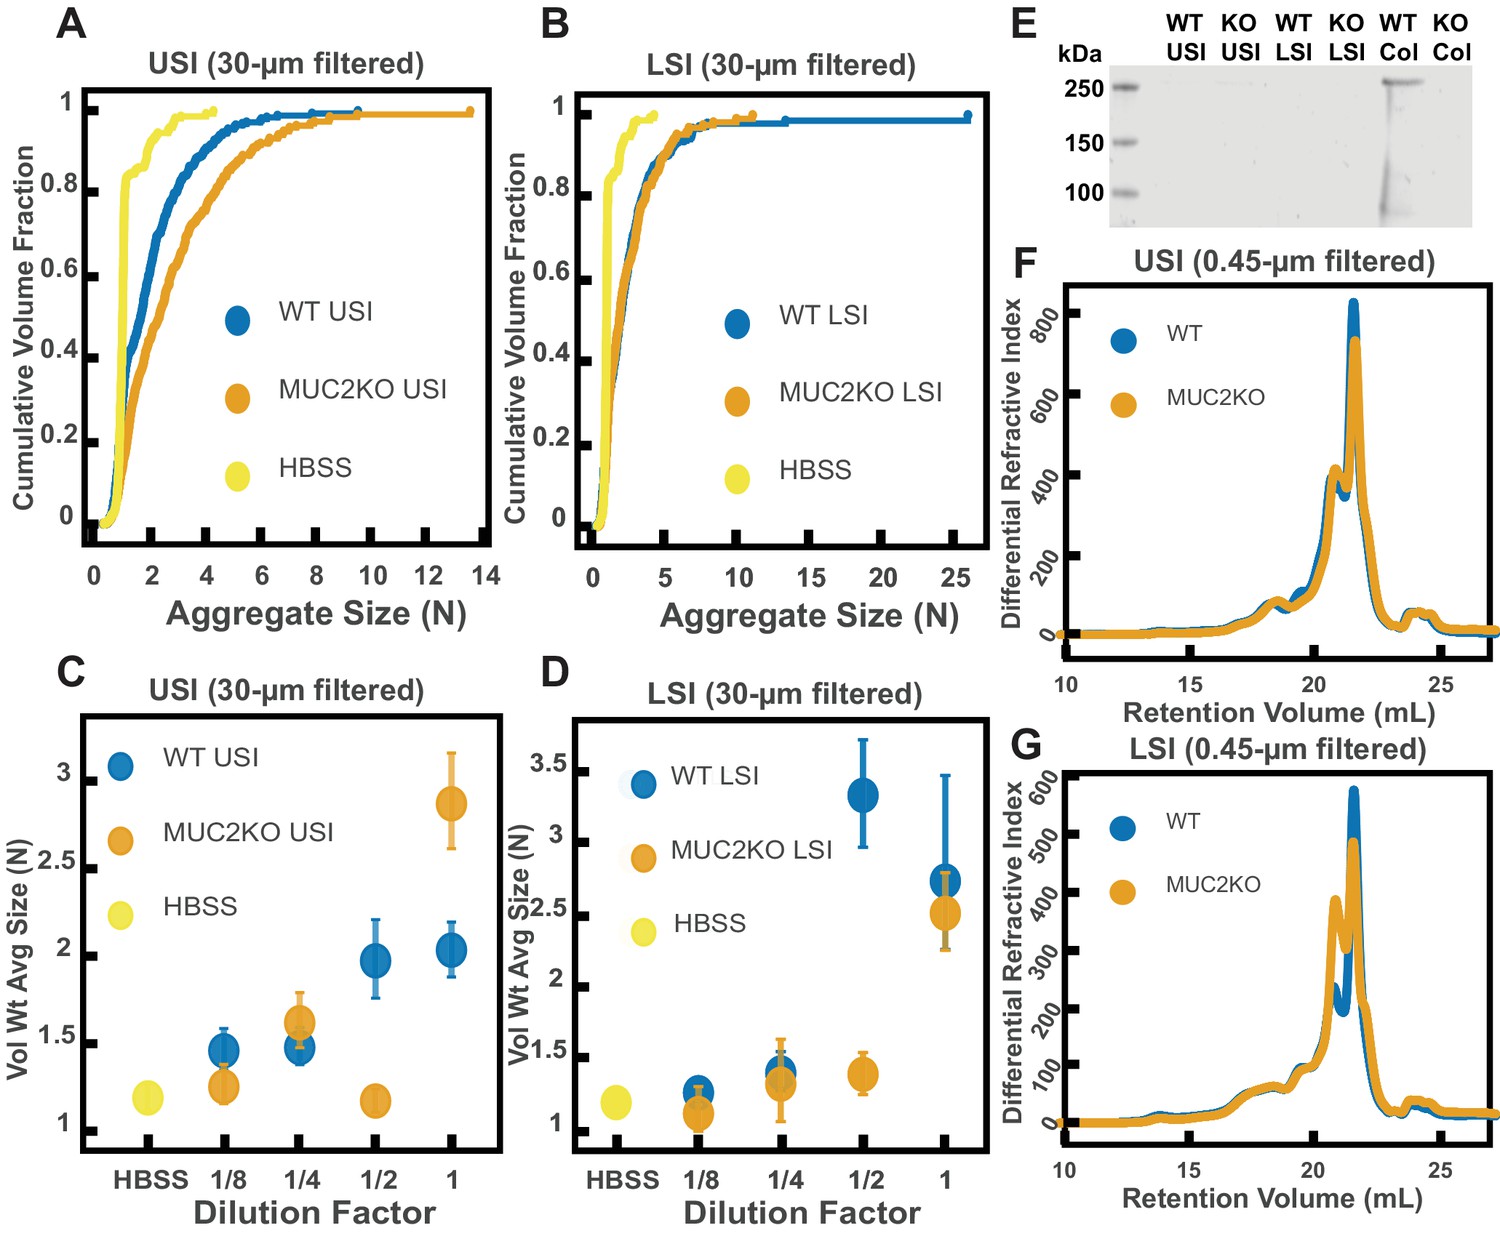
Quantification of the aggregation of particles in the small intestine (SI) in MUC2 knockout (MUC2KO) and wild-type (WT) mice.
(A and B) Volume-weighted empirical cumulative distribution functions (ECDFs) comparing aggregation of the particles in undiluted, 30 µm filtered samples from the upper (A) and lower (B) SI of two separate groups of wild-type (WT) and MUC2-knockout (MUC2KO) mice to the control (particles suspended in HBSS). The vertical axis is the cumulative volume fraction of the total number of particles in solution in an aggregate of a given size; the horizontal axis is aggregate size in number of particles per aggregate (N). (C and D). Volume-weighted average aggregate sizes (Vol Wt Avg Size) for serial dilutions of 30-µm-filtered samples from the upper (C) and lower (D) SI of two separate groups of WT and MUC2KO mice. The dilution factor is plotted on the horizontal axis; a dilution factor of 1 is undiluted, ½ is a two-fold dilution. The vertical error bars are 95% empirical bootstrap CI (see Materials and methods). (E) Western blots of 30 µm filtered samples from the SI and the colon of WT and MUC2KO mice. WT USI = WT upper SI; KO USI = KO lower SI; WT LSI = WT lower SI; KO USI = KO upper SI; WT Col = WT colon; KO Col = KO colon (F and G). Chromatograms of samples from the upper (F) and lower (G) SI of groups of WT and MUC2KO mice.
Figure 5—figure supplement 1
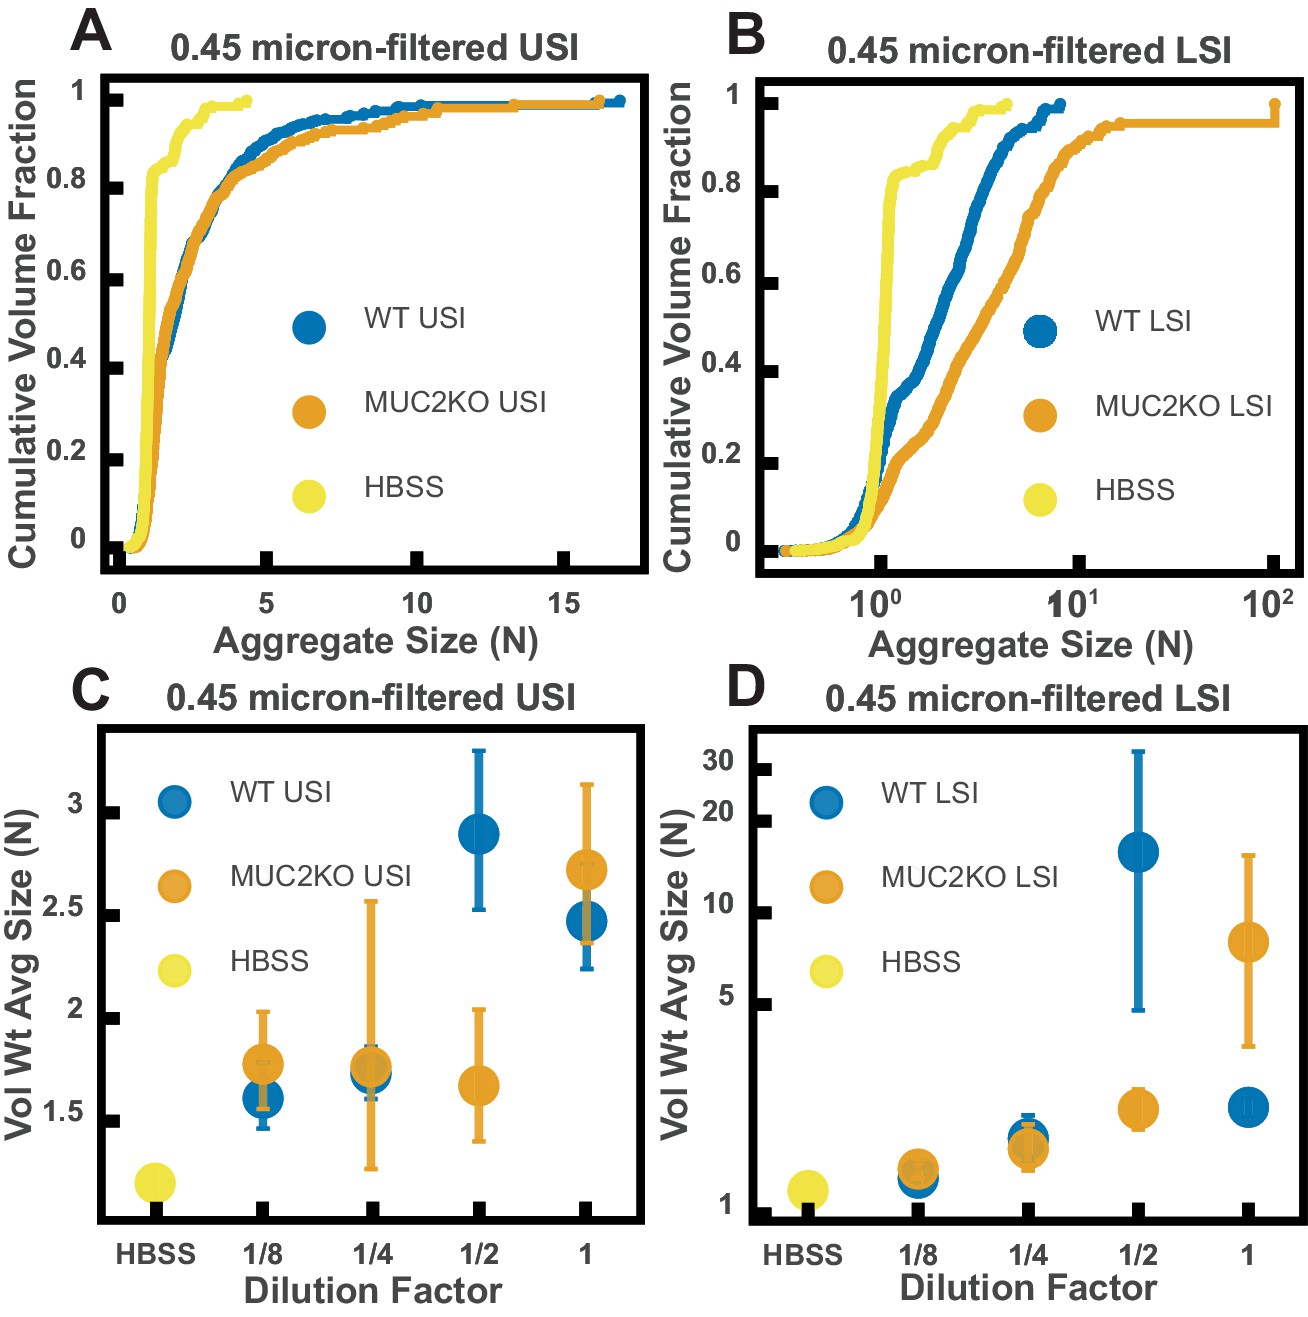
Ex vivo aggregation in 0.45 µm-filtered luminal fluid from the small intestines (SI) of wild-type (WT) and MUC2 knockout (MUC2KO) mice.
(A and B) Volume-weighted empirical cumulative distribution functions (ECDFs) comparing aggregation of the particles in undiluted, 0.45-µm-filtered samples from the upper (A) and lower (B) SI of two separate groups of WT and MUC2KO mice to the control (particles suspended in HBSS). The vertical axis is the cumulative volume fraction of the total number of particles in solution in an aggregate of a given size. The horizontal axis is aggregate size in number of particles per aggregate (N). (C and D) Volume-weighted average aggregate sizes (Vol Wt Avg Size) for serial dilutions of 0.45 µm-filtered samples from the upper (C) and lower (D) SI of two separate groups of WT and MUC2KO mice. Volume-weighted average sizes are plotted on the vertical axis in terms of number of particles per aggregate (N). The dilution factor is plotted on the horizontal axis, where a dilution factor of 1 is undiluted and ½ is a two-fold dilution. The control (particles suspended in HBSS) is plotted as a dilution factor of 0. The vertical error bars are 95% empirical bootstrap CI using the bootstrapping procedure described in Materials and methods.
Figure 6 with 3 supplements
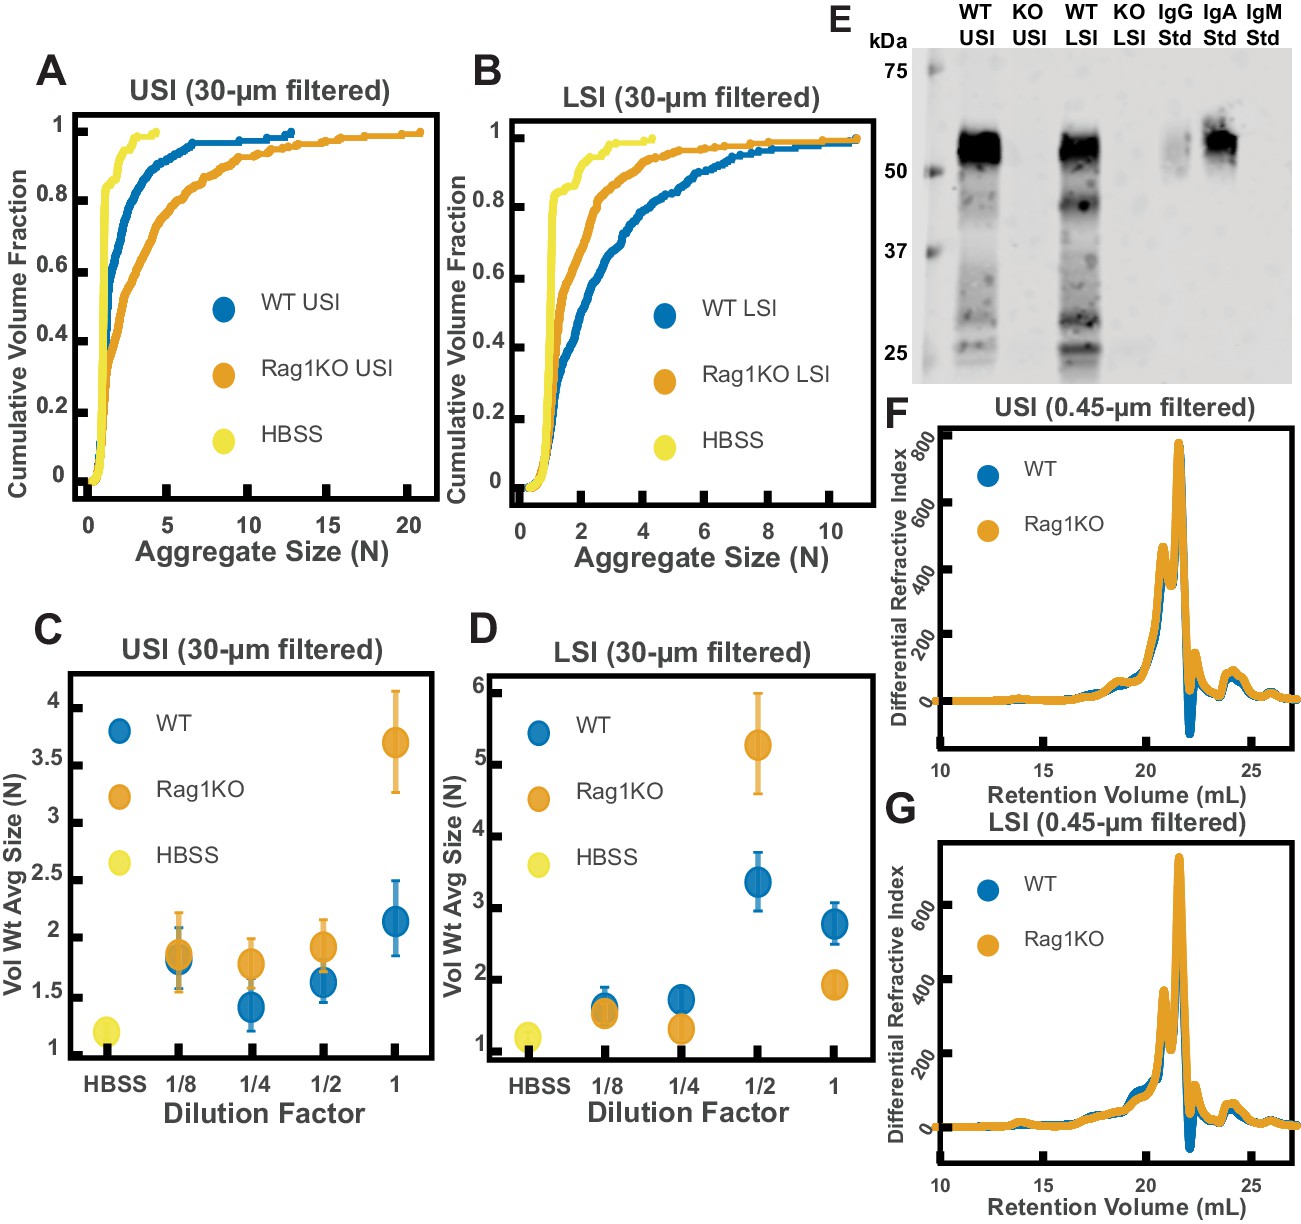
Quantification of the aggregation of particles in the small intestine (SI) in immunoglobulin-deficient (Rag1KO) and wild-type (WT) mice.
(A and B) Volume-weighted empirical cumulative distribution functions (ECDFs) comparing aggregation of the particles in undiluted, 30 µm filtered samples from the upper (A) and lower (B) SI of two separate groups of wild-type (WT) and immunoglobulin-deficient (Rag1KO) mice to the control (particles suspended in HBSS). Plotted on the vertical axis is the cumulative volume fraction of the total number of particles in solution in an aggregate of a given size. Plotted on the horizontal axis are aggregate sizes in number of particles. (C and D). Volume-weighted average aggregate sizes (Vol Wt Avg Size) for serial dilutions of 30 µm filtered samples from the upper (C) and lower (D) SI of two separate groups of WT and Rag1KO mice. The dilution factor is plotted on the horizontal axis, where a dilution factor of 1 is undiluted, ½ is a two-fold dilution, and so on. The vertical error bars are 95% empirical bootstrap CI using the bootstrapping procedure described in Materials and methods. (E) Western blots of 30 µm filtered samples from the SI of WT and Rag1KO mice. WT USI = WT upper SI; KO USI = KO lower SI; WT LSI = WT lower SI; KO USI = KO upper SI. (F and G) Chromatograms of samples from the upper (F) and lower (G) SI of groups of WT and Rag1KO mice.
Figure 6—figure supplement 1
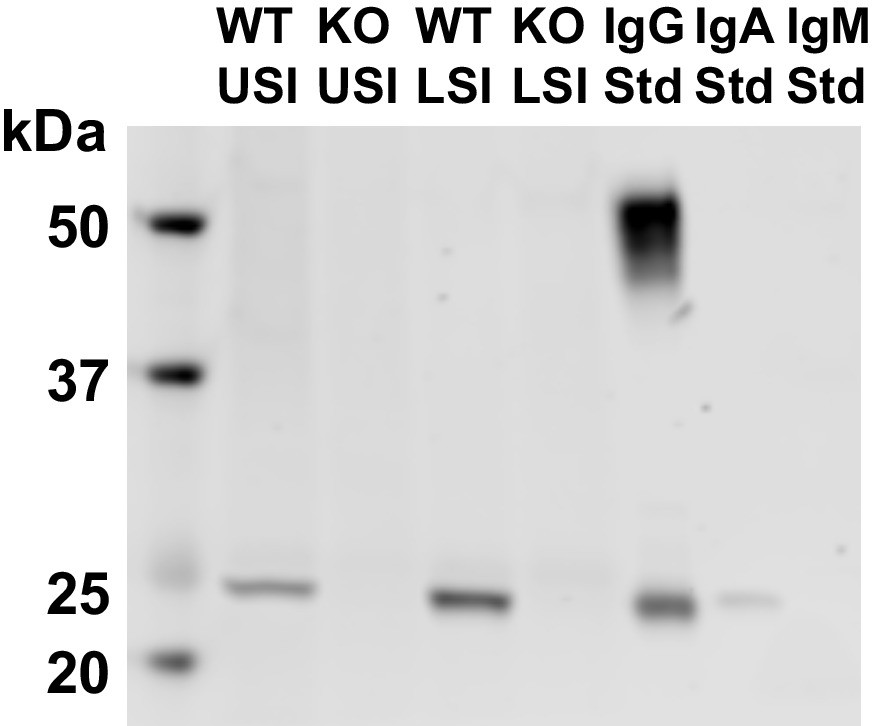
Western blots of 30 µm-filtered samples from the small intestine (SI) of wild-type (WT) and Rag1 knockout (Rag1KO) mice.
WT USI = WT upper SI; KO USI = KO lower SI; WT LSI = WT lower SI; KO USI = KO upper SI. For the detection of IgG, 1:10,000 dilutions of Li-Cor IRDye 800 CW Goat Anti-Mouse IgG was used. Because the Anti-IgG antibody appears to be binding to just the light chains (around 25 kDa), we suspect that it is mostly binding to IgA. Li-Cor’s published validation (https://www.licor.com/bio/products/reagents/secondary_antibodies/irdye_800cw.html) found that the antibody binds to the heavy and light chains of IgG and just the light chains of IgA. Because we see binding of the antibody to both the heavy and light chains in the IgG standard, but only binding to a light chain in the SI samples and the IgA control, this suggests that we are detecting the light chains of IgA in the SI samples.
Figure 6—figure supplement 2
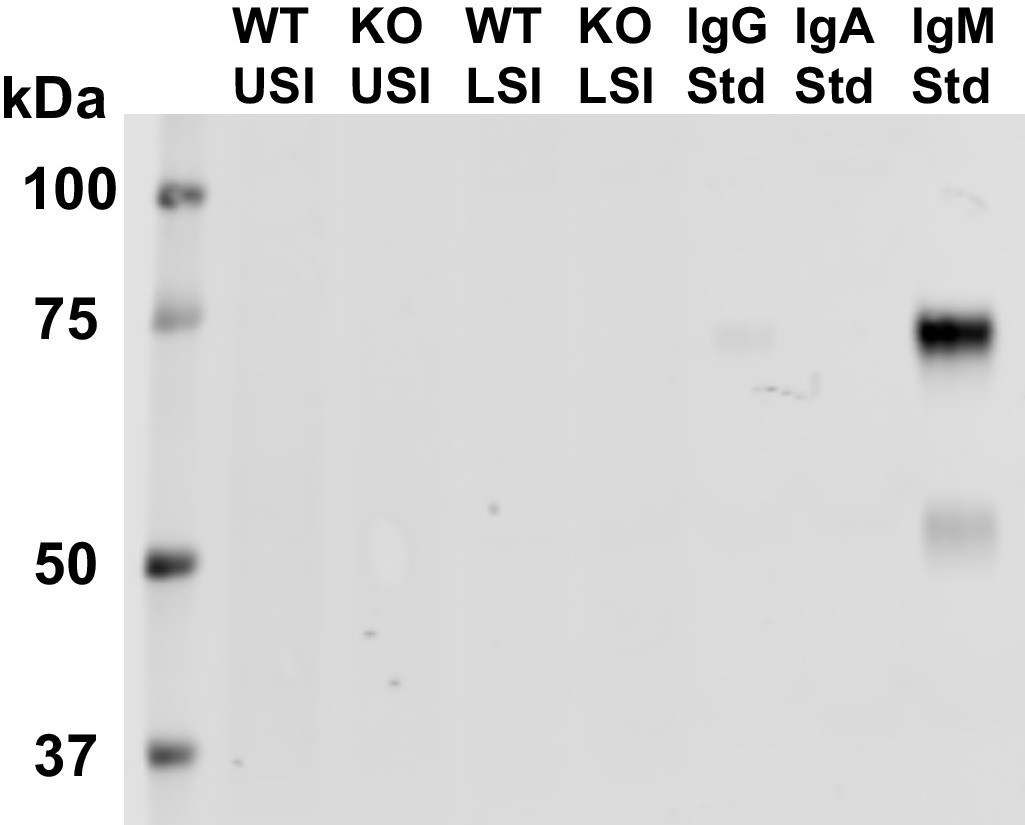
Western blots of 30 µm-filtered samples from the small intestine (SI) of wild-type (WT) and Rag1 knockout (Rag1KO) mice.
WT USI = WT upper SI; KO USI = KO lower SI; WT LSI = WT lower SI; KO USI = KO upper SI. For detection of IgM, 1:10,000 dilution of Li-Cor IRDye 800CW Goat Anti-Mouse IgM was used. We do not detect IgM in any of the SI samples.
Figure 6—figure supplement 3
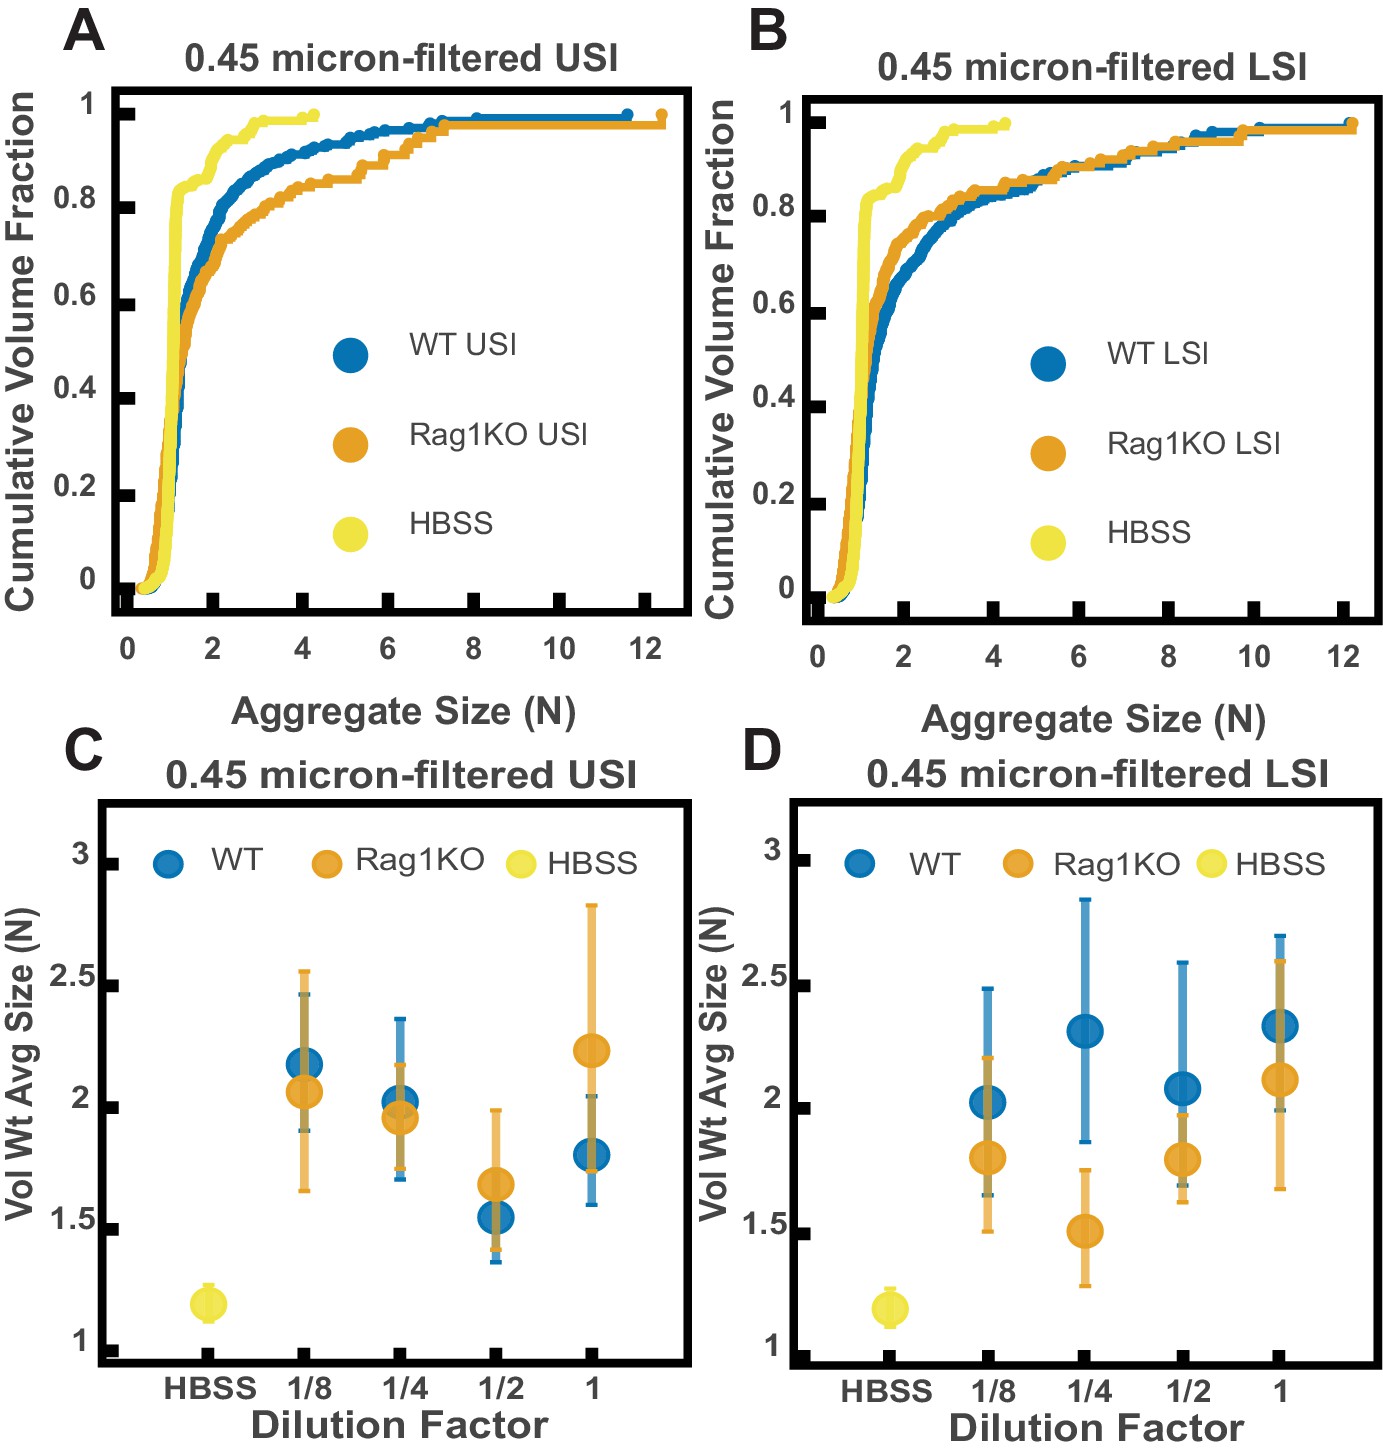
Ex vivo aggregation in 0.45-µm-filtered luminal fluid from the small intestines (SI) of wild-type (WT) and Rag1 knockout (Rag1KO) mice.
(A and B) Volume-weighted empirical cumulative distribution functions (ECDFs) comparing aggregation of the particles in undiluted, 0.45-µm-filtered samples from the upper (A) and lower (B) SI of two separate groups of WT and immunoglobulin-deficient (Rag1KO) mice to the control (particles suspended in HBSS). Plotted on the vertical axis is the cumulative volume fraction of the total number of particles in solution in an aggregate of a given size. Plotted on the horizontal axis are aggregate sizes in number of particles per aggregate (N). (C and D). Volume-weighted average aggregate sizes (Vol Wt Avg Size) for serial dilutions of 0.45-µm-filtered samples from the upper (C) and lower (D) SI of two separate groups of WT and Rag1KO mice. Volume-weighted average sizes are plotted on the vertical axis in terms of number of particles per aggregate (N). The dilution factor is plotted on the horizontal axis, where a dilution factor of 1 is undiluted and ½ is a two-fold dilution. The control (particles suspended in HBSS) is plotted as a dilution factor of 0. The vertical error bars are 95% empirical bootstrap CI using the bootstrapping procedure described in Materials and methods.
Figure 7
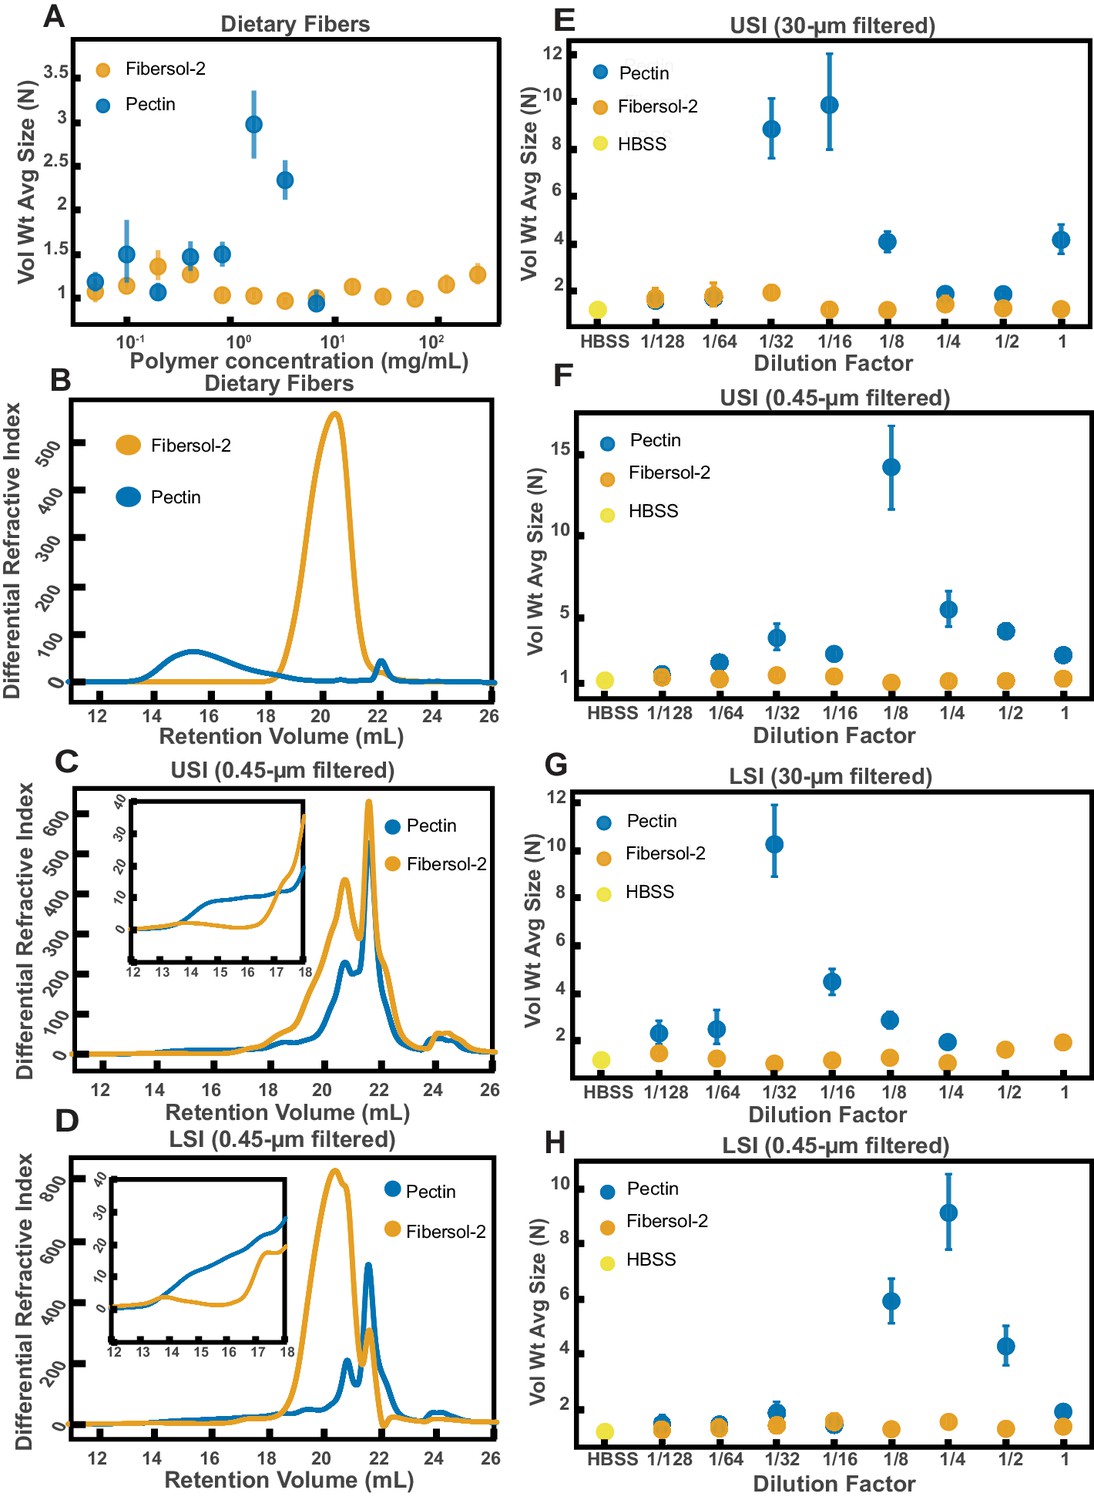
Quantification of aggregation of PEG-coated particles in the small intestine (SI) of mice fed different polymers from dietary fiber.
(A) Volume-weighted average aggregate sizes (Vol Wt Avg Size) for serial dilutions of apple pectin and Fibersol-2. Volume-weighted average sizes are plotted on the vertical axis in terms of number of particles per aggregate (N) against polymer concentration (mg/mL). The vertical error bars are 95% empirical bootstrap CI using the bootstrapping procedure described in Materials and methods. (B) Chromatograms of apple pectin and Fibersol-2 in buffer. (C and D) Chromatograms of samples from the upper (E) and lower (F) SI of two separate groups of mice (fed pectin or Fibersol-2). (E-H) Volume-weighted average aggregate sizes (Vol Wt Avg Size) for serial dilutions of 30-µm-filtered samples from the upper (E) and lower (G) SI of two separate groups of mice (fed pectin or Fibersol-2) to the control (particles suspended in HBSS). (F and H) Serial dilutions of 0.45-µm-filtered samples from the same groups. The dilution factor is plotted on the horizontal axis, where a dilution factor of 1 is undiluted, and ½ is a two-fold dilution. The vertical error bars are 95% empirical bootstrap CI using the bootstrapping procedure described in Materials and methods.
Tables
Table 1
Zeta potential and NMR measurements of PEG-coated particles.
For the zeta potential measurements, each particle solution was 0.1 mg/ml of particles in 1 mM KCl. Measurements were done on a Brookhaven NanoBrook ZetaPALS Potential Analyzer. Three trials were done where each trial was 10 runs and each run was 10 cycles. Values reported are the average zeta potential for the 30 runs. NMR measurements were performed as described in Materials and methods. Values are estimates of the nanomoles of polyethylene glycol (PEG) per milligrams of particles. To calculate this, we have to assume all the PEG on the surface is a single MW. It is therefore assumed all the PEG on the surface is PEG 5 kDa.
| Surface modification of PS particles | Zeta potential (mV) | Nanomoles PEG/mg particles |
|---|---|---|
| PEG 5 kDa | −18.87 ± 1.78 | 5.5 |
| PEG 5 kDa w/ mPEG 1 kDa backfill | −7.66 ± 2.12 | 4.6 |
| PEG 5 kDa w/ mPEG 350 Da backfill | −9.99 ± 1.65 | 4.3 |
| PEG 5 kDa w/ mPEG 5 kDa backfill | −14.56 ± 1.78 | 4.0 |
| PEG 2 kDa | −39.59 ± 2.41 | 9.4 |
| Carboxylate-coated (no PEG) | −61.36 ± 12.40 | 0.0 |
Table 2
Estimates of physical parameters of polymers from gel permeation chromatography for liquid fractions from the upper small intestine of MUC2 knockout (MUC2KO) and wild-type (WT) mice.
https://doi.org/10.7554/eLife.40387.013| Retention volume (mL) | 11 to 16 | 16 to 20 | >20 | ||||
|---|---|---|---|---|---|---|---|
| Mouse type | WT | MUC2KO | WT | MUC2KO | WT | MUC2KO | |
| Mw (kDa) | 3,560 ± 410 | 5,420 ± 620 | 162 ± 20 | 147 ± 17 | 4.05 ± 0.46 | 2.96 ± 0.34 | |
| Mw/Mn | 1.36 | 1.59 | 2.16 | 2.43 | 3.59 | 10.9 | |
| Rh (nm) | 49.1 | 45.5 | 6.31 | 5.95 | 1.18 | 1.02 | |
| Fract. Conc. (mg/mL) | 2.52 ± 0.29 | 1.18 ± 0.13 | 24.6 ± 2.8 | 21.9 ± 2.5 | 88.7 ± 10.1 | 86.0 ± 9.8 | |
-
We calculated values with both dn/dc = 0.185 (for proteins) and dn/dc = 0.147 (pullulan). When the value varied with dn/dc, it is reported in the table as the mid-range values ± the absolute deviation between the two calculated values. Mw = the weight-average molecular weight; Mw/Mn = the dispersity; Rh = hydrodynamic radius; Fract. Conc. = Concentration of a given molecular weight fraction.
Table 3
Estimates of physical parameters of polymers from gel permeation chromatography for liquid fractions from the lower small intestine of MUC2 knockout (MUC2KO) and wild-type (WT) mice
https://doi.org/10.7554/eLife.40387.014| Retention volume (mL) | 11 to 16 | 16 to 20 | >20 | |||
|---|---|---|---|---|---|---|
| Mouse type | WT | MUC2KO | WT | MUC2KO | WT | MUC2KO |
| Mw (kDa) | 4,730 ± 540 | 5,180 ± 590 | 219 ± 25 | 155 ± 18 | 13.7 ± 1.6 | 5.93 ± 0.68 |
| Mw/Mn | 1.24 | 1.80 | 1.91 | 1.84 | 1.88 | 2.03 |
| Rh (nm) | 57.0 | 49.2 | 8.45 | 7.58 | 1.89 | 1.35 |
| Fract. Conc. (mg/mL) | 3.42 ± 0.39 | 2.36 ± 0.27 | 23.0 ± 2.6 | 22.8 ± 2.6 | 54.8 ± 6.3 | 63.3 ± 7.2 |
-
We calculated values with both dn/dc = 0.185 (for proteins) and dn/dc = 0.147 (pullulan). When the value varied with dn/dc, it is reported in the table as the mid-range values ± the absolute deviation between the two calculated values. Mw = the weight-average molecular weight; Mw/Mn = the dispersity; Rh = hydrodynamic radius; Fract. Conc. = Concentration of a given molecular weight fraction.
Table 4
Estimates of physical parameters of polymers from gel permeation chromatography for liquid fractions from the upper small intestine of immunoglobulin-deficient (Rag1KO) and wild-type (WT) mice.
https://doi.org/10.7554/eLife.40387.019| Retention volume (mL) | 11 to 16 | 16 to 20 | >20 | |||
|---|---|---|---|---|---|---|
| Mouse type | WT | Rag1KO | WT | Rag1KO | WT | Rag1KO |
| Mw (kDa) | 1,480 ± 170 | 2,140 ± 250 | 108 ± 12 | 74.2 ± 8.5 | 2.84 ± 0.32 | 1.91 ± 0.22 |
| Mw/Mn | 1.09 | 1.14 | 2.62 | 2.42 | 1.59 | 1.54 |
| Rh (nm) | 31.8 | 39.8 | 4.77 | 2.51 | 1.078 | 0.936 |
| Fract. Conc. (mg/mL) | 1.07 ± 0.12 | 1.13 ± 0.13 | 14.3 ± 1.6 | 13.9 ± 1.6 | 66.1 ± 7.6 | 70.5 ± 8.1 |
-
We calculated values with both dn/dc = 0.185 (for proteins) and dn/dc = 0.147 (pullulan). When the value varied with dn/dc, it is reported in the table as the mid-range value ± the absolute deviation between the two calculated values. Mw = the weight-average molecular weight; Mw/Mn = the dispersity; Rh = hydrodynamic radius; Fract. Conc. = Concentration of a given molecular weight fraction.
Table 5
Estimates of physical parameters of polymers from gel permeation chromatography for liquid fractions from the lower small intestine of immunoglobulin-deficient (Rag1KO) and wild-type (WT) mice.
https://doi.org/10.7554/eLife.40387.020| Retention volume (mL) | 11 to 16 | 16 to 20 | >20 | |||
|---|---|---|---|---|---|---|
| Mouse type | WT | Rag1KO | WT | Rag1KO | WT | Rag1KO |
| Mw (kDa) | 1,080 ± 120 | 2,490 ± 290 | 66.9 ± 7.7 | 91.6 ± 10.5 | 3.64 ± 0.42 | 3.72 ± 0.43 |
| Mw/Mn | 1.18 | 1.05 | 1.71 | 1.98 | 2.09 | 1.98 |
| Rh (nm) | 34.6 | 47.1 | 4.67 | 4.85 | 1.116 | 1.09 |
| Fract. Conc. (mg/mL) | 1.52 ± 0.17 | 1.89 ± 0.22 | 15.8 ± 1.8 | 14.1 ± 1.6 | 49.5 ± 5.7 | 55.1 ± 6.3 |
-
We calculated values with both dn/dc = 0.185 (for proteins) and dn/dc = 0.147 (pullulan). When the value varied with dn/dc, it is reported in the table as the mid-range values ± the absolute deviation between the two calculated values. Mw = the weight-average molecular weight; Mw/Mn = the dispersity; Rh = hydrodynamic radius; Fract. Conc. = Concentration of a given molecular weight fraction.
Table 6
Gel permeation chromatography of Fibersol-2 and pectin in phosphate-buffered saline
https://doi.org/10.7554/eLife.40387.022| Sample | Fibersol-2 | Pectin |
|---|---|---|
| Mw (kDa) | 3.48 | 232 |
| Mw/Mn | 10.5 | 1.97 |
| Rh (nm) | 1.24 | 25.4 |
-
Both fiber types were analyzed with dn/dc = 0.147 for polysaccharides. Mw = weight-average molecular weight; Mw/Mn = the dispersity; Rh = hydrodynamic radius
Table 7
Estimates of physical parameters of polymers from gel permeation chromatography for liquid fractions from upper small intestine of pectin and Fibersol-2 fed mice.
https://doi.org/10.7554/eLife.40387.023| Retention volume (mL) | 11 to 16 | 16 to 20 | >20 | |||
|---|---|---|---|---|---|---|
| Mouse type | Pectin | Fibersol-2 | Pectin | Fibersol-2 | Pectin | Fibersol-2 |
| Mw (kDa) | 267 ± 31 | 686 ± 79 | 40.0 ± 4.5 | 35.3 ± 4.0 | 1.39 ± 0.16 | 1.67 ± 0.19 |
| Mw/Mn | 1.50 | 1.08 | 2.15 | 2.64 | 2.45 | 1.48 |
| Rh (nm) | 31.8 | N/C** | 5.52 | 2.88 | 0.819 | N/C** |
| Fract. Conc. (mg/mL) | 1.62 ± 0.19 | 0.516 ± 0.059 | 9.00 ± 1.03 | 23.3 ± 2.7 | 53.7 ± 6.1 | 77.0 ± 8.8 |
-
We calculated values with both dn/dc = 0.185 (for proteins) and dn/dc = 0.147 (pullulan). When the value varied with dn/dc, it is reported in the table as the mid-range values ± the absolute deviation between the two calculated values. Mw = the weight-average molecular weight; Mw/Mn = the dispersity; Rh= hydrodynamic radius; Fract. Conc. = Concentration of a given molecular weight fraction. N/C** denotes values for which the concentration was too low to calculate.
Table 8
Estimates of physical parameters of polymers from gel permeation chromatography for liquid fractions from lower small intestine of pectin and Fibersol-2-fed mice.
https://doi.org/10.7554/eLife.40387.024| Retention volume (mL) | 11 to 16 | 16 to 20 | >20 | |||
|---|---|---|---|---|---|---|
| Mouse type | Pectin | Fibersol-2 | Pectin | Fibersol-2 | Pectin | Fibersol-2 |
| Mw (kDa) | 282 ± 32 | 1680 ± 190 | 30.2 ± 3.5 | 18.8 ± 2.2 | 1.12 ± 0.13 | 2.32 ± 0.27 |
| Mw/Mn | 7.37 | 1.64 | 1.70 | 2.78 | 2.89 | 1.14 |
| Rh (nm) | 29.0 | 26.4 | 5.28 | 2.16 | 0.724 | 1.06 |
| Fract. Conc. (mg/mL) | 2.48 ± 0.28 | 0.839 ± 0.096 | 9.43 ± 1.1 | 53.6 ± 6.1 | 42.7 ± 4.9 | 88.3 ± 10.1 |
-
We calculated values with both dn/dc = 0.185 (for proteins) and dn/dc = 0.147 (pullulan). When the value varied with dn/dc, it is reported in the table as the mid-range values ± the absolute deviation between the two calculated values. Mw = the weight-average molecular weight; Mw/Mn = the dispersity; Rh = hydrodynamic radius; Fract. Conc. = concentration of a given molecular weight fraction.
Key resources table
| Reagent type (species) or resource | Designation | Source or reference | Identifiers | Additional information |
|---|---|---|---|---|
| MUC2KO, C57BL/6 mice (female) | MUC2KO | Eugene Chang Lab (University of Chicago) provided initial breeding pairs which were provided to them from Leonard H. Augenlicht at the Department of Oncology of Albert Einstein Cancer Center | Genotyping was performed by Transnetyx Inc.; Western blot was done to confirm lack of MUC2 (See Figure 5E) | |
| Rag1KO, C57BL/6 mice (male) | Rag1KO | Provided by Mazmanian Lab at Caltech | RRID:IMSR_JAX:002216 | Western blot was done to confirm lack of IgA as explained in the text (See Figure 6E) |
| C57BL/6 mice (all male except for WT controls in MUC2KO experiments in Figure 5) | WT | The Jackson Laboratory | RRID:IMSR_JAX:000664 | |
| Antibody | MUC2 polyclonal antibody (rabbit host) | Biomatik | Cat No: CAU27315 | |
| Antibody | Li-Cor IRDye 800 CW Goat Anti -Rabbit IgG | Li-Cor | P/N 925–32211; RRID:AB_2651127 | |
| Antibody | Li-Cor IRDye 800 CW Goat Anti -Mouse IgG | Li-Cor | P/N 925–32210; RRID:AB_2687825 | |
| Antibody | Li-Cor IRDye 800 CW Goat Anti -Mouse IgM | Li-Cor | P/N 925–32280 | |
| Antibody | Goat Anti-Mouse IgA-unlabeled | Southern Biotech | Cat No: 1040–01 | |
| Antibody | Li-Cor IRDye 800 CW Donkey Anti-Goat IgG | Li-Cor | P/N 925–32214; RRID:AB_2687553 | |
| Chemical compound, drug | apple pectin | Solgar Inc. | ‘Apple pectin powder’; SOLGB70120 00B | |
| Chemical compound, drug | Fibersol-2 | Archer Daniels Midland/ Matsutani LLC | Product code: 013100, Lot #: CY4P28540 | |
| Chemical compound, drug | USP grade sucrose | Sigma-Aldrich | ||
| Chemical compound, drug | Protease inhibitor cocktail | Roche cOmplete, Mini, EDTA-free Protease-Inhibitor cocktail, Roche | ||
| Chemical compound, drug | PEG 100 kDa | Dow | POLYOX WSR N-10 | |
| Chemical compound, drug | PEG 1 MDa | Dow | POLYOX WSR N-12K | |
| Chemical compound, drug | PEG 3350 | Bayer | MiraLAX | |
| Chemical compound, drug | Hanks' Balanced Salt Solution (without calcium, magnesium, phenol red) | GE Healthcare Life Sciences | Product code: SH30588.02 | |
| Software, algorithm | 3D aggregate analysis pipeline | This paper; source code available through Dryad | Description in Materials and methods; source code provided on Dryad | |
| Other | mesh-bottom (or wire-bottom) floors | Lab Products, Inc. | P/N: 75016 | |
| Other | 1 μm diameter PEG 5 kDa-coated polysytrene beads | This paper | Description of synthesis in Materials and methods | |
| Other | 1 μm diameter PEG 5 kDa-coated polysytrene beads with PEG 1 kDa ‘back-filling’ | This paper | Description of synthesis in Materials and methods | |
| Other | standard chow diet | PicoLab | PicoLab Rodent Diet 20; Product #5053 | |
| Other | autoclaved chow diet | PicoLab | Laboratory Autoclavable Rodent Diet 5010 |
Additional files
-
Transparent reporting form
- https://doi.org/10.7554/eLife.40387.025
Download links
A two-part list of links to download the article, or parts of the article, in various formats.
Downloads (link to download the article as PDF)
Open citations (links to open the citations from this article in various online reference manager services)
Cite this article (links to download the citations from this article in formats compatible with various reference manager tools)
High-molecular-weight polymers from dietary fiber drive aggregation of particulates in the murine small intestine
eLife 8:e40387.
https://doi.org/10.7554/eLife.40387


