Plasmodium Niemann-Pick type C1-related protein is a druggable target required for parasite membrane homeostasis

  1. Eva S Istvan
  2. Sudipta Das
  3. Suyash Bhatnagar
  4. Josh R Beck
  5. Edward Owen
  6. Manuel Llinas
  7. Suresh M Ganesan
  8. Jacquin C Niles
  9. Elizabeth Winzeler
  10. Akhil B Vaidya  Is a corresponding author
  11. Daniel E Goldberg  Is a corresponding author
  1. Washington University School of Medicine, United States
  2. Drexel University College of Medicine, United States
  3. Pennsylvania State University, United States
  4. Massachusetts Institute of Technology, United States
  5. University of California San Diego School of Medicine, United States

Abstract

Plasmodium parasites possess a protein with homology to Niemann-Pick Type C1 proteins (Niemann-Pick Type C1-Related protein, NCR1). We isolated parasites with resistance-conferring mutations in Plasmodium falciparum NCR1 (PfNCR1) during selections with three diverse small-molecule antimalarial compounds and show that the mutations are causative for compound resistance. PfNCR1 protein knockdown results in severely attenuated growth and confers hypersensitivity to the compounds. Compound treatment or protein knockdown leads to increased sensitivity of the parasite plasma membrane (PPM) to the amphipathic glycoside saponin and engenders digestive vacuoles (DVs) that are small and malformed. Immuno-electron microscopy and split-GFP experiments localize PfNCR1 to the PPM. Our experiments show that PfNCR1 activity is critically important for the composition of the PPM and is required for DV biogenesis, suggesting PfNCR1 as a novel antimalarial drug target.

Editorial note: This article has been through an editorial process in which the authors decide how to respond to the issues raised during peer review. The Reviewing Editor's assessment is that all the issues have been addressed (see decision letter).

https://doi.org/10.7554/eLife.40529.001

Introduction

Several whole-parasite chemical library screens have identified thousands of compounds with potent antimalarial activity (Guiguemde et al., 2010; Kato et al., 2016). To facilitate drug development, it is important to identify targets of these compounds. Target identification can be extremely challenging, especially in organisms like Plasmodium that contain large numbers of proteins with unknown function. Evolution of compound-resistant malaria parasites can be helpful in the discovery of the molecular mechanisms by which compounds kill the organism (Rathod et al., 1994; Rottmann et al., 2010; Vaidya et al., 2014; Istvan et al., 2017).

In this study, we investigated a gene that acquired single nucleotide polymorphisms (SNPs) or was amplified in selections with three diverse compounds. PF3D7_0107500 encodes a membrane protein with sequence motifs found in Niemann-Pick C1 (NPC1) proteins. Human NPC1 (hNPC1) has been the subject of numerous studies because of the protein’s importance in cholesterol egress from late endosomes (Pentchev, 2004). Patients with mutations in hNPC1 suffer a fatal neurodegenerative lipid storage disorder characterized by the accumulation of lysosomal cholesterol, sphingomyelin, as well as other lipids (Gong et al., 2016). Niemann-Pick C1-Related (NCR1) proteins are conserved in eukaryotic evolution and are most easily identified by their membrane domains (Higaki et al., 2004). In humans, NPC1 accepts cholesterol from its partner protein, the high affinity cholesterol-binding protein NPC2 (Li et al., 2016). NCR1 homologs are also present in organisms that do not contain readily identifiable NPC2 proteins or internalize sterol by endocytosis. Based on studies with yeast NCR1, Munkacsi et al. proposed that the primordial function of NCR1 is the regulated transport of lipophilic substrates such as sphingolipids (Munkacsi et al., 2007).

Until now the function of PF3D7_0107500, which we call Plasmodium falciparum Niemann-Pick Type C1-Related protein (PfNCR1), has been unclear. In this study, we prepared a genetic knockdown (K/D) of pfncr1 and showed that K/D critically slows blood-stage parasite replication. Furthermore, pfncr1 K/D caused parasites to become abnormally sensitive to the pore-forming amphipathic glycoside saponin. Treatment with any of the three compounds that we identified during resistance selection phenocopied the gene K/D, suggesting that the compounds interfere with PfNCR1 function. Here we show that PfNCR1 is druggable and necessary for maintaining the proper membrane lipid composition of blood-stage parasites.

Results

Mutations in PfNCR1 provide resistance to three diverse compounds

As part of a study aimed at analyzing the P. falciparum resistome (Corey et al., 2016), we isolated parasites resistant to three structurally diverse compounds with similar, submicromolar potencies against wild-type parasites (Figure 1A and Figure 1—source data 1). Resistant parasites contained mutations in one common gene, PF3D7_0107500, which is predicted to encode a 1470 amino acid membrane protein. Sequence similarity searches indicated homology to a protein previously studied in the related apicomplexan parasite Toxoplasma gondii called Niemann-Pick Type C1-Related Protein (TgNCR1). Lige et al. identified sequence elements conserved between TgNCR1 and hNPC1, a lysosomal integral membrane protein (Lige et al., 2011). The same sequence elements are also present in PfNCR1. Cryo-EM and crystal structures of hNPC1 reveal a 13-helix transmembrane region containing a sterol-sensing domain (SSD) (orange) and a conserved C-terminal transmembrane domain (C-TM) (magenta) (Figure 1B) (Gong et al., 2016; Li et al., 2016). The C-terminal targeting sequence that extends past the C-TM in hNCR1 and localizes this protein to the lysosome, is not present in PfNCR1. Lumen-exposed domains (grey and blue in Figure 1B) complete the hNPC1 structure. Sequence similarity between hNPC1 and PfNCR1 is restricted to portions of the transmembrane region (orange and magenta) and to approximately 45 amino acids N-terminal to the SSD (red). Based on this limited sequence similarity, we generated a cartoon model of PfNCR1 (Figure 1C). We observed five mutations in our compound-resistant parasites: A1108T came from selections with MMV009108; M398I and A1208E from selections with MMV028038; and S490L and F1436I from selections with MMV019662. The model suggests that three of the mutations are proximal to the membrane domain, while the other two localize to the hydrophilic domains. We used single-crossover allelic exchange to introduce one mutation from each resistance selection into a clean genetic background (Figure 1—figure supplements 12). With this strategy, PfNCR1 is expressed from its native promoter and contains a C-terminal green-fluorescent protein (GFP) tag in addition to the mutation. We also generated non-mutated allelic exchange control parasites containing the GFP tag. Inclusion of the C-terminal GFP did not alter the sensitivity to MMV009108 (Figure 1D), while parasites with single mutations in PfNCR1 were resistant to the compounds with which they were selected (Figure 1D–F, Figure 1—source data 2).

Figure 1 with 3 supplements see all
Mutations in PfNCR1 confer resistance to three antimalarial compounds.

(A) Structures of the three structurally diverse compounds that yielded mutations in PfNCR1. The lower-case numbers next the compound IDs are used in C) to match mutations with specific compounds. (B) Ribbon model of the structure of hNCR1 solved by cryoEM (Gong et al., 2016). PDB coordinates: 3JD8. The SSD is shown in orange, the conserved C-terminal membrane domain is shown in magenta, the domain that interacts with hNCR2 is in blue and an additional sequence stretch with similarity to PfNCR1 is in red. (C) Cartoon model of the possible domain arrangement in PfNCR1. Sequence similarity to hNCR1 is restricted to the red, orange and magenta domains. Locations of resistance-conferring mutations are shown with arrows. Compound IDs matching with mutations are shown in lower case numbers and match Figure 1A. The model was generated by visual examination of the hNCR1 structure, aided by the alignment of hNCR1 aa 580–794 and aa 1083–1253 with PfNCR1 aa 439–662 and aa 1304–1468, and aided by a partial model of C-terminal residues generated by Robetta (Ovchinnikov et al., 2018). (D–F) Concentration response curves of blood-stage parasites (all in 0.1% DMSO) measured using a flow cytometry-based assay. Each panel shows different compound and a different mutation. (D) MMV009108, (E) MMV028038, (F) MMV019662. Black = parental 3D7 parasites; red = two independent clones of parasites with mutant allelic exchange; blue = two independent clones of parasites with wild-type allelic exchange (for part D only). The error bars (S.D.) for a representative experiment (technical triplicates) are shown and are very small. The experiment in D) was done three times, (E) and (F) were done twice. For each one representative experiment is shown.

https://doi.org/10.7554/eLife.40529.002
Figure 1—source data 1

Potencies of compounds against parental (wild-type) parasites in Figure 1D–F).

https://doi.org/10.7554/eLife.40529.006
Figure 1—source data 2

Resistance of allelic exchange-modified parasites, compared to parental parasites.

https://doi.org/10.7554/eLife.40529.007

We examined the effect of single mutations on the different compounds. A1108T or F1436I mutant parasites were resistant to all three compounds, while A1208E mutant parasites were sensitive to the two compounds that were not used in the A1208E selection (Figure 1D–F, Figure 1—figure supplement 3, Figure 1—source data 2). These findings suggest that amino acids modeled to be proximal to the membrane domain (A1108 and F1436) may have some functional overlap, while the putative soluble domain A1208 may have a different activity.

PfNCR1 is important for asexual parasite viability and is targeted by antimalarial compounds

An attempt to disrupt the pfncr1 gene using a CRISPR/Cas9-targeting approach did not succeed, suggesting an essential function during blood-stage malaria growth. Next, we created parasites in which pfncr1 expression is regulated by anhydrotetracyline (aTc) using the previously described TetR-DOZI/aptamer translational repression technology (Ganesan et al., 2016; Spillman et al., 2017) (Figure 2—figure supplement 1A–C). When we removed aTc from highly synchronized, young ring-stage parasites, PfNCR1 expression in trophozoites was reduced within the same cell cycle and undetectable in the following cell cycles, as judged by western blots to detect a C-terminal hemagglutinin (HA) sequence on the aptamer-tagged parasites (Figure 2A). While protein levels after aTc withdrawal were affected almost immediately, parasite replication rates decreased only after 3–4 days (Figure 2B, inset). After this slow onset of reduced growth, PfNCR1 K/D clearly resulted in markedly less fit parasites. Essentiality of NCR1 in Plasmodium is further supported by a mutagenesis study in P. falciparum (Zhang et al., 2018) and by a P. berghei knockout study (Bushell et al., 2017). Complementing K/D parasites with a second copy wild-type PfNCR1 rescued the growth defect (Figure 2C, Figure 2—figure supplement 1D). Modulating the expression level of PfNCR1 with aTc shifted the MMV009108 concentration-response curve (Figure 2D) and maximal K/D hypersensitized parasites to the three compounds that were used for the resistance selection (Figure 2E–H, Figure 2—source data 1). Our findings suggest that PfNCR1 performs a function important for the viability of blood-stage malaria parasites and that the three compounds act directly on the protein.

Figure 2 with 1 supplement see all
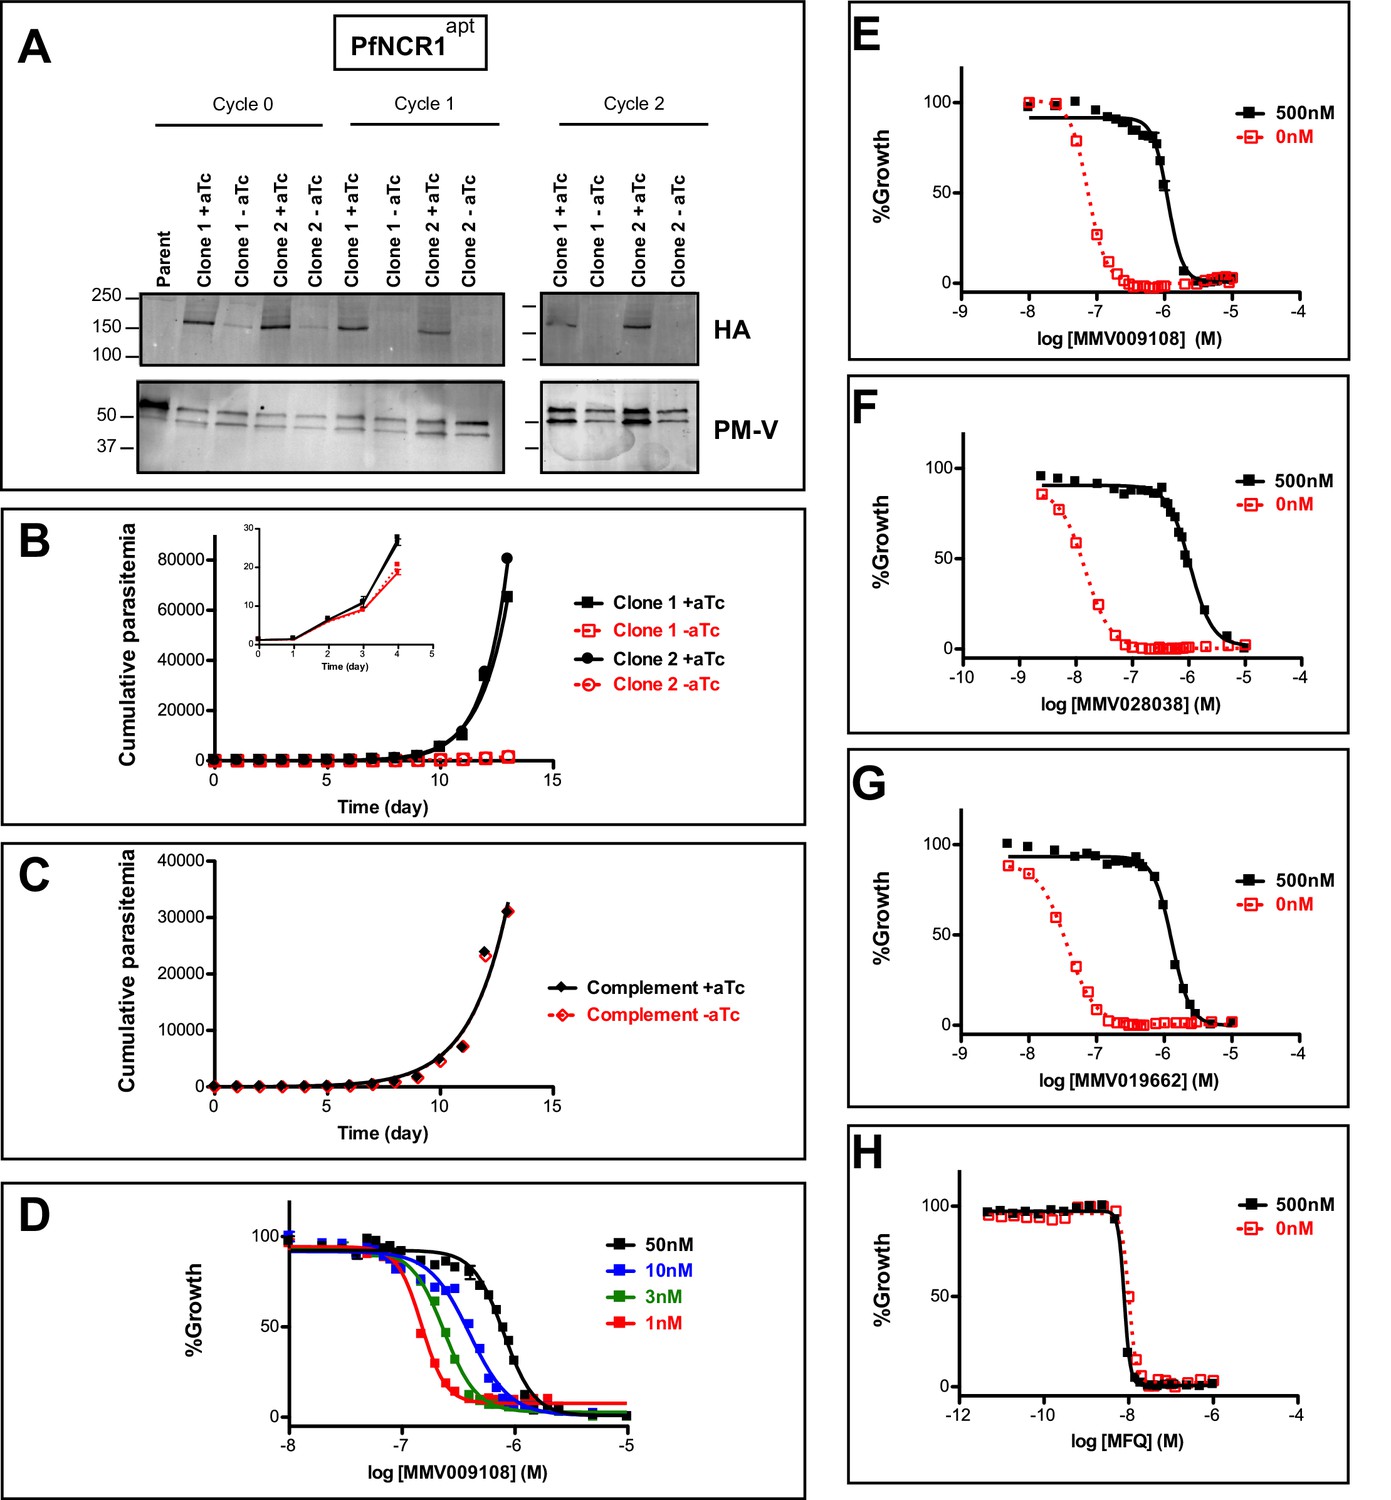
PfNCR1 is required for blood-stage parasite replication and is targeted by three antimalarials.

(A) Western blot showing regulation of the PfNCR1apt by aTc. Trophozoite-stage parasites were harvested from the replication cycle in which aTc was removed (cycle 0), as well as the following two cycles. PfNCR1 was detected using a C-terminal HA-tag. The ER membrane protein plasmepsin V (PM-V) was used as a loading control. Note that the two bands recognized by α-PM-V antibody correspond to the full-length protein and a proteolytic fragment of the protein produced during the membrane isolation. Expected sizes: 171 k Da for PfNCR1-HA, 69 k Da for PM-V. This experiment was done two times. (B) Replication of PfNCR1apt parasites. Using a flow cytometry assay, the replication of two PfNCR1apt clones was monitored over two weeks. +aTc is in black and solid lines, -aTc is in red and dashed lines. Cultures were seeded at 1% parasitemia, and subjected to daily media changes, and/or sub-culturing. Cumulative parasitemias were calculated by multiplying with dilution factors. One representative experiment with technical triplicates is shown. The inset magnifies the initial time points. Doubling times in days are as follows (95% confidence intervals in parentheses): clone 1 -aTc = 1.596 (1.546–1.650), R2 = 0.9964; clone 1 +aTc = 0.8663 (0.8218–0.9159), R2 = 0.9930; clone 2 -aTc = 1.463 (1.417–1.512), R2 = 0.9965; clone 2 +aTc = 0.7776 (0.7559–0.8005), R2 = 0.9981. This experiment was done four times. (C) Complementation of PfNCR1apt rescues growth phenotype. Wild-type PfNCR1 was stably expressed in the PfNCR1apt background. Replication of parasites was monitored over two weeks. +aTc is in black and solid line, -aTc is in red and dashed line. One representative experiment with technical triplicates is shown. Doubling times in days are as follows (95% confidence intervals in parentheses): -aTc = 1.152 (1.036–1.298), R2 = 0.97; +aTc = 1.166 (1.039–1.329), R2 = 0.96. This experiment was done four times. Note that the complemented strain grows less well than PfNCR1apt with aTc (B), but that there is no significant difference ±aTc. (D) Expression level of PfNCR1 correlates with sensitivity to MMV009108. Concentration response curves using a flow cytometry-based growth assay. After aTc washout, aTc was replenished in triplicate cultures at different concentrations and parasitemias were measured after 72 hr. aTc concentrations are indicated. This experiment was done three times. (E–H) PfNCR1 K/D hypersensitizes parasites to three compounds. Concentration-responses of PfNCR1apt parasites to E) MMV009108, (F) MMV028038, (G) MMV019662, and H) mefloquine (MFQ) (control compound) without aTc (red open symbols, dashed lines) or with 500 nM aTc (black symbols, solid lines) after 72 hr. One representative experiment with technical triplicates is shown. The experiment in E) was done three times the experiments in F-H) were done two times.

https://doi.org/10.7554/eLife.40529.008
Figure 2—source data 1

Shifts in EC50s under PfNCR1 K/D.

https://doi.org/10.7554/eLife.40529.010

PfNCR1 localizes to the parasite plasma membrane

To better understand the functional significance of PfNCR1, we localized the protein. For this purpose, we used parasites expressing wild-type PfNCR1 protein tagged with a C-terminal GFP from its native promoter. Live microscopy showed fluorescence surrounding the intraerythrocytic parasites (Figure 3A). The distribution of GFP was in contrast to an earlier suggestion that PfNCR1 may reside in the digestive vacuole (DV) membrane (Martin et al., 2009). Immuno-electron microscopy of parasites expressing GFP or HA-tagged PfNCR1 confirmed localization of the protein to the membranes surrounding parasites (Figure 3B,C, Figure 3—figure supplement 1). Blood-stage parasites are surrounded by two membranes in very close apposition - the parasitophorous vacuolar membrane (PVM) and the PPM. The resolution of our immuno-electron microscopy images was not sufficient to definitively determine whether PfNCR1 is present in the PVM or the PPM. To answer this question, we prepared split-GFP constructs (Cabantous et al., 2005; Külzer et al., 2013) in which GFP strands 1–10 are expressed either in the parasite cytoplasm or targeted to the lumen of the parasitophorous vacuole (PV) and GFP strand 11 is expressed as a C-terminal tag on PfNCR1 (Figure 3—figure supplement 2). GFP fluorescence was only observed when cytoplasmic GFP 1–10 was co-expressed with PfNCR1-GFP11 (Figure 3D–G), suggesting that the C-terminal residues of PfNCR1 project into the parasite cytoplasm. We cannot rule out the possibility that the cytoplasmic GFP 1–10 signal is due to vesicles at the PPM in transit to the PVM, but based on these results, we propose a model in which PfNCR1 membrane domains are in the PPM while the soluble domains project into the PV (Figure 3H). In contrast to hNPC1, PfNCR1 does not appear to localize to internal organellar membranes. Nevertheless, our model suggests that the relative orientation of the cytosolic regions in these two distantly related proteins is conserved.

Figure 3 with 2 supplements see all
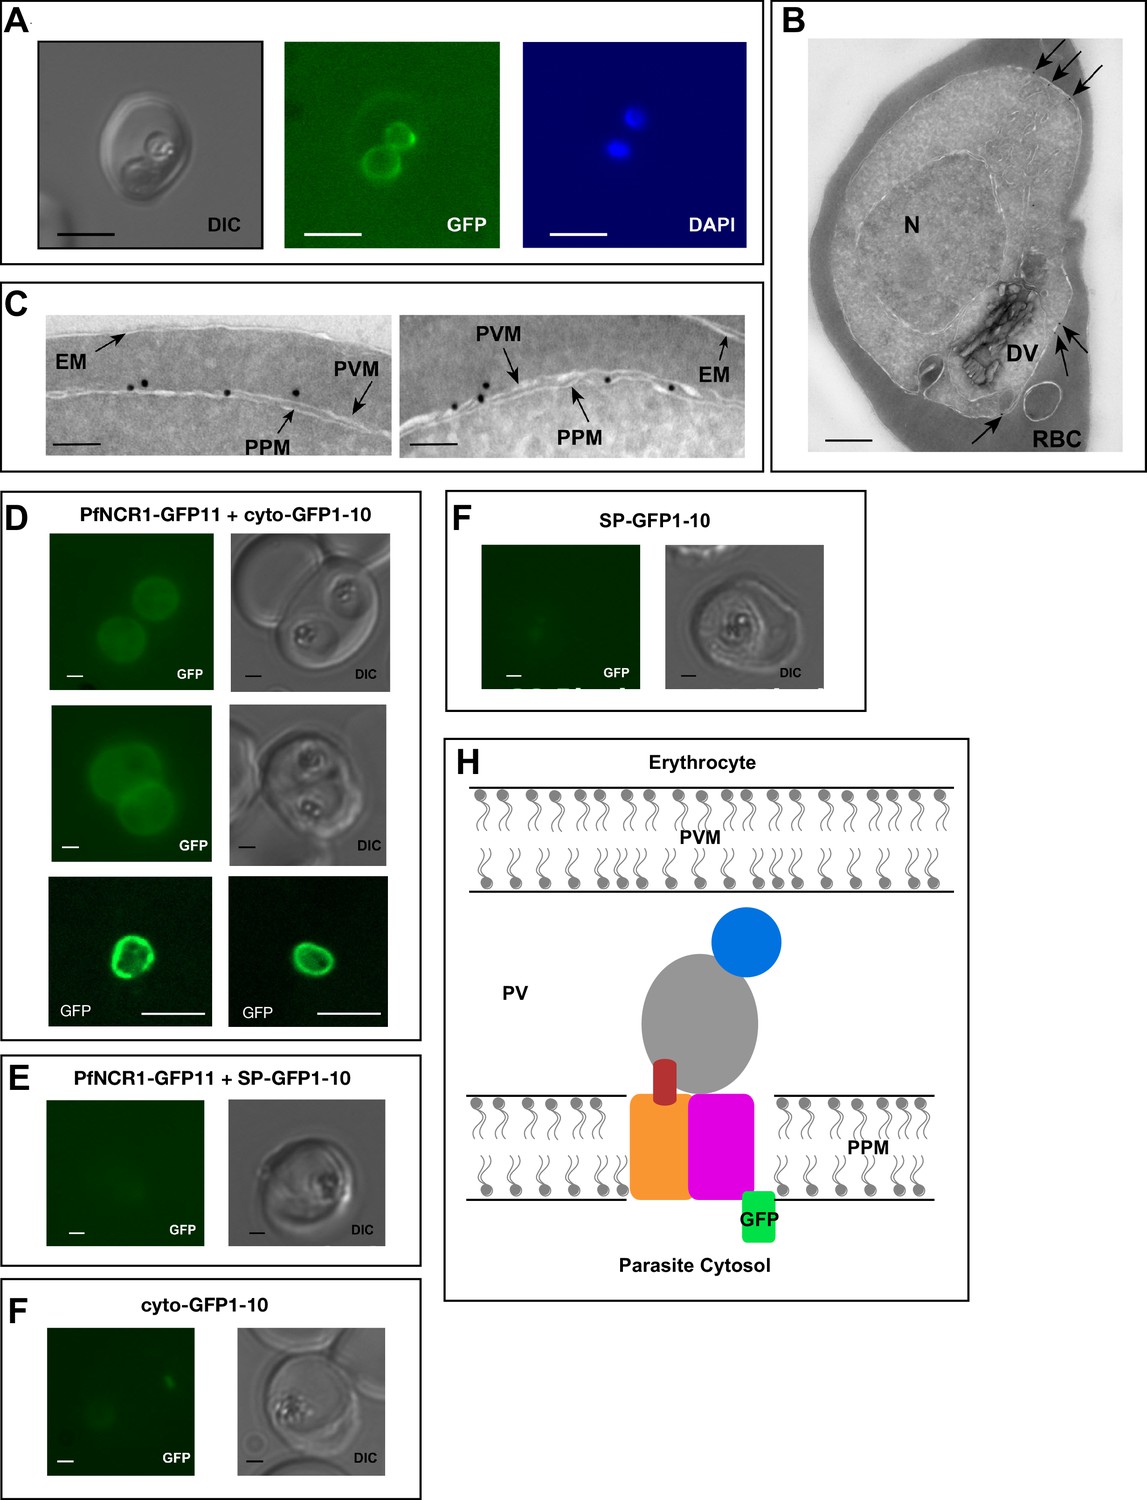
PfNCR1 localizes to the parasite plasma membrane.

(A) Live fluorescence microscopy with C-terminally GFP-tagged wild-type PfNCR1-expressing parasites (clone Wt-GFP1 from Figure 1) localizes PfNCR1 to the parasite surface. Scale bar 5 μm. (B–C) Immuno-electron-micrographs of trophozoite-stage parasites using α-GFP antibody. Arrows mark gold particles, RBC = infected red blood cell, DV = digestive vacuole, N = nucleus. The close-up in C) shows gold particles clustered at the parasite-delimiting membranes. EM = erythrocyte membrane; PVM = parasitophorous vacuolar membrane; PPM = parasite plasma membrane. Scale bar B = 500 nm, C = 100 nm. (D–G) Live fluorescence microscopy on split-GFP expressing parasites. (D) Co-expression of PfNCR1-GFP11 with cytoplasmic GFP1-10. The bottom panels were generated using confocal microscopy. (E) Co-expression of PfNCR1-GFP11 with GFP1-10 that contains a signal peptide and localizes to the vacuole. (F) Cytoplasmic GFP1-10 without expression of PfNCR1-GFP11. (F) GFP-1–10 containing a signal peptide without expression of PfNCR1-GFP11. Scale bar: 1 µm for epifluorescence images, 10 µm for confocal images. (H) Cartoon of the proposed orientation of PfNCR1 in the PPM (parasite plasma membrane). PV = parasitophorous vacuole; PVM = parasitophorous vacuolar membrane.

https://doi.org/10.7554/eLife.40529.011

Compound treatment or protein knockdown hypersensitizes parasites to saponin

Saponins are amphipathic glycosides with high affinity for cholesterol that are capable of penetrating membranes (Seeman et al., 1973; Gögelein and Hüby, 1984). Inhibiting the Na+-efflux pump PfATP4 has previously been shown to lead to changes in PPM saponin sensitivity (Das et al., 2016). We were curious whether interfering with PfNCR1 function would have similar effects. We noticed decreased levels of cytosolic aldolase protein in saponin parasite extracts after incubation with MMV009108, while levels of the PVM-localized membrane-bound protein EXP2 did not change (Figure 4A). Hypersensitivity to saponin was reversed when MMV009108 was removed by washout. We obtained similar results in experiments probing for a different cytosolic protein, haloacid dehalogenase 1 (HAD1) (Figure 4—figure supplement 1A). Using a flow cytometry-based assay and a previously reported parasite clone expressing eGFP (Straimer et al., 2012), we observed elevated saponin-induced leakage of cytoplasmic eGFP after incubation of parasites with sub-EC50 concentrations of MMV009108, MMV028038 and MMV019662 (Figure 4B–D). Western blots probing for eGFP in supernatant and pellet fractions showed that the decrease in signal of cytosolic proteins was not a consequence of increased protein degradation, but rather of elevated leakage of cytoplasmic contents (Figure 4—figure supplement 1B). These results suggest that the PPM, the membrane to which PfNCR1 localizes, undergoes a redistribution of membrane lipids during compound treatment. We have previously shown that, for PfATP4 inhibitors, induction of saponin sensitivity is abrogated in parasites adapted to grow in low [Na+] (Das et al., 2016). This was different from the effect of MMV009108 treatment where we observed saponin hypersensitivity in regular medium, as well as in low [Na+]-containing medium (Figure 4E). Also, unlike PfATP4 inhibitors, MMV009108 did not result in Na+ influx into parasites (Figure 4F). PfNCR1 K/D did not change sensitivity to KAE609 (Figure 4—figure supplement 1C and Figure 4—source data 1). We conclude that MMV009108 acts directly on PfNCR1 but suggest that PfATP4 activity influences PfNCR1 function (PfATP4 mutants are hypersensitive to our compounds (Corey et al., 2016)).

Figure 4 with 1 supplement see all
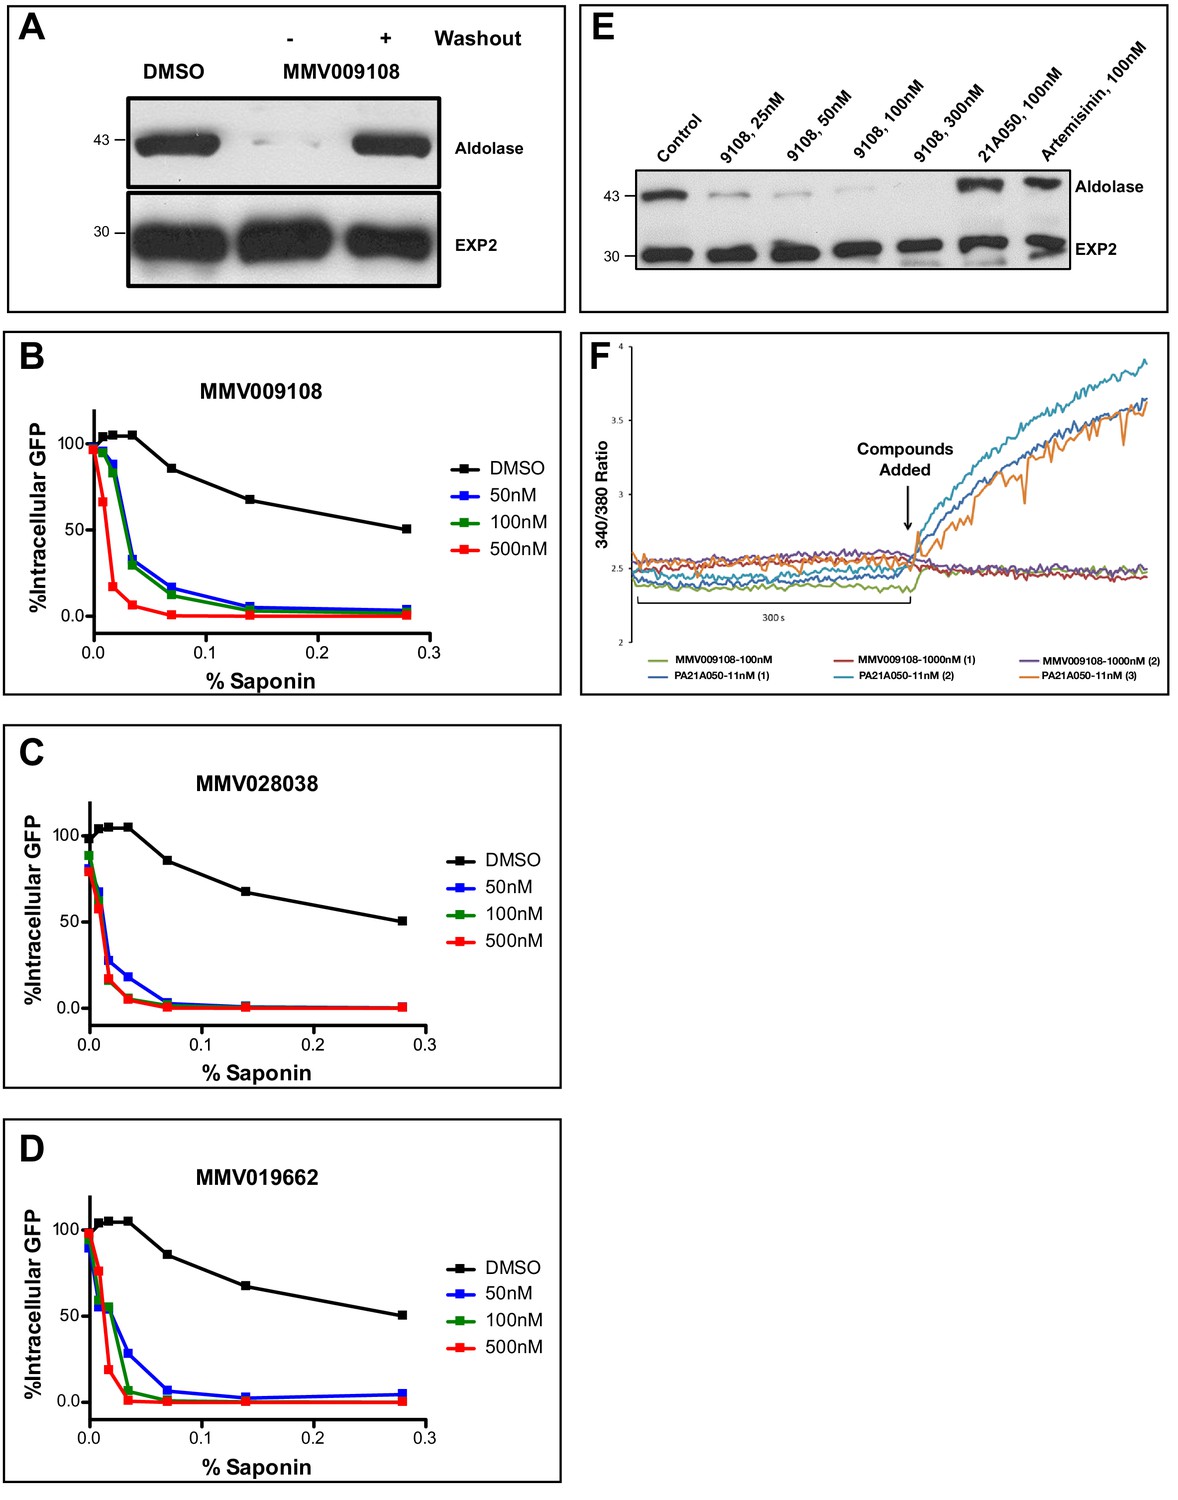
Compound treatment hypersensitizes parasites to saponin.

(A) Strain 3D7 parasites (30–34 hr post-infection) were exposed to DMSO or 100 nM MMV009108 for 2 hr. Compound or vehicle were removed by washout and rescued by growing in compound-free cRPMI medium for another 2 hr. Parasites were treated with saponin (0.02%) to release parasites followed by western blot analysis using antibodies to parasite aldolase or EXP2. EXP2 was used as a loading control. This experiment was done three times. B – D) Flow cytometry-based assay to monitor cell leakiness using a cytoplasmic GFP expressing parasite clone (NF54eGFP). Parasites were incubated with MMV009108 (B), MMV028038 (C), or MMV019662 (D) at the indicated concentrations for 1 hr (DMSO was the vehicle control). Following compound washout with PBS, parasites were released from RBCs with saponin. Using flow cytometry, 50,000 cells were counted and scored as GFP positive or negative. At 0% saponin, all samples had similar numbers of GFP-positive cells (~80%). The experiment in B) was done three times. The experiments in C and D) were done two times. For each B)-D) a single representative experiment (with technical duplicates) is shown. E) Low Na+-adapted trophozoite stage 3D7 parasites were subjected to varying concentration of MMV009108 for 2 hrs followed by saponin (0.02%) treatment to release the parasites and subjected for western blot analysis using antibodies to parasite aldolase or EXP2 (loading control). 100 nM PA21A05024 and 100 nM artemisinin were used as controls. This experiment was done two times. Unlike the pyrazoleamide PA21A050, MMV009108 does not induce Na+ influx into parasites. Low Na+-adapted trophozoite stage 3D7 parasites were subjected to varying concentration of MMV009108 for 2 hrs followed by saponin (0.02%) treatment to release the parasites and subjected for western blot analysis using antibodies to parasite aldolase or EXP2 (loading control). 100 nM PA21A05024 and 100 nM artemisinin were used as controls. This experiment was done two times.Unlike the pyrazoleamide PA21A050, MMV009108 does not induce Na+ influx into parasites. SBFI 340 nm/380 nm emission ratio traces are plotted for indicated compounds and concentration. Unlike the pyrazoleamide PA21A050, MMV009108 does not alter intracellular [Na+] as represented by the lack of change in SBFI 340/380 ratiometric traces. This experiment was done three times.

https://doi.org/10.7554/eLife.40529.014
Figure 4—source data 1

EC50fold change to KAE609 under PfNCR1 K/D.

https://doi.org/10.7554/eLife.40529.016

We looked for changes in the PVM using a parasite clone in which the fluorescent protein mRuby3 is targeted via a signal peptide to the PV (Figure 5A). As expected, the PVM was exquisitely sensitive to saponin and mRuby was released irrespective of drug treatment (Figure 5B). Leakage of cytosolic HAD1 after saponin treatment was enhanced by MMV009108, as previously seen (Figure 5—figure supplement 1). With the same PV-targeted mRuby parasites we examined the sensitivity of the PVM to the cholesterol-binding toxin tetanolysin, which, at low concentrations, normally lyses the erythrocyte membrane but not the PVM (Hiller et al., 2003). Treatment with MMV009108 did not alter PVM susceptibility to tetanolysin (Figure 5C), suggesting that compound treatment does not perturb PVM lipid composition.

Figure 5 with 1 supplement see all
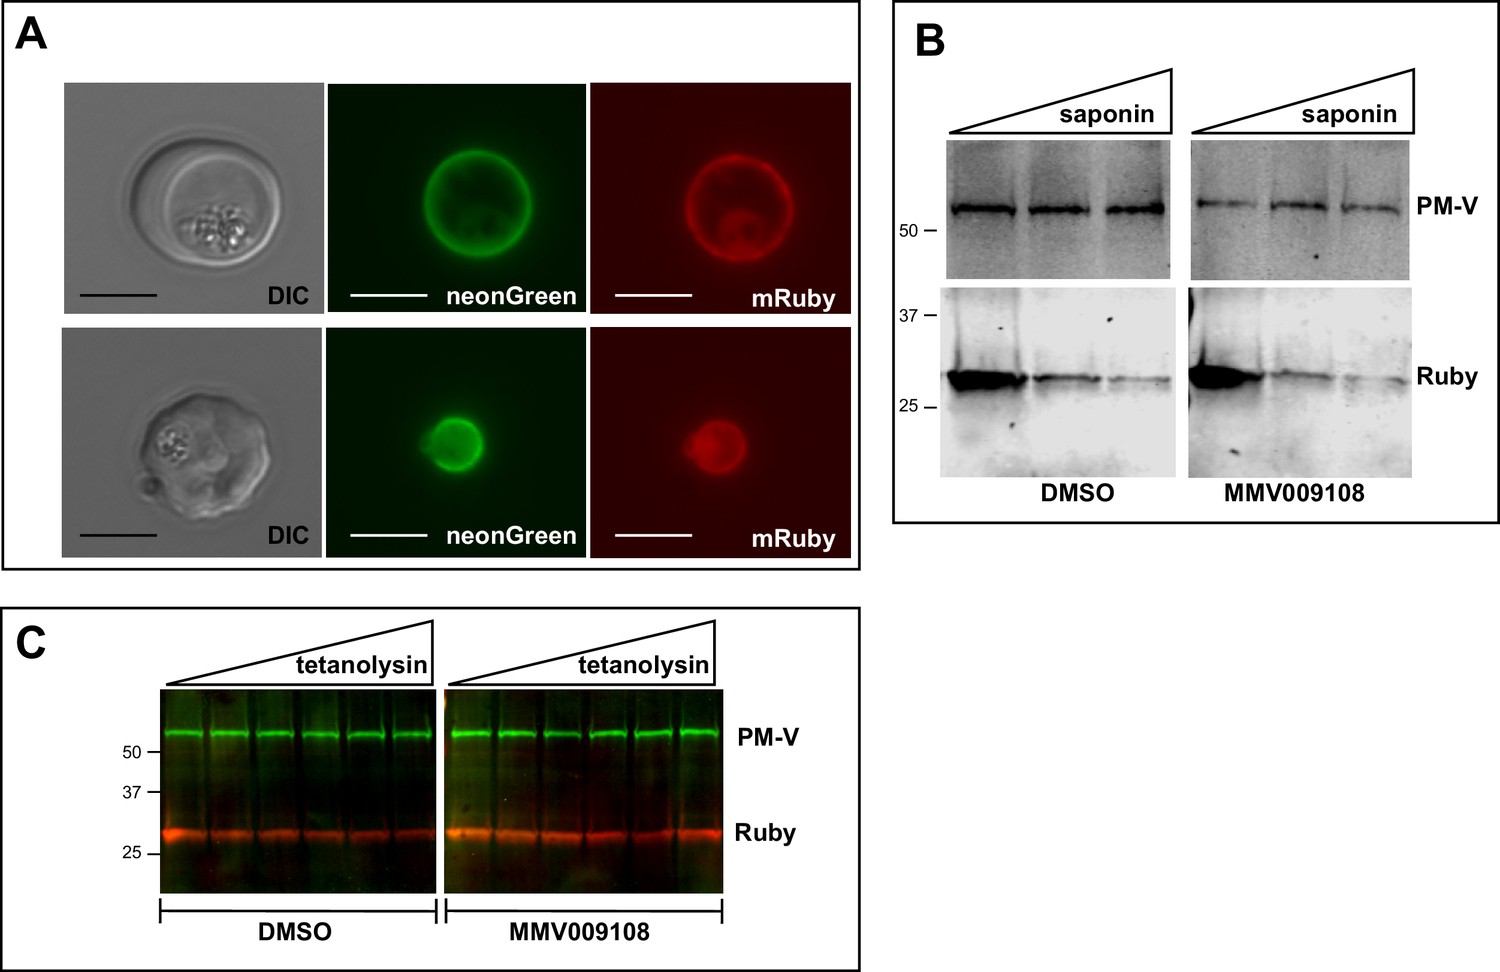
PVM lipid homeostasis is not affected by MMV009108.

(A) Live microscopy on NF54-EXP2-mNeonGreen + PV-mRuby3 parasites. The PVM protein EXP2 is expressed as mNeonGreen fusion; mRuby3 is targeted to PV lumen. Scale bar = 5 μm. (B) Western blot on saponin-treated NF54-EXP2-mNeonGreen + PV-mRuby3 parasites following treatment with 500 nM MMV009108 for 2 hr. The saponin gradient was as follows: 0%, 0.009%, 0.018%. This experiment was done two times. (C) Western blot on NF54-EXP2-mNeonGreen + PV-mRuby3 parasites following treatment with tetanolysin (concentrations: 0, 0.5, 1, 2.5, 5, 7.5 ng/ml). Blot was probed with anti-RFP and anti-PM-V antibodies. This experiment was done two times. Expected sizes: PV-Ruby3 = 27 kDa, PM-V = 69 kDa.

https://doi.org/10.7554/eLife.40529.017

Next, we examined whether PfNCR1apt parasites are hypersensitive to saponin after K/D. Removal of aTc sensitized parasites to saponin as monitored by the loss of cytoplasmic HAD1, while complemented control parasites expressing wild-type PfNCR1 in the K/D parasite background had normal saponin sensitivity (Figure 6A). As an independent marker, we prepared a PfNCR1apt parasite line expressing cytosolic eGFP. In this background, PfNCR1 K/D increased PPM sensitivity to saponin within 22 hr of aTc removal (Figure 6B), much more rapidly than the onset of slowed parasite growth (Figure 2B). Adding back aTc to PfNCR1apt parasites rapidly restored normal saponin sensitivity (Figure 6B). Similarly, saponin sensitivity after K/D of PfNCR1 for 40 hr was reversible in as little as 2 hr (Figure 6—figure supplement 1). In summary, PfNCR1 K/D phenocopies the effect of the three compounds on the PPM, suggesting that the compounds we identified interfere with PfNCR1 activity and that PfNCR1 function is required to maintain normal PPM lipid composition.

Figure 6 with 1 supplement see all
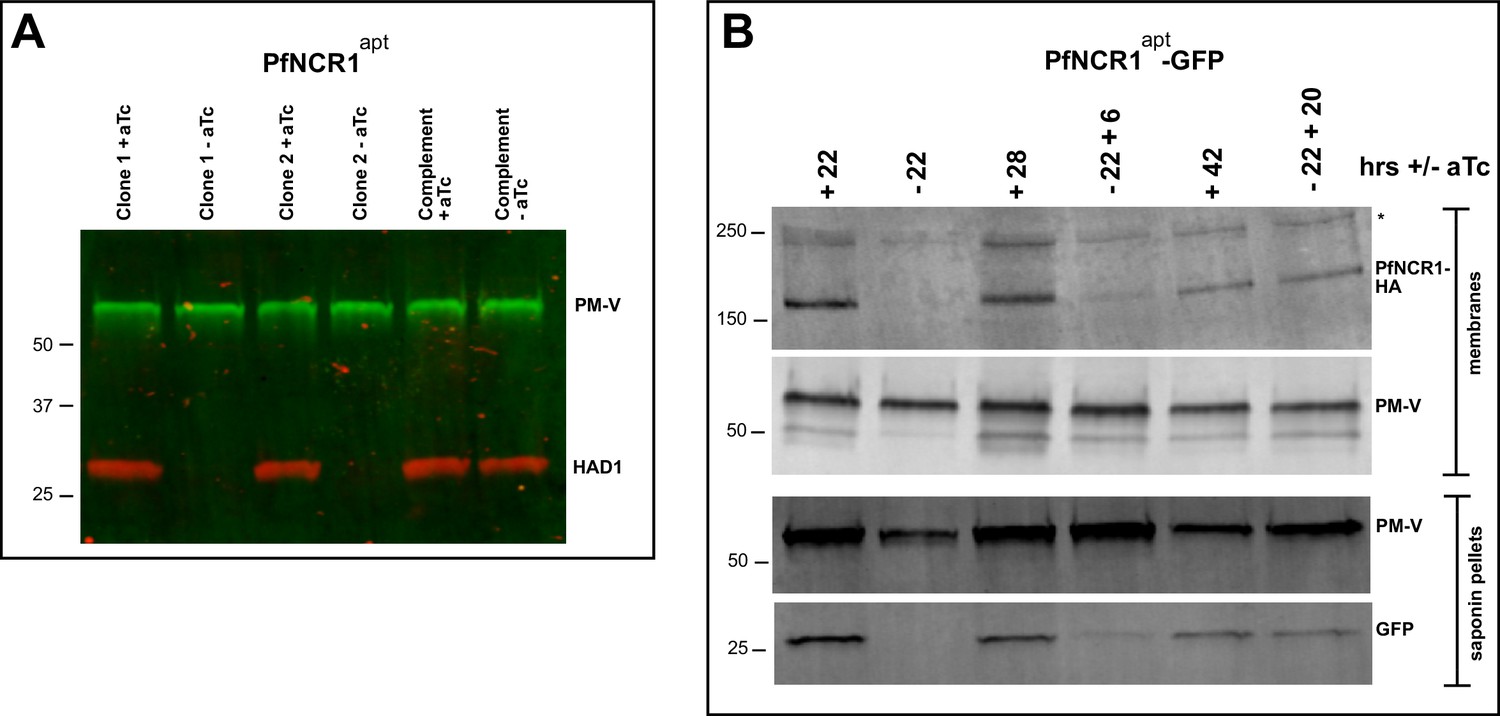
PfNCR1 K/D hypersensitizes parasites to saponin.

(A) Western blot analysis of saponin extracts (0.07%) from two PfNCR1apt clones and complemented parasites. Parasites were harvested 24 hr after aTc washout. This experiment was done two times. (B) Replenishing aTc after washout reverts the K/D phenotype. aTc was removed from PfNCR1apt-GFP parasites (stable expression of cytosolic GFP). 22 hr after washout, one set of parasites was harvested, while aTc (500 nM) was added back to another set of parasite samples for 6 or 20 hr. Parasites were either harvested to prepare membranes, or released with saponin. Lysates were subjected to western blotting. * in top blot (anti-HA) marks a cross-reacting protein. This experiment was done two times. Expected sizes: HAD1 = 33 kDa, PM-V = 69 kDa, PfNCR1-HA = 171 kDa, GFP = 27 kDa.

https://doi.org/10.7554/eLife.40529.019

PfNCR1 activity is required for digestive vacuole function

We hypothesized that DV formation could be affected by PfNCR1 impairment as DVs are formed from endocytic vesicles that invaginate at the PPM (Figure 7A). To observe DVs in live parasites we used a strain that expresses GFP as a fusion protein with the DV protease plasmepsin II (PMII) (Klemba et al., 2004). In this strain, PMII-GFP is produced as a membrane-bound pro-enzyme that enters the secretory pathway and is delivered from the ER to the PPM. At the PPM, pro-PMII-GFP accumulates in cytostomes and migrates via vesicles to the DV.

Figure 7 with 2 supplements see all
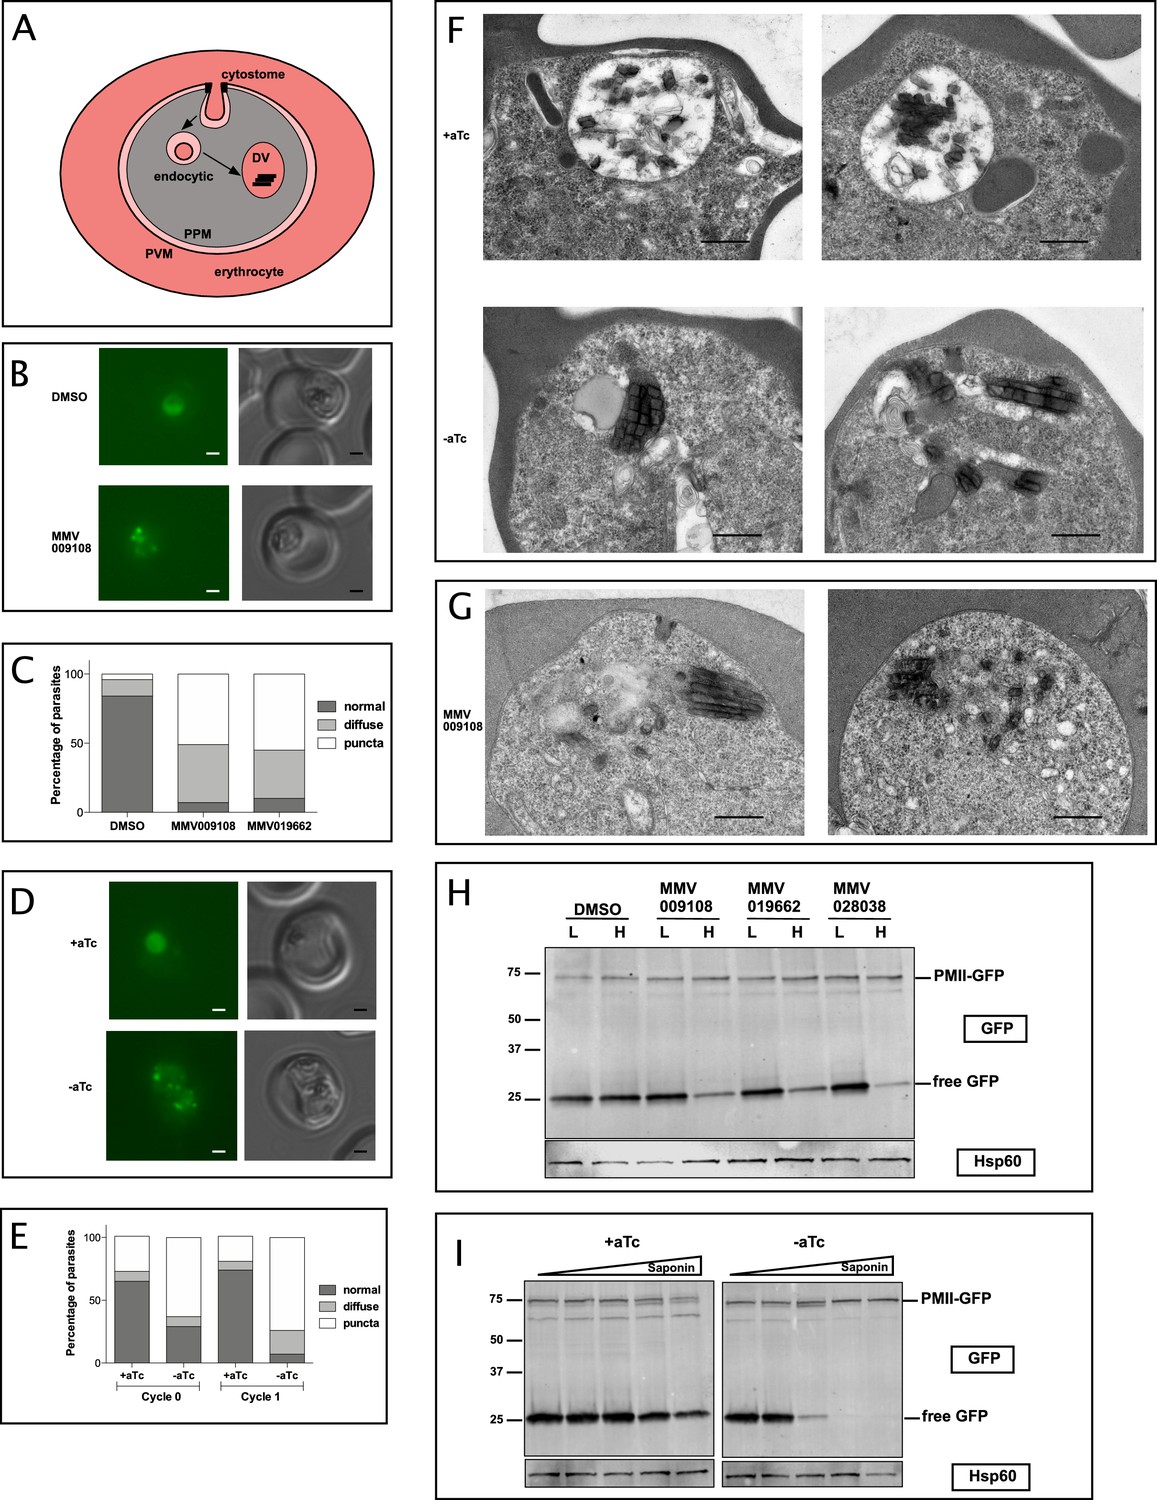
PfNCR1 inhibition or K/D impairs digestive vacuole genesis.

(A) Cartoon of trafficking route to the DV in an infected red blood cell. DV = digestive vacuole; PVM = parasitophorous vacuolar membrane; PPM = parasite plasma membrane. (B) Live microscopy of PMII-GFP parasites after incubation with MMV009108 (1 μM, 3 hr) or with vehicle (DMSO). Scale = 1 μm. (C) Quantitation of abnormal DVs from parasites in (B) after incubation with MMV009108 (N = 43), or MMV019662 (N = 43) or vehicle (DMSO) (N = 77) (1 μM, 3 hr). p<0.0001, Fisher’s exact test. (D) Live microscopy of PfNCR1 K/D parasites expressing PMII-GFP, after removal of aTc. Scale = 1 μm. (E) Quantitation of abnormal DVs from parasites in (D) after aTc washout. Cycle 0 + aTc (N = 93), –aTc (N = 84); cycle 1 + aTc (N = 107), –aTc (N = 116). p<0.0001, Fisher’s exact test. (D and E): cycle 0 = trophozoites after removal of aTc within the same replication cycle (27 hr post washout), cycle 1 = trophozoites after removal of aTc in the preceding replication cycle (68 hr post washout). (F) Transmission electron micrographs of PfNCR1 K/D parasites (clone 2) after aTc removal (68 hr post washout). Scale = 0.5 μm. (G) Transmission electron micrographs of PfNCR1 K/D parasites maintained with aTc and incubated with 500 nM MMV009180 for 1 hr. Scale = 0.5 μm. (H) Western blot analysis of PMII-GFP parasites after treatment with 1 μM compounds for 2 hr. Parasites were released from RBCs with low (L) (0.009%) or high (H) (0.035%) saponin. Top blot was probed with α-GFP antibody, bottom blot (loading control) was probed with α-Hsp60 antibody, an organellar marker. This experiment was done two times. (I) Western blot analysis of PMII-GFP, PfNCR1 K/D parasites after aTc washout for 22 hr. Parasites were released from RBCs with 0.009%, 0.0175%, 0.035%, 0.07% or 0.14% saponin. Top blot was probed with α-GFP antibody, bottom blot (loading control) was probed with α-Hsp60 antibody. This experiment was done two times. Expected size of pro-PMII-GFP=79 kDa, free GFP = 27 kDa.

https://doi.org/10.7554/eLife.40529.021

After incubation with compounds we noticed abnormally punctate and occasionally diffuse GFP fluorescence that was not concentrated in DVs (Figure 7B,C). Whereas most DMSO-treated control parasites had round DVs of ~2 μm diameter and contained only a few small submicron GFP-positive dots, compound-treated parasites frequently had many small fluorescent foci, some of which were unusually bright. To confirm that abnormal DVs were a consequence of interfering with normal PfNCR1 function, we introduced PfNCR1apt into the parasite line containing the PMII-GFP fusion (Figure 7 —figure supplement 1A-C). PfNCR1 K/D parasites had dispersed GFP puncta similar to those seen in compound-treated parasites (Figure 7D,E). Electron micrographs prepared from parasites under PfNCR1 K/D (Figure 7F) or treated with MMV009108 (Figure 7G) showed dramatic defects. Normal DVs are easily distinguished from the parasite cytosol, not only because they contain hemozoin crystals, but also because they are electron-lucent. In contrast, the abnormal DVs we observed were electron-dense, smaller, elongated and irregular in shape. Usually, we could see multiple hemozoin-containing vesicles in PfNCR1-depleted/inhibited parasites.

To investigate whether DV membranes might contain defects similar to those observed in the PPM after PfNCR1 K/D or compound treatment, we measured the saponin sensitivity of the DV membrane. In PMII-GFP parasites, free GFP is hydrolyzed from PMII-GFP in the DV (Figure 7A and ref (Klemba et al., 2004)). DV-resident GFP was released from drug-treated parasites at low saponin concentrations that did not affect control parasite DVs (Figure 7H,I). Importantly, the levels of pro-PMII-GFP did not change, suggesting that the synthesis of PMII was not affected. To control for the possibility that DV membranes have increased leakiness after compound treatment or PfNCR1 K/D simply because the PPM is leaky and less detergent is necessary to access the DV, we repeated the experiment with isolated DVs. Again, after incubation with MMV009108, low saponin concentrations resulted in leakage of DV-localized GFP (Figure 7—figure supplement 1D).

Metabolomic profiling of parasite extracts after incubation with MMV009108, MMV091662 (published previously (Allman et al., 2016)) or MMV028038 (Figure 8) showed reductions across hemoglobin-derived peptides, supporting the hypothesis that the normal function of the DV has been compromised by the compounds.

Metabolomic analysis of parasites incubated with PfNCR1 inhibitors.

Mass spectrometry-based metabolic profiling of hydrophilic extracts from parasites (Allman et al., 2016) exposed to the three PfNCR1-targeting MMV compounds depicts a depletion in hemoglobin-derived peptides. Each panel represents incubation with a different compound and is an average of two experiments (each containing triplicates). These Metaprint representations (Fang and Gough, 2014) also demonstrate a highly similar metabolic response upon drug treatment with these compounds.

https://doi.org/10.7554/eLife.40529.024
Figure 8—source data 1

Log2 fold changes of treated versus untreated controls.

Values for 109 metabolites are listed. Atovaquone was used as a control. Sheet one (‘Data’) contains averages of technical triplicates for each biological replicate. Sheet two (‘AVGs’) contains averages of the biological replicate. Data were normalized via an isotope-labelled internal standard, 13C15N-Aspartate.

https://doi.org/10.7554/eLife.40529.025

Discussion

We have identified PfNCR1, Niemann-Pick C1-related protein, as a new antimalarial target that resides in the PPM and serves important functions during intraerythrocytic growth of P. falciparum. Through a chemical genetics approach we have provided evidence suggesting that three structurally diverse small molecules target PfNCR1. Conditional K/D of pfncr1 gene expression resulted in parasite demise. Phenotypic consequences of compound treatment or of conditional K/D of PfNCR1 were essentially identical, strongly suggesting that the compounds directly inhibit PfNCR1.

PfNCR1 belongs to a superfamily of multi-pass transmembrane proteins involved in a variety of biological functions ranging from being receptors for signaling molecules to transport of different types of hydrophobic molecules (Higaki et al., 2004; Eicher et al., 2014; Trinh et al., 2017). Currently, the gene encoding this protein, PF3D7_0107500, is annotated as a lipid/sterol:H+ symporter (www.plasmodb.org). However, on the basis of its sequence similarity with previously investigated proteins from Saccharomyces cerevisiae (ScNCR1) (Higaki et al., 2004) and Toxoplasma gondii (TgNCR1) (Lige et al., 2011) we believe it is more appropriate to name it as PfNCR1. When engineered to display endosomal retention signals, ScNCR1 and TgNCR1 were able to revert defective cholesterol transport in mammalian cells lacking functional NPC1 (Malathi et al., 2004), though TgNCR1 appears to be selective for sphingomyelin in the parasite. PfNCR1 displays 30% amino acid sequence identity over 69% of TgNCR1. Proof of a direct role of PfNCR1 as a lipid transporter awaits functional analysis. Despite significant homology, there appear to be significant differences as to functions served by the proteins. Whereas ScNCR1 and TgNCR1 are dispensable for survival, PfNCR1 appears to be essential. ScNCR1 has been localized to the yeast vacuole and T. gondii NCR1 to the inner membrane complex, a continuous patchwork of flattened vesicular cisternae located beneath the plasma membrane and overlying the cytoskeletal network; PfNCR1 is on the PPM.

Striking phenotypic consequences of PfNCR1 depletion or inhibition provide hints as to the functions served by this transmembrane protein. The ability of the cholesterol-dependent glycoside saponin to release cytosolic content of parasite-infected erythrocytes by permeation of the host plasma membrane while largely sparing the parasite cytosolic content has been a mainstay for experiments requiring ‘freeing’ of parasites for biochemical and physiological investigations (Hsiao et al., 1991). Cholesterol is not synthesized by malaria parasites but is taken up from the erythrocyte and incorporated into parasite membranes. An inward cholesterol gradient is formed as the parasite grows (Tokumasu et al., 2014). Resistance of the PPM to saponin permeation is believed to be due to a dearth of cholesterol within the PPM. Furthermore, the accessibility of cholesterol to saponin is highly dependent on its interactions with other lipids (Aittoniemi et al., 2007; Lange et al., 2005). Interestingly, treatment with PfNCR1-active compounds results in saponin sensitivity of the parasites leading to the release of parasite cytosolic content within a short period of exposure. Remarkably, this saponin sensitivity was reversed upon the removal of the compounds targeting PfNCR1. The reversible saponin sensitivity seen here is reminiscent of effects we have previously reported for antimalarial drugs that inhibit PfATP4, a P-type Na+ pump (Das et al., 2016). Induction of saponin sensitivity by PfATP4-active drugs was dependent upon the parasite being grown in a medium with standard [Na+]; saponin sensitivity was not seen in parasites grown in a medium with low [Na+]. Comparing the effects of PfNCR1-active compounds with PfATP4-active compounds, some similarities as well as differences become apparent. Both sets of compounds cause rapid but reversible saponin sensitivity in the PPM. PfATP4-active compounds disrupt Na+ homeostasis, which is a prerequisite for induction of saponin sensitivity, whereas PfNCR1-active compounds induce saponin sensitivity without disrupting Na+ homeostasis (Figure 4F and Figure 4—figure supplement 1C). It is possible that PfATP4 blockade perturbs the ionic environment critical for PfNCR1 function.

We noted that the concentrations at which PfNCR1-active compounds caused saponin sensitivity after a short exposure were much lower than the concentrations at which the compounds inhibited parasite growth in 72 hr assays. Similarly, PfNCR1 K/D caused saponin sensitivity of the PPM much sooner than inhibition of parasite growth. These results are opposite of what was previously seen for PfATP4-active compounds (Das et al., 2016). Parasites might have a greater tolerance for PPM composition disruption compared to the perturbation of Na+ homeostasis.

Another major consequence of PfNCR1 inhibition or K/D was dramatic changes in formation and morphology of the DVs of parasites. DVs are lysosome-like organelles crucial for degrading hemoglobin. Unlike other eukaryotes or related apicomplexans, malaria parasites must actively digest hemoglobin to create room in the erythrocyte for the growing cell and to generate amino acids for parasite protein synthesis (Krugliak et al., 2002; Rosenthal, 2011; Liu et al., 2006). Uptake of erythrocyte cytosolic contents proceeds via the invagination of the PVM and the PPM and fusion of the PPM with the DV membrane contributes to mature DV formation (Klemba et al., 2004). Perhaps the abnormal membrane curvature (Churchward et al., 2008) and lack of fusion of the DVs upon loss/inhibition of PfNCR1 function provide clues towards understanding the critical requirement for normal lipid homeostasis in malaria parasites. The accumulation of hemoglobin peptides after incubation with PfNCR1 inhibitors suggests hemoglobin catabolism as a target pathway for these compounds and supports our findings. Among eukaryotes with NCR1 proteins but lacking receptor-mediated sterol uptake, malaria parasites are unusual in their requirement for functional NCR1, thus making this protein an exciting new antimalarial target. The diversity of chemical scaffolds targeting a single critical protein should provide guidance for future drug design and discovery efforts.

Materials and methods

Parasite strains, culturing and resistance selection

View detailed protocol

Parasites were cultured in human red blood cells (2% hematocrit) in RPMI 1640 with 0.25% (w/v) Albumax (cRPMI) as previously described (Klemba et al., 2004; Trager and Jensen, 1976). A lab-adapted strain of 3D7 that has been fully sequenced was used for most experiments (Corey et al., 2016). For GFP overexpression in wild-type parasites, the previously described NF54eGFP line was used, which bears an eGFP expression cassette targeted to the cg6 locus using the attB x attP site-specific integrase recombination system (Straimer et al., 2012). Parasites with evolved resistance to MMV009108, MMV028038, or MMV019662 have been described (Corey et al., 2016). Briefly, 5 × 10⁸ to 2 × 10⁹ 3D7 parasites were pressured with concentrations of 3x-10x EC50. Resistant parasites were readily obtained in multiple selections for the three compounds. Resistant and transfected parasites were cloned by limiting dilution. Dose-response experiments were done in triplicate starting with synchronous, young ring-stage cultures (1–1.2% starting parasitemia). Parasitemia (percentage of total erythrocytes infected with parasites) was measured approximately 70–80 hr post compound addition by nucleic acid staining of iRBCs with 0.8 μg/ml acridine orange in PBS. Growth was normalized to parasite cultures with carrier only (DMSO). Chloroquine (500 nM) was used as a positive control for parasite growth inhibition. Data were fit to a sigmoidal growth inhibition curve. Growth curves of K/D and complemented parasites were done in technical triplicate with synchronous parasite cultures (aTc washout at young ring stage) by measuring daily parasitemias. Data were fit to an exponential growth equation. GraphPad Prism 5.0 was used for data analysis. Experiments for monitoring leakage (western blots and flow cytometry) of cytoplasmic HAD1, GFP or mRuby after compound treatment or under PfNCR1 K/D were performed with MACS LD (Miltenyi Biotech, Cat. No. 130-042-901) column-enriched parasites. Parasites were kept in cRPMI during all experiments. For aTc washouts, synchronous young ring-stage parasites were used. Washouts were repeated 3-4x, resuspending parasites at 2% hematocrit in cRPMI with 10 min incubations at room temperature for each washout.

Saponin release experiments

Request a detailed protocol

To monitor sensitivity to saponin, parasite cultures were pelleted (3 min x 840 g), pellets were suspended in 10X volume (most experiments) of room temperate saponin (prepared in PBS) for two mins (Sigma, Cat. No. S7900). Typical saponin concentration was 0.035%; modifications are indicated in the figure legends of experiments where appropriate. The released parasites were collected by centrifugation (3 min x 2200 g) and washed one time in cold PBS. In the experiment in Figure 4—figure supplement 1B (in which both supernatant and pellet fractions were collected) 2X volume saponin was used.

Tetanolysin release experiments

Request a detailed protocol

Magnet-purified synchronous trophozoite-stage parasites were suspended in 10X volume of tetanolysin (0, 0.5, 1, 2.5, 5, 7.5 ng/ml prepared in PBS) and incubated at room temperature for 2 min. The released parasites were collected by centrifugation (3 min x 2200 g) and washed one time in cold PBS.

Cloning and Southern blots

All plasmids were verified by direct Sanger sequencing. Primers are listed in Supplementary file 1.

Allelic exchange constructs

View detailed protocol

Allelic exchange constructs were based on the vector pPM2GT (Klemba et al., 2004). Basepairs 2305–4893 of PF3D7_0107500 were cloned into the AvrII/XhoI sites using primers AR1-F and AR1-R primers. Using this strategy, pfncr1 is expressed from the endogenous promoter in-frame with a C-terminal GFP (the native stop is deleted). The mutant constructs were prepared using QuikChange mutagenesis (Agilent Technologies, Cat. No. 20053). For the A1108T mutation, primer Mut-1 was used. In addition to the resistance mutation, this primer also introduces a BspHI site at bp 3294. For the A1208E mutation, primer Mut-2 was used. In addition to the resistance mutation, this primer also introduces a EcoRI site at bp 3605. For the F1436I mutation, primer Mut-3 was used. F1436I mutant parasites also contain a synonymous change at bp4579, resulting in the deletion of a HincII site. 100 μg of circular DNA was transfected by electroporation of ring-stage parasites. Parasites were selected with 5 nM WR99210 (kind gift of D. Jacobus), cycled twice off drug to enrich for parasites with integrated plasmid and cloned by limiting dilution.

PfNCR1apt parasites

Request a detailed protocol

In-Fusion cloning (Clontech) following PCR from gDNA was used to clone right and left homologous regions (RHR and LHR) for integration into the pfncr1 locus. For the right homologous region, the sequence between bp3671 and bp4893 (the stop was deleted) (primers RHR1F and RHR1R) was amplified. An AflII site was introduced at the 5’ end and AatII was introduced at the 3’ end. Silent shield mutations to protect the construct from cleavage by CRISPR/Cas9 were introduced at S1464-S1465. For the left homologous region, a 948 bp fragment starting 38 bp past the stop codon was amplified (LHR1F and LHR1R). An AscI site was introduced at the 5’ end and an AflII site was introduced at the 3’ end. After generation of single homologous region fragments, RHR and LHR PCR products were mixed, amplified with primers RHR1F and LHR1R and cloned into the plasmid pMG75 as described (Spillman et al., 2017). The resulting construct (pMG75-PfNCR1) contains a single in frame HA sequence followed by 10x aptamers for aTc-regulatable translational repression. The construct contains two additional amino acids (D,V) before the HA sequence, as two tandem AatII sites were mistakenly introduced. For the gRNA sequence, the sequence 5’-TTAATGTAGTGGGCCAAAAC-3’ was chosen. The sense and antisense primer pair GRNA1 and GRNA2 encoding the pfncr1 sgRNA seed sequence was annealed and inserted into the BtgZI site in plasmid pyAIO (Spillman et al., 2017), resulting in the plasmid pyAIO-PfNCR1-gRNA1. 100 μg of pMG75-PfNCR1 was linearized with AflII, purified by phenol-chloroform extraction and co-transfected with 50 μg of pyAIO-PfNCR1-gRNA1 by electroporation. Parasites containing the modified pfncr1 locus were selected with 5 μg/ml Blasticidin S. For the PfNCR1apt strain that expresses PMII-GFP, we transfected the previously described PMII-GFP clone (Klemba et al., 2004) with pyAIO-PfNCR1-gRNA1 and linearized pMG75-PfNCR1. In this case, parasites were selected with 5 nM WR99210 plus 5 μg/ml Blasticidin S and kept in media with 500 nM aTc. Parasites were cloned by limiting dilution.

Complementation of PfNCR1apt

Request a detailed protocol

For complementation, RNA was prepared from 3D7 parasites using TRIzol (ThermoFisher), pfncr1 RNA was amplified using a SuperScript RT-PCR kit (Invitrogen) with primers Comp1 and Comp2, cloned into the XhoI/AvrII sites of the pTEOE random integration vector with the PiggyBac transposase as described (Sigala et al., 2015; Balu et al., 2005). PfNCR1apt clone two was transfected and selected with 5 μg/ml Blasticidin S and 2 μM DSM-1 (Asinex) (Ganesan et al., 2011).

Expression of cytoplasmic GFP in PfNCR1apt background

Request a detailed protocol

GFP overexpression in PfNCR1apt parasites was achieved by targeting the eGFP expression cassette of NF54eGFP parasites to the rh3 locus by CRISPR/Cas9 editing. The calmodulin promoter and egfp coding sequencing was amplified from NF54eGFP genomic DNA template using primers eGFP-F and eGFP-R and inserted into the plasmid pPM2GT (Klemba et al., 2004) between AatII and EagI by In-Fusion cloning, allowing for fusion to the hsp86 3’ UTR. The sgRNA target site TGGTAATACAGAAATGGATG was chosen in the dispensable rh3 gene. Homology flanks were then amplified from sequence just upstream and downstream of the Cas9 cleavage site defined by this sgRNA using primers Rh3-5’F/R and Rh3-3’F/R. These amplified flanks were used as template and assembled into a single DNA molecule with an intervening AflII site in a second PCR reaction using primers Rh3-5’R and Rh3-3’F and this flank assembly was inserted into the BglII site of the pPM2GT-CAM-eGFP plasmid resulting in the plasmid pPM2GT-CAM-eGFP-RH3-flanks. A sense and antisense primer pair (Rh3-G1 and Rh3-G2) encoding the rh3 sgRNA seed sequence was annealed and inserted into the BtgZI site in plasmid pyAIO (Spillman et al., 2017) resulting in the plasmid pyAIO-RH3-gRNA1. Plasmid pPM2GT-CAM-eGFP-RH3-flanks was linearized at AflII and co-transfected with pyAIO-RH3-gRNA1 into PfNCR1apt clone two and selected with 2 μM DSM-1 for integration into the rh3 locus.

Expression of split-GFP

Request a detailed protocol

For split GFP experiments, two parasite lines were generated expressing either PV-targeted or cytosolic GFP1-10. A fusion of the sera5 signal peptide and gfp1-10 coding sequence was synthesized as a gBlock (gBlock1; IDT) and used as template to PCR amplify gfp1-10 with primers GFP1-10-1F and GFP1-10-1R or without the sera5 signal peptide (primers GFP1-10-2F and GFP1-10-1R). These amplicons were inserted into plasmid pLN-ENR-GFP (Adjalley et al., 2010) between AvrII and AflII to generate plasmids pLN-SP-GFP1-10 and pLN-GFP1-10, respectively. Each plasmid was co-transfected with plasmid pINT into NF54attB parasites and selected with 2.5 µg/ml Blasticidin S to facilitate integration into the cg6 locus through integrase-mediated attB x attP recombination (Adjalley et al., 2010). A clonal line was derived from each transfected parasite population by limiting dilution and designated NF54pvGFP1-10 or NF54cytGFP1-10, respectively. GFP1-10 expression and targeting to the proper compartment (parasitophorous vacuole or cytosol) was confirmed by western blot and immunofluorescence assay using a rabbit-anti-GFP (Abcam 6556). For endogenous tagging of PfNCR1 with 3xHA-GFP11, pfncr1 was amplified from pMG75-PfNCR1 with primers GFP11-F and GFP11-R and inserted into the plasmid pyPM2GT-EXP2-mNeonGreen (Glushakova et al., 2017) between XhoI and AvrII. Transfections were selected with 2 μM DSM-1. This construct expresses PfNCR1-GFP11 from its native promoter.

For monitoring PVM integrity

Request a detailed protocol

The line NF54-EXP2-mNeonGreen + PV-mRuby3 was used (Glushakova et al., 2018).

Southern blot

Request a detailed protocol

To confirm correct integration, we used the AlkPhos Direct Kit (FisherScientific Cat. No. 45-000-936) for Southern blots as described (Klemba et al., 2004). For the probe, we amplified a 674 bp fragment from gDNA using primers Probe1 and Probe2.

Microscopy

Request a detailed protocol

Fluorescence microscopy was performed on live, GFP-expressing parasites using a Zeiss Axioskope. Nucleic acid was detected by staining with DAPI. For Figures 3D–G and Figure 7B and D, background correction was done using the program Affinity Designer and was applied consistently for all figures. For Figure 3D, spinning-disc confocal images of live or immunolabeled cells were captured and analyzed on an AxioObserver Z1 (Carl Zeiss, Inc) with a 60X oil objective, running Zen two software (Carl Zeiss, Inc).

For electron microscopy, infected RBCs were enriched using MACs LD columns, fixed in 4% paraformaldehyde (Polysciences Inc, Warrington, PA) in 100 mM PIPES/0.5 mM MgCl2, pH 7.2 for 1 hr at 4°C. Samples were then embedded in 10% gelatin and infiltrated overnight with 2.3M sucrose/20% polyvinyl pyrrolidone in PIPES/MgCl2 at 4°C. Samples were trimmed, frozen in liquid nitrogen, and sectioned with a Leica Ultracut UCT cryo-ultramicrotome (Leica Microsystems Inc, Bannockburn, IL). 50 nm sections were blocked with 5% FBS/5% NGS for 30 min and subsequently incubated with rabbit anti-GFP (Life Technologies; Cat. No. A11122) (1:500) for 1 hr, followed by goat anti-rabbit IgG (H + L) antibody conjugated to 18 nm colloidal gold (1:30) (Jackson ImmunoResearch) for 1 hr. Sections were washed in PIPES buffer followed by a water rinse, and stained with 0.3% uranyl acetate/2% methyl cellulose and viewed on a JEOL 1200EX transmission electron microscope (JEOL USA, Peabody, MA) equipped with an AMT eight megapixel digital camera (Advanced Microscopy Techniques, Woburn, MA). All labeling experiments were conducted in parallel with controls omitting the primary antibody which was consistently negative at the concentration of colloidal gold conjugated secondary antibodies used in these studies. For EM without immunostaining, cells were fixed in 2% paraformaldehyde/2.5% glutaraldehyde (Polysciences Inc, Warrington, PA) in 100 mM sodium cacodylate buffer, pH 7.2 for 1 hr at room temperature. Samples were washed in sodium cacodylate buffer and postfixed in 1% osmium tetroxide (Polysciences Inc) for 1 hr. Samples were then rinsed extensively in dH2O prior to en bloc staining with 1% aqueous uranyl acetate (Ted Pella Inc, Redding, CA) for 1 hr. Following several rinses in dH2O, samples were dehydrated in a graded series of ethanol and embedded in Eponate 12 resin (Ted Pella Inc). Sections of 95 nm were cut with a Leica Ultracut UCT ultramicrotome (Leica Microsystems Inc, Bannockburn, IL), stained with uranyl acetate and lead citrate, and viewed on a JEOL 1200 EX transmission electron microscope (JEOL USA Inc, Peabody, MA) equipped with an AMT eight megapixel digital camera and AMT Image Capture Engine V602 software (Advanced Microscopy Techniques, Woburn, MA).

Flow cytometry

Request a detailed protocol

For flow cytometry experiments with eGFP, 50,000 cells were counted on a BD FACSCanto and scored for high or low GFP signal. Appropriate gating of cells was established using untreated parental or NF54eGFP parasites.

Western blotting

Request a detailed protocol

For PfNCR1 blots, membrane preparations were made. 1 × 10⁸ to 5 × 10⁸ trophozoite-stage parasites were released from RBC with 0.035% saponin, washed in cold PBS, resuspended in 300 μl DI-water with protease inhibitors (HALT, ThermoFisher, Cat. No. 78430), freeze-thawed 3x with liquid nitrogen/42°C water bath. The membranes were pelleted (17 k g), resuspended in 100 μl-300μl (depending on sample amount) Ripa buffer (25 mM Tris (pH 7.6), 150 mM NaCl, 1% NP-50, 0.1% SDS, 1% Sodium Deoxycholate) containing 0.1% CHAPS and 0.1% ASB-14, sonicated 3x with a microtip, and incubated at 42°C with shaking for 45 min. The samples were then centrifuged (17 k g, 30 min), SDS sample buffer was added to the soluble portions. The samples were warmed at 42°C and loaded on 4–15% TGX gradient gels (Biorad). Proteins were transferred onto PVDF using wet transfer with 20% methanol. Blots were blocked either 1 hr at 25°C or overnight at 4°C with Licor Odessey block buffer. Primary antibodies were mouse monoclonal α-HA antibody (Biolegend) at 1:1000 or LivingColors mouse-α-GFP (Takara, Cat. No. 632380) (1:1000). For the loading control mouse monoclonal α-PM-V antibody (Banerjee et al., 2002) at 1:20 was used. Secondary antibody was goat-α-mouse (800) IR-Dyes (1:20,000) from Licor.

For western blot monitoring leakage of cytosolic proteins after incubation with compound or PfNCR1 K/D, parasites were resuspended in saponin-containing PBS, pelleted, lysed in Ripa buffer containing protease inhibitors and with brief sonication. Soluble proteins after centrifugation (30 min, 17 k g) were added to sample buffer, briefly heated at 980C and loaded onto 10% or 12% TGX gels (Biorad). Western blotting was done using the protocol indicated above. Primary antibodies were: rabbit α-HAD1 (a gift from Dr. Audrey Odom John, WU) (Guggisberg et al., 2014) (1:1000), rabbit α-Hsp60 (1:500) (a gift from Dr. Sabine Rospert, University of Freiburg), mouse α-PM-V (1:20) (Banerjee et al., 2002), rabbit α-RFP (1:1000) (Thermofisher, Cat. No. R10367), mouse α-GFP (Living Colors JL-8, Clontech, Cat. No. 632380) (1:1000), HRP-conjugated α-aldolase (Abcam, Cat. No. ab38905) (1:10000), α-EXP2 antibody (gift from Professor James Burns, Drexel University) (1:10000) (Das et al., 2016). Secondary antibodies were goat-α-mouse (800) and donkey-α-rabbit (680) IR-Dyes (1:20,000) from Licor. Immunoblots shown in Figure 4A and E and Figure 6—figure supplement 1 were washed in PBS-Tween (0.2%) and developed using the Super Signal West Pico Chemiluminescent substrate (Thermo Scientific, Cat. No. 34080).

Measuring intracellular [Na+]

Request a detailed protocol

Intracellular Na+ measurements for parasites were performed using methods adapted from Spillman et al. (2013). Briefly, P. falciparum cultures were loaded with the sodium-sensitive dye SFBI-AM (5.5 µM) (Molecular Probes) and 0.02% w/v Pluronic F-127 (Molecular Probes) in RPMI at 37°C for 1 hr. Loaded parasite cultures were diluted to 5% hematocrit and freed from host red blood cells by exposing the culture to 0.05% w/v saponin (Sigma-Aldrich #47036) for 15–20 s and pelleted by centrifuging at 500x g, 5 min. Freed parasites were washed twice (2000x g, 30 s) and resuspended to a final concentration of 5–7.5 × 10⁷ cells/mL in a saline buffer (125 mM NaCl, 5 mM KCl, 1 mM MgCl2, 20 mM glucose, 25 mM HEPES, pH 7.3). SBFI-loaded parasites were excited at 340 nm and 380 nm with emissions recorded at 505 nm at 37°C in a fluorescence spectrophotometer (Hitachi F-7000). Auto-fluorescence corrected SBFI emissions at 340 nm and 380 nm were plotted as ratios.

Metabolomic profiling

Request a detailed protocol

Changes in metabolites were measured in response to compounds using whole cell hydrophilic extraction, followed by ultra-high precision liquid chromatography mass-spectrometry (UHPLC-MS) using negative ionization as in Cowell et al., 2018 (Cowell et al., 2018). This was performed on synchronous, trophozoite infected red blood cells (iRBCs, 24–36 hpi) which had been magnetically separated from culture. Quantification of cells was performed by hemocytometry, and treatments were performed on 1 × 10⁸ iRBCs in wells containing 5 mL of RPMI. Treatment conditions were performed in triplicate, with compound concentrations of 10xEC50 for 2.5 hr, followed by washing with PBS and extraction using 90% methanol containing isotopically-labeled aspartate as an internal standard for sample volume. Samples were dried using nitrogen prior to resuspension in water containing 0.5 uM chlorpropamide as an internal standard for injection volume. Samples were then analyzed via UHPLC-MS on a Thermo Scientific EXACTIVE PLUS Orbitrap instrument as established in Allman et al., 2016 (Allman et al., 2016).

Data availability

All source data are included in the manuscript. Complete metabolomic data has been deposited at Metabolomics Workbench (doi: 10.21228/M8DH49).

The following data sets were generated
    1. Eva Istvan
    2. Sudipta Das
    3. Suyash Bhatnagar
    4. Josh R Beck
    (2019) UCSD Metabolomics Workbench
    Metabolomic Data from: 'Plasmodium Niemann-Pick type C1-related protein is a druggable target required for parasite membrane homeostasis'.
    https://doi.org/10.21228/M8DH49

References

    1. Pentchev PG
    (2004) Niemann-Pick C research from mouse to gene
    Biochimica Et Biophysica Acta (BBA) - Molecular and Cell Biology of Lipids 1685:3–7.
    https://doi.org/10.1016/j.bbalip.2004.08.005

Decision letter

  1. Dominique Soldati-Favre
    Reviewing Editor; University of Geneva, Switzerland
  2. Anna Akhmanova
    Senior Editor; Utrecht University, Netherlands

In the interests of transparency, eLife includes the editorial decision letter, peer reviews, and accompanying author responses.

[Editorial note: This article has been through an editorial process in which the authors decide how to respond to the issues raised during peer review. The Reviewing Editor's assessment is that all the issues have been addressed.]

Thank you for submitting your article "Plasmodium falciparum Niemann-Pick Type C1-Related Protein:a Druggable Target Required for Parasite Membrane Homeostasis" for consideration by eLife. Your article has been reviewed by three peer reviewers, and the evaluation has been overseen by a Reviewing Editor and Anna Akhmanova as the Senior Editor. The reviewers have opted to remain anonymous.

The Reviewing Editor has highlighted the concerns that require revision and/or responses, and we have included the separate reviews below for your consideration. If you have any questions, please do not hesitate to contact us.

Istvan and colleagues functionally characterized a putative lipid transporter named PfNCR1 based on some homology to a human Neimann-Pick C1-related cholesterol transporter. They identified this gene through in vitro selection of resistant mutants with 3 structurally distinct lead compounds in whole-cell antimalarial growth inhibition screens. Allelic exchanges to introduce the selected mutations increased IC50 values for the antimalarial compounds thus supporting a role of the gene product in resistance. Conditional knockdown of the transporter also increased sensitivity to the antimalarial compounds. The lack of expression or chemical inhibition of the protein results in an increased sensitivity of the parasite plasma membrane and digestive vacuole membrane to saponin, an amphipathic glycoside with a high affinity for cholesterol. The authors propose that PfNCR1 serves a role in cholesterol export and localizes to the parasite plasma membrane using split GFP constructs, in contrast to a lysosomal localization for the human ortholog. Taken together the data are consistent with PfNCR1 having a role in regulating the lipid composition of the plasma membrane and digestive vacuole membrane and qualify as a a novel Plasmodium falciparum candidate drug target.

As noted in the reviews below, the reviewers agree that the findings are of broad interest and suitable novelty for presentation in eLife. However, they identified major weaknesses and expect that you will be able to address their various concerns described below by revising the work.

All of the reviewers have raised serious concerns about statistical significance as it relates to several critical findings. In addition, the interpretation of NCR1 localization and its presumed role and essentiality are insufficiently supported by the data presented.

Separate reviews (please respond to each point):

Reviewer #1

This well written manuscript reports on a combination of both chemical compounds and genetics to identify PfNCR1 as a novel Plasmodium falciparum drug target. The authors used three chemically diverse compounds for selections to induce resistance in a wild type parasite line and confirmed the resulting single nucleotide polymorphisms (SNPs) as the drivers of resistance by introducing them in wild type backgrounds via single-crossover allelic exchange. Two of the mutations, A1108T and F1436I, were found to confer resistance to all three compounds while A1208E generated resistance only to the selecting compound. An effort to disrupt pfncr1 proved unsuccessful, suggesting essentiality. This was further substantiated by a genetic knock down (K/D) using a regulated aptamer translation repression technology showing that PfNCR1 is important for asexual parasite viability. This was further validated by the rescue of K/D growth defects by complementing wild type PfNCR1. Using split GFP constructs, the authors were able to show that PfNCR1 is localized on the parasite's plasma membrane (PPM), in contrast to an earlier study that suggested digestive vacuole (DV) localization. On the basis of known or predicted functions of human, yeast or Toxoplasma orthologs in cholesterol transport, the authors assessed the effects of saponin, an amphipathic glycoside with a high affinity for cholesterol, on compound treated or PfNCR1 K/D parasites. The results showed that in both cases, the parasites were hyper-sensitized to saponin, suggesting that 1) the tested compounds interfered with PfNCR1 activity and 2) that PfNCR1 function is required for the maintenance of PPM lipid composition. Because parasite DVs are formed from vesicles originating from the PPM, the authors investigated whether PfNCR1 activity is also required for DV function. Their results provided evidence that both compound-treated and PfNCR1 K/D parasites had deformed DVs, validating their initial hypothesis.

This is a focused and well executed study. I found the manuscript to be clear and well-written and deserving of publication in eLife. Listed below are several suggestions that could benefit the manuscript.

1) I could not find the IC50s of the different compounds. Please add these to the manuscript or to a supplementary table.

2) Many the experiments reported in this manuscript were done in biological duplicates (N = 2). This is not sufficient to claim statistical significance, at least not if the data were part of a major figure in the paper. A third repeat would be desirable (Figure 1 E-F) and might even help data interpretation regarding Figure 4 B-D. Parasite leakiness in response to saponin and MMV009108 seems lower at 50 and 100 nM of compound versus that observed when treated with MMV028038 and MMV019662. Can this effect be quantified as IC50s to allow for easier comparison between different treatments? Is the lower effect of MMV009108 related to a lower general activity of MMV009108 versus the other compounds?

3) The GFP signal in Figures 3 and 7 is either too diffuse or is not sufficient in labeling organelles of interest in the microscopy images shown, without the presence of other parasite organelle markers. I would propose to either perform co-staining with known organelle markers to better orient the reader, or move the live-cell and fixed IFA images to the supplement. The immuno-electron microscopy images provided are clearer and by themselves appear satisfactory in showing localization and DV deformation.

Minor:

1) Figure 1C – Could you elaborate on how the schematic was generated based on the limited sequence similarity between hNPC1 and PfNCR1? Was this achieved via visual association?

2) Figure 2—figure supplement 1A – A schematic of the plasmid, the wild type locus and the subsequent recombinant locus would be more informative when interpreting the gel.

3) Figure 2A – The legend says that the harvested parasites were trophozoite stage yet the text in subsection "PfNCR1 is Important for Asexual Parasite Viability and is Targeted by Antimalarial Compounds" of the Results section says they were highly synchronized young rings. Please clarify.

4) Figure 2C – Is there any obvious explanation as to why the complemented strain proliferates less well than the PfNCR1apt with aTc, especially since the legend mentions that the rescue was done using a stably expressed wt PfNCR1 strain? Also, please report the missing R2 in the legend part C for "+aTc".

5) Figure 2 D-H – A key beside the panels would be helpful.

6) The different subpanels of Figure 4 B-D are mislabeled in the figure legend.

Reviewer #2

This is a very interesting study in which an uncharacterised transport protein in P. falciparum was shown to be essential for normal growth, implicated as the target of three structurally diverse chemicals, and localised to the parasite plasma membrane. Multiple lines of evidence were provided that the lack of expression or chemical inhibition of the protein results in an increased saponin sensitivity of the parasite plasma membrane and digestive vacuole membrane. The data are consistent with the protein having a role in regulating the lipid composition of the plasma membrane and consequently the DV membrane.

One concern is that straightforward experiments like FACS-based parasite growth assays (Figure 1 D-F, Figure 2 D,F-H) and measurements of GFP release (Figure 4 C-D) were performed fewer than three times, with data from a single experiment shown. It is not stated how many times the Na+ experiment shown in Figure 4F, or the growth assays shown in Figure 1—figure supplement 2 and Figure 4—figure supplement 1C, were performed. Experiments such as these should be performed at least three times and averaged data should be shown or averaged IC50/EC50/rate values provided. The low number of biological replicates means that statistical comparisons cannot be (and were not) performed for these data. Very few of the findings in this study (only the data in Figure 7 C,E) are verified as being statistically significant. The authors state that the PfNCR1 K/D parasites are 'minimally hypersensitive' to KAE609. This statement is not justified based on a subtle difference shown in a single experiment.

1) It is not clear how the experiments shown in Figure 2 B and C were performed or how the cumulative parasitemia was calculated. What was the starting parasitemia? Were the cultures diluted and supplemented with uninfected RBCs when required?

2) Figure 7B and 7E – it would be good to see a few representative images for each treatment rather than just one so that readers can understand what was categorised as 'diffuse' and what was categorised as 'puncta'.

3) It is not clear what the authors mean when they say that the Na+ measurements were calibrated 'using an average from 3 independent calibration curves for SBFI'. Do they mean that three sets of calibrations were performed within each experiment? Or were calibration curves obtained in three initial experiments used to calibrate data obtained in subsequent experiments? Given that the precise cell number and cell age distribution (as well as other factors) will affect the fluorescence ratio obtained in a particular experiment, it would not be appropriate to apply calibration data that were obtained in a different experiment.

4) Can the authors comment (in the manuscript) on how the resistance levels of the transfectant lines compare to the resistance levels of the compound-selected parasites?

5) Can the authors explain (in the manuscript) the rationale for engineering only one of the two mutations selected for by MMV028038 and MMV019662?

6) Can the authors comment (in the manuscript) on whether their inability to knock out pfncr1 was consistent with the results obtained in the mutagenesis study by Zhang et al. (Science)?

7) Is it surprising that the PfNCR1 knock-down parasites grew as well as they did? Have the authors attempted to quantify how much PfNCR1 expression still occurs in the absence of aTc?

8) Figure 1 title needs correcting: 'Mutations in PfNCR1 confer resistance mutations…'

9) Figure 1 legend needs correcting: 'resistant mutations'

10) Figure 4 legend needs correcting: 'Treated parasites were washed out…'

11) Some of the panel letters referred to in the Figure 4 legend are not used in the correct place.

12) What does 'SP' refer to in Figure 3? Would 'PV' be more appropriate?

13) Figure 6 – can HA on the figure be replaced with PfNCR1-HA?

There was a lack of statistical information because many experiments were not performed enough times.

Reviewer #3

Istvan and colleagues report molecular and cell biology studies of a putative lipid transporter (PF3D7_0107500) which they rename PfNCR1 based on some homology to a human Neimann-Pick C1-related cholesterol transporter. The authors identified this gene through in vitro selection of resistant mutants with 3 lead compounds in whole-cell antimalarial growth inhibition screens. Allelic exchange to introduce the selected mutations increases IC50 values for the antimalarial compounds, supporting a role of the gene product in resistance. Conditional knockdown of the transporter also increased sensitivity to the antimalarial compounds. The authors suggest that PfNCR1 is essential, serves a role in cholesterol export and localizes to the parasite plasma membrane, in contrast to a lysosomal localization for the human ortholog.

1) Localization of the putative transporter: The authors show that the GFP-tagged PfNCR1 produces a fluorescence signal around the intracellular parasite (Figure 3A). Immuno-EM using an anti-GFP antibody supports this with gold-dot labeling of either the parasite plasma membrane (PPM) or the PVM; as immuno-EM could not distinguish between the PPM and PVM, they used an interesting split-GFP strategy with expression of soluble GFP1-10 and a short GFP11 tag at the C-terminus of PfNCR1. When GFP1-10 was targeted to the parasite cytosol, they observed a diffuse fluorescence signal in the parasite cytosol (Figure 3D); when GFP1-10 is targeted to the lumen of the PV, no signal was observed. They interpret this as supporting a PPM localization with the C-terminus projecting into the parasite cytoplasm. This approach, though creative and well-executed, raises two concerns.

a) The results equally well support a PVM localization with the protein C-terminus projecting into host cytosol. In this alternate model, the signal observed with GFP1-10 in parasite cytosol would represent protein in transit from the parasite ER and exported via vesicular trafficking. Although it is not clear how parasite-derived membrane proteins reach the PVM, export from the PPM on exocytic vesicles and subsequent fusion with the PVM is a favorite model of most workers. Because the GFP11 tag would be intravesicular during this transit and then exposed to host cytosol after insertion, a fluorescence signal with GFP1-10 in the PV lumen would not be expected. Thus, the split-GFP strategy used cannot unambiguously distinguish between PPM and PVM localizations. The authors' statement "our model suggests that the relative orientation of the cytosolic regions in these two distantly related proteins is conserved" applies equally well to both the PPM and PVM models, and so does not help resolve. The authors should consider indirect immunofluorescence after erythrocyte membrane permeabilization with tetanolysin to explore a PVM localization, as has been used by other workers (JBC 278:48413, 2003); while a positive result would conclusively support a PVM localization, a negative result would warrant further experimentation.

b) The fluorescence signals shown in Figure 3A (full-length GFP tag on PfNCR1) and Figure 3D (short GFP11 tag on PfNCR1) appear to be noticeably different from one another, with a rim pattern for the full-length GFP tag and a more diffuse cytoplasmic pattern for the short GFP11 tag. This raises the possibility that a large, full-length GFP tag may cause PfNCR1 mis-trafficking to the PPM/PVM. Did the authors attempt IFA with anti-HA and the PfNCR1-apt parasite, which has an acceptably small epitope tag? This reviewer feels this is necessary, in part because the PPM localization contrasts with the more conventional localization of NCR1 to the lysosome in other organisms; the abnormal DV phenotype in the PfNCR1 knockdown could also suggest that the wild-type protein localizes to the DV (the parasite lysosome-equivalent).

2) Presumed transport activity: The authors name the putative transporter NCR1 based on weak homology to the human NCR1 and orthologs in Saccharomyces and Toxoplasma; I would caution against assigning a name and role based on computational analysis alone. A role in cholesterol transport for ScNCR1 and TgNCR1 were supported by complementation experiments in mammalian cells lacking NPC1. The authors present an increased saponin sensitivity of the parasite upon PfNCR1 knockdown or inhibitor treatment as evidence for cholesterol transport, but they made the same observations in PfATP4 studies in a prior publication. Why didn't they propose a role in cholesterol transport for that transporter? A more cautious view might be that increased saponin sensitivity is a nonspecific parasite response to induced defects at the PPM. Complementation experiments such as performed for ScNCR1 and TgNCR1 appear to be critical for supporting their model. Control knockdowns followed by saponin-sensitivity experiments for other membrane proteins at the PPM may also help to exclude a nonspecific parasite response.

3) Essentiality: The authors emphasize that, in contrast to presumed orthologs in other organisms, PfNCR1 is essential. This seems to be based on negative results with attempted CRISPR knockout and on a delayed slow growth phenotype with conditional knockdown using the TetR-DOZI/aptamer system. Remarkably, the delayed slow growth phenotype appears to take ~ 10 days (about 5 asexual cycles) to be manifest clearly as no statistics on differences in growth rate for plus and minus aTC are presented. While the continued slow growth could reflect low level expression of the transporter (at levels below detection in immunoblotting, Figure 2A), a more cautious view might be that the transporter is not strictly essential. This would be more in line with NCR1 in other organisms.

a) A control transfection with the CRISPR guide used for knockout would confirm that the sgRNA used is effective and that target site is accessible.

b) Does continued growth without aTC lead to adaptation and more rapid expansion?

c) Other conditional knockout strategies such as diCre-mediated disruption of the gene (Scientific Reports 7:3881, 2017) could be used to implicate essentiality more conclusively because that approach would not allow continued low-level expression of NCR1 upon rapamycin-induced disruption of the gene.

4) Less important points:

a) Figure 2D, showing a dose-effect for aTC and sensitivity to inhibitor was only done once. I do not consider it appropriate to include data from an experiment performed only once. Do the selected aTC concentrations correspond to measurable differences in PfNCR1 expression, as detected by immunoblotting?

b) Figures 1D-F and 2E-H are critical for linking the mutations in PfNCR1 to action of the three MMV drug leads. Each of these panels shows a < 10-fold change in drug IC50 when the transporter is mutated or knocked down. For each, a single experiment with three replicates is shown with the legends stating that nearly all were only done twice. As variation in parasite growth inhibition experiments is greater between trials (often 2-3 fold in most workers hands) than within a trial, a statistical analysis taking at least 3 independent trials seems necessary. (To my eye, Figures 1D and 1E appear to show only a 2-3 fold difference between WT and mutant.)

c) How many times were the drug selections to identify PfNCR1 performed? What other genes were found in the genome sequencing? Prior studies, e.g. those implicating PfATP4, were more transparent.

d) Figure 1—figure supplement 1B, Southern blot. Each mutant lane shows two bands at 1.3 and 1.1 kB for the retained plasmid and the desired integrant. Shouldn't there also be a higher MW band for the displaced WT locus, as shown in the panel A? Because the mutations shown through DNA sequencing in panel C could derive from the retained plasmid, inclusion of PCR checks for integration and possible residual WT locus in the cloned parasites would help convince careful readers.

Almost no statistical analyses are provided, concerning especially for Figure 1D-F, Figure 2D-H, and Figure 8, where experiments were typically done only once or twice. Each panel shows only the results from a representative experiment, so readers are inclined to believe the better of two trials is shown. Additional trials and statistical analyses are needed to support several conclusions critical to the story.

[Editors' note: further revisions were suggested, as described below.]

Thank you for resubmitting your work entitled "Plasmodium Niemann-Pick Type C1-Related Protein is a Druggable Target Required for Parasite Membrane Homeostasis" for further consideration at eLife. Your revised article has been favorably evaluated by Anna Akhmanova (Senior Editor), a Reviewing Editor, and three reviewers.

The manuscript has been improved but there are some remaining issues we would recommend addressing before publication, as outlined below:

1) To address reviewer 2 and point 1 of reviewer 3, please ensure that the data are presented across all experiments, and avoid showing representative experiments with errors of technical replicates. Carefully check that no details are missing in the source data files.

2) In regard to point 2 and 3 raised by reviewer 3 you are encouraged to more cautiously interpret your results as suggested.

3) Please take note of the other reviewer comments and address them where possible, or explain why this is not possible.

Reviewer #1:

This interesting and high-quality submission is clearly improved from the first submission, as a result of improving the data robustness and experimental descriptions. The authors have provided a robust and suitable response to the reviewers' concerns. I have no further requests for modification and am enthusiastic about the scientific value and broad interest of this report.

Reviewer #2:

This is an interesting and high quality study. Improvements have been made to the manuscript.

In some instances there remains a lack of clarity with regards to what data are shown and how many experiments have been performed. The manuscript would also benefit from statistical analyses such as ANOVAs to (for example) compare the sensitivity of different parasite lines to compounds.

Minor Comments:

Information on how many experiments were performed is missing in the legend for Figure 1—figure supplement 1 D and Figure 1—figure supplement 3.

Additional details would be useful in the source data files. What does 'replicates' mean and are they technical replicates, biological replicates or both? Have data from different clones been averaged together?

"One representative experiment with biological triplicates is shown". The term "biological triplicates" is confusing in this context. If replicates were included within an experiment, they should be referred to as 'technical replicates'. 'Biological replicates' implies independent repeats of experiments.

Figure legends should not only state how many times an experiment was performed, but should also specify what the data shown represent. For example Figure 4B-D – it is stated that the experiments were performed twice or three times. However it is not stated whether the data shown in the figures are from single representative experiments or are the averaged data from multiple experiments. The authors should also review their y axes in these figures – they imply that the maximum intracellular GFP was 1%.

Additional data files and statistical comments:

Statistical analyses (e.g. ANOVAs to determine whether IC50 values for compounds vary between mutants and their parent) have still not been performed. Very little statistical information is supplied in the manuscript.

Reviewer #3:

The four main questions raised in prior reviews related to localisation of PfNCR1, the protein's essentiality, PfNCR1 role, and statistical analyses of significance in independent experimental trials.

Unfortunately, all these questions remain inadequately addressed.

1) Statistical significance analyses. The authors' rebuttal states that they performed the experiments many times, including in separate labs, but because of protocol differences that they could not be combined and presented together. Another argument provided is that some experiments are only confirmatory of other findings and were only done twice for this reason. A third argument was that some experiments were too "laborious.…[and] just backed up other data". The authors also state "experiments were done at least twice with two different clones, which is essentially biological quadruplicates", which most reviewers will agree is not up to standard.

Some experiments appear to have been done additional times now to reach an n of 3 but most of those figures still appear to show the results from a single experiment with error bars of technical replicates from that trial. These arguments are considered untenable by most journals now, as defined by a 2014 NIH joint workshop with Nature publishing group and Science (see https://www.nih.gov/research-training/rigor-reproducibility/principles-guidelines-reporting-preclinical-research for specifics; see also the PNAS author guidelines which states "Statistical analyses should be done on all available data and not just on data from a "representative experiment." Statistics and error bars should only be shown for independent experiments and not for replicates within a single experiment").

For this reviewer, the most important problem is that key figures still show results from a single experiment with error bars of technical replicates (Figure 1 D-F, Figure 2B-H, Figure 4B-D), preventing readers from evaluating statistical significance between mutants and parental lines; t tests with P values to attest to significant differences are still not provided in the new statistical Tables. For the growth inhibition studies in Figures 1 and 2, can the authors perform a Student's t test comparing mutant vs. wild-type IC50 values from three independent experiments and provide a P value for each reported difference? It is not adequate to state "The error bars (S.D.) for a representative experiment (biological triplicates) are shown and are very small" because these "very small" error bars only inform on technical issues such as pipetting of cells and reagents.

2) PfNCR1 localisation. The split-GFP reporter assay, though creative and challenging to create in cultured parasites, does not unambiguously localize PfNCR1 to the PPM as opposed to the PVM. This is not because of a "very weak signal" as the authors' rebuttal states, but because the split-GFP approach is simply not empowered to address this question. As described in my prior review, a protein at the PVM with C-terminus facing erythrocyte cytosol will produce the same pattern of GFP fluorescence as one at the PPM with C-terminus facing parasite cytosol: both localisations will yield no signal with GFP1 10 targeted to the vacuolar space between these membranes; a "very weak signal" as the authors acknowledge reduces the sensitivity for detecting the other two orientations as well (PVM or PPM proteins with the C-termini facing vacuolar space). The question should either be conclusively addressed or the authors may want to interpret more cautiously.

3) Essentiality of PfNCR1. The authors continue to present PfNCR1 as essential based on failed CRIPSR knockout, dangerous as there are examples where this has yielded incorrect interpretation (e.g. JBC 286:41312 from some of the present authors, later shown to be dispensable PNAS 112:10216 using P. berghei). Rather than adding new data, the authors cite the Zhang et al. genome-wide knockout study as supporting essentiality. Since the authors show expansion of a knockdown line with undetectable PfNCR1 expression and orthologs in other organisms have been proven nonessential, they may again want to interpret more cautiously.

4) Presumed role of PfNCR1. The paper lacks substantive data regarding the proposed role of PfNCR1 in cholesterol or lipid transport. The saponin-sensitivity experiments are interesting, but very similar results are seen with PfATP4 knockdown or block. The author's response "The reviewer's point is well taken" is not matched by new experimentation; the suggestion for complementation studies as used for ScNCR1 and TgNCR1 was dismissed as potentially misleading. The authors rely entirely on computational analysis to assign a role in lipid transport for PfNCR1 and not for PfATP4. If both the role and essentiality were established without the present studies (by computational analysis and the Zhang study), this paper may not meet eLife novelty standards.

Minor points:

The anti-HA immuno-EM is good, but IFA as requested in the prior review will be more sensitive for excluding a DV localisation, which remains likely given where NCR1 orthologs localise and the observed changes in DV phenotypes. The interpretation that PfNCR1 changes PPM lipid composition so drastically that endosome and eventually the DV have altered properties as a byproduct is a complicated model that reads as too speculative in the absence of biochemical studies.

Loop-out of the 2nd promoter-less copy, as invoked to account for lack of an expected second band in the Southern blot, is surprising and may be unprecedented in P. falciparum as this would require non-homologous end-joining machinery.

https://doi.org/10.7554/eLife.40529.031

Author response

As noted in the reviews below, the reviewers agree that the findings are of broad interest and suitable novelty for presentation in eLife. However, they identified major weaknesses and expect that you will be able to address their various concerns described below by revising the work.

All of the reviewers have raised serious concerns about statistical significance as it relates to several critical findings. In addition, the interpretation of NCR1 localization and its presumed role and essentiality are insufficiently supported by the data presented.

We thank the editors for considering our manuscript for publication and the reviewers for their careful evaluations.

We agree with the reviewers that it is important to ensure reproducibility. Each assertion in the paper has evidence from multiple lines of experimentation, done multiple times and often reproduced in two different labs. Often an experiment was done many times, but since there were some protocol variations, could not be counted as repetitions even though they support the point being made. Experiments that were done fewer than 3 times were laborious experiments that just backed up other data. Now, most experiments have been done at least three times, and the few that were not have been noted and justified below. The results are very clear and inspire high level of confidence.

The issues of NCR1 localization, role and essentiality are all addressed below.

Separate reviews (please respond to each point):

Reviewer #1:

[…] This is a focused and well executed study. I found the manuscript to be clear and well-written and deserving of publication in eLife. Listed below are several suggestions that could benefit the manuscript.

1) I could not find the IC50s of the different compounds. Please add these to the manuscript or to a supplementary table.

EC50s of compounds are similar and in the sub-μM range. Numbers and replicates have been provided in Figure 1—source data 1.

2) Many the experiments reported in this manuscript were done in biological duplicates (N = 2). This is not sufficient to claim statistical significance, at least not if the data were part of a major figure in the paper. A third repeat would be desirable (Figure 1 E-F) and might even help data interpretation regarding Figure 4 B-D. Parasite leakiness in response to saponin and MMV009108 seems lower at 50 and 100 nM of compound versus that observed when treated with MMV028038 and MMV019662. Can this effect be quantified as IC50s to allow for easier comparison between different treatments? Is the lower effect of MMV009108 related to a lower general activity of MMV009108 versus the other compounds?

More replicates have been added for Figures 1, 2 and 4. Tables with concentration-response statistics are presented in Figure 1—source data 1 and 2, Figure 2—source data 1, and Figure 4—source data 1. Parasite sensitivity to saponin permeabilization was similar for the three compounds at 50-100nM. Small variations were observed in different experiments, but the sensitivity was always dramatically different in compound-treated parasites compared to untreated parasites.

3) The GFP signal in Figures 3 and 7 is either too diffuse or is not sufficient in labeling organelles of interest in the microscopy images shown, without the presence of other parasite organelle markers. I would propose to either perform co-staining with known organelle markers to better orient the reader, or move the live-cell and fixed IFA images to the supplement. The immuno-electron microscopy images provided are clearer and by themselves appear satisfactory in showing localization and DV deformation.

Confocal microscopy images for Figure 3D are provided. These make the localization much clearer.

Minor:

1) Figure 1C – Could you elaborate on how the schematic was generated based on the limited sequence similarity between hNPC1 and PfNCR1? Was this achieved via visual association?

The model was generated by visual examination of the hNCR1 structure, aided by the alignment of hNCR1 aa 580-794 and aa 1083-1253 with PfNCR1 aa 439-662 and aa 1304-1468, and aided by a partial model of C-terminal residues generated by Robetta. These details have been added to the legend of Figure 1.

2) Figure 2—figure supplement 1A – A schematic of the plasmid, the wild type locus and the subsequent recombinant locus would be more informative when interpreting the gel.

A schematic of the CRISPR/Cas9 modification is provided in Figure 2—figure supplement 1A.

3) Figure 2A – The legend says that the harvested parasites were trophozoite stage yet the text in subsection "PfNCR1 is Important for Asexual Parasite Viability and is Targeted by Antimalarial Compounds" of the Results section says they were highly synchronized young rings. Please clarify.

aTc was removed from young rings and parasites were harvested 20 hours later at the trophozoite stage. This has been clarified in the text.

4) Figure 2C – Is there any obvious explanation as to why the complemented strain proliferates less well than the PfNCR1apt with aTc, especially since the legend mentions that the rescue was done using a stably expressed wt PfNCR1 strain? Also, please report the missing R2 in the legend part C for "+aTc".

There is a 2x difference in growth over 2 weeks. We would not claim a significant growth difference without rigorous competition assays, but there could be a minor effect arising from differences in the sites of transposon integration.

The R2 for the rescue experiment +aTc has been added in the figure legend.

5) Figure 2 D-H – A key beside the panels would be helpful.

A key has been provided.

6) The different subpanels of Figure 4 B-D are mislabeled in the figure legend.

This has been corrected.

Reviewer #2:

[…] One concern is that straightforward experiments like FACS-based parasite growth assays (Figure 1 D-F, Figure 2 D,F-H) and measurements of GFP release (Figure 4 C-D) were performed fewer than three times, with data from a single experiment shown. It is not stated how many times the Na+ experiment shown in Figure 4F, or the growth assays shown in Figure 1—figure supplement 2 and Figure 4—figure supplement 1C, were performed. Experiments such as these should be performed at least three times and averaged data should be shown or averaged IC50/EC50/rate values provided. The low number of biological replicates means that statistical comparisons cannot be (and were not) performed for these data. Very few of the findings in this study (only the data in Figure 7 C,E) are verified as being statistically significant. The authors state that the PfNCR1 K/D parasites are 'minimally hypersensitive' to KAE609. This statement is not justified based on a subtle difference shown in a single experiment.

In Figure 1, experiments were done at least twice with two different clones, which is essentially biological quadruplicates.

The experiments of Figure 2F-H were only done twice, but they are confirmatory of the western blot data and the 3 compounds and knockdown that all hit the same target are confirmatory of each other.

Figure 4C and D were each done twice, but each recapitulates the results of 4B (done three times) and is concordant with multiple western blots.

Figure 4F has now been repeated a third time.

Regarding KAE609 – our phrasing was not very clear. We do not see hypersensitivity to KAE609 under PfNCR1 knockdown. This experiment has also been repeated (N=3).

Tables with number of repetitions and errors are in Figure 1—source data 1-2, Figure 2—source data 1, and Figure 4—source data 1.

The experiment in Figure 8 is technically very demanding. It was done twice in triplicate and, again, the three compounds gave quite similar profiles.

1) It is not clear how the experiments shown in Figure 2 B and C were performed or how the cumulative parasitemia was calculated. What was the starting parasitemia? Were the cultures diluted and supplemented with uninfected RBCs when required?

This has been clarified in the figure legend. Cultures were seeded at 1% parasitemia, and subjected to daily medium changes, and/or dilutions with uninfected RBCs. Cumulative parasitemias were calculated by multiplying with dilution factors.

2) Figure 7B and 7E – it would be good to see a few representative images for each treatment rather than just one so that readers can understand what was categorised as 'diffuse' and what was categorised as 'puncta'.

Additional images are provided in Figure 7—figure supplement 2.

3) It is not clear what the authors mean when they say that the Na+ measurements were calibrated 'using an average from 3 independent calibration curves for SBFI'. Do they mean that three sets of calibrations were performed within each experiment? Or were calibration curves obtained in three initial experiments used to calibrate data obtained in subsequent experiments? Given that the precise cell number and cell age distribution (as well as other factors) will affect the fluorescence ratio obtained in a particular experiment, it would not be appropriate to apply calibration data that were obtained in a different experiment.

Figure 4F has been updated and the figure legend has been clarified. An average of three calibration curves was used. Since we report ratiometric values rather than absolute numbers, differences in cell numbers and cell age distributions do not affect the results. Furthermore, the experiment was done with synchronized trophozoites.

4) Can the authors comment (in the manuscript) on how the resistance levels of the transfectant lines compare to the resistance levels of the compound-selected parasites?

Resistance of transfected lines was slightly lower (3-20 fold) than resistance of selected lines (5-50 fold). Most likely, this is due to amplification of pfncr1 in the selections, as described in reference 12.

5) Can the authors explain (in the manuscript) the rationale for engineering only one of the two mutations selected for by MMV028038 and MMV019662?

Only one mutation per compound was introduced because the goal of the study was to establish that PfNCR1 is targeted by the compounds, rather than to investigate in detail the role of each mutation. N-terminal mutations are more difficult to engineer using the allelic replacement approach.

6) Can the authors comment (in the manuscript) on whether their inability to knock out pfncr1 was consistent with the results obtained in the mutagenesis study by Zhang et al. (Science)?

Essentiality of Plasmodium ncr1 is confirmed by Zhang et al. and by Bushell et al. (refs. 17 and 18). This has been added to the text.

7) Is it surprising that the PfNCR1 knock-down parasites grew as well as they did? Have the authors attempted to quantify how much PfNCR1 expression still occurs in the absence of aTc?

The knockdown is good (no HA signal in immunoblot, Figure 2A), but may not be enough for a larger phenotype.

8) Figure 1 title needs correcting: 'Mutations in PfNCR1 confer resistance mutations…'

Has been corrected.

9) Figure 1 legend needs correcting: 'resistant mutations'

Has been corrected.

10) Figure 4 legend needs correcting: 'Treated parasites were washed out…'

Has been corrected.

11) Some of the panel letters referred to in the Figure 4 legend are not used in the correct place.

Has been corrected.

12) What does 'SP' refer to in Figure 3? Would 'PV' be more appropriate?

SP refers to the sera5 signal peptide. This has been clarified in the figure legend.

13) Figure 6 – can HA on the figure be replaced with PfNCR1-HA?

Repetitions have been done and statistical info has been added where appropriate.

There was a lack of statistical information because many experiments were not performed enough times.

Reviewer #3:

[…] The authors suggest that PfNCR1 is essential, serves a role in cholesterol export and localizes to the parasite plasma membrane, in contrast to a lysosomal localization for the human ortholog.

1) Localization of the putative transporter: The authors show that the GFP-tagged PfNCR1 produces a fluorescence signal around the intracellular parasite (Figure 3A). Immuno-EM using an anti-GFP antibody supports this with gold-dot labeling of either the parasite plasma membrane (PPM) or the PVM; as immuno-EM could not distinguish between the PPM and PVM, they used an interesting split-GFP strategy with expression of soluble GFP1-10 and a short GFP11 tag at the C-terminus of PfNCR1. When GFP1-10 was targeted to the parasite cytosol, they observed a diffuse fluorescence signal in the parasite cytosol (Figure 3D); when GFP1-10 is targeted to the lumen of the PV, no signal was observed. They interpret this as supporting a PPM localization with the C-terminus projecting into the parasite cytoplasm. This approach, though creative and well-executed, raises two concerns.

a) The results equally well support a PVM localization with the protein C-terminus projecting into host cytosol. In this alternate model, the signal observed with GFP1-10 in parasite cytosol would represent protein in transit from the parasite ER and exported via vesicular trafficking. Although it is not clear how parasite-derived membrane proteins reach the PVM, export from the PPM on exocytic vesicles and subsequent fusion with the PVM is a favorite model of most workers. Because the GFP11 tag would be intravesicular during this transit and then exposed to host cytosol after insertion, a fluorescence signal with GFP1-10 in the PV lumen would not be expected. Thus, the split-GFP strategy used cannot unambiguously distinguish between PPM and PVM localizations. The authors' statement "our model suggests that the relative orientation of the cytosolic regions in these two distantly related proteins is conserved" applies equally well to both the PPM and PVM models, and so does not help resolve. The authors should consider indirect immunofluorescence after erythrocyte membrane permeabilization with tetanolysin to explore a PVM localization, as has been used by other workers (JBC 278:48413, 2003); while a positive result would conclusively support a PVM localization, a negative result would warrant further experimentation.

We appreciate that interpretation of the split GFP images is difficult due to the very weak signal. Additional live GFP, confocal images have been collected on the split GFP parasites (Figure 3D) and confirm PfNCR1 localization at the PPM with the C-terminus exposed to the parasite cytosol.

b) The fluorescence signals shown in Figure 3A (full-length GFP tag on PfNCR1) and Figure 3D (short GFP11 tag on PfNCR1) appear to be noticeably different from one another, with a rim pattern for the full-length GFP tag and a more diffuse cytoplasmic pattern for the short GFP11 tag. This raises the possibility that a large, full-length GFP tag may cause PfNCR1 mis-trafficking to the PPM/PVM. Did the authors attempt IFA with anti-HA and the PfNCR1-apt parasite, which has an acceptably small epitope tag? This reviewer feels this is necessary, in part because the PPM localization contrasts with the more conventional localization of NCR1 to the lysosome in other organisms; the abnormal DV phenotype in the PfNCR1 knockdown could also suggest that the wild-type protein localizes to the DV (the parasite lysosome-equivalent).

It is unlikely that the GFP-tag causes mis-trafficking as improper function of PfNCR1 is expected to give a severe growth defect (as we have shown with the PfNCR1 knockdown). We have taken additional immune electron micrographs, staining for the C-terminal, single HA epitope present in PfNCR1apt parasites (Figure 3—figure supplement 1). The anti-HA micrographs confirm localization at the parasite surface.

2) Presumed transport activity: The authors name the putative transporter NCR1 based on weak homology to the human NCR1 and orthologs in Saccharomyces and Toxoplasma; I would caution against assigning a name and role based on computational analysis alone. A role in cholesterol transport for ScNCR1 and TgNCR1 were supported by complementation experiments in mammalian cells lacking NPC1. The authors present an increased saponin sensitivity of the parasite upon PfNCR1 knockdown or inhibitor treatment as evidence for cholesterol transport, but they made the same observations in PfATP4 studies in a prior publication. Why didn't they propose a role in cholesterol transport for that transporter? A more cautious view might be that increased saponin sensitivity is a nonspecific parasite response to induced defects at the PPM. Complementation experiments such as performed for ScNCR1 and TgNCR1 appear to be critical for supporting their model. Control knockdowns followed by saponin-sensitivity experiments for other membrane proteins at the PPM may also help to exclude a nonspecific parasite response.

The reviewer’s point is well taken. We assume that the PfNCR1 K/D (or compound treatment) phenotype is due to a defect in function as lipid transporter based on homology. There are multiple elements conserved between hNPC1 and the TgNCR1, and each is found in PfNCR1. We interpret the complementation of ScNCR1 and TgNCR1 to mean that the NCR1 homologs can, when overexpressed, recognize and get enough cholesterol out to prevent toxic accumulation. This does not mean that cholesterol is the natural substrate and for the toxo protein, the data suggest it is not. We would argue that the protein is a Niemann-Pick C1 homolog, hence the Niemann-Pick C1-related protein designation. Proof that PfNCR1 is an actual lipid transporter will await in vitro reconstitution experiments. A discussion of the uncertainties in functional assignment has been added to the Discussion.

3) Essentiality: The authors emphasize that, in contrast to presumed orthologs in other organisms, PfNCR1 is essential. This seems to be based on negative results with attempted CRISPR knockout and on a delayed slow growth phenotype with conditional knockdown using the TetR-DOZI/aptamer system. Remarkably, the delayed slow growth phenotype appears to take ~ 10 days (about 5 asexual cycles) to be manifest clearly as no statistics on differences in growth rate for plus and minus aTC are presented. While the continued slow growth could reflect low level expression of the transporter (at levels below detection in immunoblotting, Figure 2A), a more cautious view might be that the transporter is not strictly essential. This would be more in line with NCR1 in other organisms.

a) A control transfection with the CRISPR guide used for knockout would confirm that the sgRNA used is effective and that target site is accessible.

b) Does continued growth without aTC lead to adaptation and more rapid expansion?

c) Other conditional knockout strategies such as diCre-mediated disruption of the gene (Scientific Reports 7:3881, 2017) could be used to implicate essentiality more conclusively because that approach would not allow continued low-level expression of NCR1 upon rapamycin-induced disruption of the gene.

We believe it is likely that PfNCR1 performs an essential function based on the observation that the K/D slows parasite replication and that the three compounds which kill parasites are on target. Whole genome disruption analyses are consistent with this, and now have been cited in the text.

Continued growth without aTc results in loss of aptamers eliminating the knockdown effect.

4) Less important points:

a) Figure 2D, showing a dose-effect for aTC and sensitivity to inhibitor was only done once. I do not consider it appropriate to include data from an experiment performed only once. Do the selected aTC concentrations correspond to measurable differences in PfNCR1 expression, as detected by immunoblotting?

It had been done multiple times in different forms, but the exact experiment has now been done three times. Yes, aTc concentrations correspond to changes in PfNCR1 expression.

b) Figures 1D-F and 2E-H are critical for linking the mutations in PfNCR1 to action of the three MMV drug leads. Each of these panels shows a < 10-fold change in drug IC50 when the transporter is mutated or knocked down. For each, a single experiment with three replicates is shown with the legends stating that nearly all were only done twice. As variation in parasite growth inhibition experiments is greater between trials (often 2-3 fold in most workers hands) than within a trial, a statistical analysis taking at least 3 independent trials seems necessary. (To my eye, Figures 1D and 1E appear to show only a 2-3 fold difference between WT and mutant.)

Number of replicates and changes in EC50s for experiments in Figures 1D-F and 2E-H are reported as supplemental tables.

c) How many times were the drug selections to identify PfNCR1 performed? What other genes were found in the genome sequencing? Prior studies, e.g. those implicating PfATP4, were more transparent.

All drug selections were performed at least in triplicate. Selection protocols and complete sequencing of resistant clones has been reported in reference 12. In addition to the resistance-conferring SNPs, amplification of the pfncr1 locus was observed.

d) Figure 1—figure supplement 1B, Southern blot. Each mutant lane shows two bands at 1.3 and 1.1 kB for the retained plasmid and the desired integrant. Shouldn't there also be a higher MW band for the displaced WT locus, as shown in the panel A? Because the mutations shown through DNA sequencing in panel C could derive from the retained plasmid, inclusion of PCR checks for integration and possible residual WT locus in the cloned parasites would help convince careful readers.

Diagnostic PCRs in Figure 1—figure supplement 1C and Figure 1—figure supplements 2A, B illustrate that the sequencing data derive from integrated mutations. The reviewer is correct that a second, higher MW band (corresponding to the 2nd, promoter-less copy) should be present in the Southern blot of the integrants used in Figure 1. The 2nd copy looped out in some of our clones. In these clones, we have shown that the mutation is present at the endogenous expression site. We also obtained clones in which the promoter-less copy is present and show in Figure 1—figure supplement 1D that clones with or without the 2nd copy are resistant. Importantly, the wild-type copy is disrupted in all allelic replacement clones as illustrated in Figure 1—figure supplement 1B, C.

Almost no statistical analyses are provided, concerning especially for Figure 1D-F, Figure 2D-H, and Figure 8, where experiments were typically done only once or twice. Each panel shows only the results from a representative experiment, so readers are inclined to believe the better of two trials is shown. Additional trials and statistical analyses are needed to support several conclusions critical to the story.

Experiments have been repeated and statistical tables are provided for Figures 1, 2, and 4.

[Editors' note: further revisions were suggested, as described below.]

Reviewer #2:

[…] Minor Comments:

Information on how many experiments were performed is missing in the legend for Figure 1—figure supplement 1 D and Figure 1—figure supplement 3.

The number of replicates in Figure 1—figure supplement 1D and Figure 1—figure supplement 3 was 2. This information has been added to the figure legends.

Additional details would be useful in the source data files. What does 'replicates' mean and are they technical replicates, biological replicates or both? Have data from different clones been averaged together?

T-tests have been added for data in the source data files. Yes, data from different clones have been averaged together in the source data files.

"One representative experiment with biological triplicates is shown". The term "biological triplicates" is confusing in this context. If replicates were included within an experiment, they should be referred to as 'technical replicates'. 'Biological replicates' implies independent repeats of experiments.

This sentence refers to Figures 2B and 2C. We corrected the statement in the figure legend to now says “One representative experiment with technical triplicates is shown.”

Figure legends should not only state how many times an experiment was performed, but should also specify what the data shown represent. For example Figure 4B-D – it is stated that the experiments were performed twice or three times. However it is not stated whether the data shown in the Figures are from single representative experiments or are the averaged data from multiple experiments. The authors should also review their y axes in these Figures – they imply that the maximum intracellular GFP was 1%.

Figure 4 panels are from a single representative experiment with technical duplicates. This is now stated in the text. The y axes have been changed.

Additional data files and statistical comments:

Statistical analyses (e.g. ANOVAs to determine whether IC50 values for compounds vary between mutants and their parent) have still not been performed. Very little statistical information is supplied in the manuscript.

Statistical analyses are now included source data files.

Reviewer #3:

The four main questions raised in prior reviews related to localisation of PfNCR1, the protein's essentiality, PfNCR1 role, and statistical analyses of significance in independent experimental trials.

Unfortunately, all these questions remain inadequately addressed.

1) Statistical significance analyses. The authors' rebuttal states that they performed the experiments many times, including in separate labs, but because of protocol differences that they could not be combined and presented together. Another argument provided is that some experiments are only confirmatory of other findings and were only done twice for this reason. A third argument was that some experiments were too "laborious.…[and] just backed up other data". The authors also state "experiments were done at least twice with two different clones, which is essentially biological quadruplicates", which most reviewers will agree is not up to standard.

Some experiments appear to have been done additional times now to reach an n of 3 but most of those figures still appear to show the results from a single experiment with error bars of technical replicates from that trial. These arguments are considered untenable by most journals now, as defined by a 2014 NIH joint workshop with Nature publishing group and Science (see https://www.nih.gov/research-training/rigor-reproducibility/principles-guidelines-reporting-preclinical-research for specifics; see also the PNAS author guidelines which states "Statistical analyses should be done on all available data and not just on data from a "representative experiment." Statistics and error bars should only be shown for independent experiments and not for replicates within a single experiment").

We take issue with this criticism. Two replicates with two clones (in technical triplicate) and a wealth of other data is arguably better than triplicates consisting of a single clone. T-tests have been done on the data in all experiments in the source data.

For this reviewer, the most important problem is that key figures still show results from a single experiment with error bars of technical replicates (Figure 1 D-F, Figure 2B-H, Figure 4B-D), preventing readers from evaluating statistical significance between mutants and parental lines; t tests with P values to attest to significant differences are still not provided in the new statistical Tables. For the growth inhibition studies in Figures 1 and 2, can the authors perform a Student's t test comparing mutant vs. wild-type IC50 values from three independent experiments and provide a P value for each reported difference? It is not adequate to state "The error bars (S.D.) for a representative experiment (biological triplicates) are shown and are very small" because these "very small" error bars only inform on technical issues such as pipetting of cells and reagents.

T-tests have been done on the data in all experiments in the source data.

2) PfNCR1 localisation. The split-GFP reporter assay, though creative and challenging to create in cultured parasites, does not unambiguously localize PfNCR1 to the PPM as opposed to the PVM. This is not because of a "very weak signal" as the authors' rebuttal states, but because the split-GFP approach is simply not empowered to address this question. As described in my prior review, a protein at the PVM with C-terminus facing erythrocyte cytosol will produce the same pattern of GFP fluorescence as one at the PPM with C-terminus facing parasite cytosol: both localisations will yield no signal with GFP1 10 targeted to the vacuolar space between these membranes; a "very weak signal" as the authors acknowledge reduces the sensitivity for detecting the other two orientations as well (PVM or PPM proteins with the C-termini facing vacuolar space). The question should either be conclusively addressed or the authors may want to interpret more cautiously.

The weak signal made it look more diffuse. The rim pattern of the new confocal images suggests that the GFP11 on PfNCR1 is not contained in vesicles in the cytoplasm. We have added the following sentence in the text: “We cannot rule out the possibility that the cytoplasmic GFP 1-10 signal is due to vesicles at the PPM in transit to the PVM.”

3) Essentiality of PfNCR1. The authors continue to present PfNCR1 as essential based on failed CRIPSR knockout, dangerous as there are examples where this has yielded incorrect interpretation (e.g. JBC 286:41312 from some of the present authors, later shown to be dispensable PNAS 112:10216 using P. berghei). Rather than adding new data, the authors cite the Zhang et al. genome-wide knockout study as supporting essentiality. Since the authors show expansion of a knockdown line with undetectable PfNCR1 expression and orthologs in other organisms have been proven nonessential, they may again want to interpret more cautiously.

Our logic is: 1) the drugs kill parasites; 2) K/D phenocopies drug treatment; 3) K/D is hypersensitive to drugs. We believe that these observations strongly suggest that PfNCR1 is essential. In deference to the reviewer we softened the wording in the Discussion. Also, it should be noted that essentialities of several genes are known to vary among different species (as seen in the instance cited by the reviewer; even in this instance, there was a clear growth defect in P. berghei for the ATP synthase subunit knockout, something that could not be achieved for P. falciparum, which we have now attempted numerous times including with the CRISPR technology).

4) Presumed role of PfNCR1. The paper lacks substantive data regarding the proposed role of PfNCR1 in cholesterol or lipid transport. The saponin-sensitivity experiments are interesting, but very similar results are seen with PfATP4 knockdown or block. The author's response "The reviewer's point is well taken" is not matched by new experimentation; the suggestion for complementation studies as used for ScNCR1 and TgNCR1 was dismissed as potentially misleading. The authors rely entirely on computational analysis to assign a role in lipid transport for PfNCR1 and not for PfATP4. If both the role and essentiality were established without the present studies (by computational analysis and the Zhang study), this paper may not meet eLife novelty standards.

We maintain that complementation studies will not answer the question. We have stated in the Discussion that “Proof of a direct role of PfNCR1 as a lipid transporter awaits functional analysis.”

Minor points:

The anti-HA immuno-EM is good, but IFA as requested in the prior review will be more sensitive for excluding a DV localisation, which remains likely given where NCR1 orthologs localise and the observed changes in DV phenotypes. The interpretation that PfNCR1 changes PPM lipid composition so drastically that endosome and eventually the DV have altered properties as a byproduct is a complicated model that reads as too speculative in the absence of biochemical studies.

We believe cryoEM is better suited to address the localization because of better access to the DV, as long as there is good signal. Antibody access to the DV can be an issue with IFA.

Loop-out of the 2nd promoter-less copy, as invoked to account for lack of an expected second band in the Southern blot, is surprising and may be unprecedented in P. falciparum as this would require non-homologous end-joining machinery.

Integration of multiple concatamerized plasmids is common in Plasmodium. We also observe multiple plasmid copies as is evident on the Southern blot. We believe that the expected promoterless second copy in the mutation integrant parasites used in Figure 1 has looped out via homologous crossover after the BspHI site in the integrated concatamerized plasmid. This mechanism does not require non-homologous end-joining. We have edited the figure legend to better explain this possible mechanism for the looping out.

https://doi.org/10.7554/eLife.40529.032

Article and author information

Author details

  1. Eva S Istvan

    1. Department of Medicine, Division of Infectious Diseases, Washington University School of Medicine, Saint Louis, United States
    2. Department of Molecular Microbiology, Washington University School of Medicine, Saint Louis, United States
    Contribution
    Conceptualization, Data curation, Formal analysis, Validation, Investigation, Visualization, Methodology, Writing—original draft, Writing—review and editing
    Contributed equally with
    Sudipta Das
    Competing interests
    No competing interests declared
    ORCID icon "This ORCID iD identifies the author of this article:" 0000-0002-8666-3248
  2. Sudipta Das

    Department of Microbiology and Immunology, Center for Molecular Parasitology, Drexel University College of Medicine, Philadelphia, United States
    Contribution
    Conceptualization, Data curation, Formal analysis, Validation, Investigation, Visualization, Methodology, Writing—original draft, Writing—review and editing
    Contributed equally with
    Eva S Istvan
    Competing interests
    No competing interests declared
  3. Suyash Bhatnagar

    Department of Microbiology and Immunology, Center for Molecular Parasitology, Drexel University College of Medicine, Philadelphia, United States
    Contribution
    Data curation, Formal analysis, Validation, Visualization, Methodology
    Competing interests
    No competing interests declared
  4. Josh R Beck

    1. Department of Medicine, Division of Infectious Diseases, Washington University School of Medicine, Saint Louis, United States
    2. Department of Molecular Microbiology, Washington University School of Medicine, Saint Louis, United States
    Present address
    Department of Biomedical Science, Iowa State University, Ames, United States
    Contribution
    Conceptualization, Resources, Methodology, Writing—review and editing
    Competing interests
    No competing interests declared
    ORCID icon "This ORCID iD identifies the author of this article:" 0000-0001-6196-8689
  5. Edward Owen

    1. Department of Biochemistry and Molecular Biology, Pennsylvania State University, University Park, United States
    2. Huck Center for Malaria Research, Pennsylvania State University, University Park, United States
    3. Department of Chemistry, Pennsylvania State University, University Park, United States
    Contribution
    Data curation, Formal analysis, Investigation, Visualization
    Competing interests
    No competing interests declared
  6. Manuel Llinas

    1. Department of Biochemistry and Molecular Biology, Pennsylvania State University, University Park, United States
    2. Huck Center for Malaria Research, Pennsylvania State University, University Park, United States
    3. Department of Chemistry, Pennsylvania State University, University Park, United States
    Contribution
    Resources, Data curation, Formal analysis, Investigation, Writing—review and editing
    Competing interests
    No competing interests declared
    ORCID icon "This ORCID iD identifies the author of this article:" 0000-0002-6173-5882
  7. Suresh M Ganesan

    Department of Biological Engineering, Massachusetts Institute of Technology, Cambridge, United States
    Contribution
    Resources, Formal analysis, Investigation, Writing—review and editing
    Competing interests
    No competing interests declared
  8. Jacquin C Niles

    Department of Biological Engineering, Massachusetts Institute of Technology, Cambridge, United States
    Contribution
    Resources, Formal analysis, Supervision, Funding acquisition, Writing—review and editing
    Competing interests
    No competing interests declared
  9. Elizabeth Winzeler

    Department of Pediatrics, University of California San Diego School of Medicine, La Jolla, United States
    Contribution
    Resources, Supervision, Funding acquisition, Project administration, Writing—review and editing
    Competing interests
    No competing interests declared
    ORCID icon "This ORCID iD identifies the author of this article:" 0000-0002-4049-2113
  10. Akhil B Vaidya

    Department of Microbiology and Immunology, Center for Molecular Parasitology, Drexel University College of Medicine, Philadelphia, United States
    Contribution
    Conceptualization, Resources, Supervision, Funding acquisition, Validation, Investigation, Methodology, Writing—original draft, Project administration, Writing—review and editing
    For correspondence
    av27@drexel.edu
    Competing interests
    No competing interests declared
    ORCID icon "This ORCID iD identifies the author of this article:" 0000-0003-1063-5571
  11. Daniel E Goldberg

    1. Department of Medicine, Division of Infectious Diseases, Washington University School of Medicine, Saint Louis, United States
    2. Department of Molecular Microbiology, Washington University School of Medicine, Saint Louis, United States
    Contribution
    Conceptualization, Resources, Supervision, Funding acquisition, Validation, Investigation, Methodology, Writing—original draft, Project administration, Writing—review and editing
    For correspondence
    dgoldberg@wustl.edu
    Competing interests
    No competing interests declared
    ORCID icon "This ORCID iD identifies the author of this article:" 0000-0003-3529-8399

Funding

Bill and Melinda Gates Foundation (OPP 1054480)

  • Eva Istvan
  • Edward Owen
  • Manuel Llinas
  • Elizabeth Winzeler
  • Daniel E Goldberg

National Institute of Allergy and Infectious Diseases (R01AI132508)

  • Sudipta Das
  • Suyash Bhatnagar
  • Akhil B Vaidya

National Heart, Lung, and Blood Institute (K99/R00 HL133453)

  • Josh R Beck

Bill and Melinda Gates Foundation (OPP1132313)

  • Suresh M Ganesan
  • Jacquin C Niles

National Institutes of Health (1DP2OD007124)

  • Jacquin C Niles

National Institute of Allergy and Infectious Diseases (R01AI098413)

  • Akhil B Vaidya

The funders had no role in study design, data collection and interpretation, or the decision to submit the work for publication.

Acknowledgements

We are thankful to our MalDA Consortium collaborators and DS Ory (WU) for stimulating discussions, AS Nasamu and A Polino for valuable suggestions, B Vaupel for assistance during cloning, W Beatty for electron microscopy, LD Sibley for use of the spinning-disk confocal microscope and M Lee, M Carrasquilla and J Rayner for consulting on the Rh3 gRNA design. This work was supported by Gates Foundation Grants OPP 1054480 (Winzeler, Goldberg, Llinás), OPP1132313 (Niles), and NIH grants R01AI098413 and R01AI132508 (Vaidya); K99/R00 HL133453 (Beck), and 1DP2OD007124 (Niles).

Senior Editor

  1. Anna Akhmanova, Utrecht University, Netherlands

Reviewing Editor

  1. Dominique Soldati-Favre, University of Geneva, Switzerland

Publication history

  1. Received: July 27, 2018
  2. Accepted: February 5, 2019
  3. Version of Record published: March 19, 2019 (version 1)
  4. Version of Record updated: March 21, 2019 (version 2)

Copyright

© 2019, Istvan et al.

This article is distributed under the terms of the Creative Commons Attribution License, which permits unrestricted use and redistribution provided that the original author and source are credited.

Metrics

  • 2,585
    Page views
  • 377
    Downloads
  • 39
    Citations

Article citation count generated by polling the highest count across the following sources: Scopus, Crossref, PubMed Central.

Download links

A two-part list of links to download the article, or parts of the article, in various formats.

Downloads (link to download the article as PDF)

Open citations (links to open the citations from this article in various online reference manager services)

Cite this article (links to download the citations from this article in formats compatible with various reference manager tools)

  1. Eva S Istvan
  2. Sudipta Das
  3. Suyash Bhatnagar
  4. Josh R Beck
  5. Edward Owen
  6. Manuel Llinas
  7. Suresh M Ganesan
  8. Jacquin C Niles
  9. Elizabeth Winzeler
  10. Akhil B Vaidya
  11. Daniel E Goldberg
(2019)
Plasmodium Niemann-Pick type C1-related protein is a druggable target required for parasite membrane homeostasis
eLife 8:e40529.
https://doi.org/10.7554/eLife.40529

Further reading

    1. Microbiology and Infectious Disease
    Daan F van den Berg, Baltus A van der Steen ... Stan JJ Brouns
    Short Report

    tRNAs in bacteriophage genomes are widespread across bacterial host genera, but their exact function has remained unclear for more than 50 years. Several hypotheses have been proposed, and the most widely accepted one is codon compensation, which suggests that phages encode tRNAs that supplement codons that are less frequently used by the host. Here, we combine several observations and propose a new hypothesis that phage-encoded tRNAs counteract the tRNA-depleting strategies of the host using enzymes such as VapC, PrrC, Colicin D, and Colicin E5 to defend from viral infection. Based on mutational patterns of anticodon loops of tRNAs encoded by phages, we predict that these tRNAs are insensitive to host tRNAses. For phage-encoded tRNAs targeted in the anticodon itself, we observe that phages typically avoid encoding these tRNAs. Further supporting the hypothesis that phage tRNAs are selected to be insensitive to host anticodon nucleases. Altogether our results support the hypothesis that phage-encoded tRNAs have evolved to be insensitive to host anticodon nucleases.

    1. Microbiology and Infectious Disease
    Russell P Swift, Rubayet Elahi ... Sean T Prigge
    Research Article Updated

    Iron-sulfur clusters (FeS) are ancient and ubiquitous protein cofactors that play fundamental roles in many aspects of cell biology. These cofactors cannot be scavenged or trafficked within a cell and thus must be synthesized in any subcellular compartment where they are required. We examined the FeS synthesis proteins found in the relict plastid organelle, called the apicoplast, of the human malaria parasite Plasmodium falciparum. Using a chemical bypass method, we deleted four of the FeS pathway proteins involved in sulfur acquisition and cluster assembly and demonstrated that they are all essential for parasite survival. However, the effect that these deletions had on the apicoplast organelle differed. Deletion of the cysteine desulfurase SufS led to disruption of the apicoplast organelle and loss of the organellar genome, whereas the other deletions did not affect organelle maintenance. Ultimately, we discovered that the requirement of SufS for organelle maintenance is not driven by its role in FeS biosynthesis, but rather, by its function in generating sulfur for use by MnmA, a tRNA modifying enzyme that we localized to the apicoplast. Complementation of MnmA and SufS activity with a bacterial MnmA and its cognate cysteine desulfurase strongly suggests that the parasite SufS provides sulfur for both FeS biosynthesis and tRNA modification in the apicoplast. The dual role of parasite SufS is likely to be found in other plastid-containing organisms and highlights the central role of this enzyme in plastid biology.