Offline impact of transcranial focused ultrasound on cortical activation in primates
- University of Oxford, United Kingdom
- John Radcliffe Hospital, University of Oxford, United Kingdom
- Inserm U 1127, CNRS UMR 7225, Sorbonne Université, France
- Inserm, ESPCI Paris, CNRS, PSL Research University, Université Paris Diderot, Sorbonne Paris Cité, France
- Radboud University Nijmegen, The Netherlands
- UMRS 975 INSERM, CNRS 7225, UMPC, France
- Inserm, ESPCI Paris, CNRS, PSL Research University, France
Figures
Figure 1
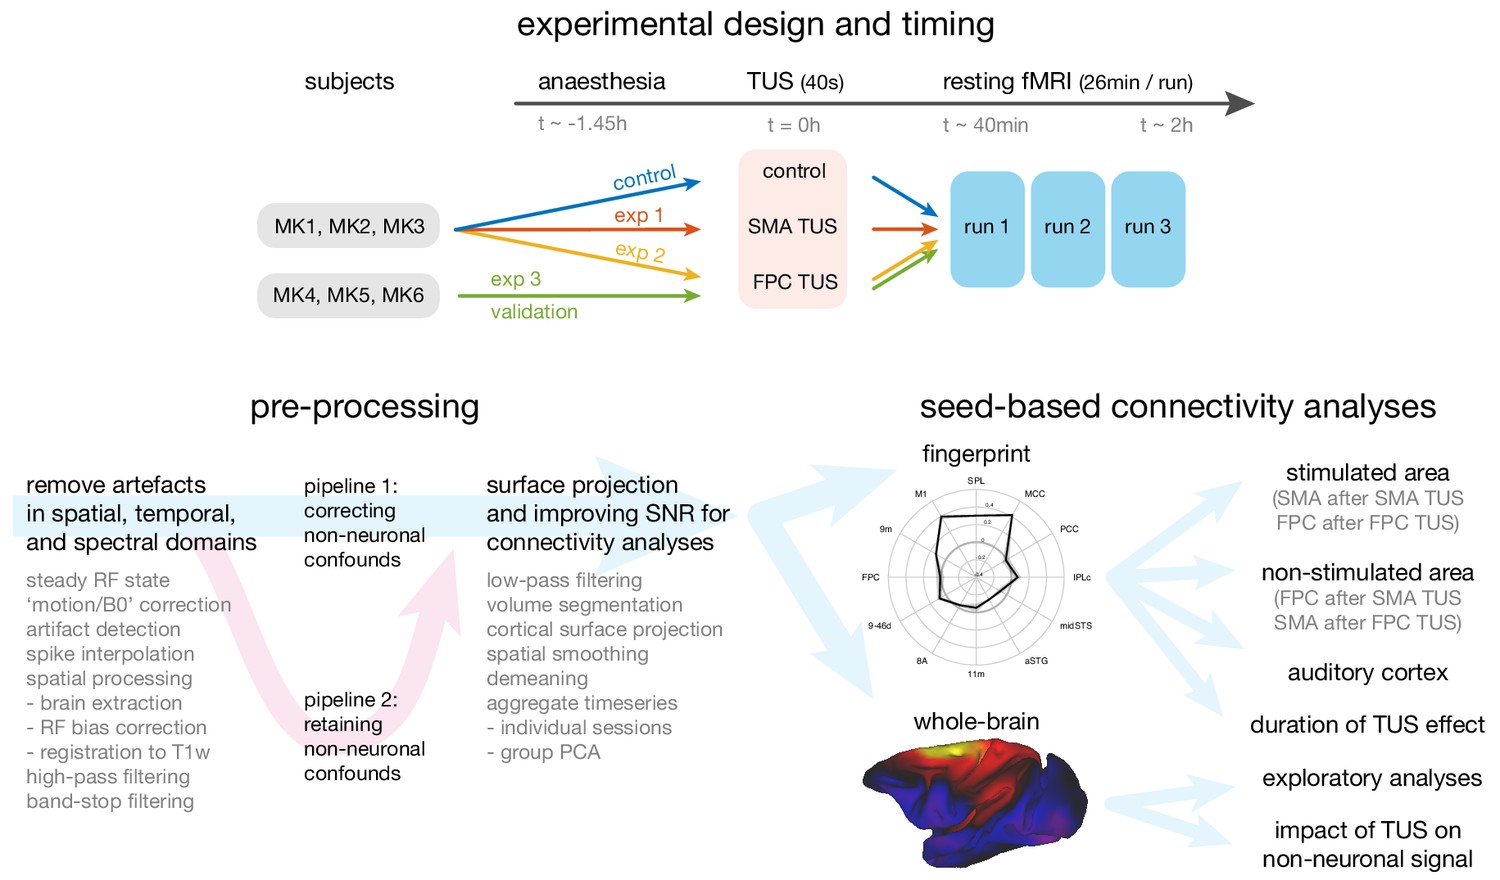
Overview of the experimental design, time-line, pre-processing pipeline, and analysis strategy.
Top panel: The same three macaque monkeys (MK1, MK2, MK3) participated in experiments 1 and 2, and a control experiment conducted in the absence of TUS. Three other monkeys (MK4, MK5, MK6) participated in experiment 3. In all experiments anaesthesia was induced ~1.45 hr before the TUS intervention or no-TUS control. In experiment 1 the 40 s TUS protocol was delivered over the supplementary motor area (SMA), while in experiments 2 and 3, the protocol was targeted at frontal polar cortex (FPC). In all sessions, three consecutive runs of resting fMRI (26 min per run) were acquired starting ~40 min after the TUS or control protocol. Bottom left panel: Data from the resting fMRI runs were pre-processed following a standardized pipeline to address artefacts, improve image quality and signal-to-noise ratio, and prepare for connectivity analyses. By default, non-neuronal confounds were removed from the timeseries, but to allow an analysis of the effect of TUS on non-neuronal signal the data was also processed in parallel in a second pipeline, distinct from the default by omitting the non-neuronal confound regression procedure. Bottom right panel: The effect of TUS on the coupling patterns of the stimulated regions were quantified as ‘connectional fingerprints’ employing pre-defined targets (here illustrated for the SMA in the control state). These fingerprint analyses allowed us to test for the presence and duration of TUS effects in the stimulated areas (SMA after SMA TUS; FPC after FPC TUS), and in control areas, including non-stimulated areas (FPC after SMA TUS; SMA after FPC TUS) and the auditory cortex. Whole brain connectivity maps supported exploratory analyses and an assessment of the impact of TUS on non-neuronal signal (here illustrated for SMA in the control state).
Figure 2
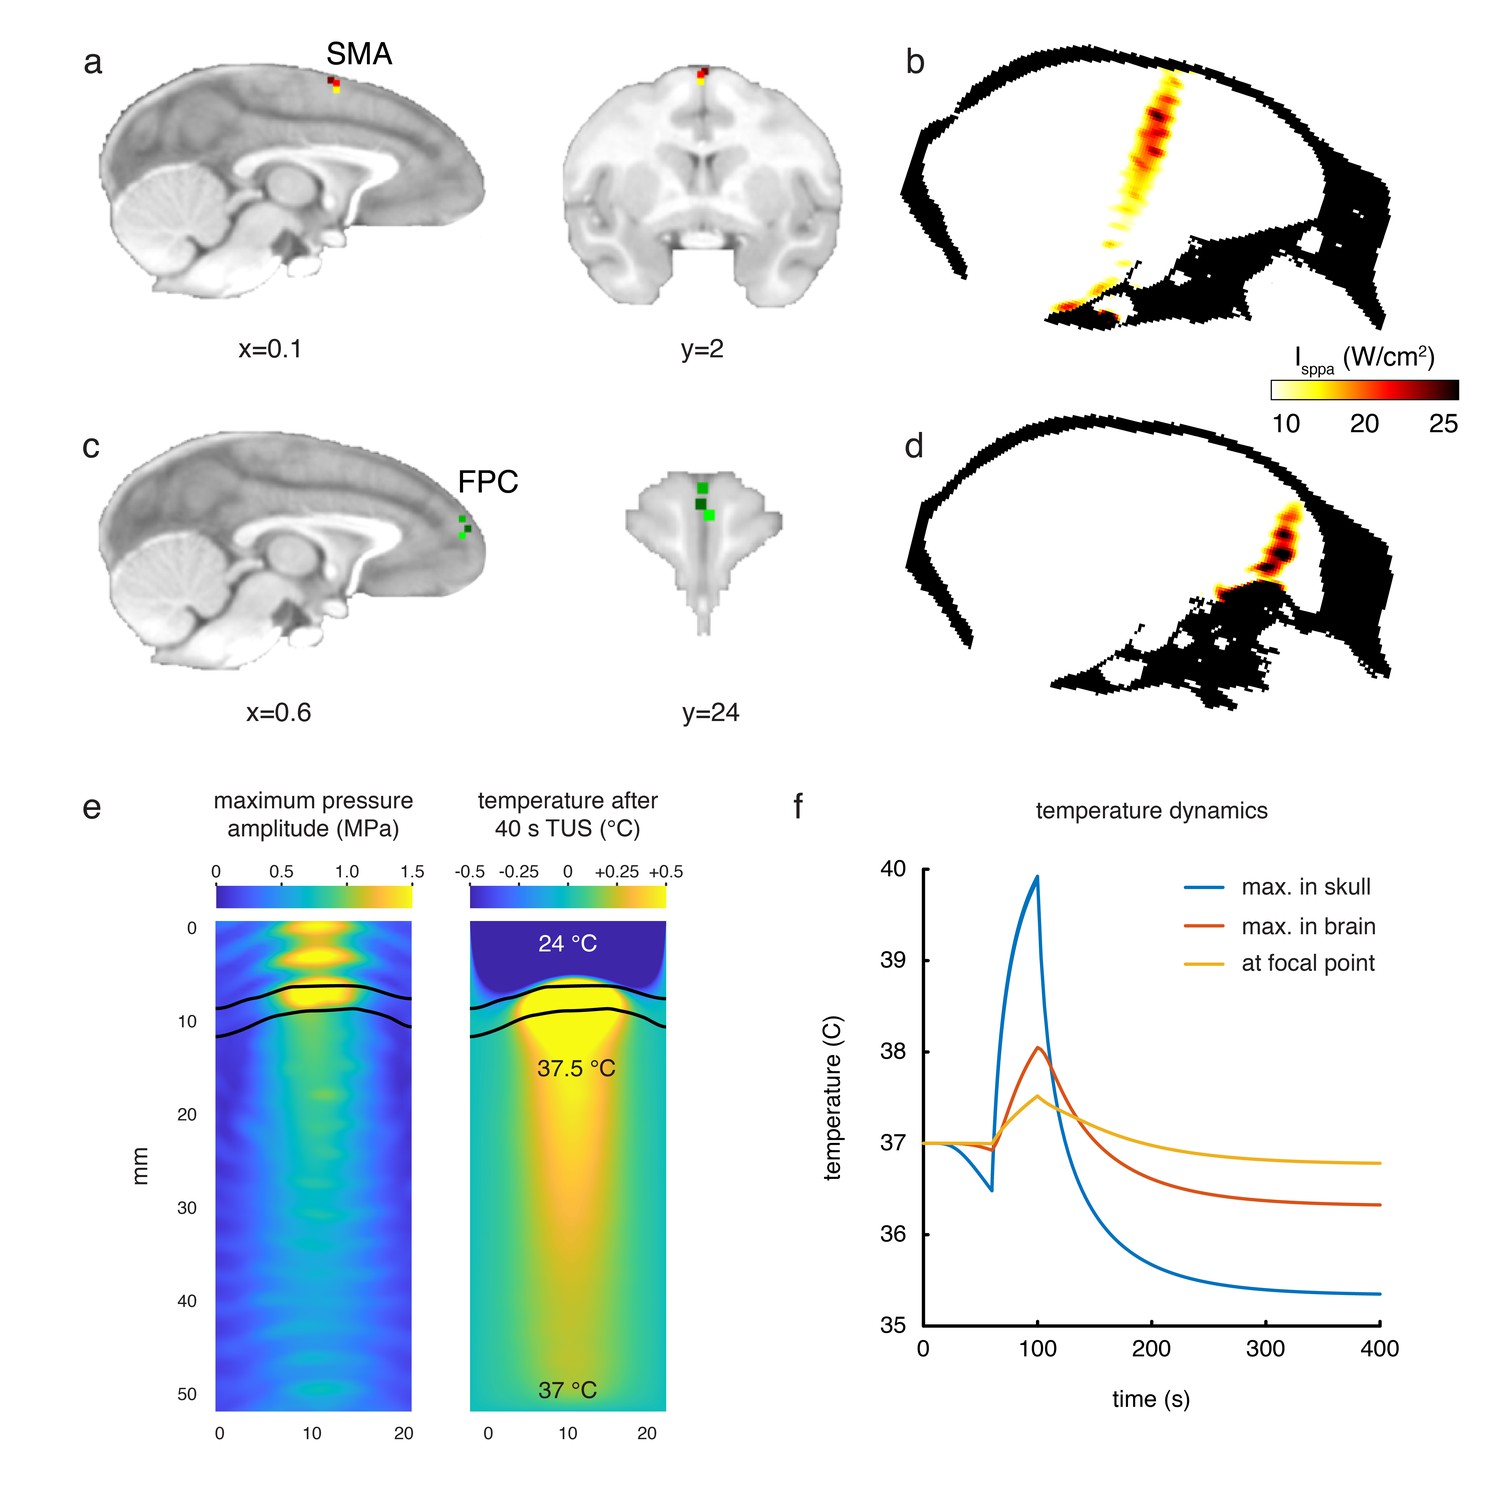
Stimulation targets and thermal modelling.
(a) Stimulation target positions in SMA are shown for each of the three individual animals in three different colours on sagittal and coronal views. (b) Estimates of the focused ultrasound peak intensities and spatial distribution when targeting SMA are derived from numerical simulations using a high-resolution macaque whole-head CT scan, here displayed on a midline sagittal section. (c) FPC targets in three animals are shown on sagittal and coronal sections. (d) Estimated peak intensities and spatial distribution when targeting FPC shown on a sagittal section. (e) Whole-head simulations of the acoustic wave and thermal dynamics provided estimates of the maximum pressure amplitude (left panel) and the temperature after 40 s TUS (right panel). The data depict a cropped plane of the whole-head simulations with the sonic coupling cone at the top and the brain at the bottom; the skull is outlined in black. Pressure and temperature are maximal in the skull, which is more absorbing than soft tissue. (f) Temperature dynamics for the maximum temperature in the skull (blue), maximum temperature in the brain (red) and at the geometrical focal point in the cortex (yellow).
Figure 3 with 1 supplement

Coupling of activity between stimulated areas and the rest of the brain in experiments 1 (SMA) and 2 (FPC).
The left panels show activity coupling between SMA and the rest of the brain in the control state (a), after SMA TUS (b), and after FPC TUS (c). The right panels show activity coupling between FPC and the rest of the brain in the control state (d), after SMA TUS (e), and after FPC TUS (f). Functional connectivity from TUS-targeted regions is therefore summarized in panels (b) and (f) (i.e. SMA connectivity after SMA TUS and FPC connectivity after FPC TUS). Each type of TUS had a relatively selective effect on the stimulated area: SMA coupling was changed by SMA TUS (b) and FPC coupling was changed by FPC TUS (f). Positive correlations are represented in warm colours from red to yellow, negative correlations are represented in cool colours from blue to green. Key regions of change are highlighted by black dashed ovals. TUS target sites are indicated with arrows. Connectivity seed regions are indicated with black asterisks. Key anatomical features are labelled in panel (a): pos, parieto-occipital sulcus; cal, calcarine sulcus; cgs, cingulate sulcus; ps, principal sulcus; as, arcuate sulcus; cs, central sulcus; ips, intraparietal sulcus; sts, superior temporal sulcus; ls, lunate sulcus.
Figure 3—figure supplement 1
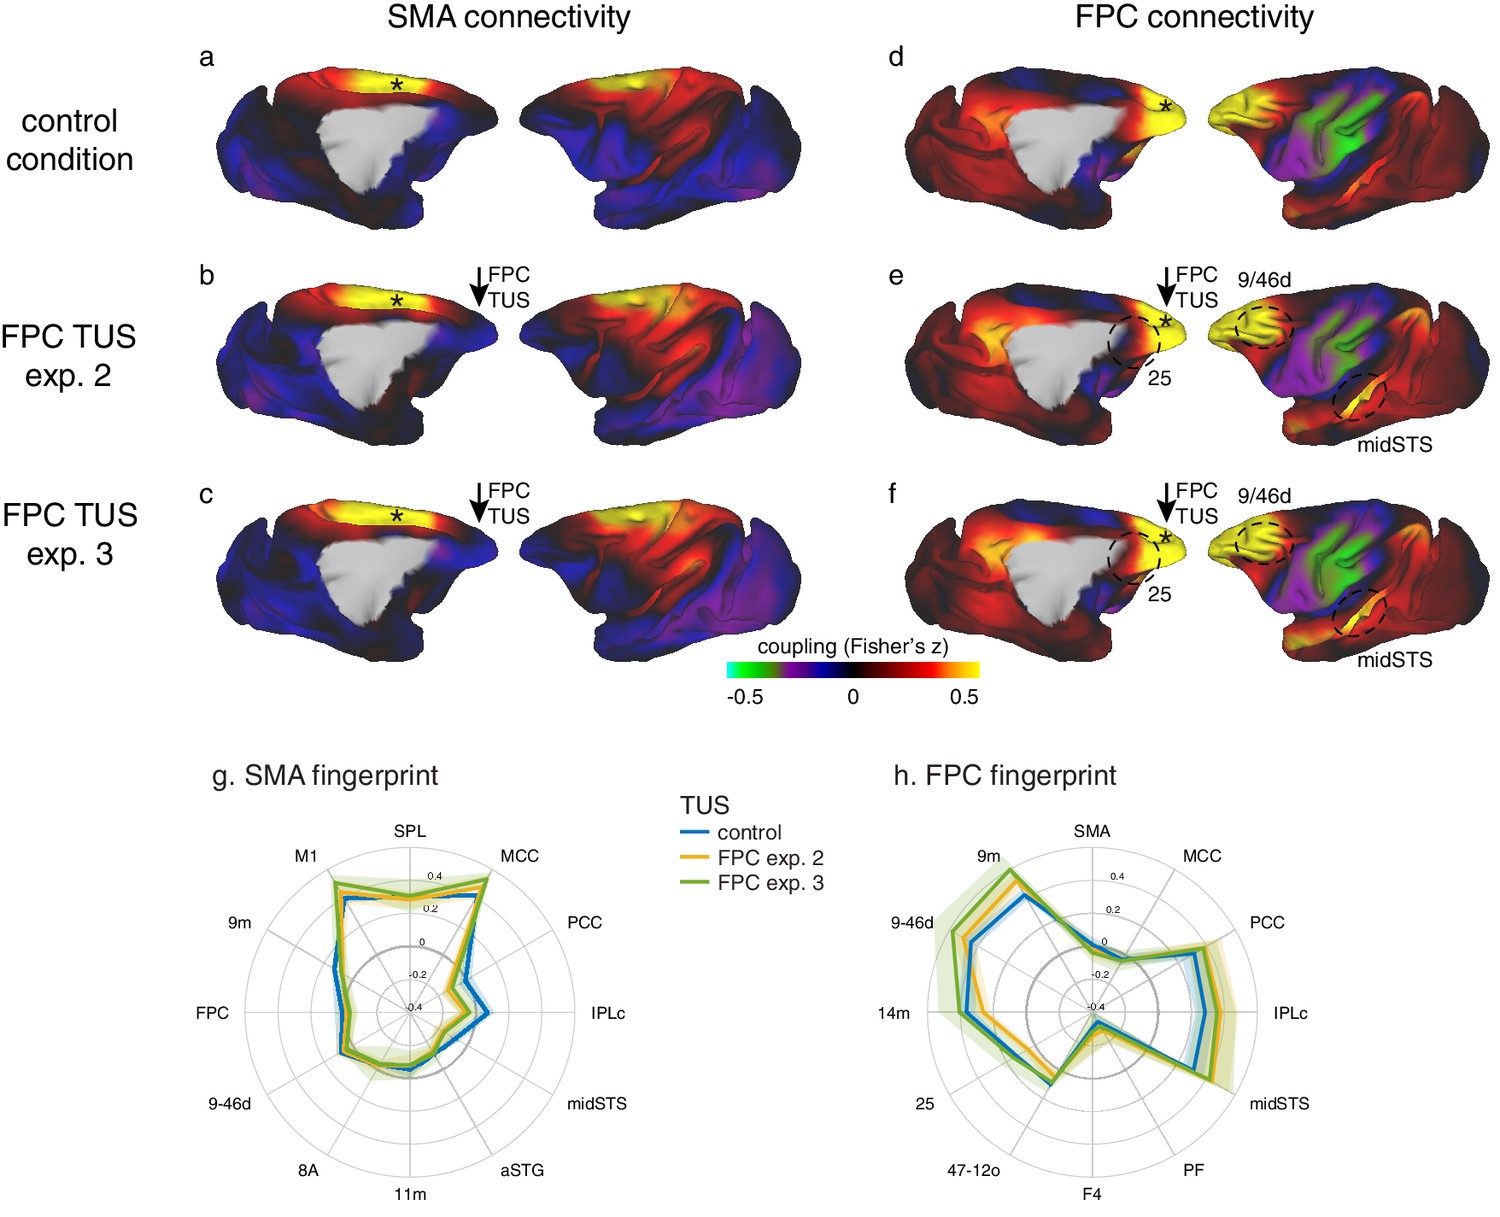
Specific patterns of change in the coupling of activity between stimulated areas and the rest of the brain were replicated in experiments 2 and 3.
Panels on the left show activity coupling between SMA and the rest of the brain in the control state (a), after FPC TUS in experiment 2 (b), and after FPC TUS in experiment 3 (in three new animals) (c). Panels on the right show activity coupling between FPC and the rest of the brain in the control state (d), after FPC TUS in experiment 2 (e), and after FPC TUS in experiment 3 (f). SMA’s connectional fingerprint was largely unaltered after FPC TUS in both experiments 2 and 3 (g) but FPC’s connectivity fingerprint was altered in a similar manner in both experiments 2 and 3 (h). Panels (a, b) and (d, e) are reproduced here from Figure 3 for comparison. All conventions as in Figure 3. Lighter coloured error bands indicate the standard-error of the mean across individual animals.
Figure 4
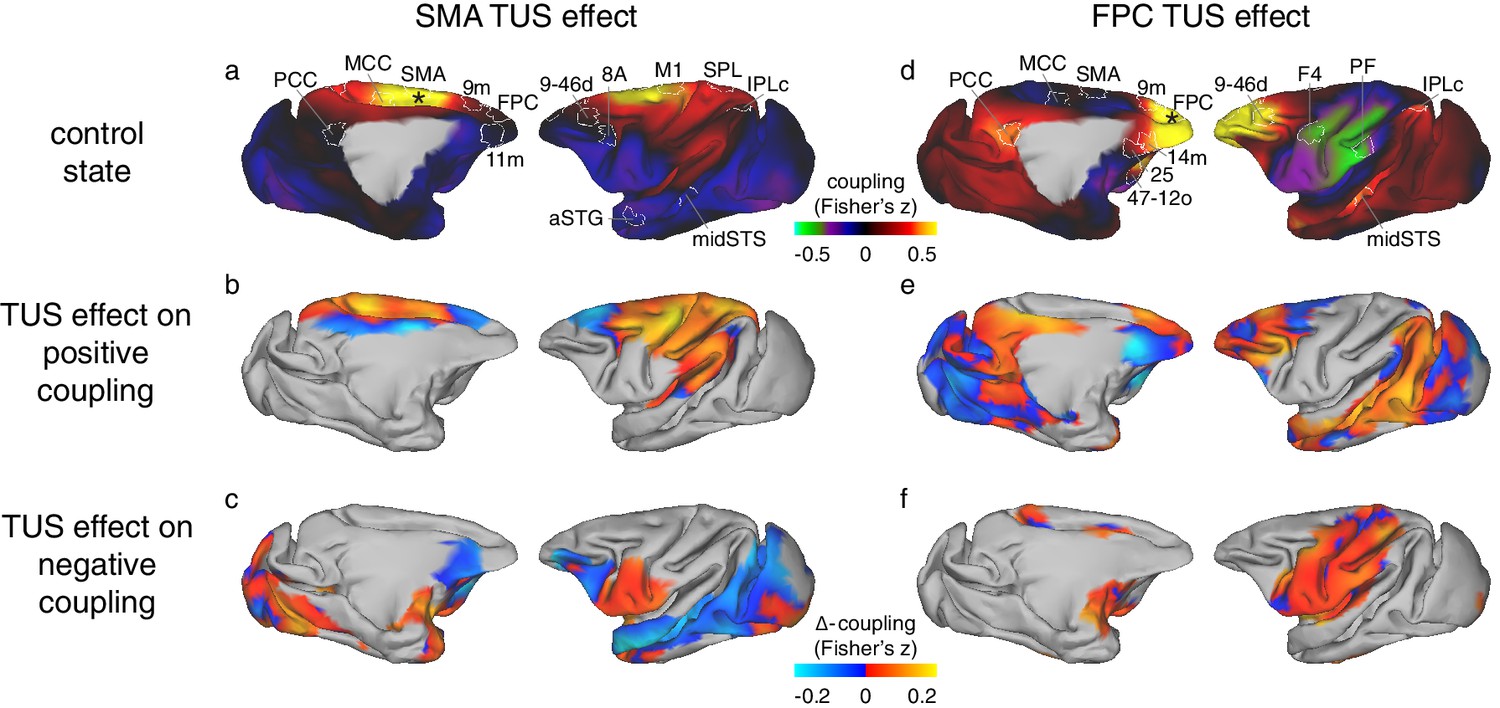
Differential effect of TUS on coupling of activity between stimulated areas and the rest of the brain in experiments 1 (SMA) and 2 (FPC).
The left panels show activity coupling between SMA and the rest of the brain in the control state (a), the differential effect of SMA TUS for areas positively coupled (z > 0.1) with SMA in the control state (b), and for areas negatively coupled (z < −0.1) with SMA in the control state (c). The right panels show activity coupling between FPC and the rest of the brain in the control state (d), the differential effect of FPC TUS for areas positively coupled (z > 0.1) with FPC in the control state (e), and for areas negatively coupled (z < −0.1) with FPC in the control state (f). Panels (a) and (b) are reproduced here from Figure 3 for reference and to illustrate the location and extent of the ROIs used in the fingerprint analyses (Figure 5). Hot colours in (b) and (e) indicate enhanced coupling following TUS compared to the control state, while cool colours indicate reduced coupling. In (c) and (f) hot colours indicate reduced negative coupling, while cool colours indicate further negative coupling. All other conventions as in Figure 3. The TUS induced changes to the coupling of the stimulated regions were not limited to the a-priori defined ROIs but extended across many regions according to the connectional topography of the stimulated region.
Figure 5 with 1 supplement
Connectional fingerprints of the stimulated areas.
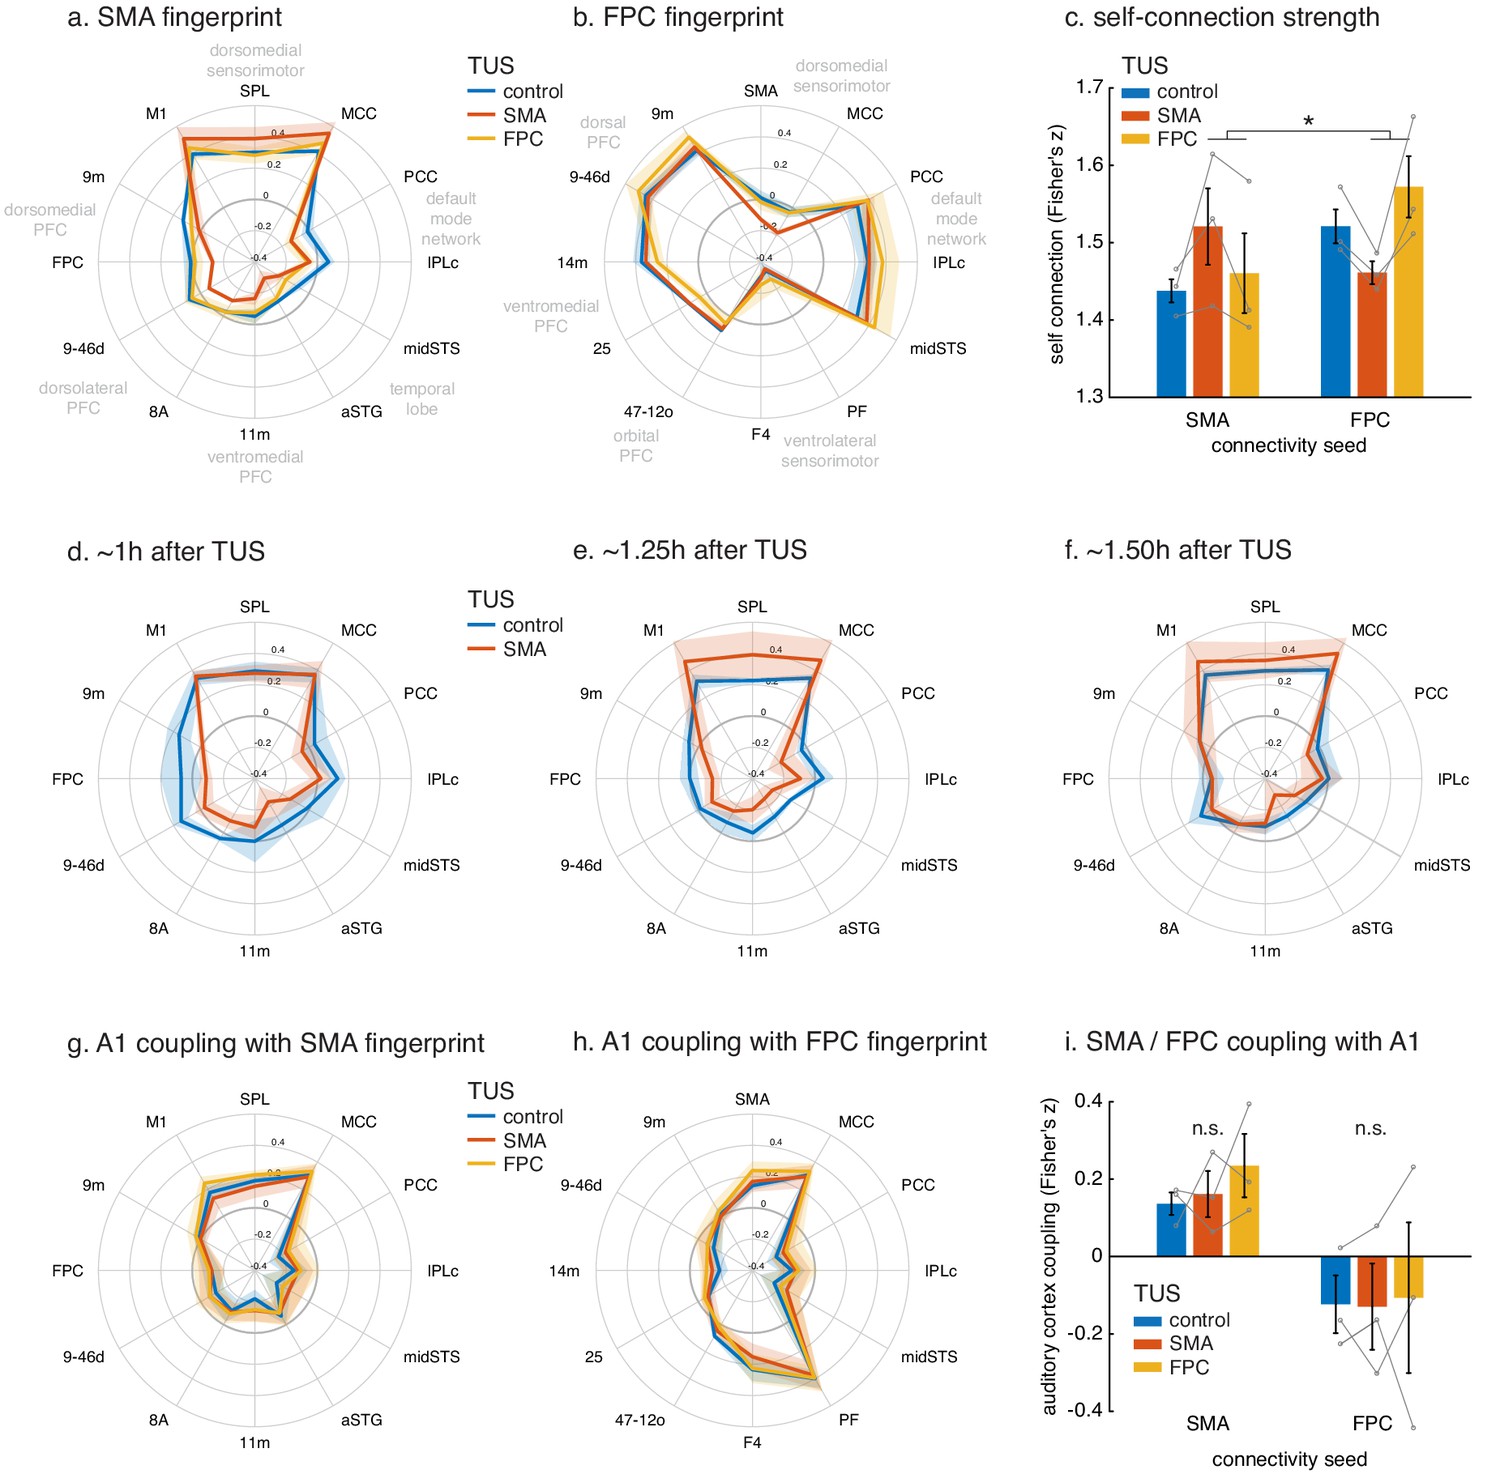
Fingerprint target regions were drawn from the literature and chosen based on their known and distinct connectivity, either strong or weak, with the seed region. Activity coupling in the control state is indicated in blue, following SMA TUS in red, and FPC TUS in yellow. (a) SMA connectional fingerprint. In the control state (blue) SMA is strongly coupled to areas in the dorsomedial sensorimotor system (M1, SPL, MCC). Coupling with each of these areas is enhanced after SMA TUS (red). In contrast, coupling with regions that SMA is weakly connected with in the control state are even further reduced after SMA TUS (red). However, SMA’s fingerprint is relatively unaffected after FPC TUS (yellow), but some effects are visible for regions that are strongly coupled with FPC (compare to panel b). (b) FPC connectional fingerprint is sharpened following FPC TUS, but not following SMA TUS. The latter only affected coupling with SMA itself and regions strongly connected to it (MCC). (c) TUS induced more homogenous activity within the stimulated area (SMA in red on the left, FPC in yellow on the right). (d–f) Temporal evolution of the effect of SMA TUS on the SMA connectional fingerprint. The left panel depicts effects observed in the first fMRI run, followed by the second run in the middle, and the third and last run on the right. For each run, the time after TUS refers to the duration between the end of TUS and the midpoint of the run, averaged across the three animals. (g–h) TUS-induced effects on the connectional fingerprints of SMA and FPC could not be explained by auditory activity. (i) There were no changes in the coupling between the stimulation sites and auditory cortex. In all plots, thick lines and histograms indicate mean activity coupling; lighter coloured error bands and error bars depict standard-error of the mean; the asterisk denotes the interaction between TUS and connectivity seed (p<0.001).
Figure 5—figure supplement 1
TUS did not affect the temporal variability of the BOLD signal.
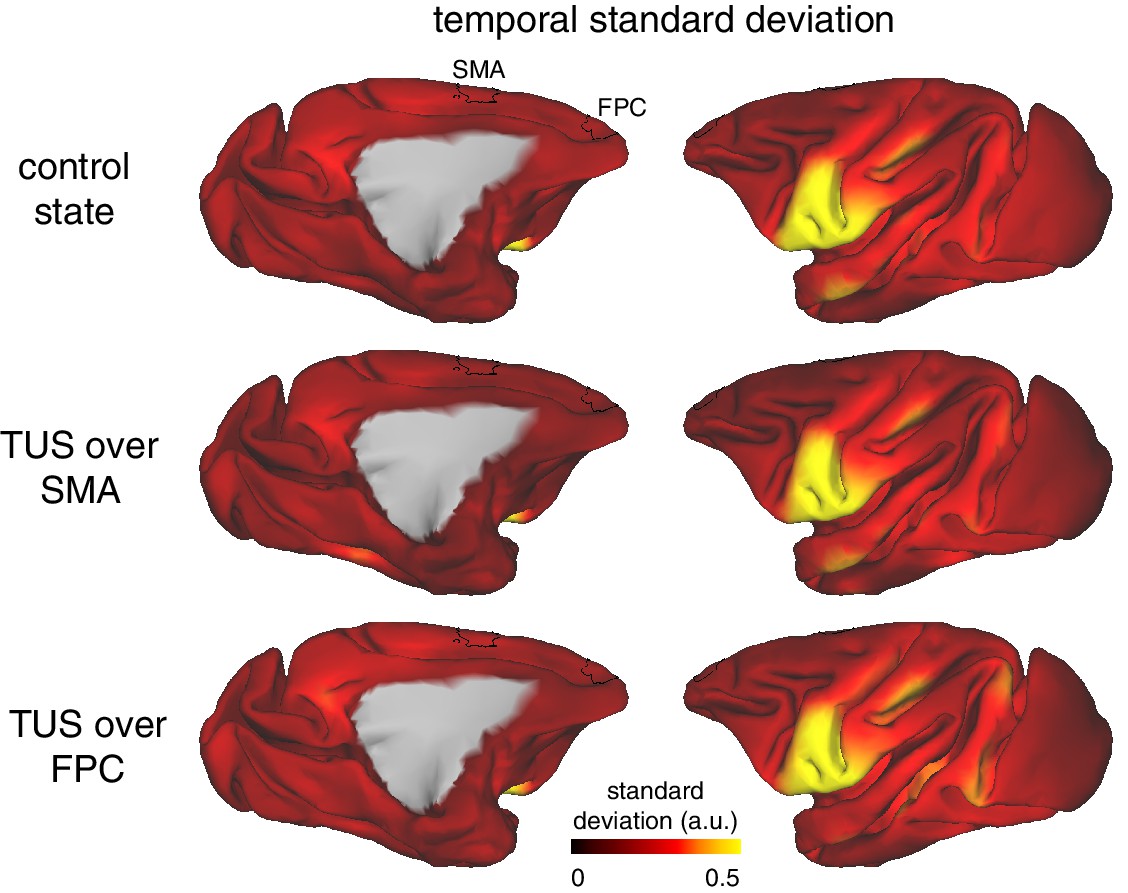
Whole-brain pattern of the standard deviation of the BOLD signal over time in the control state (top), after SMA TUS (middle), and after FPC TUS (bottom). The temporal standard deviation of the signal was not affected by TUS and was comparable across the stimulated regions SMA and FPC (ROIs depicted in black). The observed pattern of variability across the brain, with for example higher variability in ventral (pre-)motor areas, reflects basic properties of the data acquisition and signal (e.g. proximity to the RF receive coils).
Figure 6 with 1 supplement
Non-neuronal signal changes driving widespread coupling.
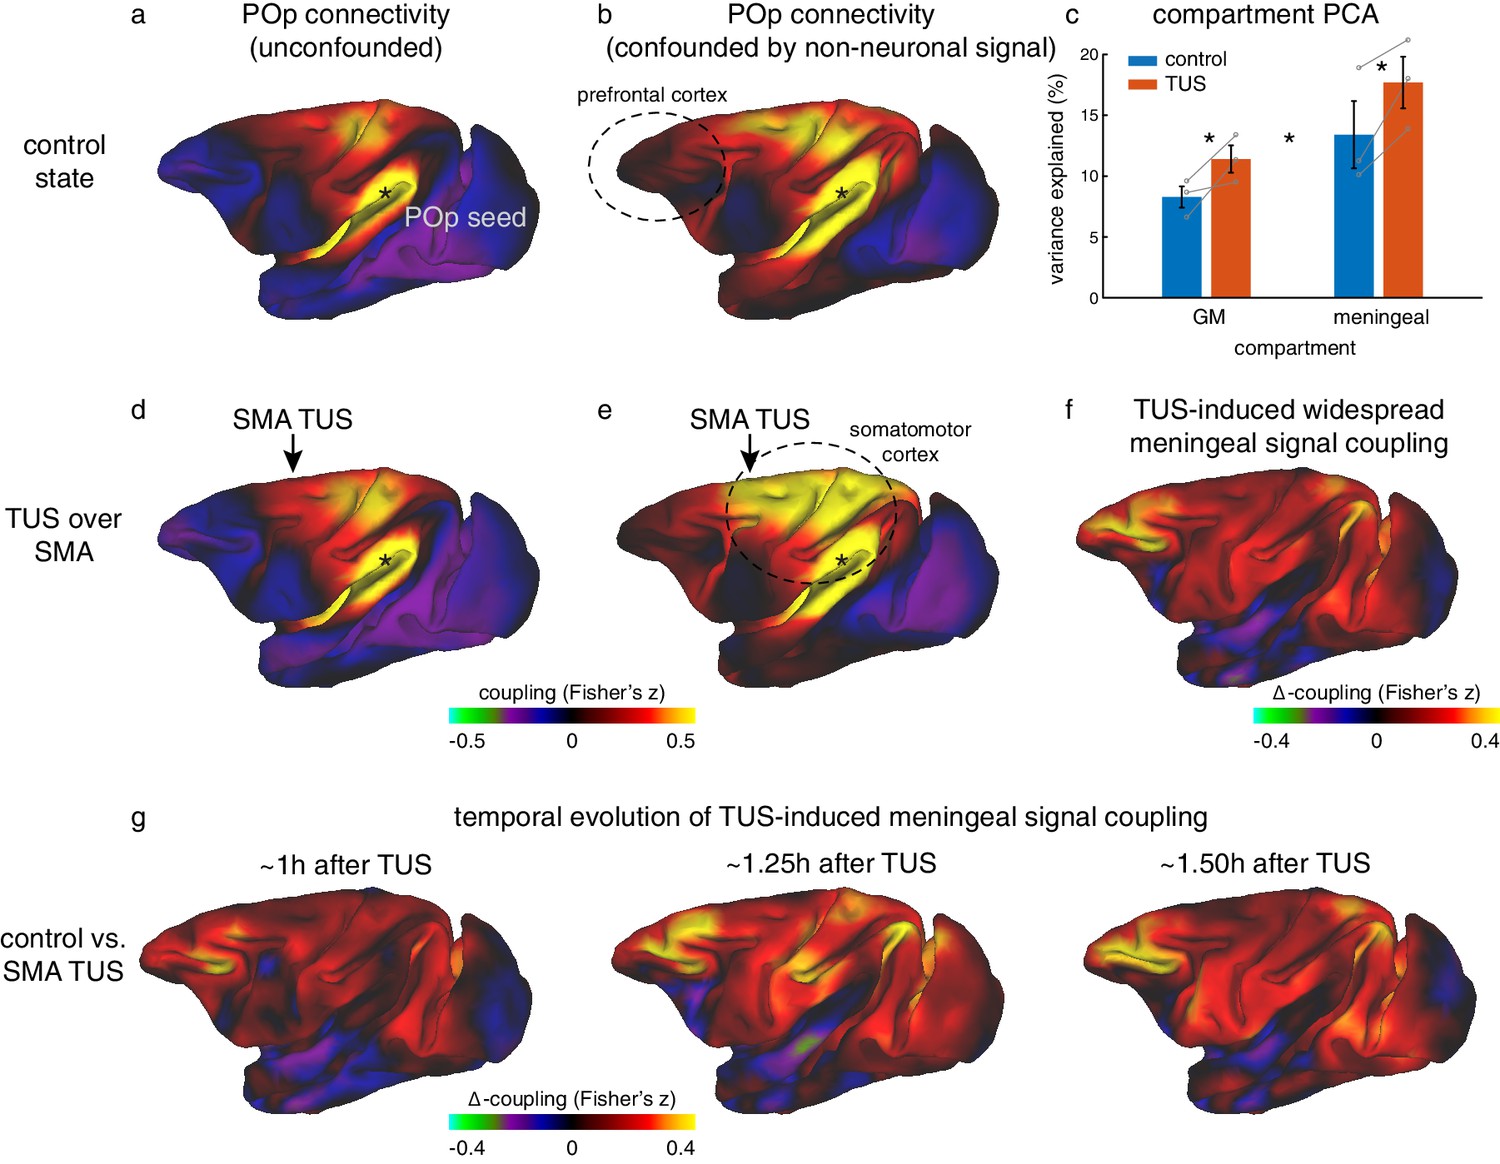
In fully processed fMRI data, unconfounded by global nuisance sources, effects of TUS were not immediately apparent outside the stimulated areas. (a,d) For example, the whole-brain connectivity pattern of the parietal operculum area (POp, spatially removed from either stimulation site) was unaffected by TUS over SMA. (b) When nuisance contributions from the meningeal compartment are not removed (but those from WM are), the presence of globally shared signal is evident: POp activity is now coupled with that in many other areas. (e) POp’s global nuisance confounded functional connectivity pattern became stronger after SMA TUS. This was because SMA TUS induced broad changes in BOLD signal even in the meningeal compartment, captured in a principal component analysis (c). Error bars denote standard-error of the mean; asterisks denote effects of TUS and WM/meningeal compartment (p<0.05). (f) This led to many points in the cortex exhibiting stronger coupling with other brain areas; all areas shown in red are points that have stronger coupling with the rest of the brain after TUS. Note that this effect is present far beyond the stimulation site. (g) This widespread TUS-induced meningeal signal coupling persisted over time. All conventions as in Figures 3,5.
Figure 6—figure supplement 1
Widespread non-neuronal signal changes were replicated in experiments 2 and 3.
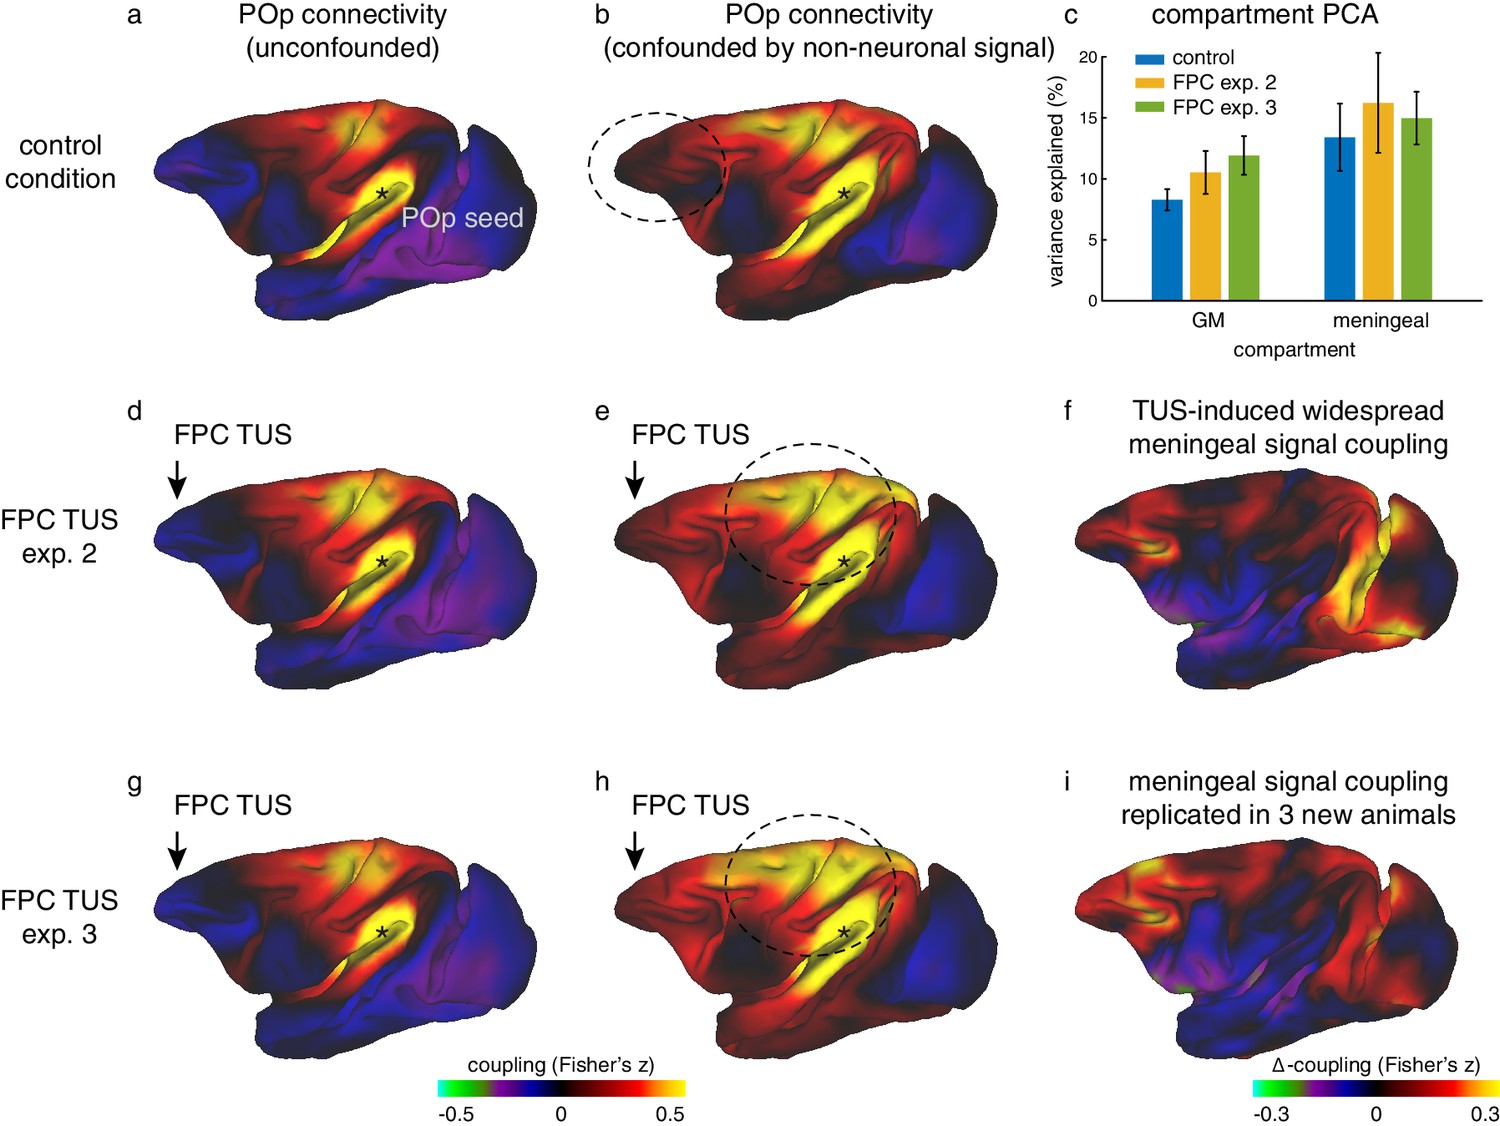
(a) Whole-brain connectivity pattern of area POp, a region removed from the stimulation sites, in the control state without TUS. (d) This region’s connectivity is unaffected by TUS over FPC, confirming the absence of remote effects following SMA TUS in experiment 1 (Figure 6). (g) The relative absence of remote effects (illustrated by POp) following FPC TUS in experiment two is replicated in experiment three in a new set of 3 animals. (b) When signal in the meningeal compartment is not considered in the noise estimation step POp’s connectivity is confounded by global nuisance signal. (e) Similar to the effects observed after SMA TUS, POp’s global nuisance confounded functional connectivity pattern became stronger after FPC TUS. (c) This was because FPC TUS induced broad changes in BOLD signal even in the meningeal compartment, captured in a principal component analysis, both in experiments 2 and 3. Error bars denote standard-error of the mean. (f) This led to many points in the cortex exhibiting stronger coupling with other brain areas; all areas shown in red are points that have stronger coupling with the rest of the brain after TUS. (h,i) This widespread meningeal signal coupling following FPC TUS and its effect on POp’s connectivity pattern was replicated in experiment 3. Panels (a) and (b) are reproduced here from Figure 6 for comparison. All conventions as in Figure 6.
Figure 7

No effect of TUS was apparent on T1w structural MRI images.
Examination of T1-weighted structural MRI images did not reveal any evidence for oedema after TUS. For two monkeys (top and bottom row, respectively), T1w images were acquired immediately following the resting-state fMRI runs in the control state (left column) and ~2 hr after TUS over FPC (right column). The sonication target regions are highlighted with dashed blue boxes.
Figure 8
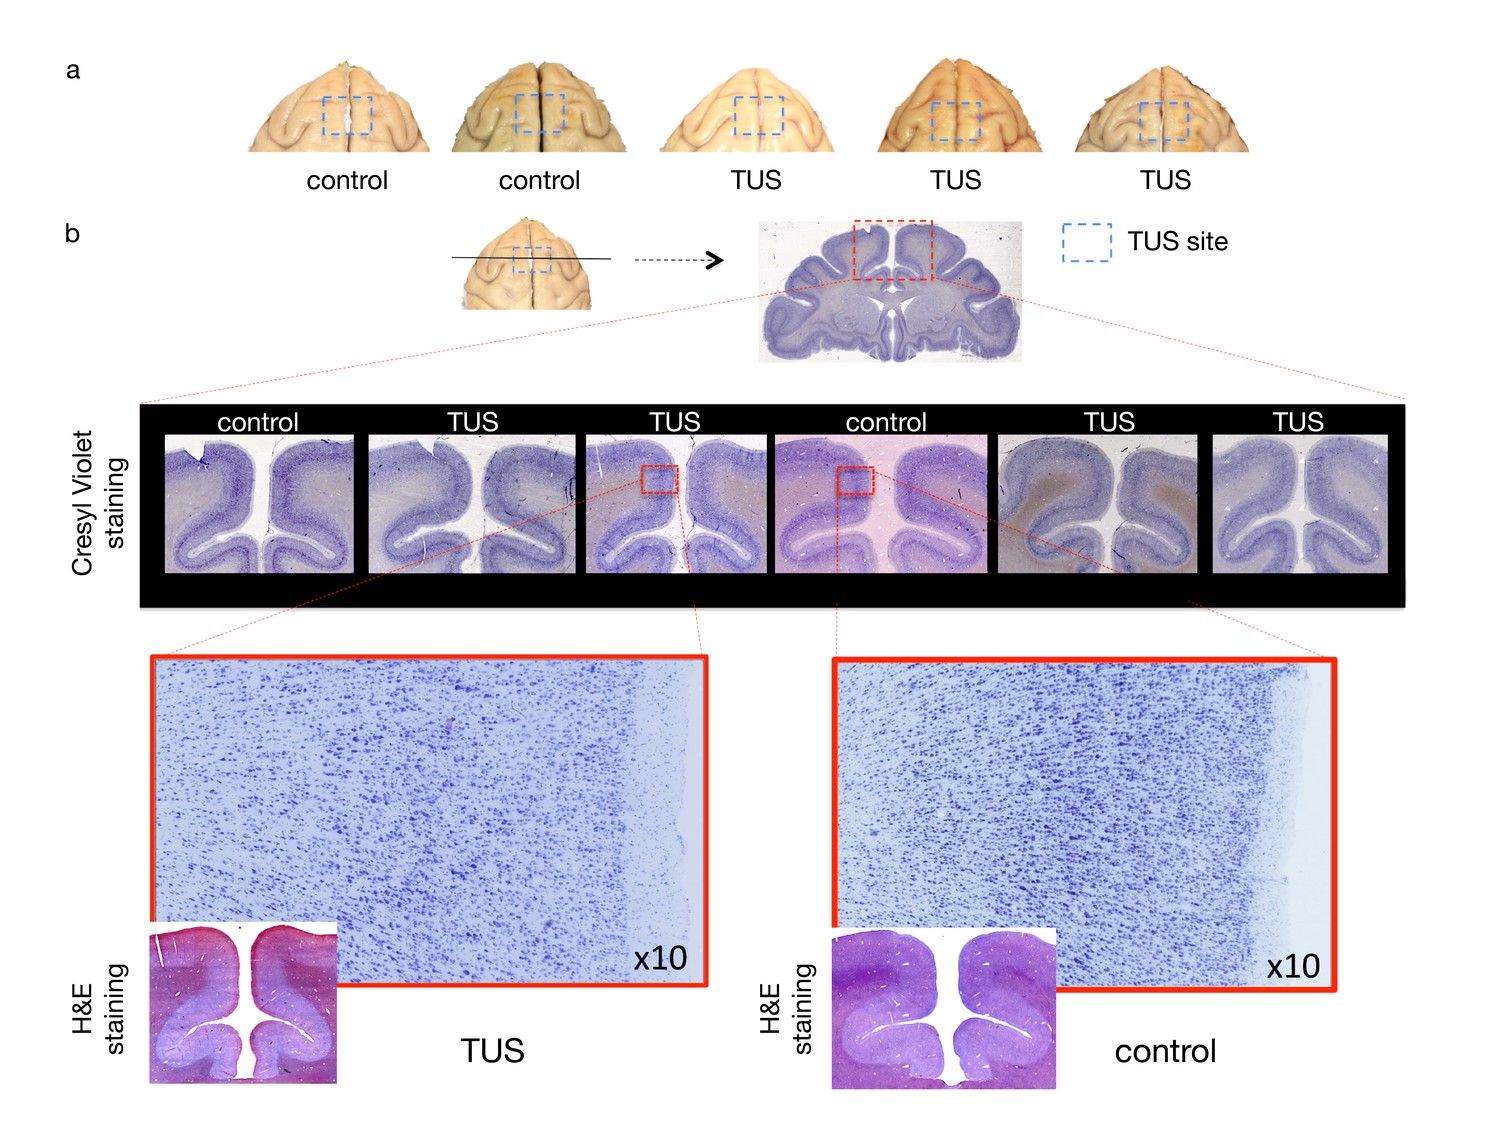
No effect of TUS was apparent on histological examination.
(a) Dorsal view of perfused macaque brain. A post-mortem examination of the brain did not reveal macroscopic damage to the brain. (b) Histological assessment of 50-micron thick sections obtained at the level of the stimulation site with Cresyl Violet Nissl staining and H and E staining did not reveal any evidence of thermal lesions or haemorrhage after the TUS protocol used here. Magnified images are centred at the focal point of the stimulation.
Additional files
-
Transparent reporting form
- https://doi.org/10.7554/eLife.40541.014
Download links
A two-part list of links to download the article, or parts of the article, in various formats.
Downloads (link to download the article as PDF)
Open citations (links to open the citations from this article in various online reference manager services)
Cite this article (links to download the citations from this article in formats compatible with various reference manager tools)
Offline impact of transcranial focused ultrasound on cortical activation in primates
eLife 8:e40541.
https://doi.org/10.7554/eLife.40541


