Gut microbiota density influences host physiology and is shaped by host and microbial factors
- Icahn School of Medicine at Mount Sinai, United States
- Zoo Knoxville, United States
- Rabin Medical Center, Israel
- Tel Aviv University, Israel
- Sema4, United States
- Janssen Pharmaceuticals, United States
Figures
Figure 1 with 2 supplements
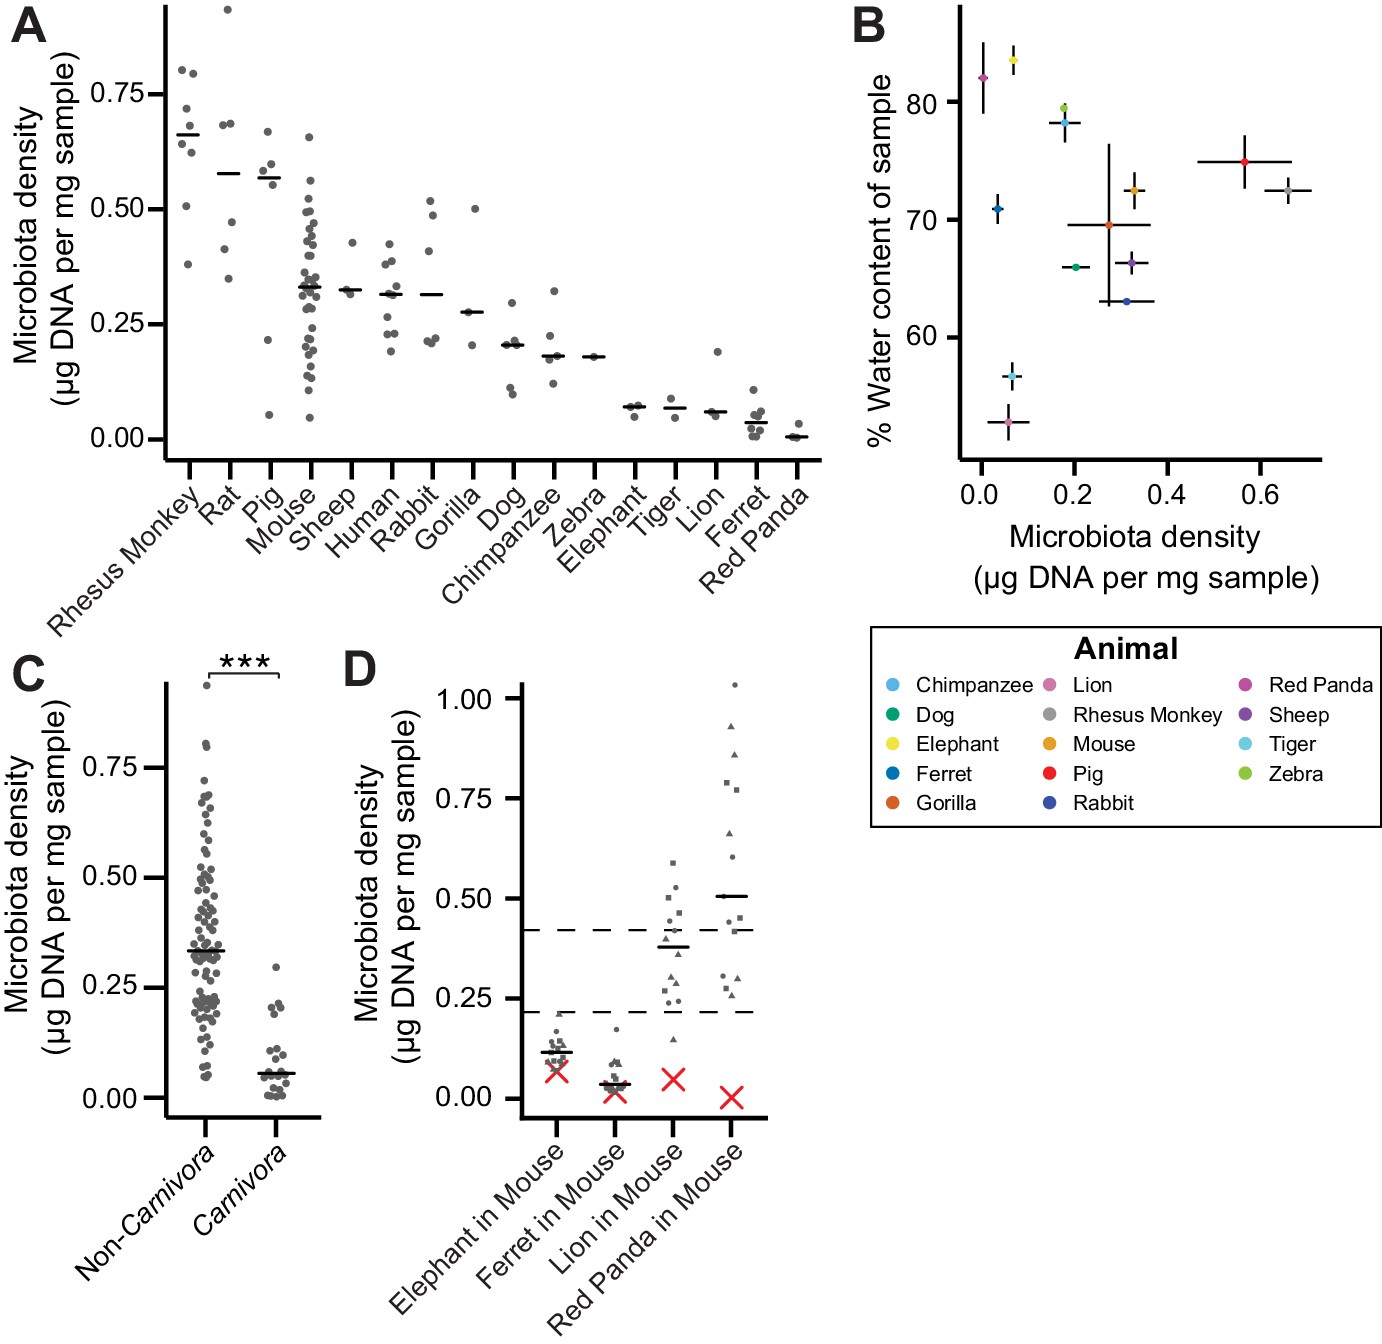
The natural variation in gut microbiota density across mammals is driven by host and microbial factors.
(A) Fecal microbiota density varies across mammalian species. (B) Microbiota density and water content of fecal samples are not correlated. (C) Animals from the order Carnivora have a reduced microbiota density compared to mammals from other orders. (D) Different mammalian gut microbiotas transplanted into germ-free Swiss Webster mice (n = 3 per group) vary in their fitness to reach microbiota densities similar to mouse microbiotas. In (A, C, and D) points depict individual samples, and bars indicate median. In (B) points and lines indicate median values ± SEM. In (D) a red X indicates the microbiota density of the original mammalian sample, while dashed lines represent IQR of conventional Swiss Webster mice. ***p < 0.001. Source data available for (A-D). 16S rRNA gene amplicon sequencing data is available for (A and D) (see Materials and methods).
-
Figure 1—source data 1
Microbiota density in mammalian samples.
Contains source data for Figure 1A and C.
- https://doi.org/10.7554/eLife.40553.005
-
Figure 1—source data 2
Fecal water content of mammalian samples.
Contains source data for Figure 1B.
- https://doi.org/10.7554/eLife.40553.006
-
Figure 1—source data 3
Microbiota density of gnotobiotic mice colonized with mammalian microbiome samples.
Contains source data for Figure 1D. Timepoints in relative terms (not days).
- https://doi.org/10.7554/eLife.40553.007
Figure 1—figure supplement 1
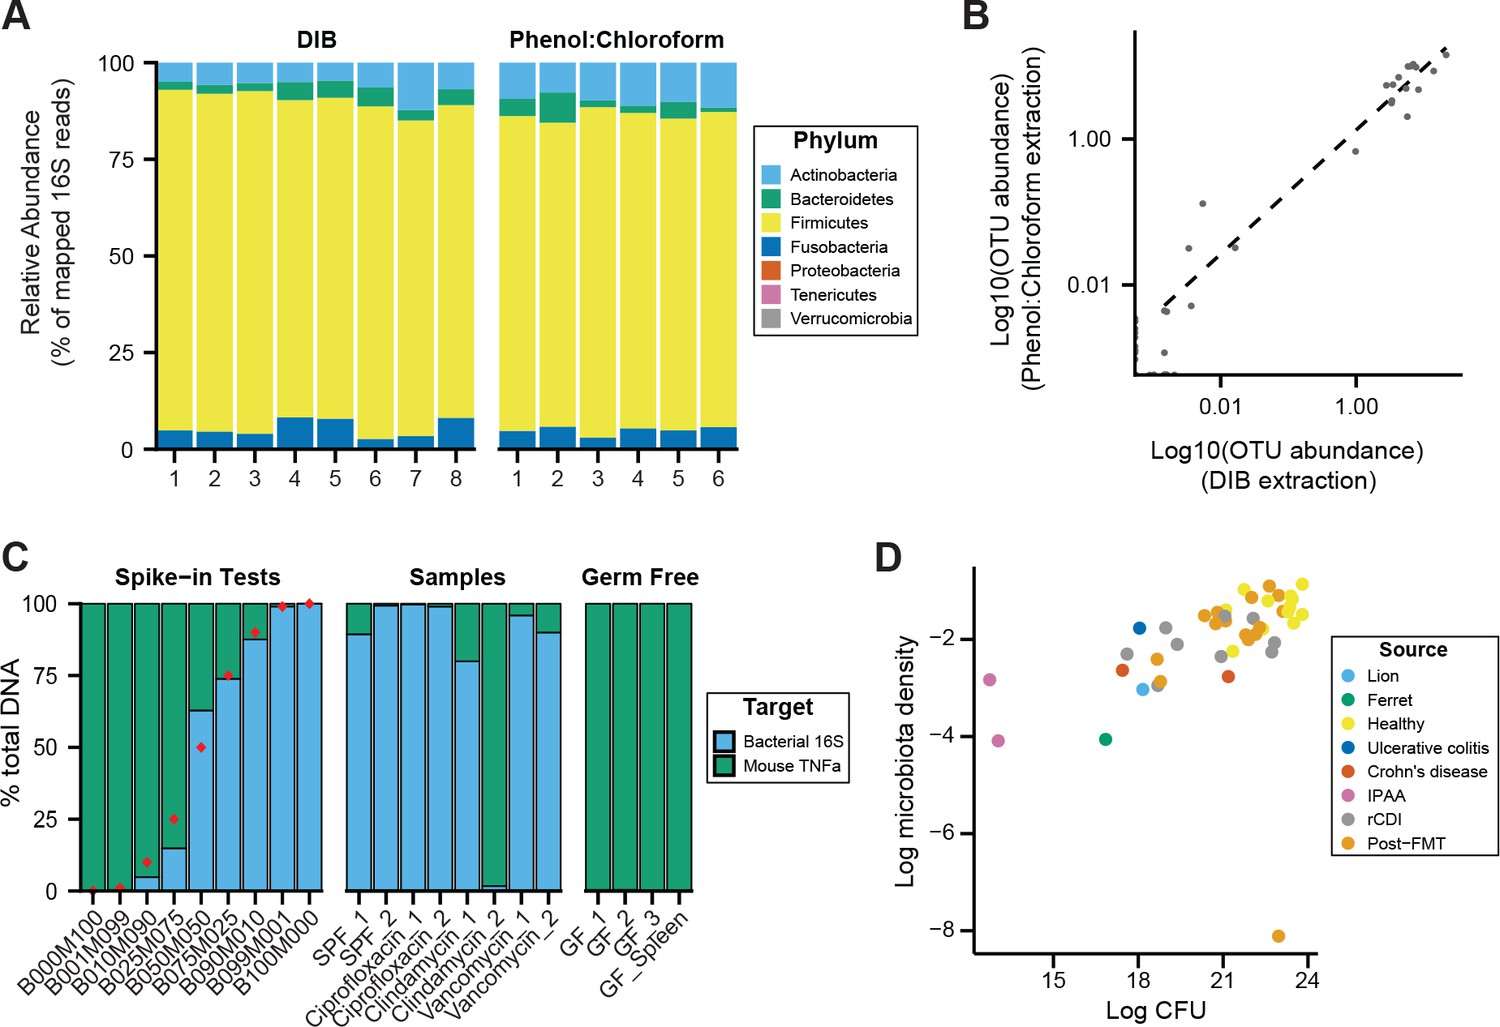
DNAse Inactivation Buffer DNA extraction method (DIB), phenol:chloroform extraction, and culture-based measurements of microbiota density yield consistent results.
We homogenized one dog fecal sample and created multiple aliquots for DNA extraction using either the DIB or phenol:chloroform extraction methods. (A) We do not observe evidence of bias introduced by the DNA extraction method chosen, as we observe similar microbial compositions for the multiple aliquots, regardless of extraction method. (B) Relative OTU abundances from DIB and phenol:chloroform extracted samples are highly correlated (ρ = 0.904, p = 1.82 x 10−45, Pearson’s correlation). Dots represent average values of an individual OTU abundance across several aliquots processed using each method (n = 8 for DIB, n = 6 for phenol:chloroform). (C) We performed qPCR of host and bacterial fractions of mixed mouse/microbial DNA samples. Spike-in samples with known fractions of mouse and bacterial DNA (e.g., B010M090 = 10% bacterial + 90% mouse) were quantified with qPCR to validate the potential to identify the origin of DNA in a mixed sample. Samples from mouse fecal pellets across a variety of conditions show that the host contribution to the extracted DNA is small, even for samples with low microbiota density. Red points indicate the true spike-in percentage of bacterial DNA. GF_1, GF_2, GF_3 are host DNA controls of germ-free mouse feces. GF_Spleen is a host DNA control from a germ-free mouse spleen. (D) Estimates of microbiota density based on DNA content are correlated with estimates of microbiota density based CFUs from anaerobic culturing of fecal samples (ρ = 0.628, p = 1.05 x 10⁻⁵, Spearman), regardless of the source of the fecal sample. Each dot represents one sample that was quantified in parallel by colony-forming unit assay and by DNA content quantification. Colors indicate the type of sample used.
Figure 1—figure supplement 2

Microbiota density is not correlated with body mass.
We do not find a relationship between mammalian body mass and microbiota density (ρ = -0.364, p = 0.167, Spearman).
Figure 2 with 4 supplements
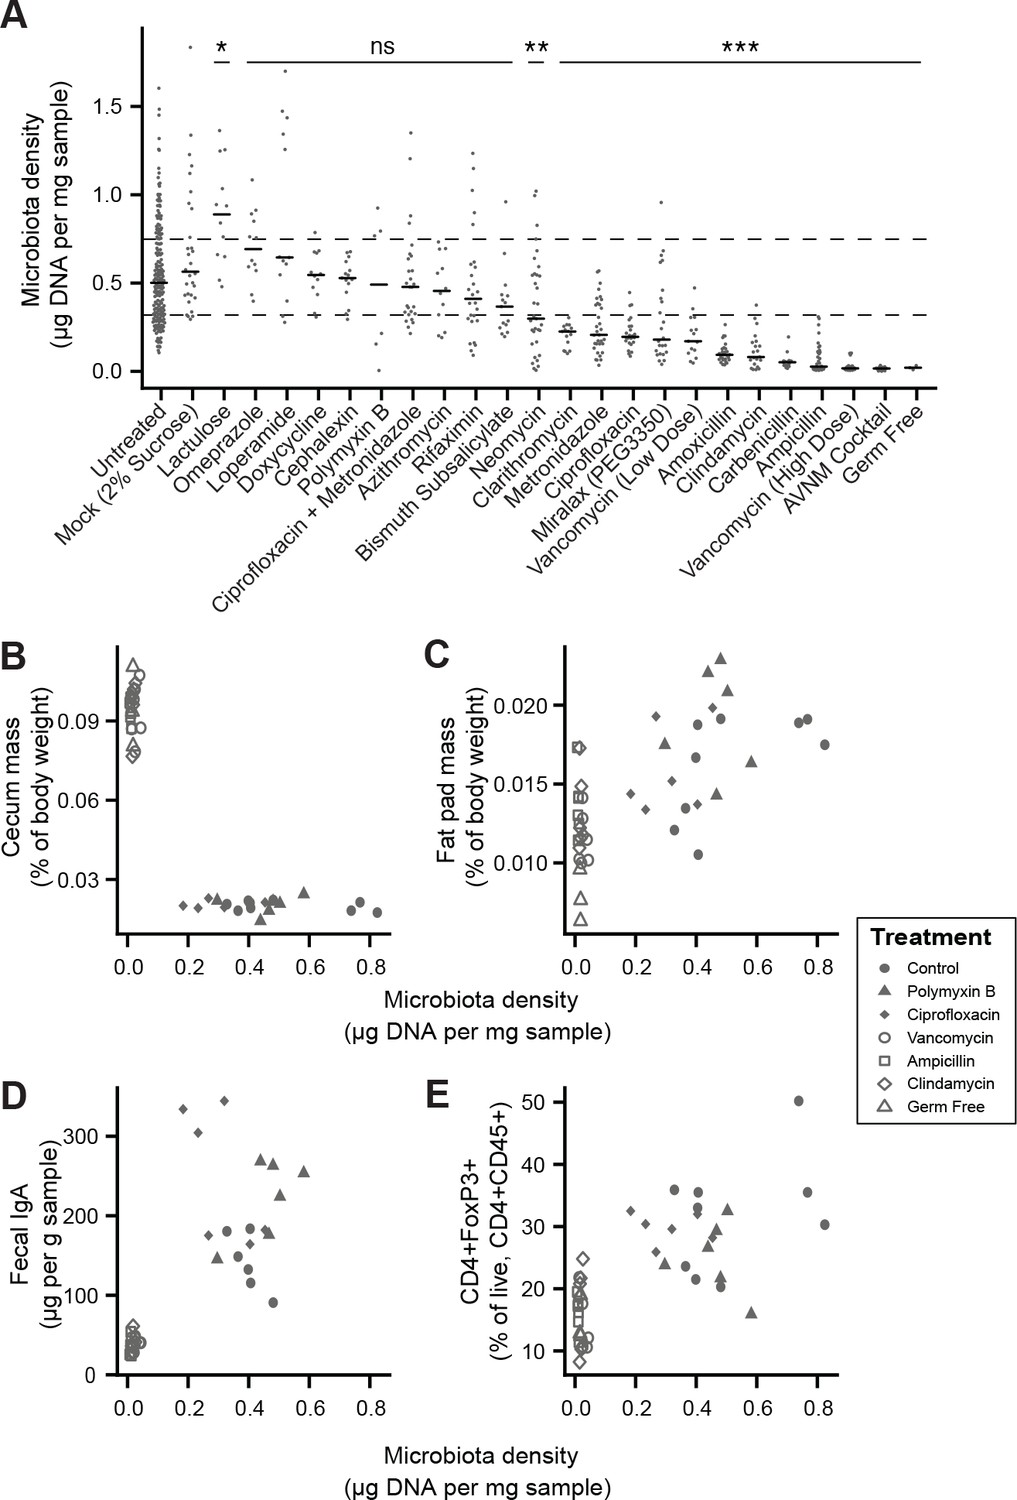
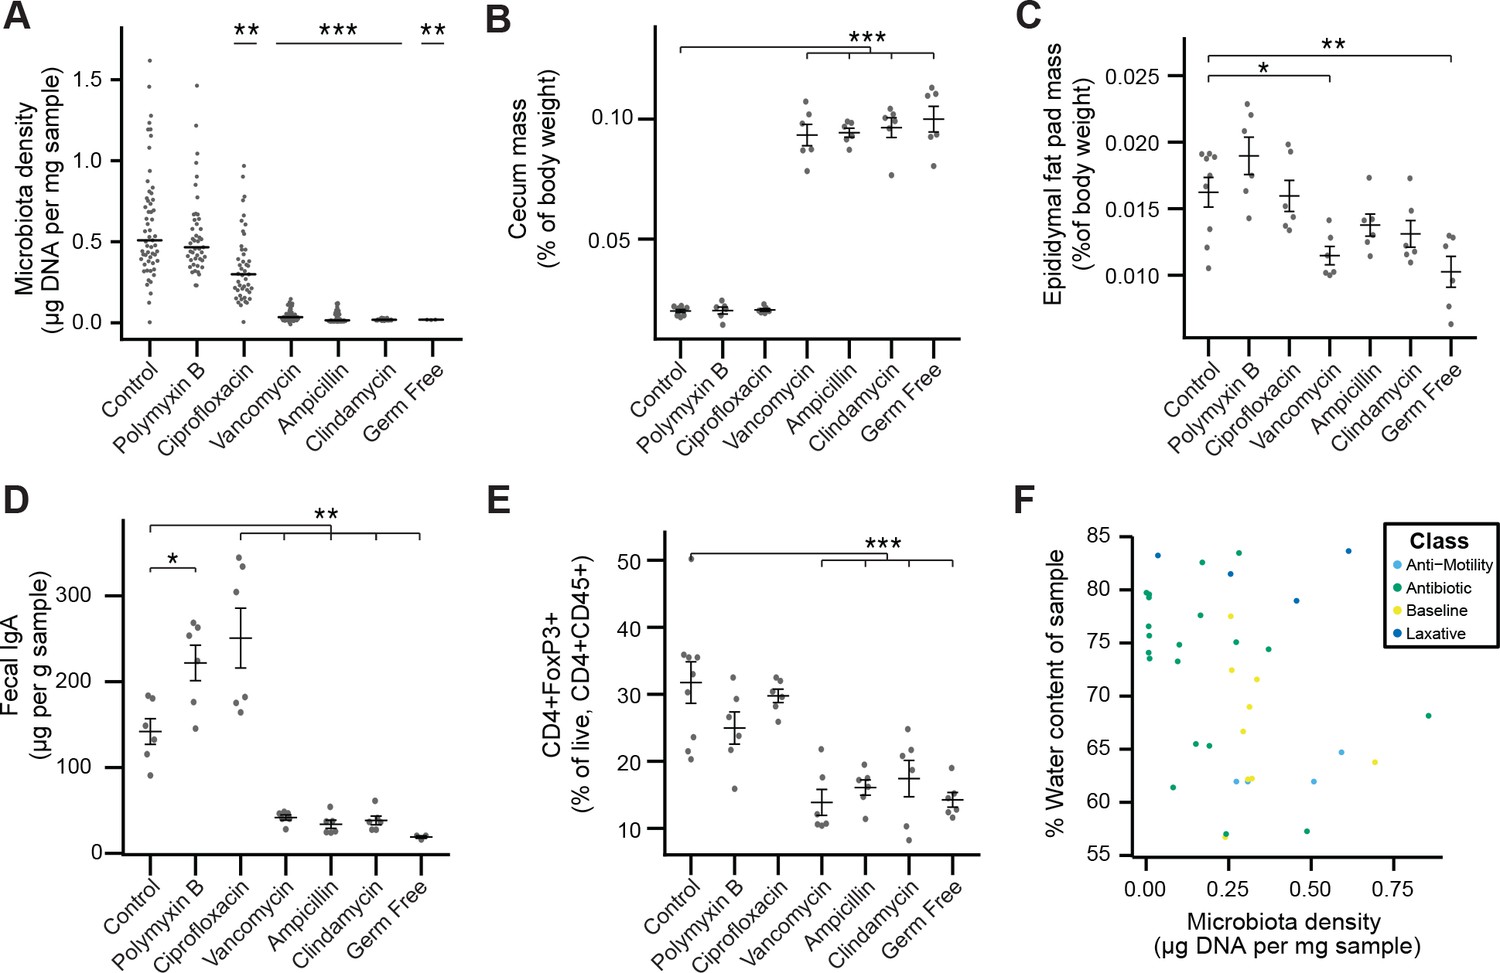
Manipulation of colonic microbiota density alters host physiology.
(A) Pharmacologic interventions differentially alter microbiota density in SPF C57BL/6J mice. Samples from 3 to 12 (mean = 6) mice per group. (B–E) Antibiotic-induced changes in microbiota density significantly correlate with (B) host cecum size, (C) adiposity, (D) fecal IgA, and (E) colonic lamina propria FoxP3 +T regulatory cells. n = 6 mice per antibiotic group, 9 SPF antibiotic-free controls, and six germ-free controls. In (A), dashed lines represent the IQR of untreated SPF C57BL/6J mice and AVNM = ampicillin, vancomycin, neomycin, metronidazole. Statistical tests performed for individual treatment conditions vs untreated using Kruskal-Wallis with Dunn’s post-test corrected for multiple comparisons with the Bonferonni correction. Bars indicate median. ns = not significant, *p < 0.05, **p < 0.01, and ***p < 0.001. In (B-E) points represent individual mice. Shapes indicate treatment group. Source data available for (A-E). 16S rRNA gene amplicon sequencing data is available for A (see Materials and methods).
-
Figure 2—source data 1
Microbiota density of mice treated with pharmacologics.
Contains source data for Figure 2A. Timepoint in relative terms (not days).
- https://doi.org/10.7554/eLife.40553.013
-
Figure 2—source data 2
Microbiota density and phenotypic changes in antibiotic-treated mice.
Contains source data for Figure 2B–2E and Figure 2—figure supplement 3A–3E.
- https://doi.org/10.7554/eLife.40553.014
-
Figure 2—source data 3
Fecal water content of mice diets with varied fiber sources and protein content.
Contains source data for Figure 2—figure supplement 4A and C.
- https://doi.org/10.7554/eLife.40553.015
-
Figure 2—source data 4
Fecal water content of mice diets with varied fiber sources and protein content.
Contains source data for Figure 2—figure supplement 4B and D.
- https://doi.org/10.7554/eLife.40553.016
Figure 2—figure supplement 1
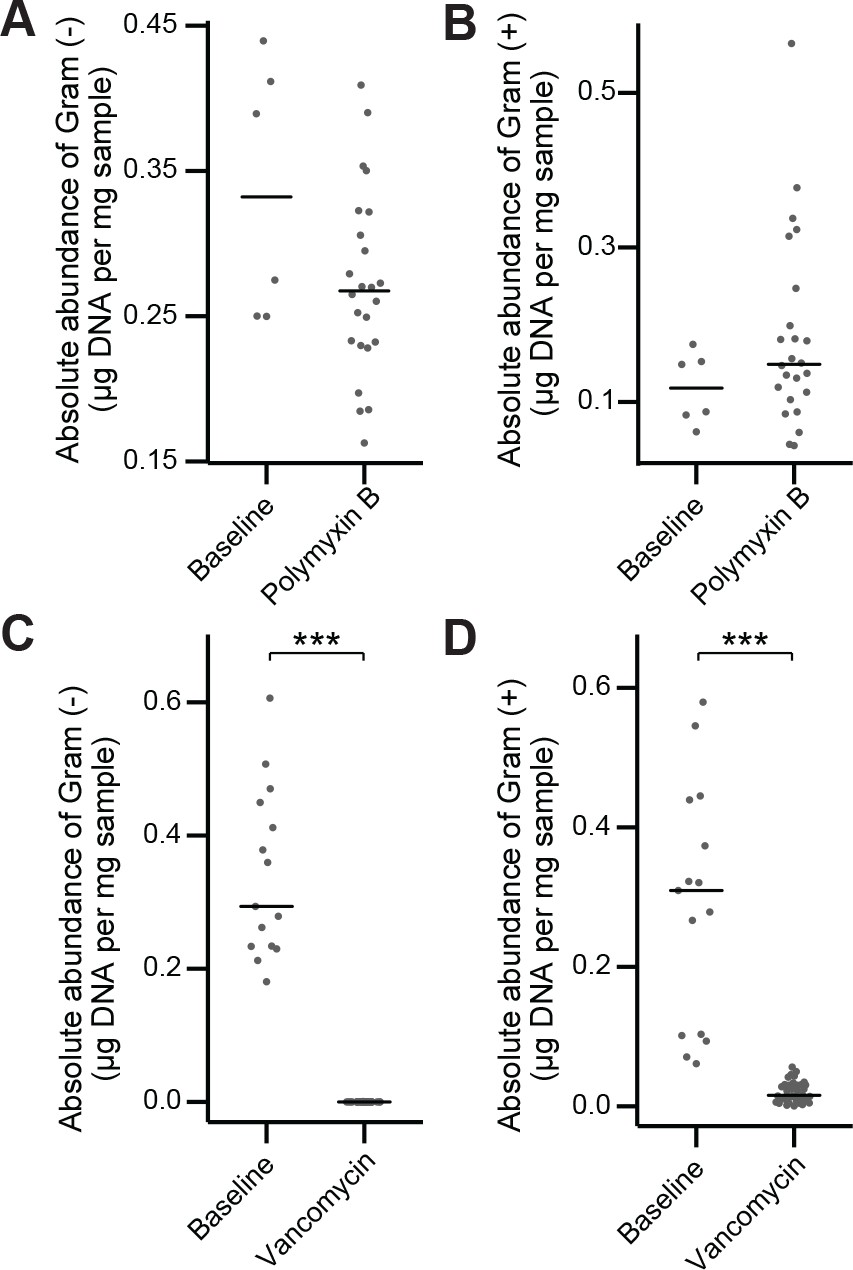
In vivo antibiotic spectrum of activity.
(A–B) Absolute abundance of Gram-negative (A) and Gram-positive (B) organisms in the mouse fecal microbiota before and after polymyxin B treatment. (C–D) Absolute abundance of Gram-negative (A) C and Gram-positive (D) organisms in the mouse fecal microbiota before and after vancomycin treatment. In (A-D) bars indicate median and Wilcoxon rank sum test was used to test for significance; ***p < 0.001. 16S rRNA gene amplicon sequencing data is available (see Materials and Methods).
Figure 2—figure supplement 2
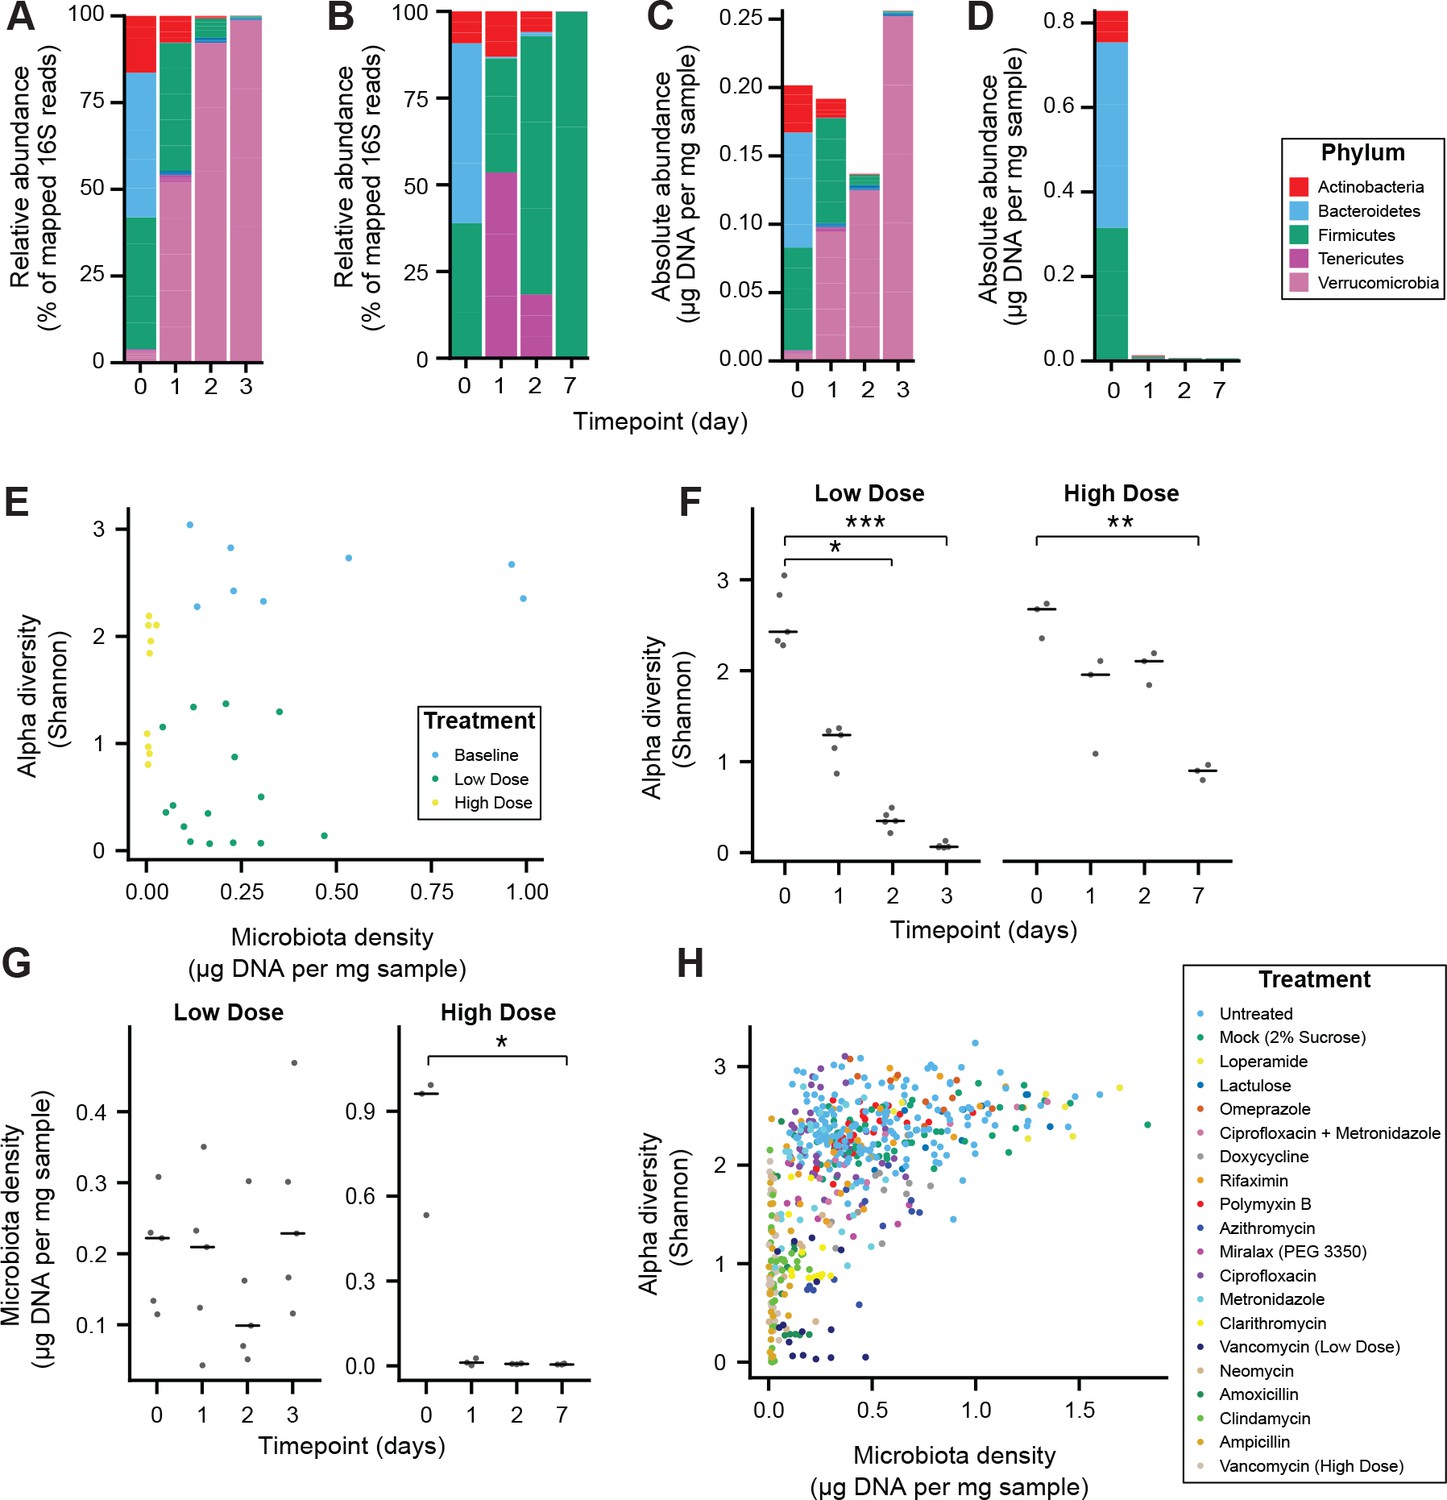
Alteration of the absolute murine fecal microbiota by pharmacologics, and the relationship between alpha diversity and microbiota density in pharmacologic interventions.
(A–D) The relative abundances of the microbiota in SPF C57BL/6J mice treated with (A) low dose (n = 5) and (B) high-dose (n = 3) vancomycin are each dominated by a single phyla. Taking changes in microbiota density into account, the absolute abundance of the microbiota at the phylum level in the (C) low-dose vancomycin group demonstrates an expansion of Verrucomicrobia compared to reduction of all phyla in the (D) high-dose vancomycin group. (E) Changes in alpha diversity in response to high (0.5 mg/mL, n = 3) and low (0.2 mg/mL, n = 5) dose vancomycin treatment do not correlate with the changes observed in microbiota density. (F) Both low and high dose vancomycin treatment in mice reduce alpha diversity. (G) Low dose vancomycin did not significantly alter microbiota density, while high dose vancomycin reduced microbiota density to near zero. (H) Across all tested pharmacologics, there was a significant correlation between microbiota density and alpha diversity as we never observed low alpha diversity with high density. In (F and G) bars indicate median, *p < 0.05, **p < 0.01, and ***p < 0.001 (Kruskal-Wallis with Dunn’s post-test corrected for multiple comparisons with the Bonferonni correction). In (E and H) colors indicate treatment. For all, points represent individual samples. 16S rRNA gene amplicon sequencing data is available (see Materials and Methods).
Figure 2—figure supplement 3
Phenotypic changes observed in antibiotic-treated mice.
(A) Microbial density changes observed in mice administered antibiotics ad libitum in drinking water for four weeks. (B–E) The reduction in microbiota density results in changes in the (B) cecum size, (C) epididymal fat pad mass, (D) fecal IgA, and (E) colonic lamina propria FoxP3+ T regulatory cells. (F) Across the microbiota changes induced by the pharmacologics, microbiota density and water content are not correlated. In A, bars indicate median and nonparametric statistics used to test for significance vs control (Kruskal-Wallis with Dunn’s post-test corrected for multiple comparisons with the Bonferonni correction). In (B-E) bars indicate mean ± SEM and Dunnett’s test used to test for significance. *p < 0.05, **p < 0.01, ***p < 0.001 (Dunnett’s test). Source data available for (A-E).
Figure 2—figure supplement 4
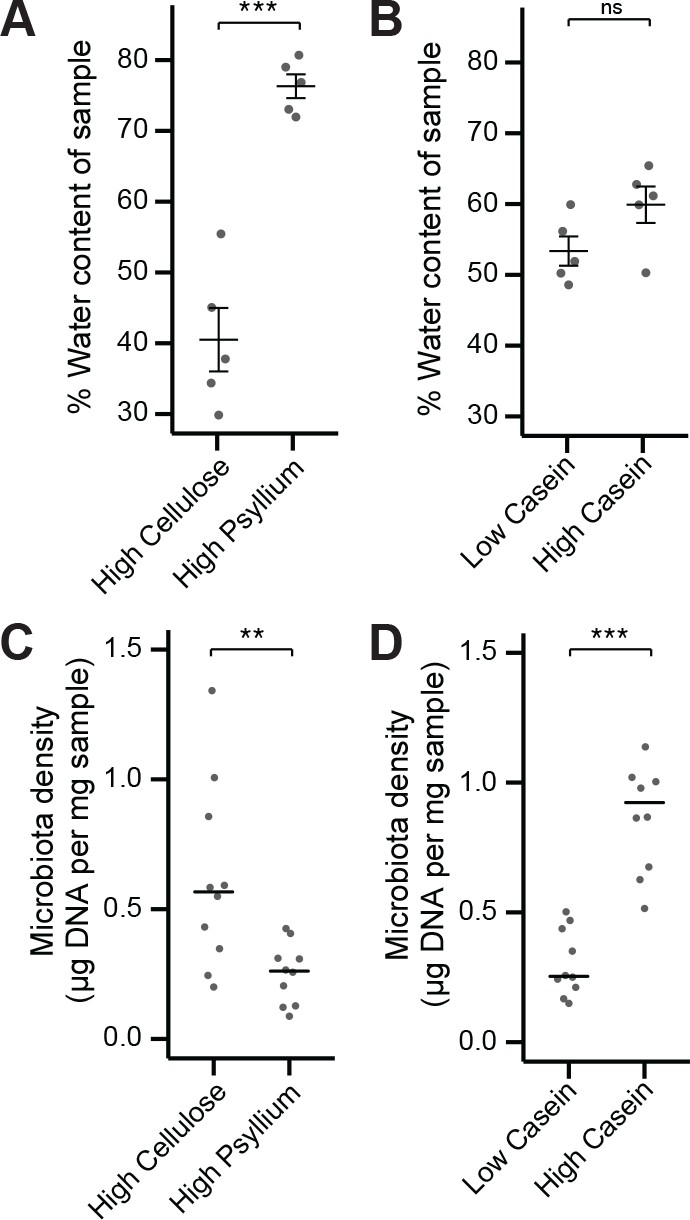
Fecal water content and microbiota density can be manipulated independently by diet.
(A) Water content of fecal samples from mice fed diets high in soluble fiber (psyllium) is greater than that of mice fed diets high in insoluble fiber (cellulose). (B) There is no change in the water content of mice fed diets that vary in their protein content. (C) Mice fed a diet high in soluble fiber had decreased microbiota density compared to mice fed a diet high in insoluble fiber. (D) Protein content of the diet influences microbiota density, as shown in Llewellyn et al. (2018). In A and B, bars indicate mean ± SEM, and Student’s t test was used to test for significance. In (C and D) bars indicate median, and Wilcoxon rank sum test was used to test for significance; **p < 0.01 and ***p < 0.001. Source data available for (A-D).
Figure 3 with 1 supplement

Microbiota density is altered in IBD.
(A) Subjects with ulcerative colitis and Crohn’s disease, as well as subjects who have undergone ileal pouch-anal anastomosis (IPAA) have reduced microbiota density compared to healthy controls. (B) The reduction in microbiota density in IBD patients is independent of disease activity. (C–D) 16S rRNA gene sequencing reveals phylum-level changes in (C) relative and (D) absolute abundances of the microbiota in subjects with UC, CD, and IPAA compared to healthy controls. (E–H) The absolute abundance of all of the major phyla are strongly correlated with microbiota density, with the exception of Proteobacteria, whose abundance is largely constant. In (A-C) bars indicate median, **p < 0.01, and ***p < 0.001 (Kruskal-Wallis with Dunn’s post-test corrected for multiple comparisons with the Bonferonni correction). In (C) each point represents the average microbiota density for an individual mouse before or after the initiation and development of colitis. In (E-H) points represent individual subjects and colors indicate their health status. Source data available for (A and B). 16S rRNA gene amplicon sequencing data is available for (C-H) (see Materials and methods).
-
Figure 3—source data 1
Microbiota density and diversity in individuals with IBD or IPAA.
Contains source data for Figure 3A and B, and Figure 3—figure supplement 1A and B.
- https://doi.org/10.7554/eLife.40553.019
Figure 3—figure supplement 1
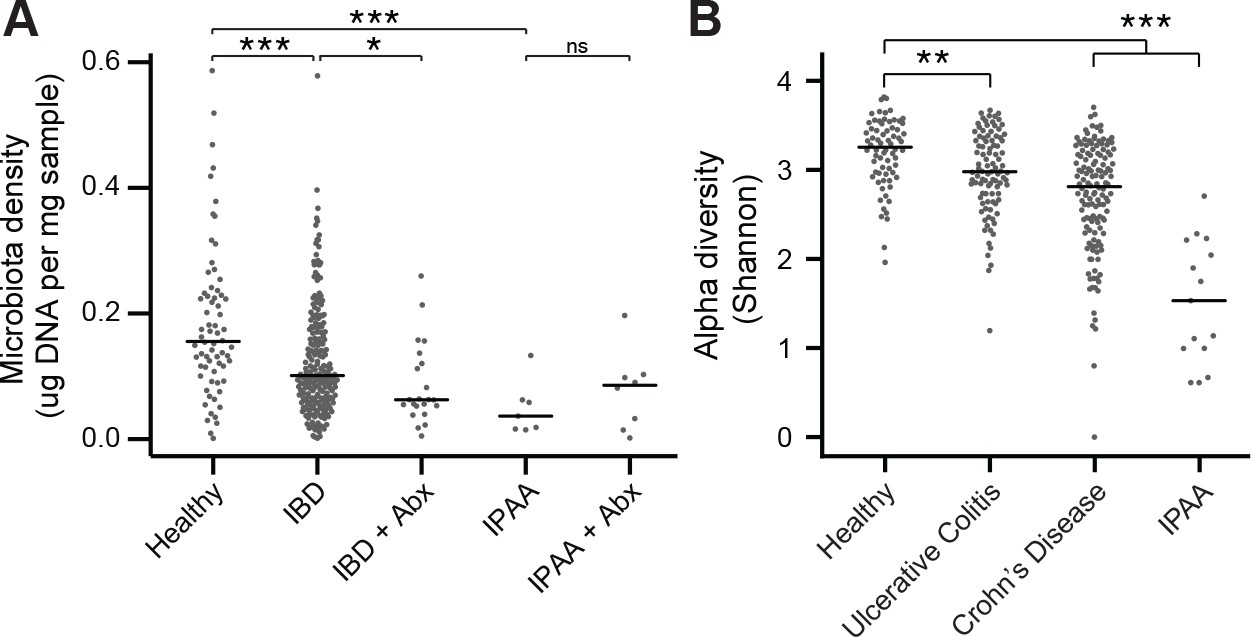
The microbiota of IBD and IPAA subjects.
(A) Microbiota density is reduced in subjects with IBD and IPAA in the absence of antibiotic use. Nonetheless, the microbiota density of individuals with IBD on antibiotics was significantly lower for individuals with IBD on antibiotics. (B) Alpha diversity is reduced in subjects with IBD relative to healthy controls In (A and B) bars indicate median, *p < 0.05, **p < 0.01, ***p < 0.001, ns = not significant. Source data available for (A and B). 16S rRNA gene amplicon sequencing data is available (see Materials and Methods).
Figure 4 with 1 supplement
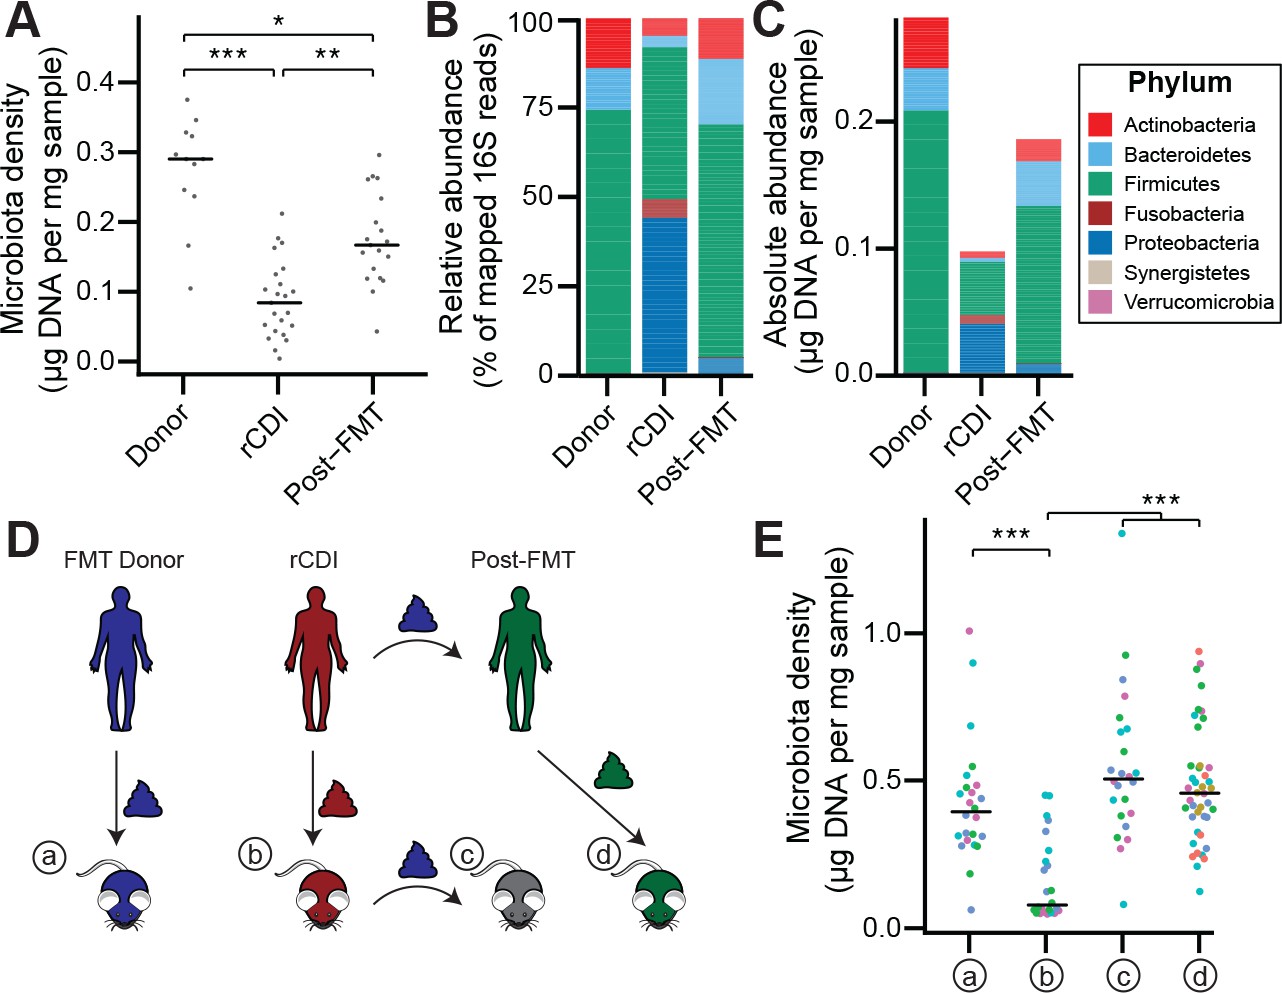
The rCDI microbiota has a fitness defect that is therapeutically treatable by FMT.
(A) rCDI subjects have reduced microbiota densities that are significantly increased upon FMT with donor microbiotas. (B and C) Following FMT, the composition of the microbiota of individuals with rCDI is restored to more closely resemble that of healthy donors in both (B) relative and (C) absolute terms. (D) Germ-free mice were colonized with the microbiota from FMT Donors (a) or individuals with rCDI that underwent FMT (b). These mice then received the microbiota from the FMT donor corresponding to the clinical FMT (c) which could be compared to germ-free mice colonized with the Post-FMT sample from the individual who received the FMT (d). (E) Microbiota density in mice from the experimental scheme described in (D) showed decrease in microbiota fitness prior to FMT and an increase in microbiota density following FMT demonstrating the restoration of community fitness. In (A and E) points represent individual samples, bars indicate median, *p < 0.05, **p < 0.01, and ***p < 0.001 (Kruskal-Wallis with Dunn’s post-test corrected for multiple comparisons with the Bonferonni correction). In (E), colors represent each one of five different FMT donor-recipient pairs. Source data available for A and E. 16S rRNA gene amplicon sequencing data is available for B, C, and E (see Materials and methods).
-
Figure 4—source data 1
Microbiota density of FMT recipients and donors.
Contains source data for Figure 4A. Timepoint in days (0 = day of FMT, if one occurred).
- https://doi.org/10.7554/eLife.40553.022
-
Figure 4—source data 2
Microbiota density of gnotobiotic mouse model of FMT.
- https://doi.org/10.7554/eLife.40553.023
Figure 4—figure supplement 1

FMT changes the microbiome of individuals with rCDI to resemble that of healthy donors.
(A) Alpha diversity in rCDI is significantly lower than in healthy individuals used as FMT donors. This change in alpha diversity is restored by FMT. (B) Principal coordinates analysis of unifrac distances based on the absolute abundances of OTUs in healthy FMT donors and rCDI before and after FMT. (C–F) The rCDI microbiota density is driven largely by the abundance of Proteobacteria and Firmicutes. In healthy donors and individuals following FMT, Proteobacteria are present at a constant absolute abundance, and microbiota density is driven by Firmicutes, Bacteroidetes, and Actinobacteria. Points represent individual subjects and colors indicate their health status In (A) bars indicate median, ***p < 0.001. In (B) points represent individual samples. Ellipses indicate the 95% confidence interval of distribution of points. 16S rRNA gene amplicon sequencing data is available (see Materials and Methods).
Tables
Key resources table
| Reagent type (species) or resource | Designation | Source or reference | Identifiers | Additional information |
|---|---|---|---|---|
| Antibody | Anti-Mouse/Rat Foxp3 PE | Thermo Fisher Scientific | Cat# 12-5773-82; RRID:AB_465936 | (1:100) |
| Antibody | APC Anti-Mouse CD4 | BioLegend | Cat# 100411; RRID:AB_312696 | (1:200) |
| Antibody | APC/Cy7 Anti- Mouse CD45 | BioLegend | Cat# 103115; RRID:AB_312980 | (1:100) |
| Antibody | Goat Anti-Mouse IgA-HRP | Sigma-Aldrich | Cat# A4789; RRID:AB_258201 | (1:2000) |
| Antibody | Goat Anti-Mouse IgA-UNLB | SouthernBiotech | Cat# 1040–01; RRID:AB_2314669 | Working concentration 1 ng/μL |
| Chemical compound, drug | Amoxicillin | Sigma-Aldrich | Cat# A8523 | |
| Chemical compound, drug | Ampicillin | Sigma-Aldrich | Cat# A9518 | |
| Chemical compound, drug | Azithromycin | AK Scientific | Cat# SYN3010 | |
| Chemical compound, drug | Carbenicillin | Sigma-Aldrich | Cat# C1389 | |
| Chemical compound, drug | Cephalexin | Sigma-Aldrich | Cat# C4895 | |
| Chemical compound, drug | Ciprofloxacin | Sigma-Aldrich | Cat# 17850 | |
| Chemical compound, drug | Clarithromycin | Sigma-Aldrich | Cat# C9742 | |
| Chemical compound, drug | Clindamycin | Sigma-Aldrich | Cat# C5269 | |
| Chemical compound, drug | Doxycycline | Sigma-Aldrich | Cat# D9891 | |
| Chemical compound, drug | Lactulose | Sigma-Aldrich | Cat# 61360 | |
| Chemical compound, drug | Loperamide | Sigma-Aldrich | Cat# L4762 | |
| Chemical compound, drug | Metronidazole | Research Products International | Cat# M81000 | |
| Chemical compound, drug | Neomycin | Sigma-Aldrich | Cat# N6386 | |
| Chemical compound, drug | Omeprazole | Sigma-Aldrich | Cat# O104 | |
| Chemical compound, drug | Peroxidase Solution B | KPL | Cat# 50-65-02 | |
| Chemical compound, drug | PhenoL:Chloroform:IAA, 25:24:1, pH 6.6 | Thermo Fisher Scientific | Cat# AM9732 | |
| Chemical compound, drug | PM Buffer | Qiagen | Cat# 19083 | |
| Chemical compound, drug | Polyethylene Glycol 3350 | Miralax | Product # 11523–723 | |
| Chemical compound, drug | Polymyxin B | Sigma-Aldrich | Cat# P0972 | |
| Chemical compound, drug | Rifaximin | Sigma-Aldrich | Cat# R9904 | |
| Chemical compound, drug | RNAlater Stabilization Reagent | Qiagen | Cat# 76104 | |
| Chemical compound, drug | Sodium dodecyl sulfate (SDS) | Sigma-Aldrich | Cat# 75746 | |
| Chemical compound, drug | TMB Peroxidase Substrate | KPL | Cat# 50-76-02 | |
| Chemical compound, drug | Vancomycin | Amresco | Cat# 990 | |
| Commercial assay or kit | Bioanalyzer 6000 Nano Kit | Agilent | Cat# 5067–1511 | |
| Commercial assay or kit | Foxp3 Fixation/Permeabilization Buffer Set | BioLegend | Cat# 421403 | |
| Commercial assay or kit | NEBNext Ultra II DNA Library Prep Kit | New England BioLabs | Cat# E7645L | |
| Commercial assay or kit | QIAquick 96 PCR Purification Kit | Qiagen | Cat# 28181 | |
| Commercial assay or kit | Quant-IT dsDNA Assay Kit – Broad Range | Thermo Fisher Scientific | Cat# Q32853 | |
| Commercial assay or kit | Quant-IT dsDNA Assay Kit – High Sensitivity | Thermo Fisher Scientific | Cat# Q33130 | |
| Commercial assay or kit | RNeasy Mini Kit | Qiagen | Cat# 74104 | |
| Commercial assay or kit | Zombie Aqua Fixable Viability Kit | BioLegend | Cat# 423101 | |
| Other | 0.1 mm diameter zirconia/silica beads | BioSpec | Cat# 11079101z | |
| Other | 1.0 mL collection tubes | Thermo Fisher Scientific | Cat# 3740 | |
| Other | 2.0 mL collection tubes | Axygen | Cat# SCT-200-SS-C-S | |
| Other | Agencourt AMPure XP Beads | Beckman Coulter | Cat# A63880 | |
| Other | Bioruptor Pico | Diagenode | Cat# B01060010 | |
| Other | Collagenase VIII | Sigma-Aldrich | Cat# C2139 | |
| Other | DNase1 | Sigma-Aldrich | Cat# DN25 | |
| Other | LSR II Flow Cytometer | BD Biosciences | SORP | |
| Other | Mini-Beadbeater-96 | BioSpec | Cat# 1001 | |
| Other | NEBNext Ultra Q5 Master Mix | New England BioLabs | Cat# M0544L | |
| Other | SPRIselect Beads | Beckman Coulter | Cat# B23317 | |
| Other | Synergy HTX Multi-Mode Microplate Reader | BioTek | http://www.biotek.com | |
| Other, deposited data | Greengenes reference database version 13_8 | DeSantis et al., 2006 | http://greengenes.lbl.gov | |
| Other, deposited data | Microbiota 16S rDNA gene sequences | This paper | SRA Project #: PRJNA413199 | |
| Other, deposited data | Mus musculus mm10 genome | UCSC | http://genome.ucsc.edu | |
| Other, deposited data | Shotgun metagenomic sequencing data | This paper | SRA Project #: PRJNA413199 | |
| Sequence-based reagent (primers) | 16S V4 (515–806) F 5’-GTGCCAGCAGCCGCGGTAA-3’ | IDT (Relman et al., 1992) | N/A | |
| Sequence-based reagent (primers) | 16S V4 (515–806) R 5’-GGACTACCAGGGTATCTAAT-3’ | IDT (Relman et al., 1992) | N/A | |
| Sequence-based reagent (primers) | Mouse TNFa (6455–6718) F 5’-GGCTTTCCGAATTCACTGGAG-3’ | IDT (Nitsche et al., 2001) | N/A | |
| Sequence -based reagent (primers) | Mouse TNFa (6455–6718) R 5’-CCCCGGCCTTCCAAATAAA-3’ | IDT (Nitsche et al., 2001) | N/A | |
| Software, algorithm | FACSDiva | BD Biosciences | http://www.bdbiosciences.com/us/instruments/research/software/flow-cytometry-acquisition/bd-facsdiva-software/m/111112/overview | |
| Software, algorithm | FLASH | Magoč and Salzberg, 2011 | http://ccb.jhu.edu/software/FLASH/ | |
| Software, algorithm | FlowJo (version 10) | Treestar | https://www.flowjo.com/solutions/flowjo/downloads | |
| Software, algorithm | MetaPhlAn2 | Truong et al., 2015 | N/A | |
| Software, algorithm | Multcomp R package | Hothorn et al., 2008 | https://cran.r-project.org/package=multcomp | |
| Software, algorithm | Phyloseq R package | McMurdie and Holmes (2013) | https://joey711.github.io/phyloseq | |
| Software, algorithm | QIIME (version 1.9.1) | Caporaso et al., 2010 | http://qiime.org | |
| Software, algorithm | R | R Core Team, 2017 | https://www.R-project.org | |
| Strain, strain background (mus musculus) | C57BL/6J mice | Jackson Laboratory | Stock #000664 | |
| Strain, strain background (mus musculus) | Swiss Webster mice | Taconic Biosciences | SW-M and SW-F |
Additional files
-
Supplementary file 1
Mammalian sample information.
This table contains information on the mammalian species used in this study, including taxonomic information, diet, and approximate mass.
- https://doi.org/10.7554/eLife.40553.024
-
Supplementary file 2
Antibiotics used in mouse experiments.
This table contains information on the antibiotics in this study, including the concentrations used to treat mice and the sources used to determine the final dosing.
- https://doi.org/10.7554/eLife.40553.025
-
Transparent reporting form
- https://doi.org/10.7554/eLife.40553.026
Download links
A two-part list of links to download the article, or parts of the article, in various formats.
Downloads (link to download the article as PDF)
Open citations (links to open the citations from this article in various online reference manager services)
Cite this article (links to download the citations from this article in formats compatible with various reference manager tools)
Gut microbiota density influences host physiology and is shaped by host and microbial factors
eLife 8:e40553.
https://doi.org/10.7554/eLife.40553


