Heterodimerization of UNC-13/RIM regulates synaptic vesicle release probability but not priming in C. elegans
- The University of Queensland, Australia
- Massachusetts General Hospital, United States
- Harvard Medical School, United States
- Massachusetts General Hospital, Howard Hughes Medical Institute, United States
Figures
Figure 1
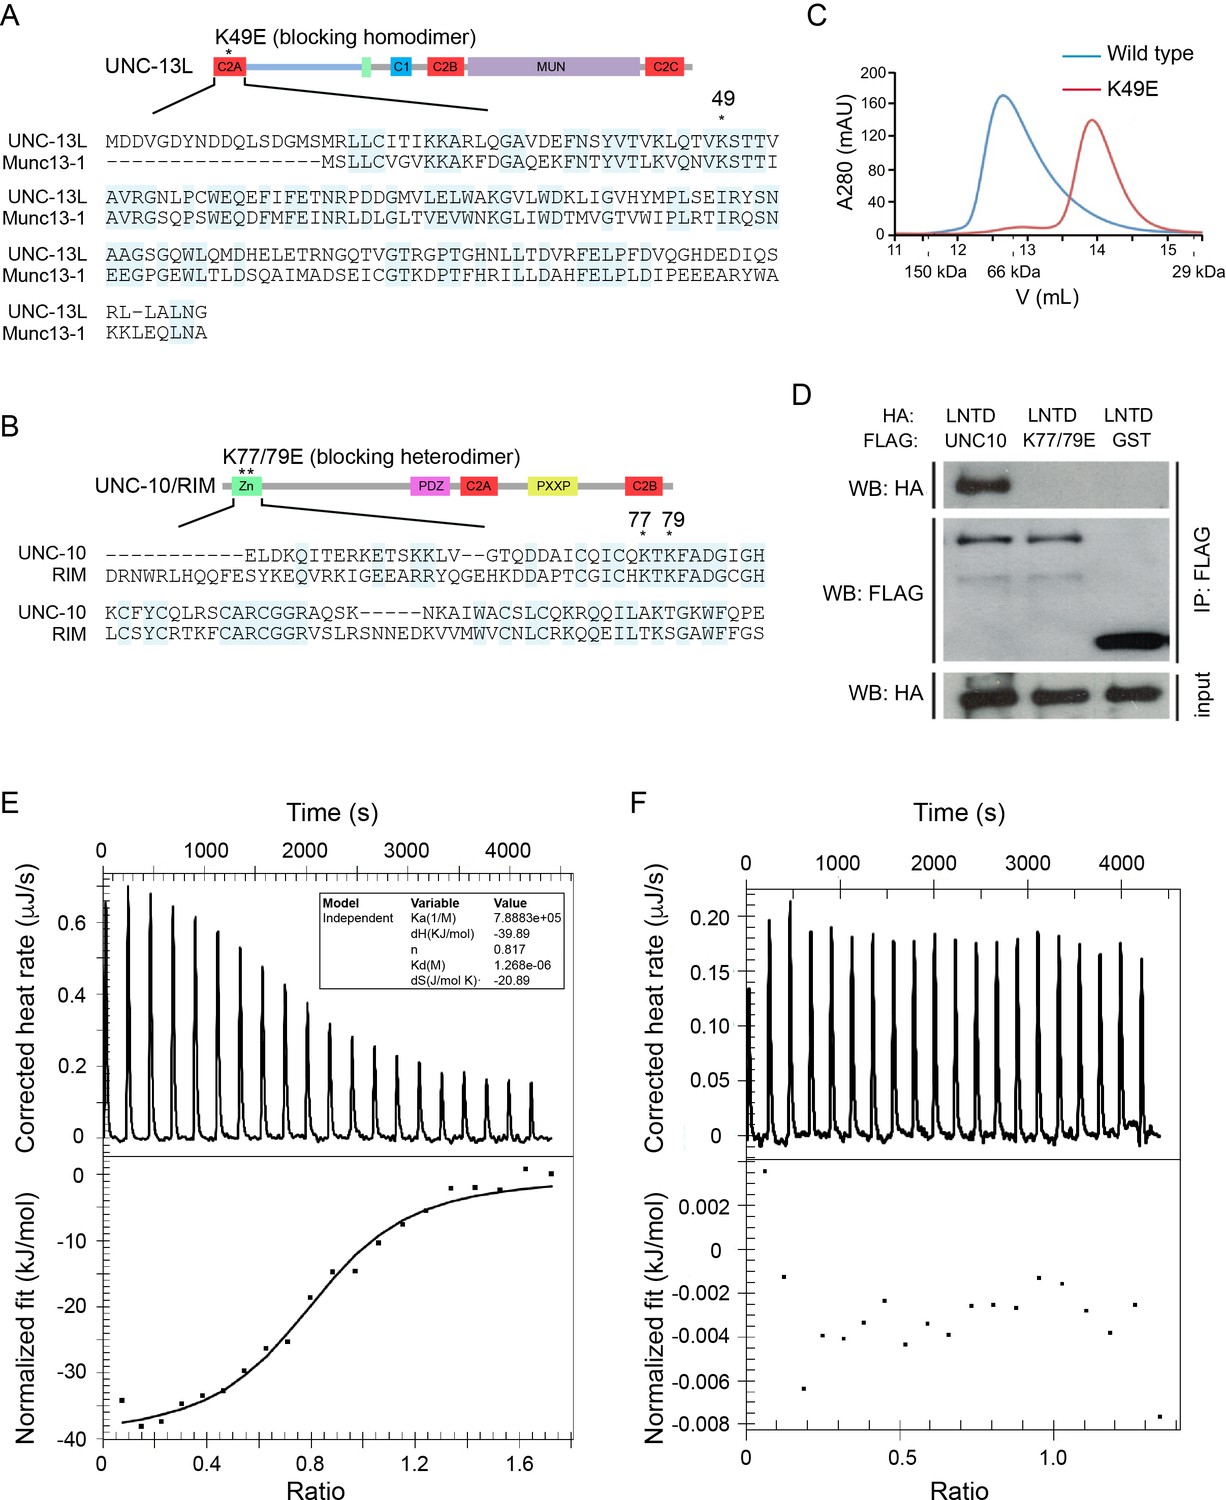
UNC-13L exhibits conserved homodimerization and heterodimerization in C. elegans.
(A, B) Sequence alignment of the C2A domain between worm UNC-13L and rat Munc13-1, and the zinc finger (ZF) domain between worm UNC-10 and mouse RIM1. The conserved residues in the C2A domain (K49) and the ZF domain (K77, K79) that disrupt homodimer and heterodimer formation are indicated by stars. (C) Separation of purified UNC-13L C2A monomer and homodimer by gel filtration. The wild-type C2A forms a homodimer that runs at 12.57 mL (blue trace, corresponding to an apparent weight of 89 kDa); this homodimer is disrupted in the monomeric UNC-13L(K49E) mutant which runs at 13.88 mL (apparent weight 52 kDa). Elution volumes of gel filtration standards are indicated underneath the plot, as follows: 11.62 mL for alcohol dehydrogenase (150 kDa), 12.85 mL for bovine serum albumin (66 kDa), and 15.45 mL for carbonic anhydrase (29 kDa), with the column void volume being 10.78 mL. (D) Co-immunoprecipitation (co-IP) shows that HA-LNTD (UNC-13L N-terminal domain, aa 1“605) binds wild-type FLAG-UNC-10 (aa 1–601) but not UNC-10(K77/79E) or GST. These results are representative of three independent experiments. (E, F) Isothermal titration calorimetry (ITC) analysis of binding of wild-type or mutated (K77/79E) UNC-10 with UNC-13L.
Figure 2
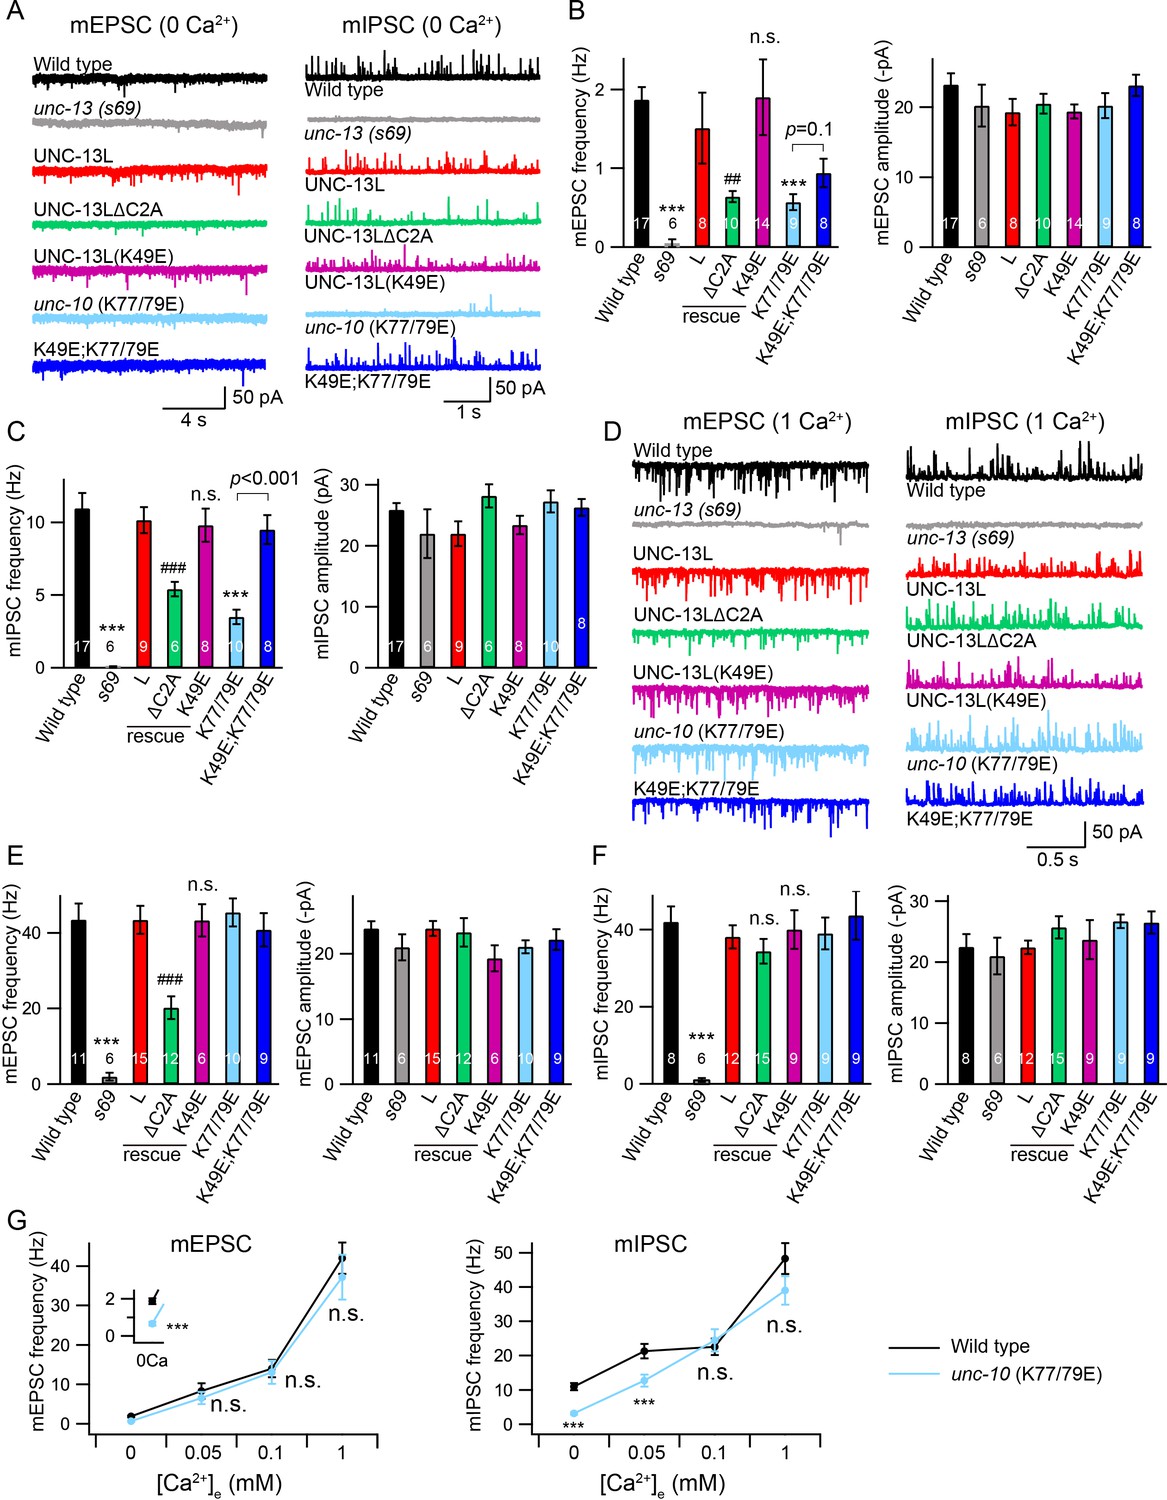
Tonic release is reduced by disrupting C2A/RIM heterodimerization in low Ca2+.
(A) Representative traces of mEPSCs and mIPSCs recorded at 0 mM Ca2+ from indicated genotypes. (B, C) Averaged frequency and amplitude of the mEPSCs and mIPSCs. (D) Representative traces of mEPSCs and mIPSCs recorded at 1 mM Ca2+ from the same genotypes in (A). (E, F) Quantification of the mEPSC and mIPSC frequency and amplitude from the genotypes in (D). Data are mean ± SEM (##, p < 0.01, ###, p < 0.001, n.s., non-significant when compared to UNC-13L rescue; ***, p < 0.001 when compared to wild-type; one-way ANOVA). The number of worms analyzed for each genotype is indicated in the bar graphs. (G) Quantification of the mEPSC and mIPSC frequencies at various Ca2+ levels (0, 0.05, 0.1, and 1 mM) from wild-type (black) and unc-10(nu487 K77/79E) mutants (red). Data are mean ± SEM (***, p < 0.001, n.s., non-significant when compared to wild-type; student’s t-test).
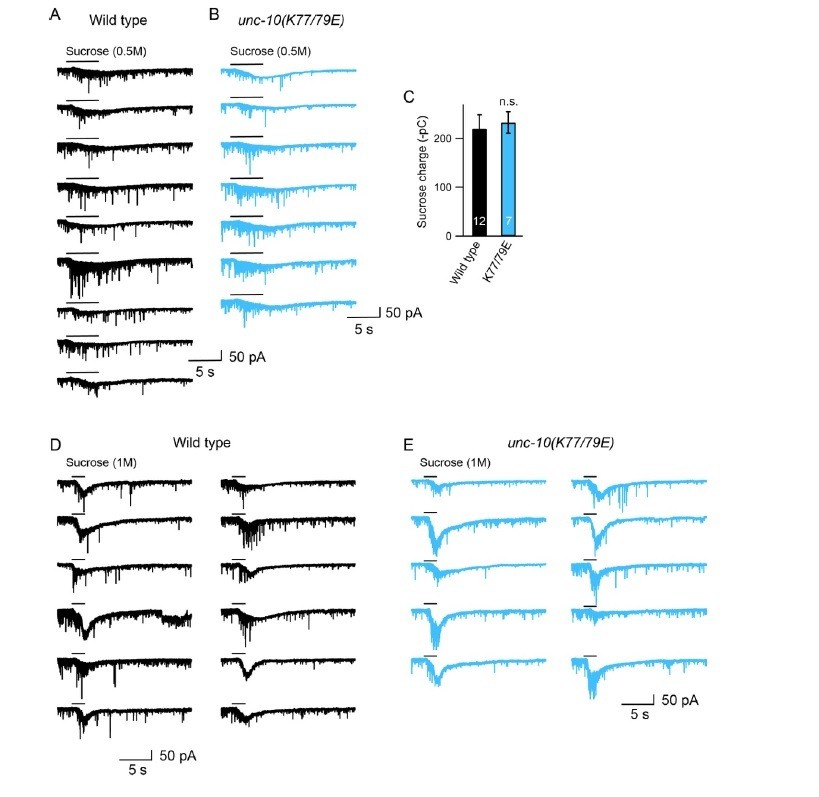
Figure 3 with 1 supplement
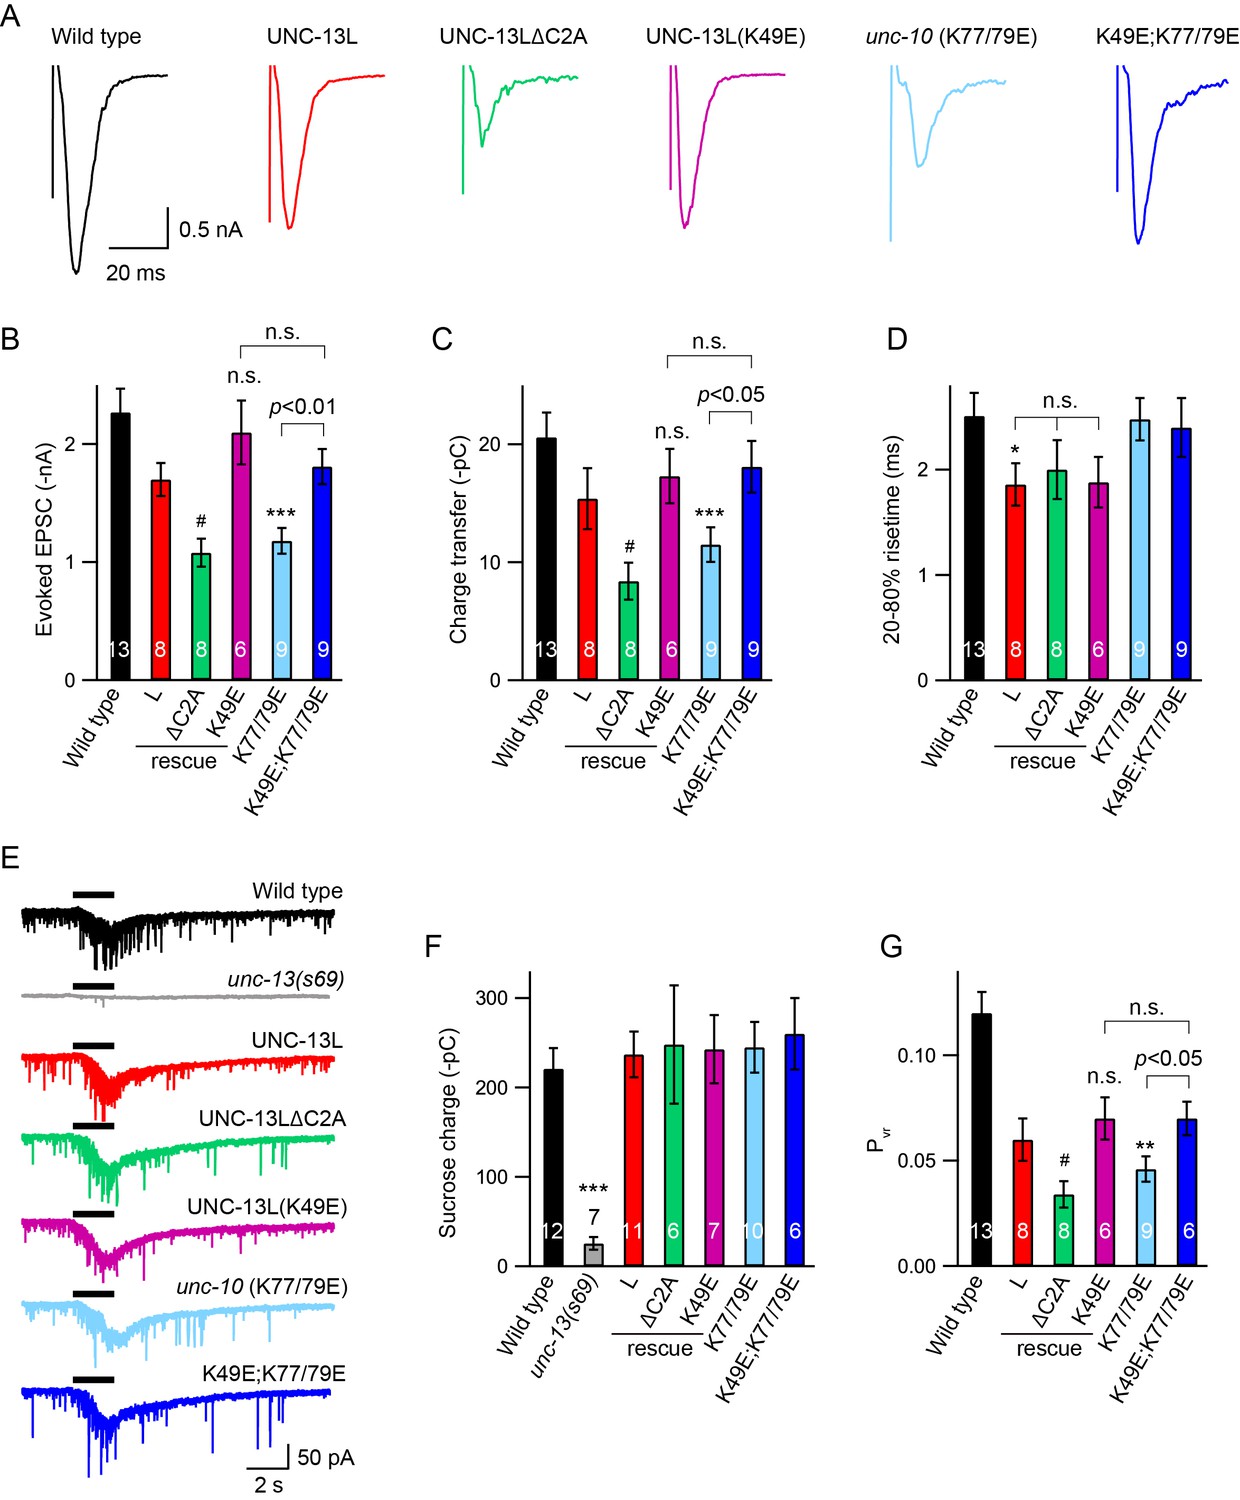
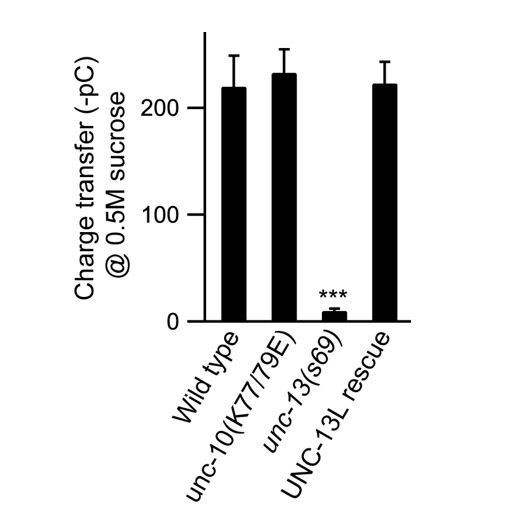
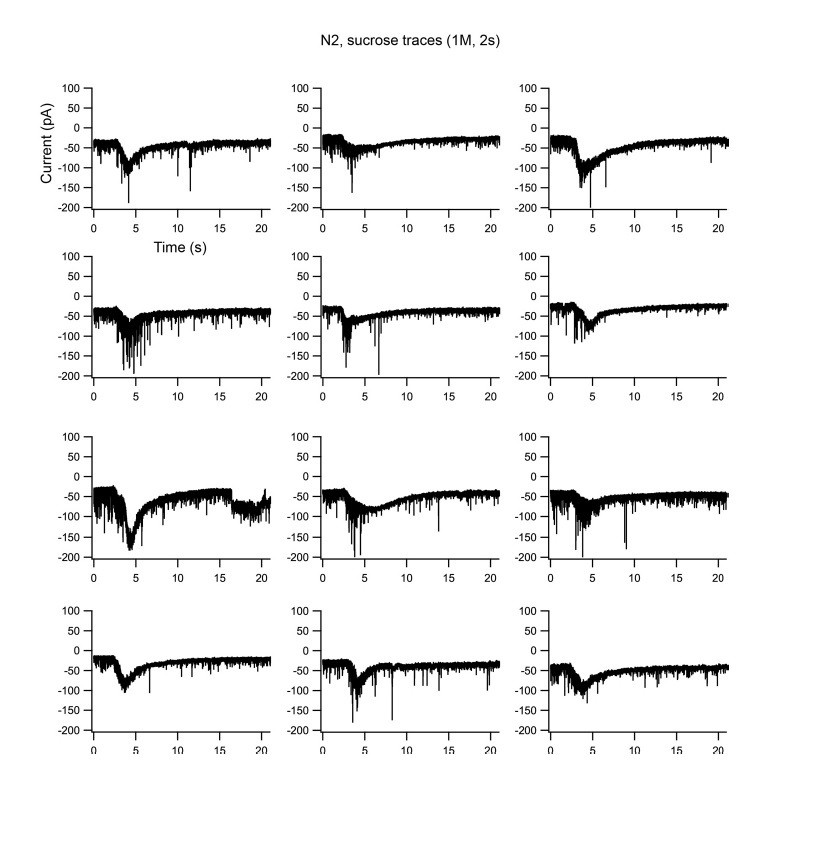
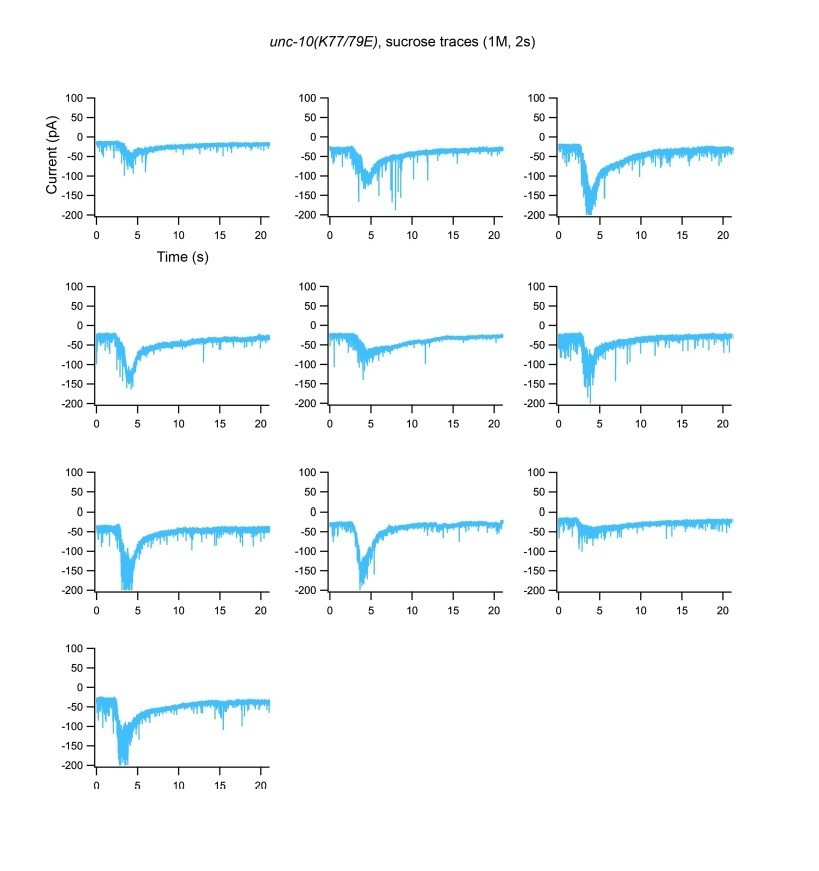
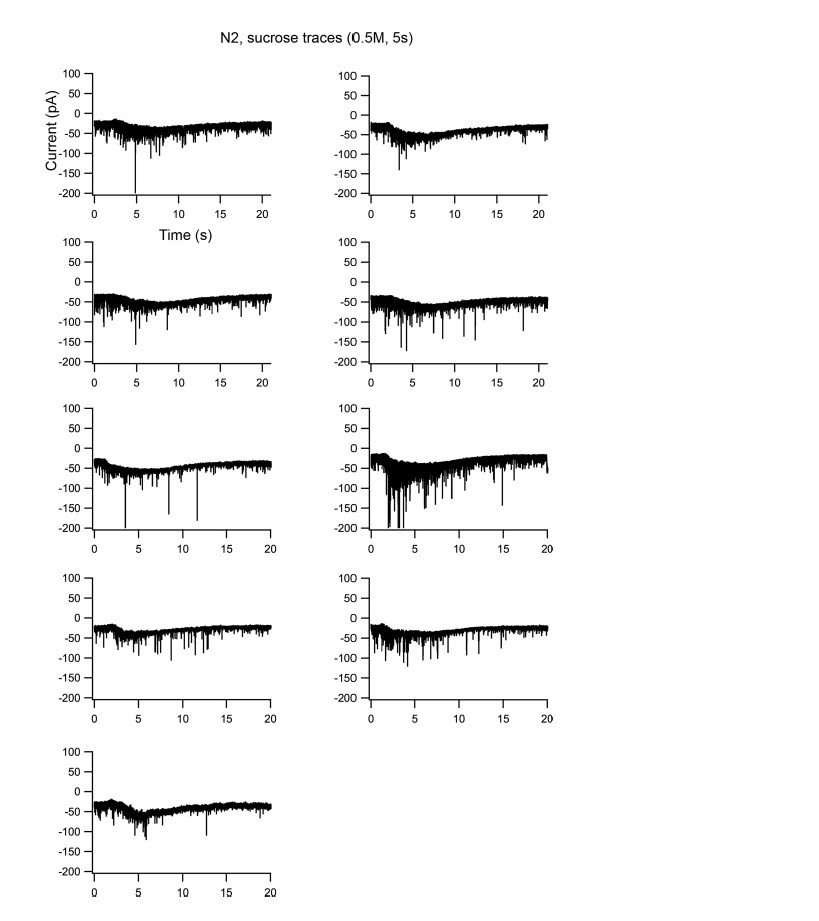
Effects of homodimerization and heterodimerization on evoked neurotransmitter release.
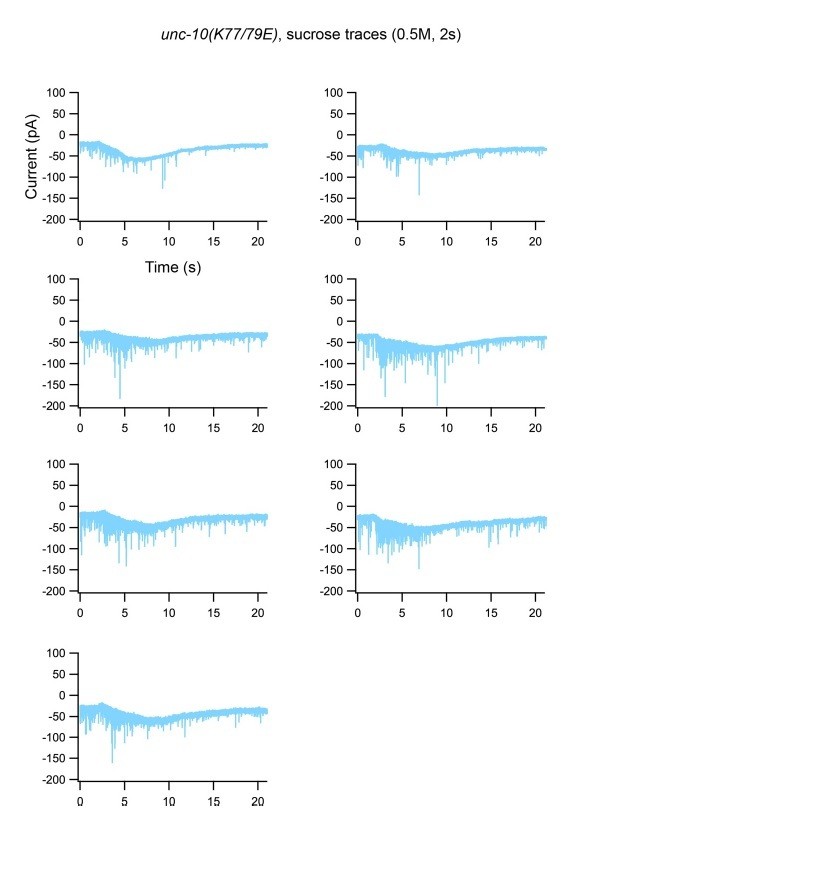
Electronic stimulus and hypertonic sucrose-evoked EPSCs were recorded from the body wall muscle of adult animals in 1 mM Ca2+. (A) Example traces of the evoked EPSCs from indicated genotypes. (B–D) Quantification of the amplitude, charge transfer and 20–80% risetime of the evoked EPSCs in (A). Example traces and averaged charge transfer of the sucrose-evoked EPSCs from the same genotypes in (A) are shown in (E) and (F). (G) Quantification of the probability of SV release (Pvr). Data are mean ± SEM (*, p < 0.05, **, p < 0.01, ***, p < 0.001 when compared to wild-type; #, p < 0.05, n.s., non-significant when compared to UNC-13L rescue; one-way ANOVA).
Figure 3—figure supplement 1
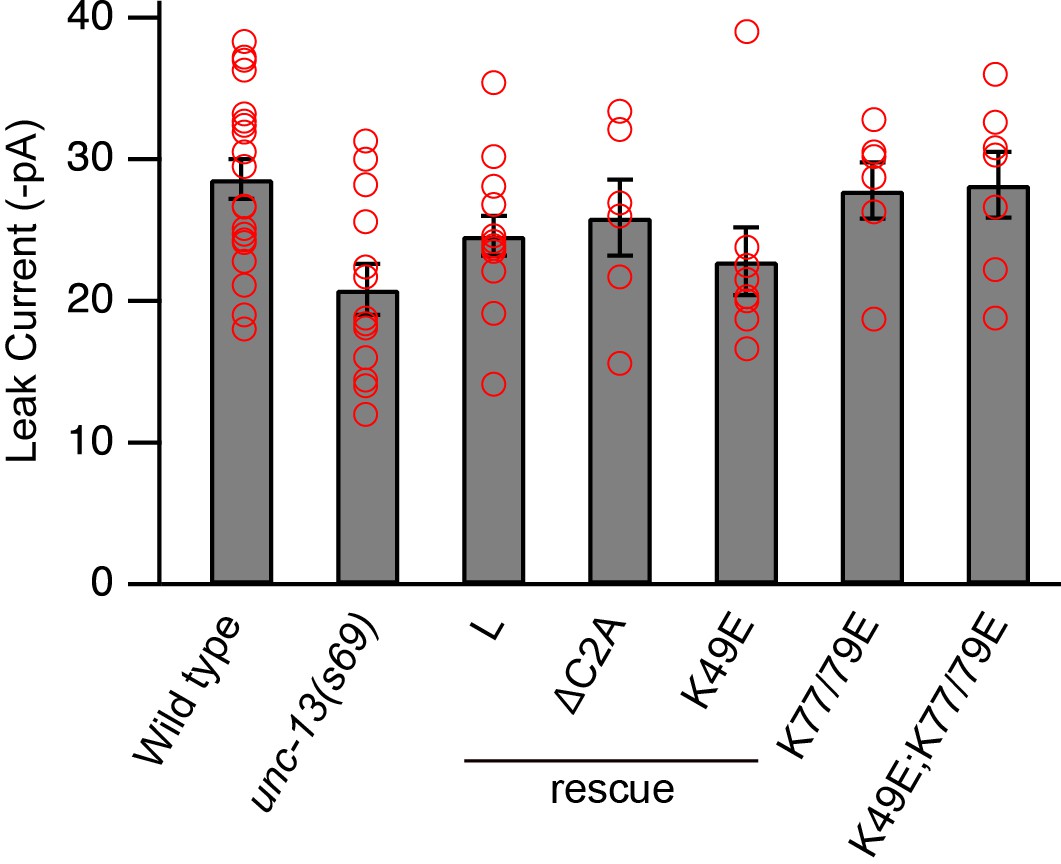
Quantification of the leak currents from sucrose responses.
The distribution of the data for each genotype was added onto the corresponding bar graph. Each small circle represents an individual data. Data are mean ± SEM.
Figure 4 with 1 supplement
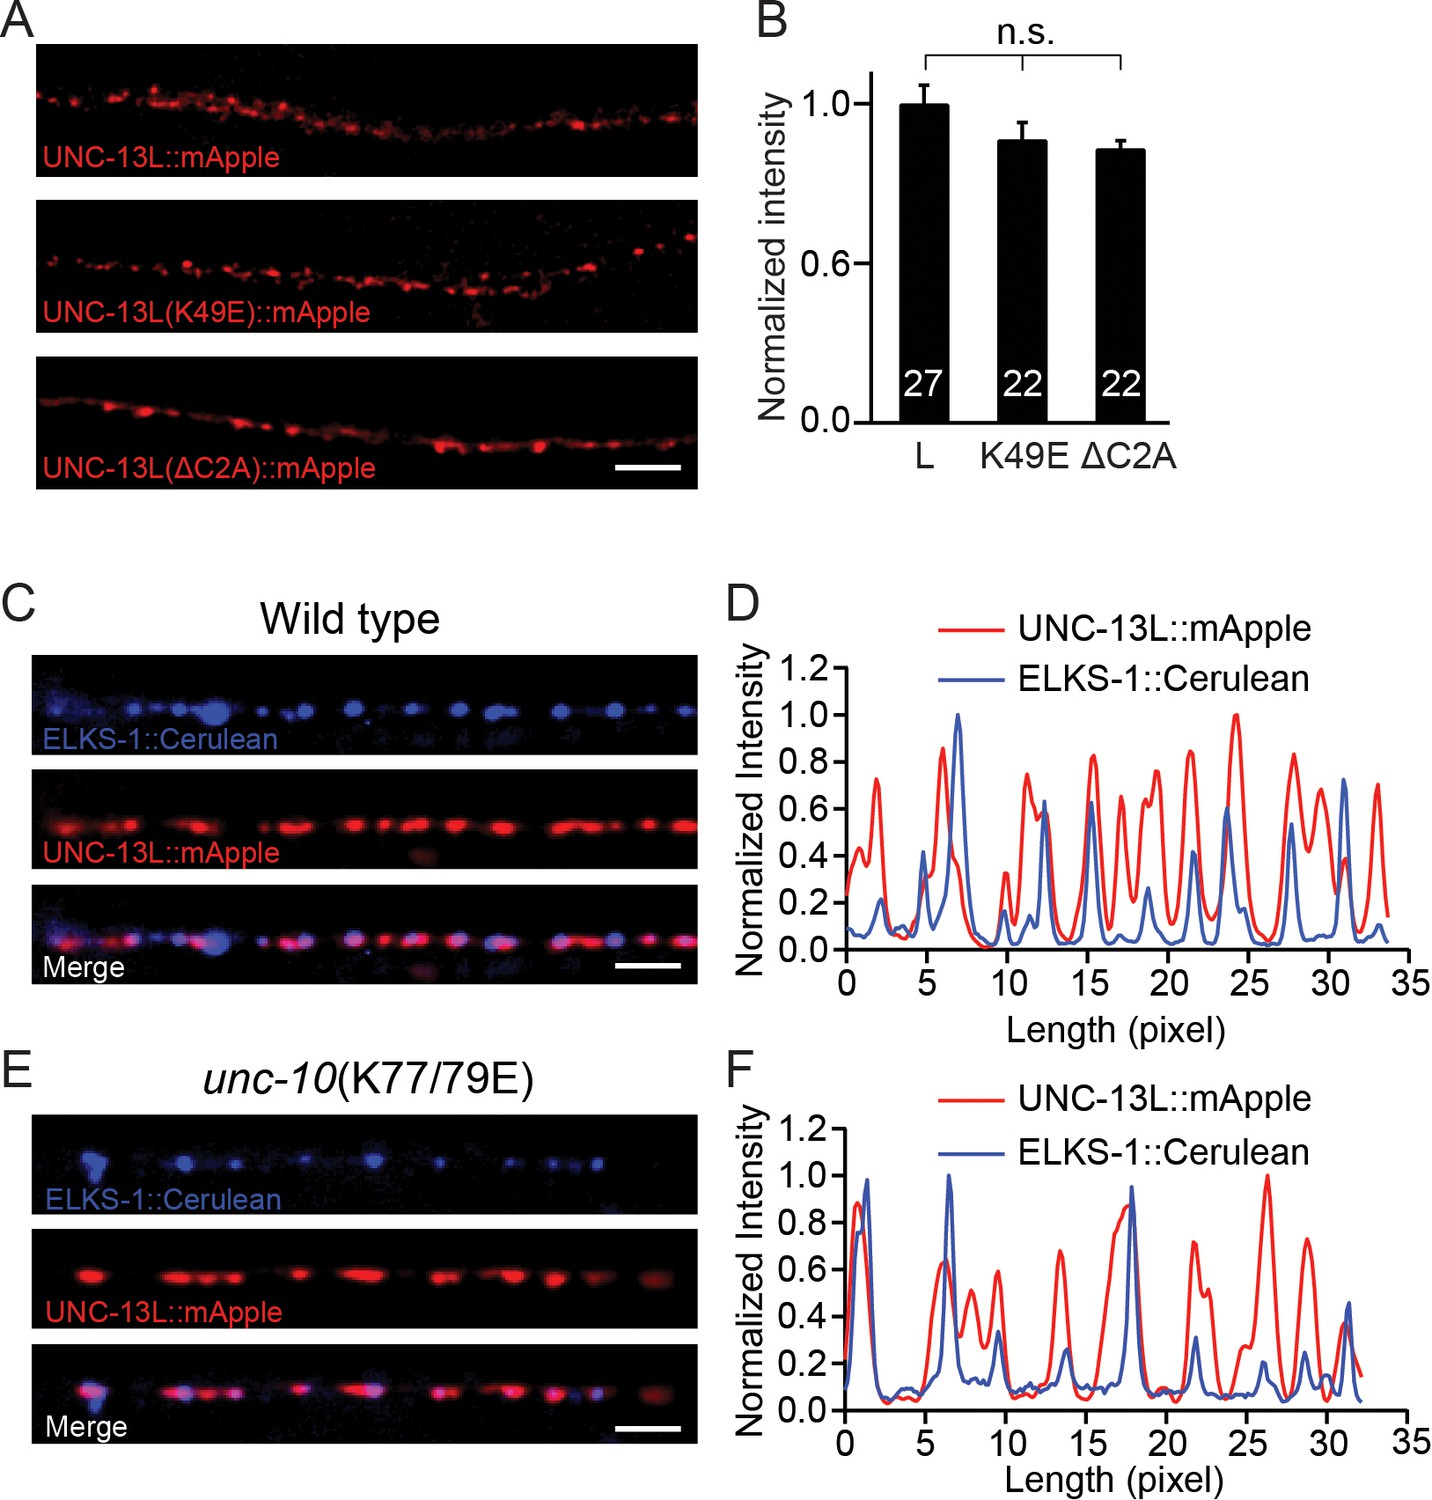
Expression of UNC-13 transgenic constructs and effects of disrupting UNC-13L/RIM heterodimerization on sub-localization of UNC-13L.
(A) Presynaptic distribution of UNC-13 at the dorsal nerve cord in unc-13 animals rescued by the indicated transgenic constructs. Scale bar, 5 μm. (B) Quantification of the mApple fluorescence intensity from the transgenic rescue lines in (A). (C) Representative confocal Z-stack images for UNC-13L and ELKS-1 in wild-type background. Scale bar, 5 μm. (D) Line scans along the dorsal nerve cord. (E) Representative confocal Z-stack images for UNC-13L and ELKS-1 in unc-10(K77/79E) mutants. (F) Line scans along the dorsal nerve cord. Data are mean ± SEM (n.s., non-significant; one-way ANOVA). The number of worms analyzed for each genotype is indicated in the bar graphs.
Figure 4—figure supplement 1
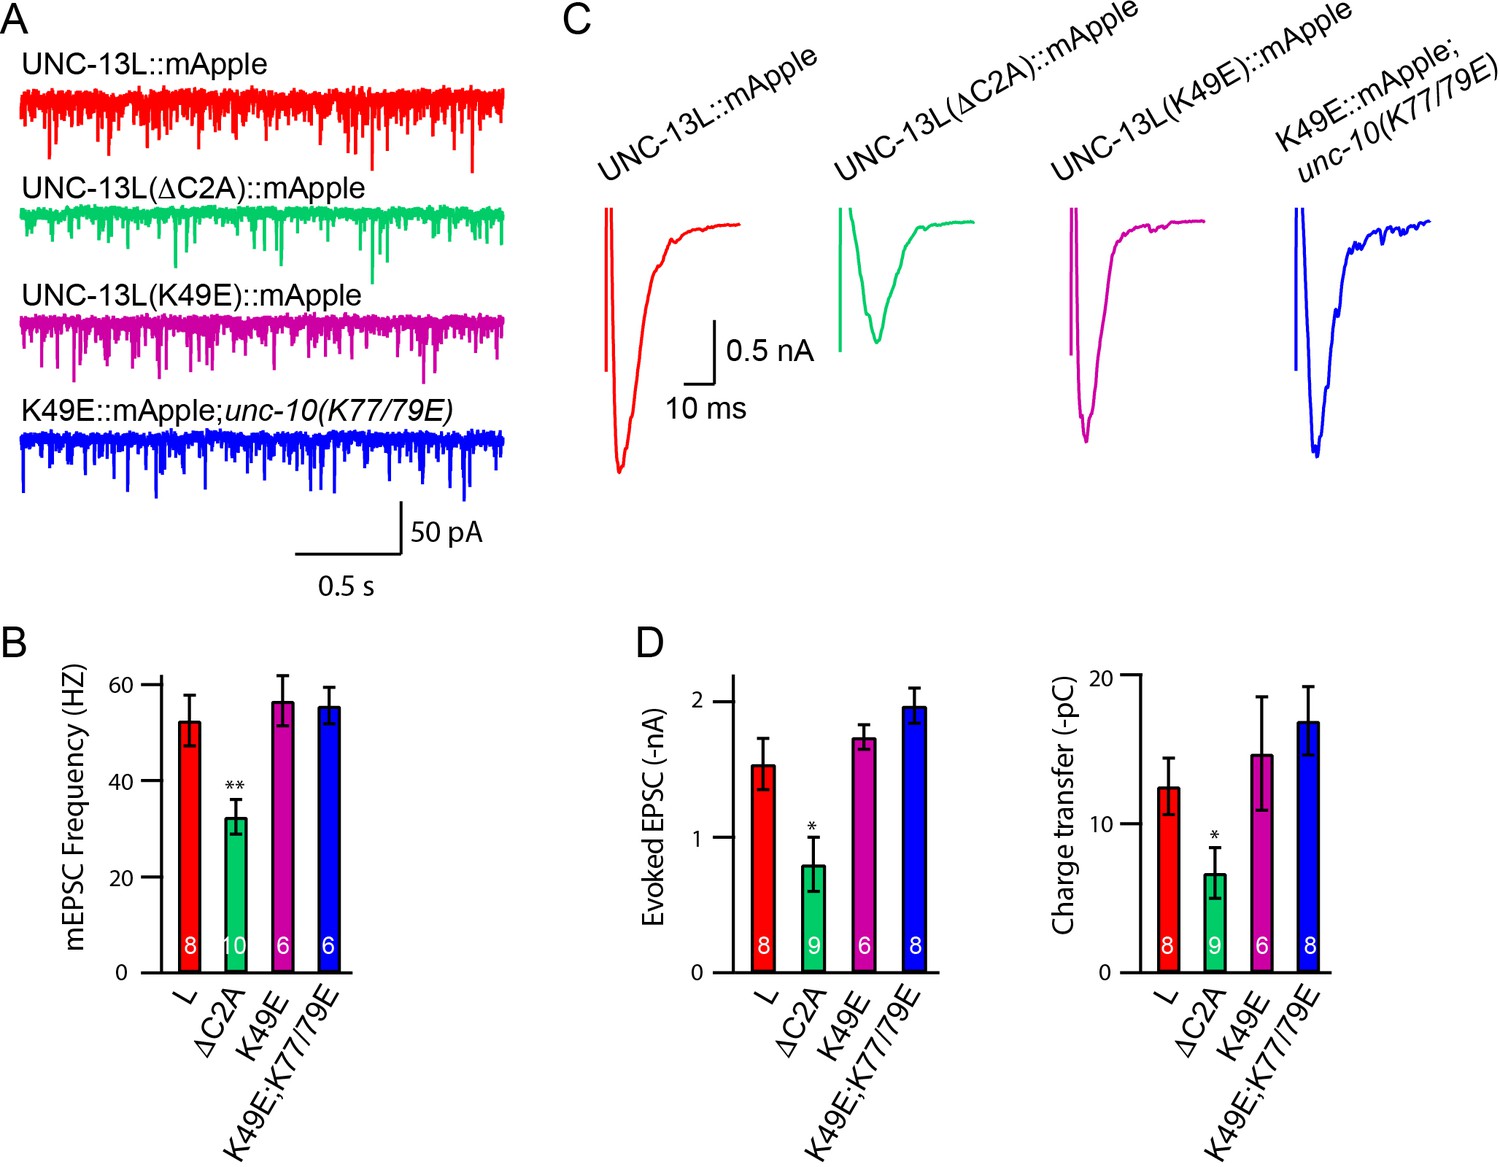
UNC-13 proteins with C-terminal tags are fully functional in mediating SV release.
Both mEPSCs and evoked EPSCs were recorded from the unc-13 mutants rescued by mApple-tagged UNC-13 proteins. (A) Representative traces of mEPSCs recorded at 1 mM Ca2+ from the indicated genotypes. (B) Quantification of the mEPSC frequency from the genotypes in (A). (C) Example traces of the evoked EPSCs from indicated genotypes. (D) Quantification of the amplitude and charge transfer of the evoked EPSCs in (C). Data are mean ± SEM (*, p < 0.05, **, p < 0.01 when compared to the UNC-13L rescue; one-way ANOVA). The number of worms analyzed for each genotype is indicated in the bar graphs.
Figure 5
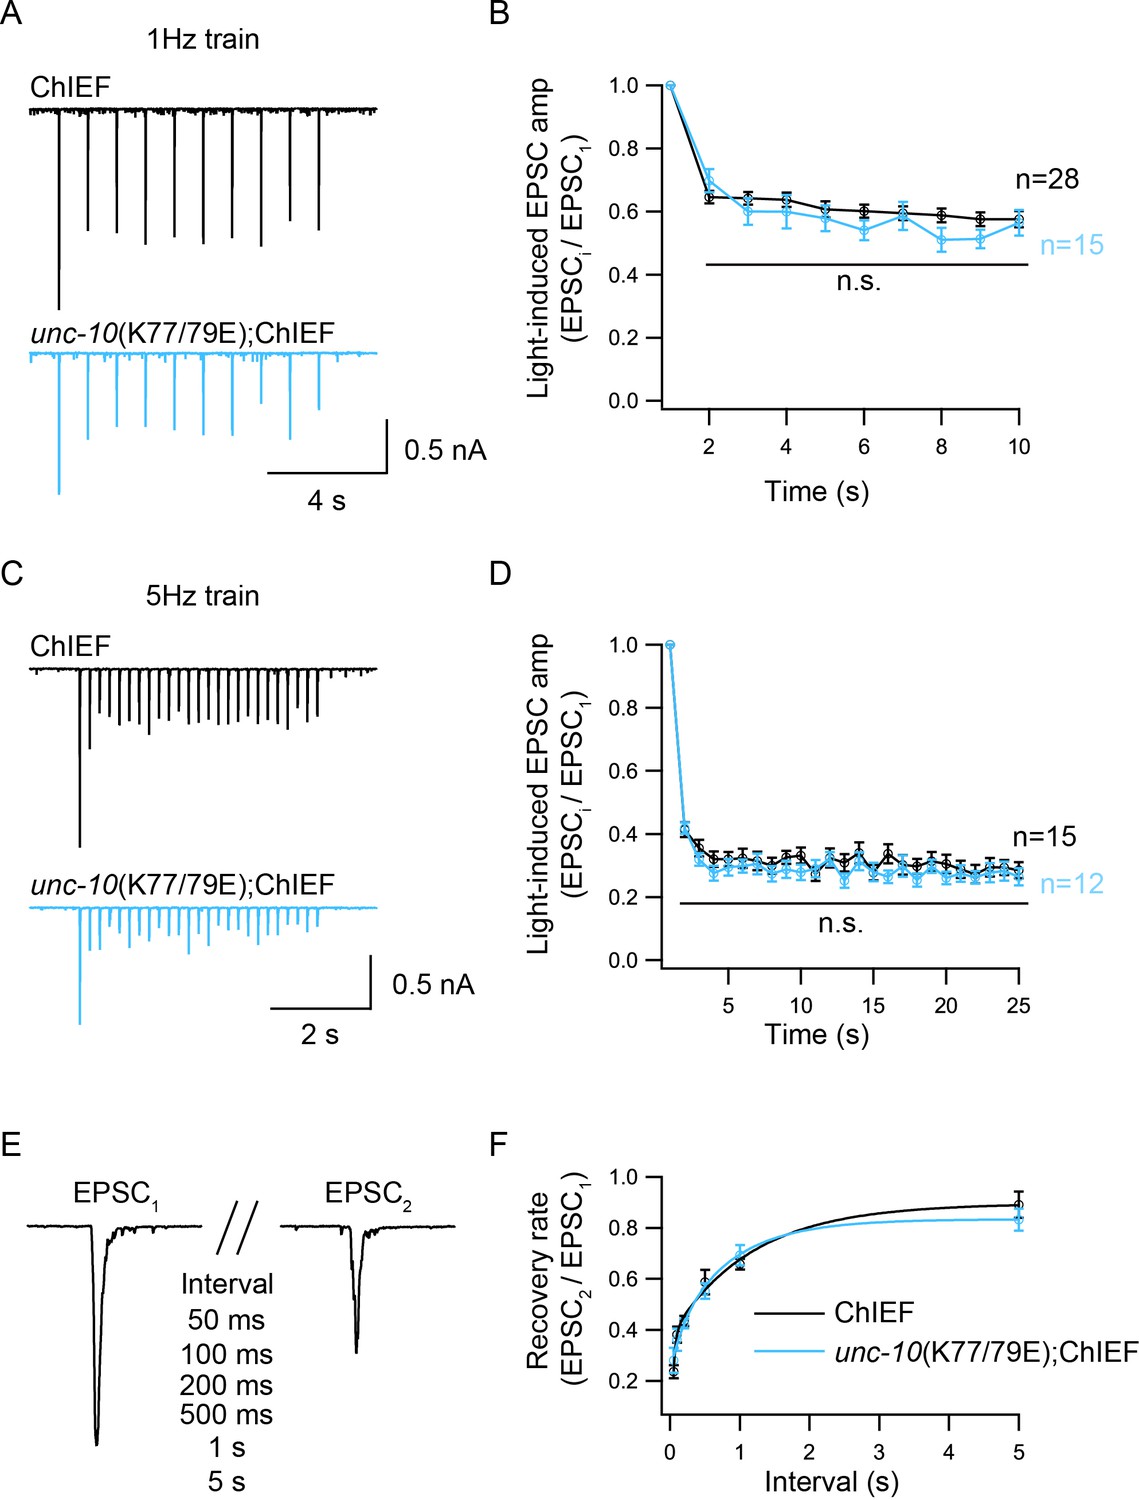
Synaptic depression and recovery are unaltered by disrupting C2A/RIM heterodimerization.
Synaptic depression and recovery were investigated by applying a train (1 Hz or 5 Hz) or a paired light stimulus onto the ventral nerve cord of the adult worms with expression of ChIEF in cholinergic motor neurons. (A, C) Example traces of 1 Hz and 5 Hz light train stimulus-evoked EPSCs (black, wild-type; red, unc-10(K77/79E) mutants). (B, D) Quantification of synaptic depression by normalizing the EPSC amplitude (EPSCi) to the first EPSC amplitude (EPSC1). (E) Evoked EPSCs triggered by a paired light stimulus with various intervals ranging from 0.05 s to 5 s. (D) Synaptic recovery calculated by the ratio of EPSC2 to EPSC1 (wild-type, 50 ms = 7, 100 ms = 8, 200 ms = 11, 500 ms n = 7, 1 s n = 18, 5 s n = 8; unc-10(nu487 K77/79E) mutant, 50 ms = 5, 100 ms = 7, 200 ms = 11, 500 ms n = 10, 1 s n = 14, 5 s n = 7). Data are mean ± SEM (n.s., non-significant when compared to wild-type; student’s t-test).
Author response image 1
Author response image 2
Author response image 3
Author response image 4
Author response image 5
Author response image 6
Tables
Table 1
Comparison of SV release.
https://doi.org/10.7554/eLife.40585.004| Tonic release | Evoked EPSC | RRP | Pvr | |||||||||
|---|---|---|---|---|---|---|---|---|---|---|---|---|
| mEPSC (0 mM Ca2+) | mEPSC (1 mM Ca2+) | mIPSC (0 mM Ca2+) | mIPSC (1 mM Ca2+) | |||||||||
| Frequency (Hz) | Amplitude (-pA) | Frequency (Hz) | Amplitude (-pA) | mIPSC (Hz) | Amplitude (pA) | mIPSC (Hz) | Amplitude (pA) | Amplitude (-nA) | Charge (-pC) | Charge (-pC) | ||
| Wild-type | 1.87 ± 0.16 | 23.2 ± 1.6 | 43.5 ± 4.3 | 23.9 ± 1.1 | 11 ± 1.1 | 25.9 ± 1.1 | 42.5 ± 4.1 | 22.5 ± 2.1 | 2.27 ± 02. | 20.6 ± 2.1 | 221 ± 23.1 | 0.12 ± 0.01 |
| unc-13(s69) | 0.05 ± 0.05 | 20.2 ± 3 | 2 ± 1 | 21.1 ± 2.1 | 0.05 ± 0.05 | 22.1 ± 4.1 | 1.1 ± 0.5 | 21.5 ± 3.2 | 0.02 ± 0.01 | 0.05 ± 0.01 | 25.5 ± 7.1 | 0 |
| UNC-13L | 1.51 ± 0.45 | 19.3 ± 1.9 | 43.4 ± 3.7 | 23.9 ± 1.1 | 10.1 ± 0.9 | 22.3 ± 2.2 | 38.1 ± 3.5 | 22.4 ± 1.1 | 1.7 ± 0.14 | 15.4 ± 2.6 | 237 ± 25.4 | 0.06 ± 0.01 |
| UNC-14LΔC2A | 0.64 ± 0.07 | 20.5 ± 1.4 | 20.2 ± 3 | 23.3 ± 2.2 | 5.4 ± 0.5 v | 28.2 ± 1.9 | 34.4 ± 3.2 | 25.7 ± 1.8 | 1.08 ± 0.12 | 8.4 ± 1.6 | 248 ± 66.3 | 0.034 ± 0.006 |
| UNC-13L(K49E) | 1.9 ± 0.48 | 19.4 ± 1.1 | 43.3 ± 4.3 | 19.3 ± 2.4 | 9.8 ± 1.2 | 23.4 ± 1.5 | 40.6 ± 5.1 | 23.7 ± 3.2 | 2.1 ± 0.27 | 17.3 ± 2.3 | 243 ± 38.3 | 0.07 ± 0.01 |
| unc-10(K77/79E) | 0.57 ± 0.1 | 20.2 ± 1.8 | 45.4 ± 3.7 | 21.1 ± 1.2 | 3.5 ± 0.5 | 27.3 ± 1.8 | 39.7 ± 4.1 | 26.7 ± 1.1 | 1.18 ± 0.11 | 11.5 ± 1.5 | 245 ± 28.2 | 0.046 ± 0.006 |
| K49E;K77/79E | 0.94 ± 0.18 | 23.1 ± 1.5 | 40.8 ± 4.4 | 22.2 ± 1.6 | 9.5 ± 1 | 26.3 ± 1.4 | 43.7 ± 6.3 | 26.5 ± 1.8 | 1.81 ± 0.15 | 18.1 ± 2.2 | 260 ± 40 | 0.07 ± 0.008 |
-
All data were collected from three independent experiments to ensure the observed phenotype are replicable.
Additional files
-
Transparent reporting form
- https://doi.org/10.7554/eLife.40585.010
Download links
A two-part list of links to download the article, or parts of the article, in various formats.
Downloads (link to download the article as PDF)
Open citations (links to open the citations from this article in various online reference manager services)
Cite this article (links to download the citations from this article in formats compatible with various reference manager tools)
Heterodimerization of UNC-13/RIM regulates synaptic vesicle release probability but not priming in C. elegans
eLife 8:e40585.
https://doi.org/10.7554/eLife.40585


