Measuring cis-regulatory energetics in living cells using allelic manifolds
- Cold Spring Harbor Laboratory, United States
- California Institute of Technology, United States
Figures
Figure 1
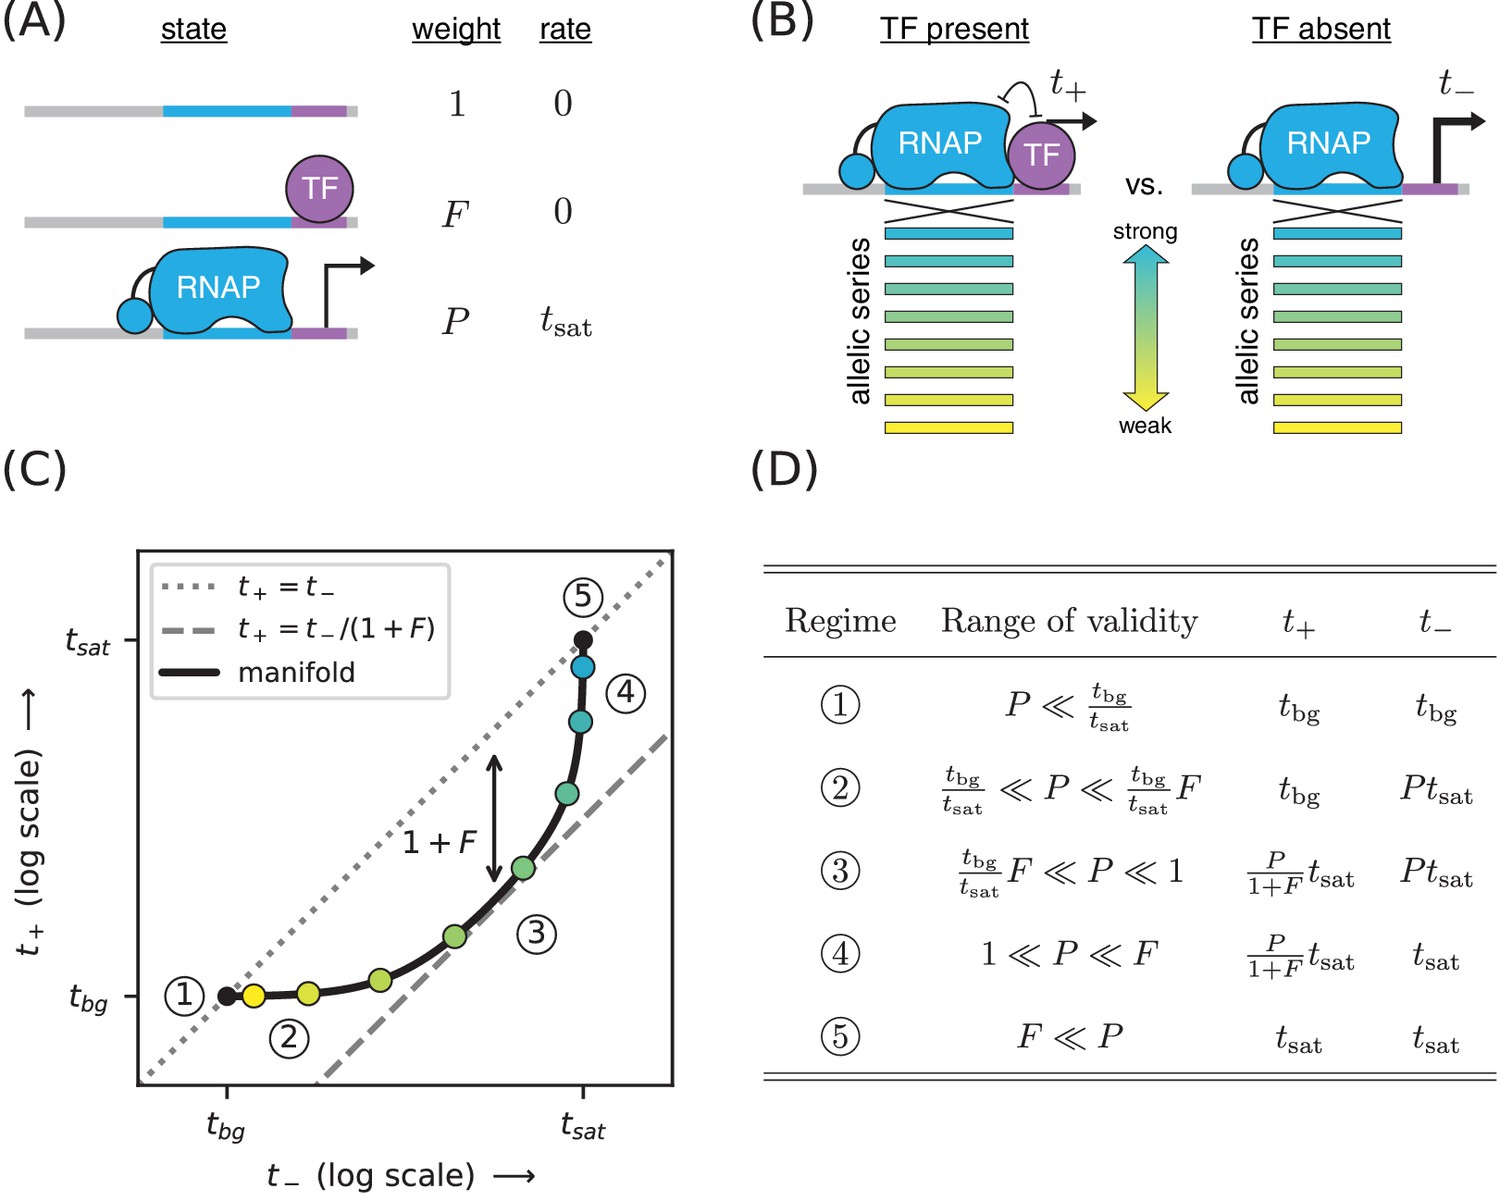
Strategy for measuring TF-DNA interactions.
(A) A thermodynamic model of simple repression. Here, promoter DNA can transition between three possible states: unbound, bound by a TF, or bound by RNAP. Each state has an associated Boltzmann weight and rate of transcript initiation. is the TF binding factor and is the RNAP binding factor; see text for a description of how these dimensionless binding factors relate to binding affinity and binding energy. is the rate of specific transcript initiation from a promoter fully occupied by RNAP. (B) Transcription is measured in the presence () and absence () of the TF. Measurements are made for an allelic series of RNAP binding sites that differ in their binding strengths (blue-yellow gradient). (C) If the model in panel A is correct, plotting vs. for the promoters in panel B (colored dots) will trace out a 1D allelic manifold. Mathematically, this manifold reflects Equation 1 and Equation 2 computed over all possible values of the RNAP binding factor while the other parameters (, ) are held fixed. Note that these equations include a background transcription term ; it is assumed throughout that and that is independent of RNAP binding site sequence. The resulting manifold exhibits five distinct regimes (circled numbers), corresponding to different ranges for the value of that allow the mathematical expressions in Equations 1 and 2 to be approximated by simplified expressions. In regime 3, for instance, , and thus the manifold approximately follows a line parallel (on a log-log plot) to the diagonal but offset below it by a factor of (dashed line). Data points in this regime can therefore be used to determine the value of . (D) The five regimes of the allelic manifold, including approximate expressions for and in each regime, as well as the range of validity for .
Figure 2

Precision measurement of in vivo CRP-DNA binding.
(A) Expression measurements were performed on promoters for which CRP represses transcription by occluding RNAP. Each promoter assayed contained a near-consensus CRP binding site centered at either +0.5 bp or +4.5 bp, as well as an RNAP binding site with a partially mutagenized −35 region (gradient). (or ) denotes measurements made using E. coli strain JK10 grown in the presence (or absence) of the small molecule cAMP. (B) Dots indicate measurements for 41 such promoters. A best-fit allelic manifold (black) was inferred from of these data points after the exclusion of 2 outliers (gray ‘X’s). Gray lines indicate 100 plausible allelic manifolds fit to bootstrap-resampled data points. The parameters of these manifolds were used to determine the CRP-DNA binding factor and thus the Gibbs free energy . Error bars indicate 68% confidence intervals determined by bootstrap resampling. See Appendix 3 for more information about our manifold fitting procedure.
Figure 3
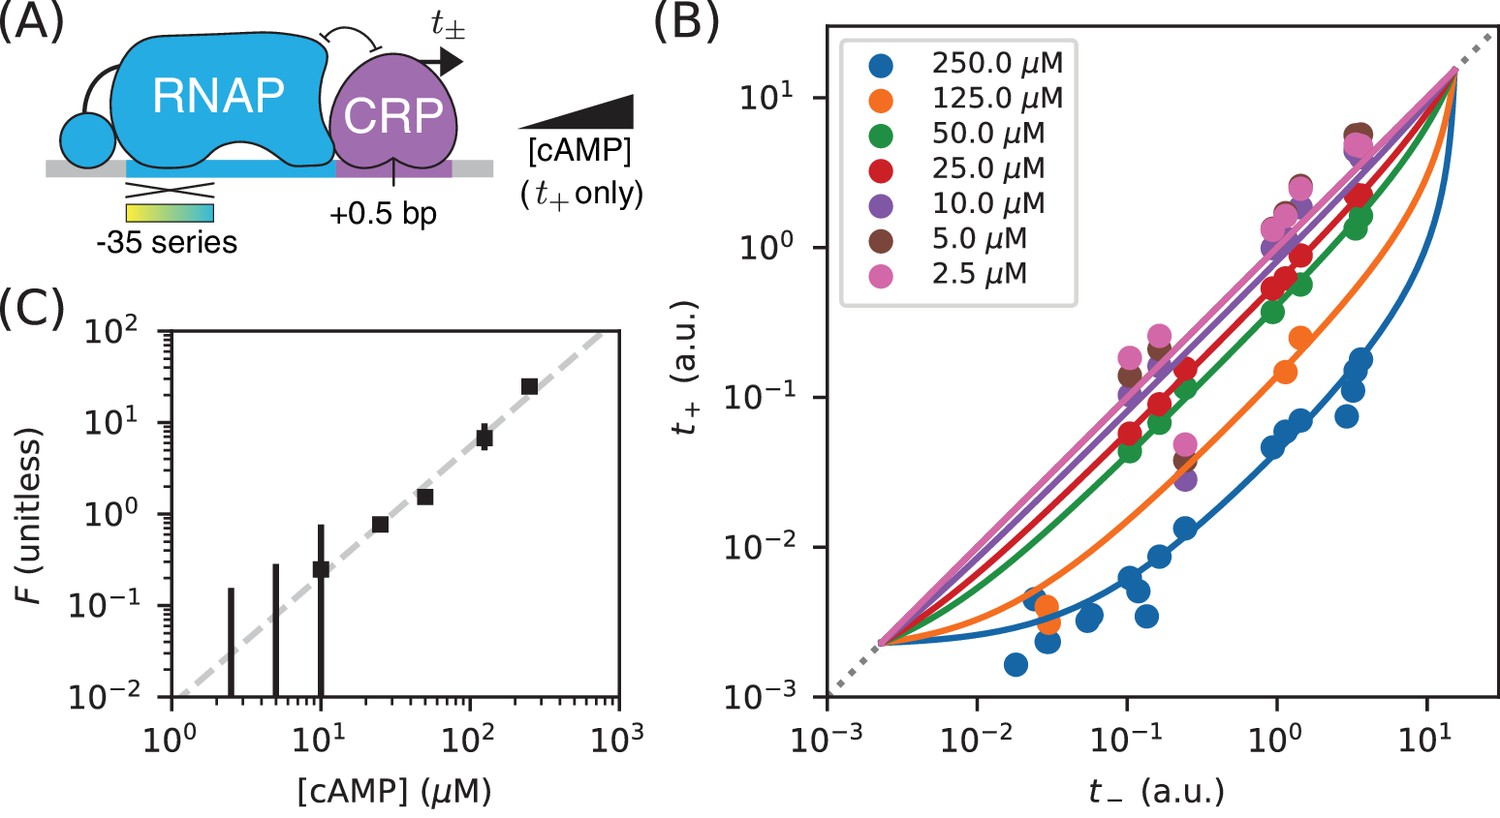
Measuring in vivo changes in TF concentration.
(A) Allelic manifolds were measured for the +0.5 bp occlusion promoter architecture using seven different concentrations of cAMP (ranging from 2.5 µM to 250 µM) when assaying . (B) As expected, these data follow allelic manifolds that have cAMP-dependent values for the CRP binding factor . (C) Values for inferred from the data in panel B exhibit a nontrivial power law dependence on [cAMP]. Error bars indicate 68% confidence intervals determined by bootstrap resampling.
Figure 4
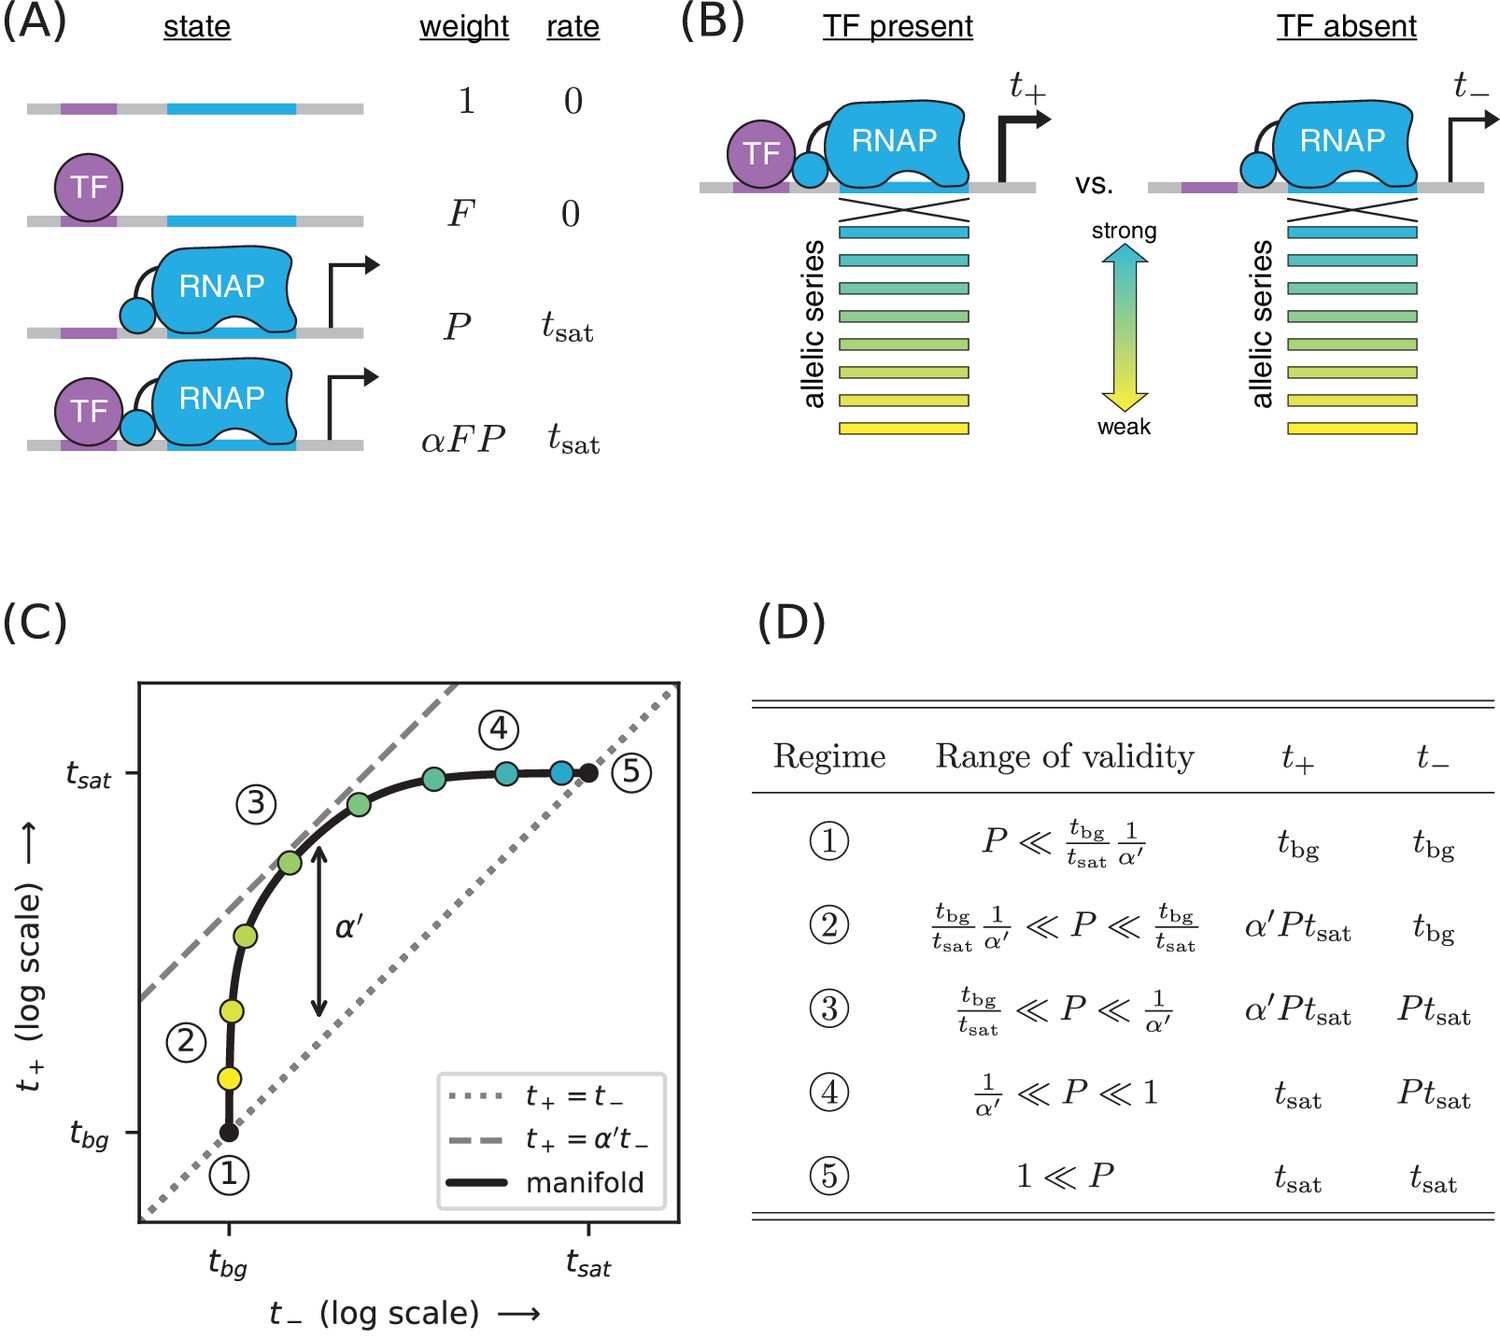
Strategy for measuring TF-RNAP interactions.
(A) A thermodynamic model of simple activation. Here, promoter DNA can transition between four different states: unbound, bound by the TF, bound by RNAP, or doubly bound. As in Figure 1, is the TF binding factor, is the RNAP binding factor, and is the rate of transcript initiation from an RNAP-saturated promoter. The cooperativity factor quantifies the strength of the interaction between DNA-bound TF and RNAP molecules; see text for more information on this quantity. (B) As in Figure 1, expression is measured in the presence () and absence () of the TF for promoters that have an allelic series of RNAP binding sites (blue-yellow gradient). (C) If the model in panel A is correct, plotting vs. (colored dots) will reveal a 1D allelic manifold that corresponds to Equation 4 (for ) and Equation 2 (for ) evaluated over all possible values of . Circled numbers indicate the five regimes of this manifold. In regime 3, where is the renormalized cooperativity factor given in Equation 5; data in this regime can thus be used to measure . Separate measurements of , using the strategy in Figure 1, then allow one to compute from knowledge of . (D) The five regimes of the allelic manifold in panel C. Note that these regimes differ from those in Figure 1D.
Figure 5
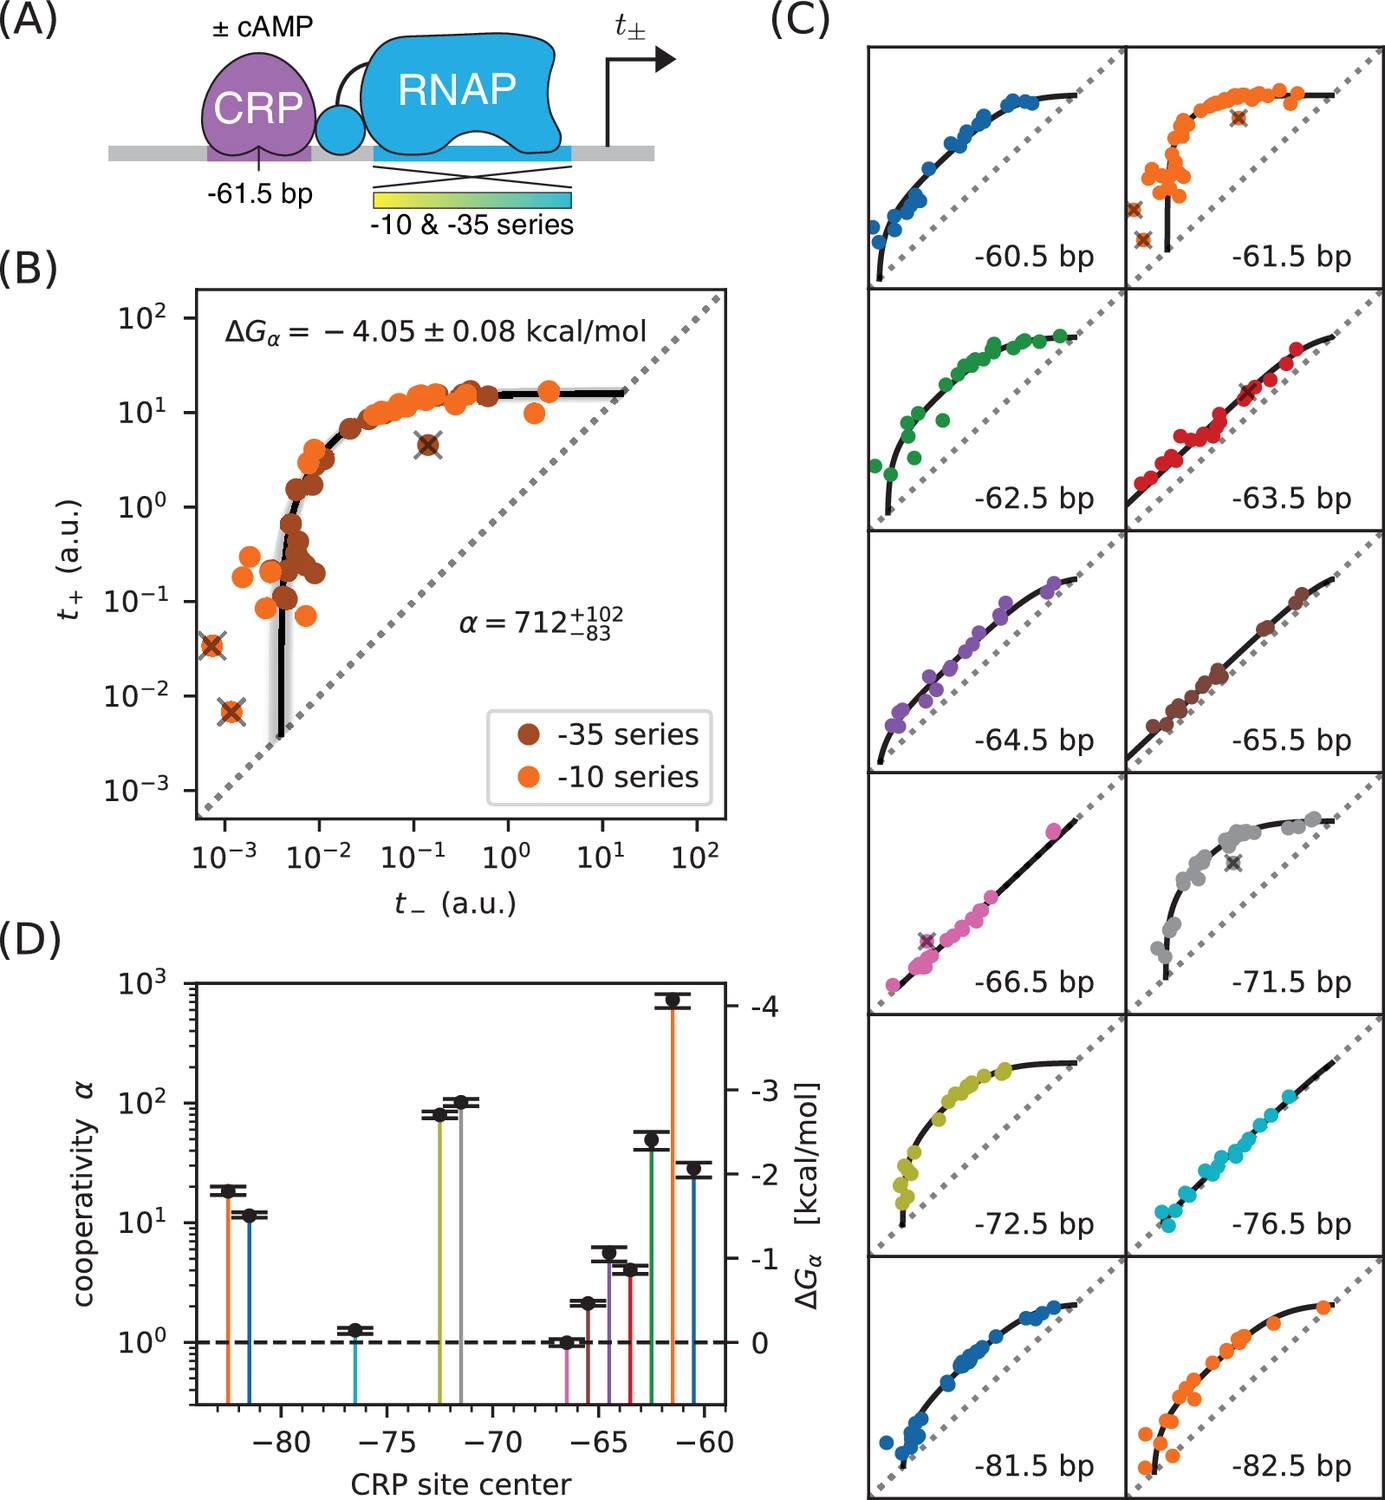
Precision measurement of class I CRP-RNAP interactions.
(A) and were measured for promoters containing a CRP binding site centered at −61.5 bp. The RNAP sites of these promoters were mutagenized in either their −10 or −35 regions (gradient), generating two allelic series. As in Figure 2, and correspond to expression measurements respectively made in the presence and absence of cAMP. (B) Data obtained for 47 variant promoters having the architecture shown in panel A. Three data points designated as outliers are indicated by ‘X’s. The allelic manifold that best fits the non-outlier points is shown in black; 100 plausible manifolds, estimated from bootstrap-resampled data points, are shown in gray. The resulting values for and are also shown, with 68% confidence intervals indicated. (C) Allelic manifolds obtained for promoters with CRP binding sites centered at a variety of class I positions. (D) Inferred values for the cooperativity factor and corresponding Gibbs free energy for the 12 different promoter architectures assayed in panel C. Error bars indicate 68% confidence intervals. Numerical values for and at all of these class I positions are provided in Table 1.
Figure 6
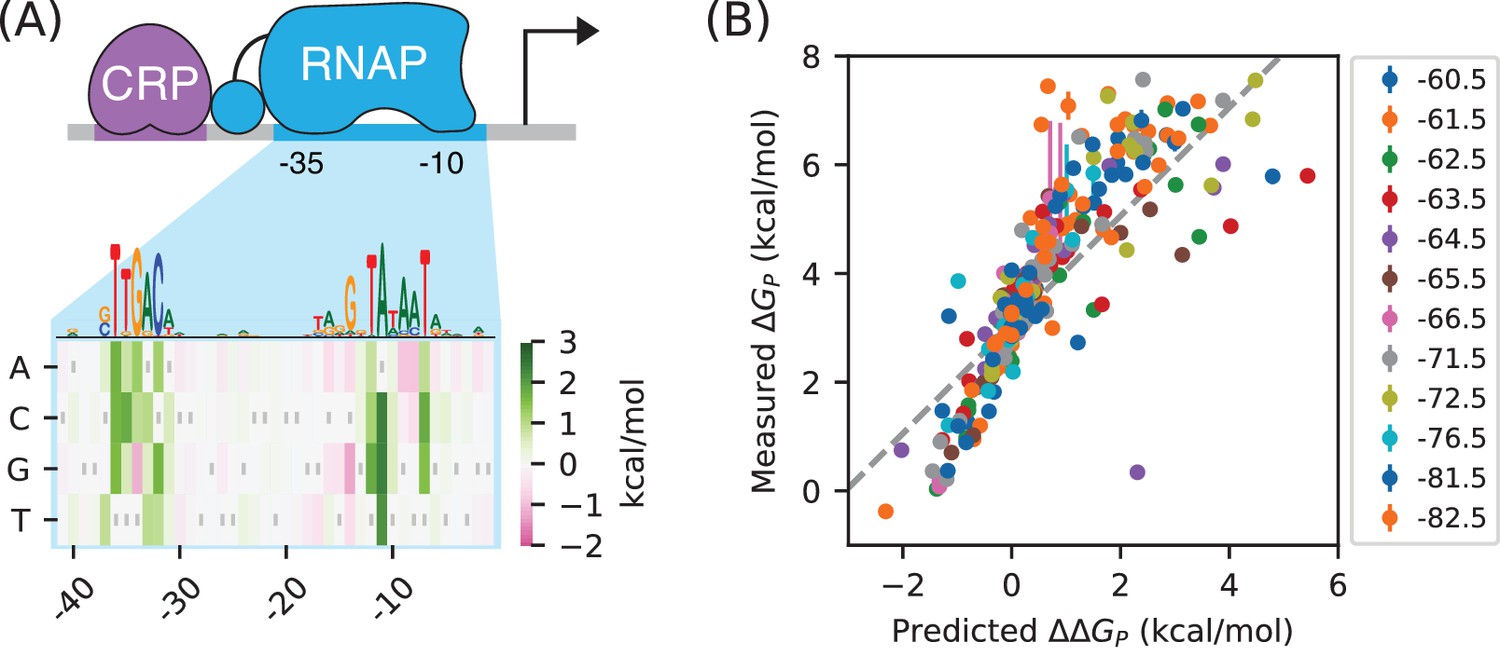
RNAP-DNA binding energy cannot be accurately predicted from sequence.
(A) The PSAM for RNAP-DNA binding inferred by Kinney et al. (2010). This model assumes that the DNA base pair at each position in the RNAP binding site contributes independently to . Shown are the values assigned by this model to mutations away from the lac* RNAP site. The sequence of the lac* RNAP site is indicated by gray vertical bars; see also Appendix 1—figure 1. A sequence logo representation for this PSAM is provided for reference. (B) PSAM predictions plotted against the values inferred by fitting the allelic manifolds in Figure 5C. Error bars on these measurements represent 68% confidence intervals. Note that measured values are absolute, whereas the predictions of the PSAM are relative to the lac* RNAP site, which thus corresponds to kcal/mol. The dashed line, provided for reference, has slope 1 and passes through this lac* data point.
Figure 7

A strategy for distinguishing two different mechanisms of transcriptional activation.
(A) A TF can activate transcription in two ways: by stabilizing the RNAP-DNA complex or by accelerating the rate at which this complex initiates transcripts. (B) A thermodynamic model for the dual mechanism of transcriptional activation illustrated in panel A. Note that multiplies the Boltzmann weight of the doubly bound complex, whereas multiplies the transcript initiation rate of this complex. (C) Data points measured as in Figure 4C will lie along a 1D allelic manifold having the form shown here. This manifold is computed using values from Equation 7 and values from Equation 2. Note that regime five occurs at a point positioned -fold above the diagonal, where is related to through Equation 8. Measurements in or near the strong promoter regime () can thus be used to determine the value of and, consequently, the value of . (D) The five regimes of this allelic manifold are listed.
Figure 8
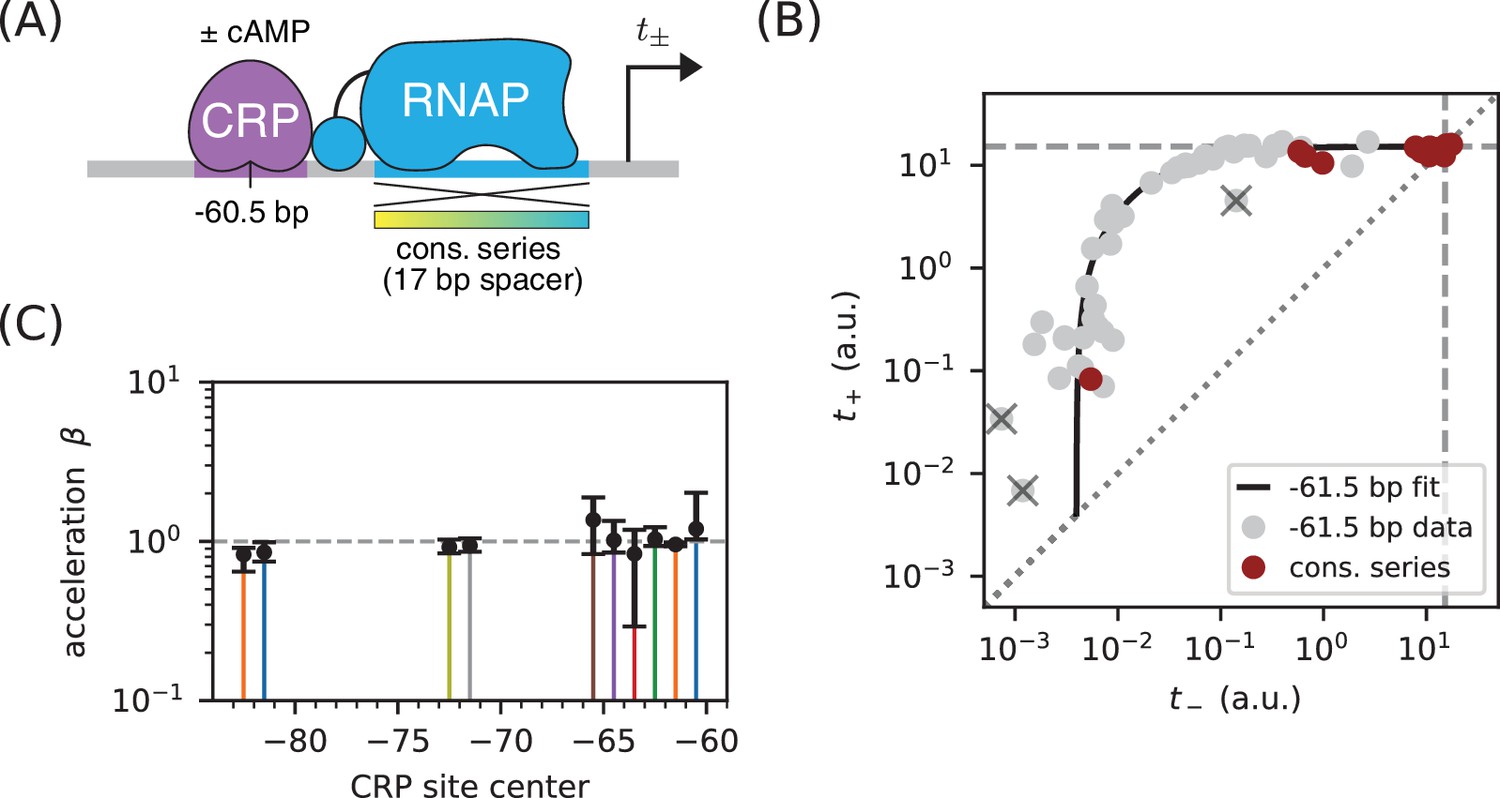
Class I activation by CRP occurs exclusively through stabilization.
(A) and were measured for promoters containing variants of the consensus RNAP binding site as well as a CRP binding site centered at −60.5 bp. Because the consensus RNAP site is 1 bp shorter than the RNAP site of the lac* promoter, CRP at −60.5 bp here corresponds to CRP at −61.5 bp in Figure 5. (B) data points obtained for the constructs in panel A, overlaid on the measurements from Figure 5B (gray). The value a.u., inferred for Figure 5C, is indicated by dashed lines. (C) Values for inferred using the data in Figure 5 for the 10 CRP positions that exhibited greater than 2-fold inducibility; values at the two other CRP positions (−66.5 bp and −76.5 bp) were highly uncertain and are not shown. Error bars indicate 68% confidence intervals.
Figure 9
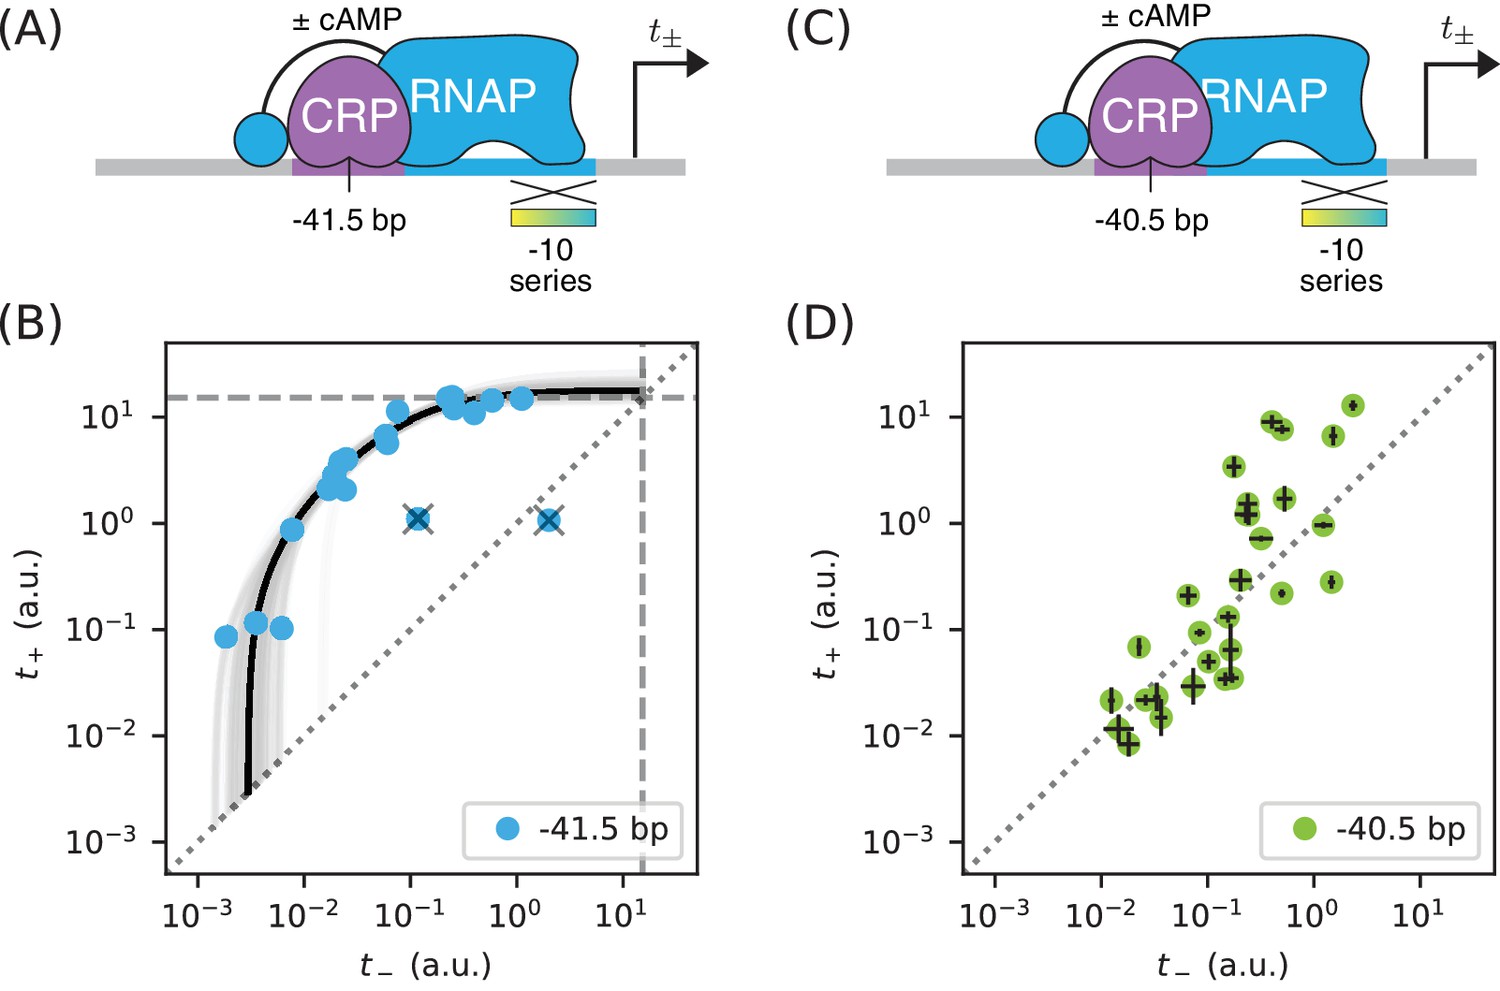
Surprises in class II regulation by CRP.
(A) Regulation by CRP centered at −41.5 bp was assayed using an allelic series of RNAP binding sites that have variant −10 elements (gradient). (B) The observed allelic manifold plateaus at the value of a.u. (dashed lines) determined for Figure 5B, thus indicating no detectable acceleration by CRP. This lack of acceleration is at odds with prior in vitro studies (Niu et al., 1996; Rhodius et al., 1997). (C) Regulation by CRP centered at −40.5 bp was assayed in an analogous manner. (D) Unexpectedly, data from the promoters in panel C do not collapse to a 1D allelic manifold. This finding falsifies the biophysical models in Figures 4A and 7B and indicates that CRP can either activate or repress transcription from this position, depending on as-yet-unidentified features of the RNAP binding site. Error bars in panel D indicate 95% confidence intervals estimated from replicate experiments.
Appendix 1—figure 1
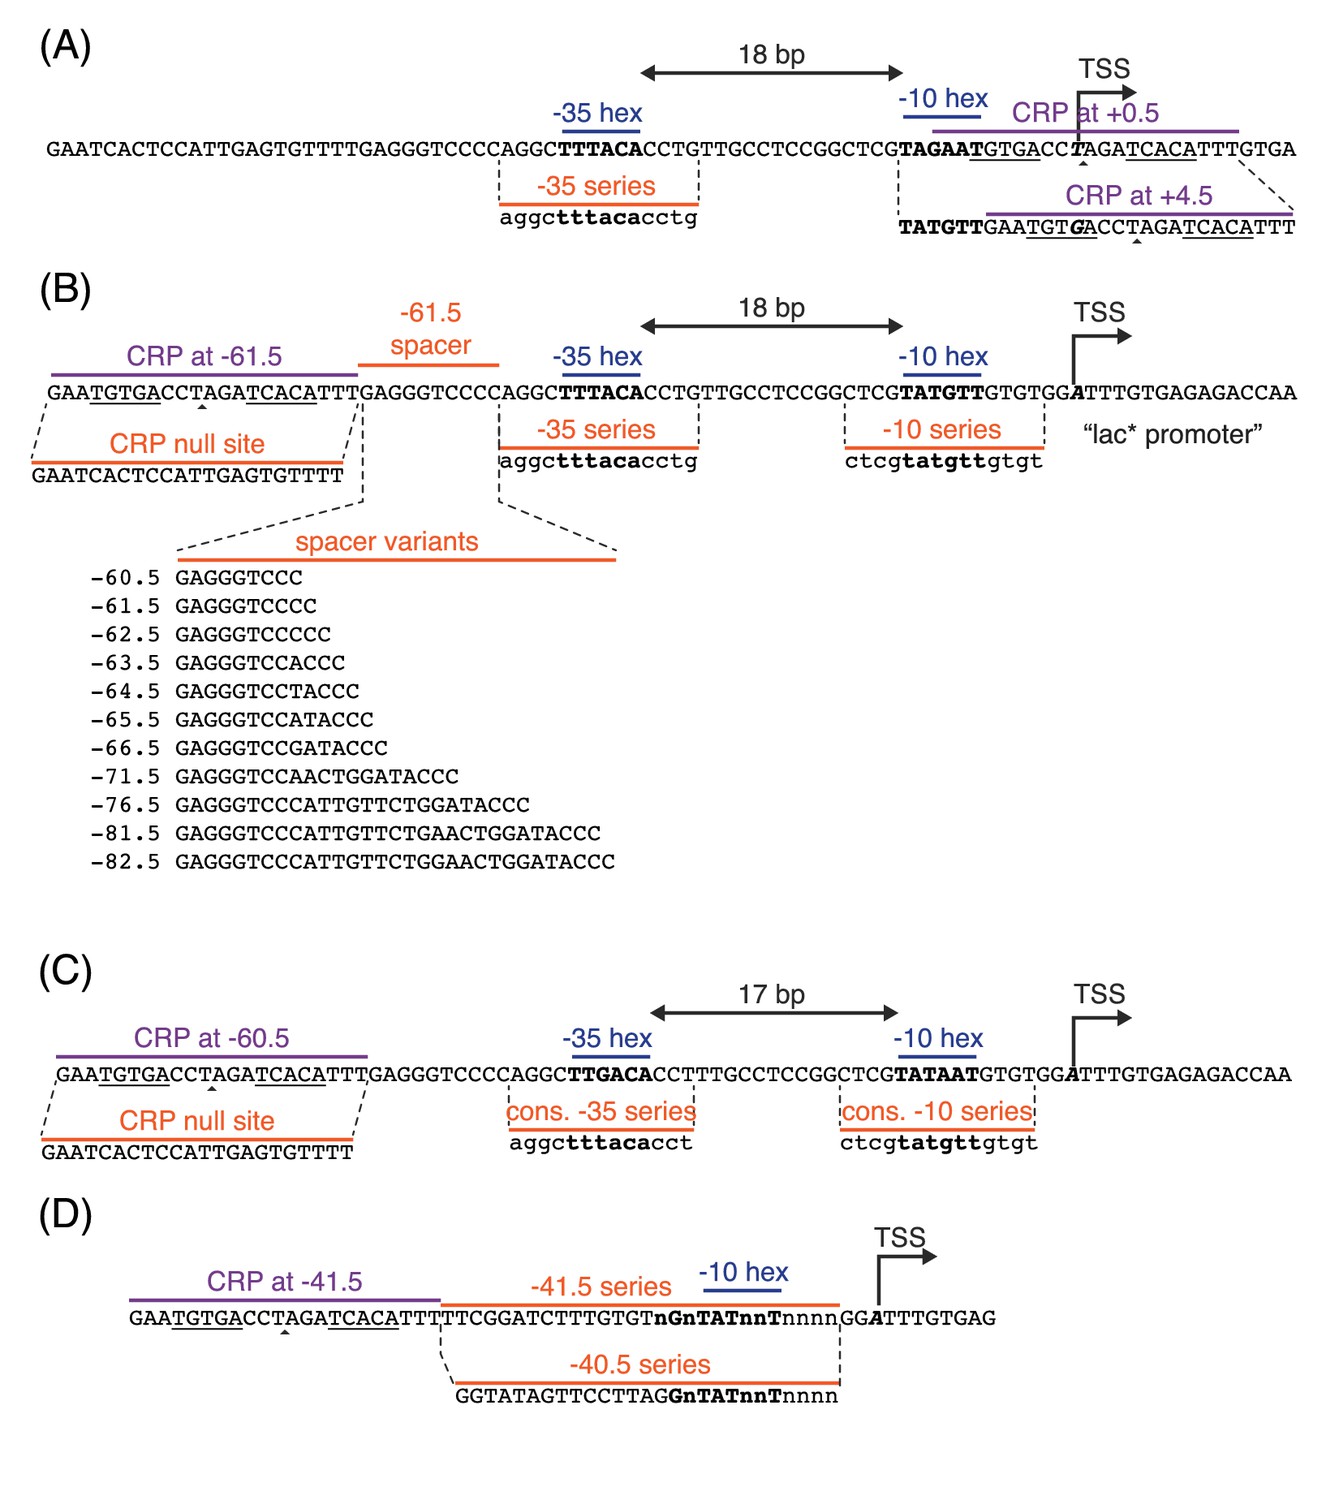
Promoter sequences used in this study.
In all panels, the −35 and −10 hexamers of the RNAP binding site are in bold. CRP binding site centers are indicated by small triangles. The palindromic pentamers of the core CRP binding site in each construct are underlined. The transcription start site (TSS) is bold and italicized. Lowercase bases (‘a’,‘c’,‘g’, and ‘t’) indicate positions synthesized with a 24% mutation rate. The lowercase character ‘n’ indicates completely randomized positions. (A) Occlusion promoters assayed for Figure 2. (B) Class I promoters assayed for Figure 5. In the main text we refer to the wild-type promoter with CRP at −61.5 bp as the lac* promoter. The lac* promoter served as the template for all of the promoters shown here. (C) Strong class I promoters assayed for Figure 8. (D) Class II promoters assayed for Figure 9.
Appendix 2—figure 1
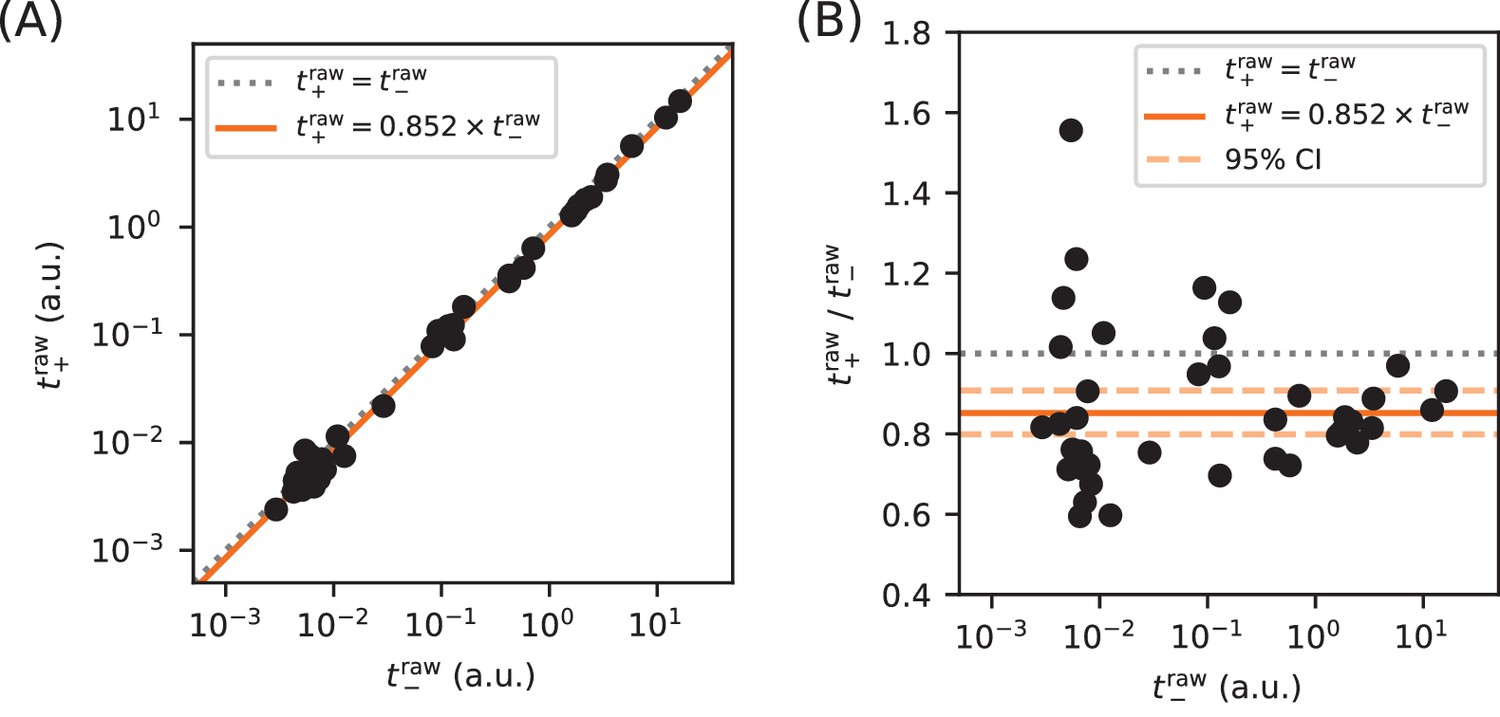
Calibration of expression measurements with and without cAMP.
(A) Measurements of (in 250 µM cAMP) vs (in 0 µM cAMP) for promoters in which the CRP binding site has been replaced by a non-functional ‘null’ site. As expected, these data lie close to the diagonal (dotted line). (B) Upon closer inspection, however, we found that values consistently fell slightly below corresponding values. Using least-squares fitting we found that, on average, where uncertainties indicate a 95% confidence interval (reflecting 1.96 times the standard error of the mean in log space). To correct for this bias, we plot and fit models to and throughout this paper.
Appendix 4—figure 1
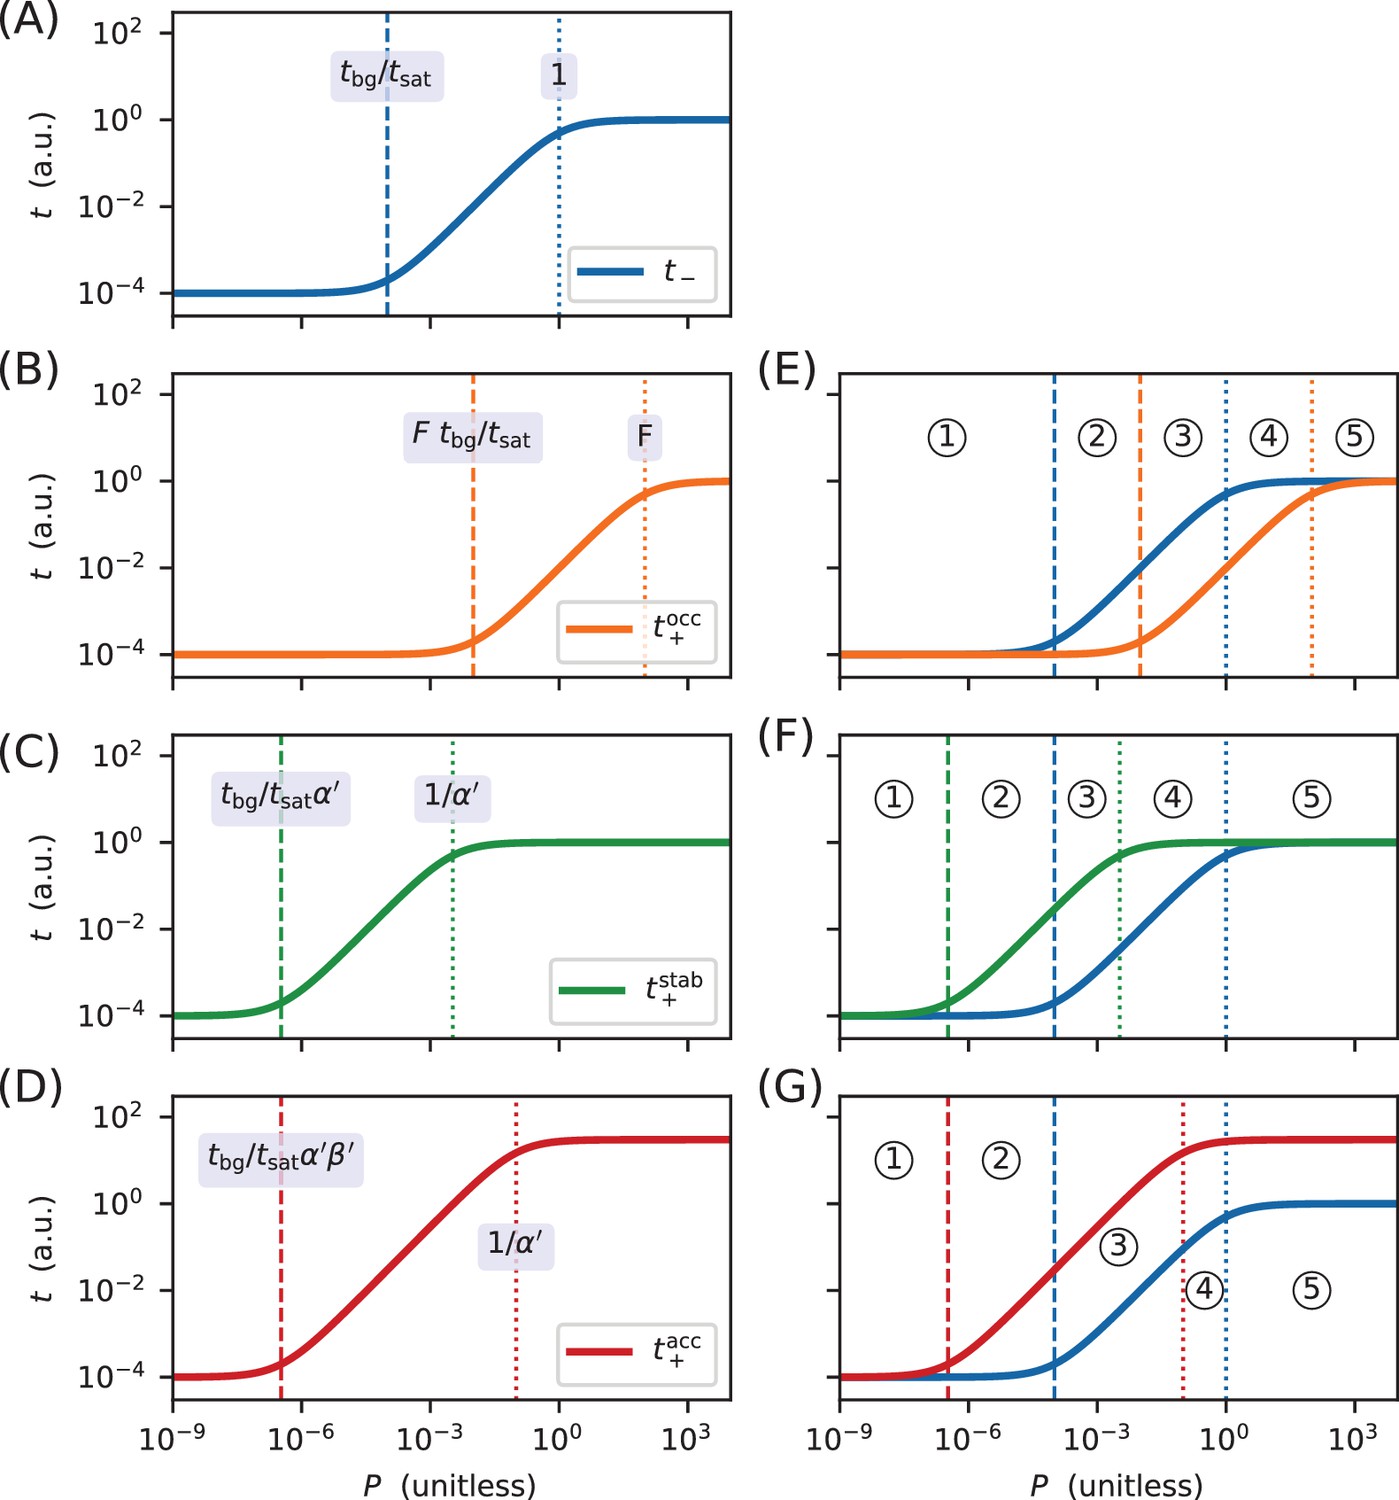
Derivation of the regimes of allelic manifolds.
Panels A-D show simulated induction curves for transcription as a function of the RNAP binding factor . Dashed lines indicate boundaries between the minimal and linear regimes of each curve, while dotted lines indicate boundaries between linear and maximal regimes. A formula for the value of at each regime boundary is also shown. All simulations used a.u., a.u., , and ranging from 10−9 to 104. (A) Induction curve for unregulated transcription; see Equation 18. (B) Induction curve for transcription repressed by occlusion; see Equation 19. (C) Induction curve for transcription activated by stabilization (); see Equation 20. (D) Induction curve for transcription activated by acceleration (, ); see Equation 21. Panels E-G show how overlaps between the six regimes of two induction curves (three for and three for ) result in five distinct regimes for the corresponding allelic manifold. (E) Regimes of the allelic manifold for occlusion, which is shown in Figure 1C. (F) Regimes of the allelic manifold for stabilization, which is shown in Figure 4C. (G) Regimes of the allelic manifold for acceleration, which is shown in Figure 7C.
Tables
Table 1
Summary of results for class I activation by CRP.
The and values listed here correspond to the values plotted in Figure 5D. The corresponding value inferred for the saturated transcription rate is a.u. Error bars indicate 68% confidence intervals; see Appendix 3 for details. is the number of data points used to infer these values, while ‘outliers’ is the number of data points excluded in this analysis. For comparison we show the fold-activation measurements (i.e., ) reported in Gaston et al. (1990) and Ushida and Aiba (1990); ‘-’ indicates that no measurement was reported for that position.
| Position (bp) | Outliers | (kcal/mol) | (Gaston) | (Ushida) | ||
|---|---|---|---|---|---|---|
| −60.5 | 21 | 0 | 3.85 | - | ||
| −61.5 | 44 | 3 | 9.05 | 20.6 | ||
| −62.5 | 23 | 0 | 4.22 | - | ||
| −63.5 | 20 | 1 | - | - | ||
| −64.5 | 17 | 0 | - | - | ||
| −65.5 | 17 | 0 | - | - | ||
| −66.5 | 19 | 1 | 0.78 | 0.84 | ||
| −71.5 | 35 | 1 | 2.50 | 16.4 | ||
| −72.5 | 20 | 0 | 3.49 | - | ||
| −76.5 | 16 | 0 | 0.54 | - | ||
| −81.5 | 32 | 0 | - | - | ||
| −82.5 | 20 | 0 | - | 6.99 |
Key resources table
| Reagent type (species) or resource | Designation | Source or reference | Identifiers | Additional information |
|---|---|---|---|---|
| Genetic reagent (E. coli) | JK10 | this paper | none | genotype: ∆cyaA ∆cpdA ∆lacY ∆lacZ ∆dksA |
| Recombinant DNA reagent | pJK47.419 | this paper | none | cloning vector with BsmBI cut sites, ccdB cassette, lacZ reporter gene, kanamycin resistance, pSC101 origin |
| Recombinant DNA reagent | pJK48 and variants | this paper | none | reporter plasmids cloned from pJK47.419 |
| Chemical compound | cAMP | Sigma-Aldrich | A9501-1G | Adenosine 3’,5’-cyclic monophosphate, 1 gram |
| Chemical compound | IPTG | Sigma-Aldrich | I5502-1G | Isopropyl β-D-1- thiogalactopyranoside, 1 gram |
| Chemical compound | ONPG | Sigma-Aldrich | N1127-5G | 2-Nitrophenyl β-D-galactopyranoside, 5 gram |
| Commercial assay or kit | PureLink Genomic DNA Mini Kit | ThermoFisher | K182001 | none |
| Commercial assay or kit | Nextera XT DNA Library Preparation Kit | Illumina | FC-131–1024 | 24 samples |
| Other | RDM | Teknova | M2105 | growth media: MOPS EZ Rich Defined Medium Kit, 5 liter |
| Other | PopCulture Reagent | MilliporeSigma | 71092–4 | 75 milliliters |
| Other | Breathe-Easier film | USA Scientific | 9123–6100 | sterile, 100 per box |
| Other | Epoch 2 Microplate Spectrophotometer | BioTek | EPOCH2C | none |
| Software | analysis scripts | this paper | none | Available at https://github.com/jbkinney/17_inducibility (copy archived at https://github.com/elifesciences-publications/17_inducibility) |
Additional files
-
Supplementary file 1
Numerical results plotted in the Figures and listed in Table 1.
Please refer to the ’overview’ sheet within this workbook for a description of each data sheet therein.
- https://doi.org/10.7554/eLife.40618.012
-
Transparent reporting form
- https://doi.org/10.7554/eLife.40618.013
Download links
A two-part list of links to download the article, or parts of the article, in various formats.
Downloads (link to download the article as PDF)
Open citations (links to open the citations from this article in various online reference manager services)
Cite this article (links to download the citations from this article in formats compatible with various reference manager tools)
Measuring cis-regulatory energetics in living cells using allelic manifolds
eLife 7:e40618.
https://doi.org/10.7554/eLife.40618


