A causal role for right temporo-parietal junction in signaling moral conflict
- Institut des Sciences Cognitives Marc Jeannerod, CNRS, UMR 5229 and Université Claude Bernard (UCBL), Lyon 1, France
- HM Hospitales – Centro Integral en Neurociencias HM CINAC, Spain
- University of Zurich, Switzerland
Figures
Figure 1 with 3 supplements
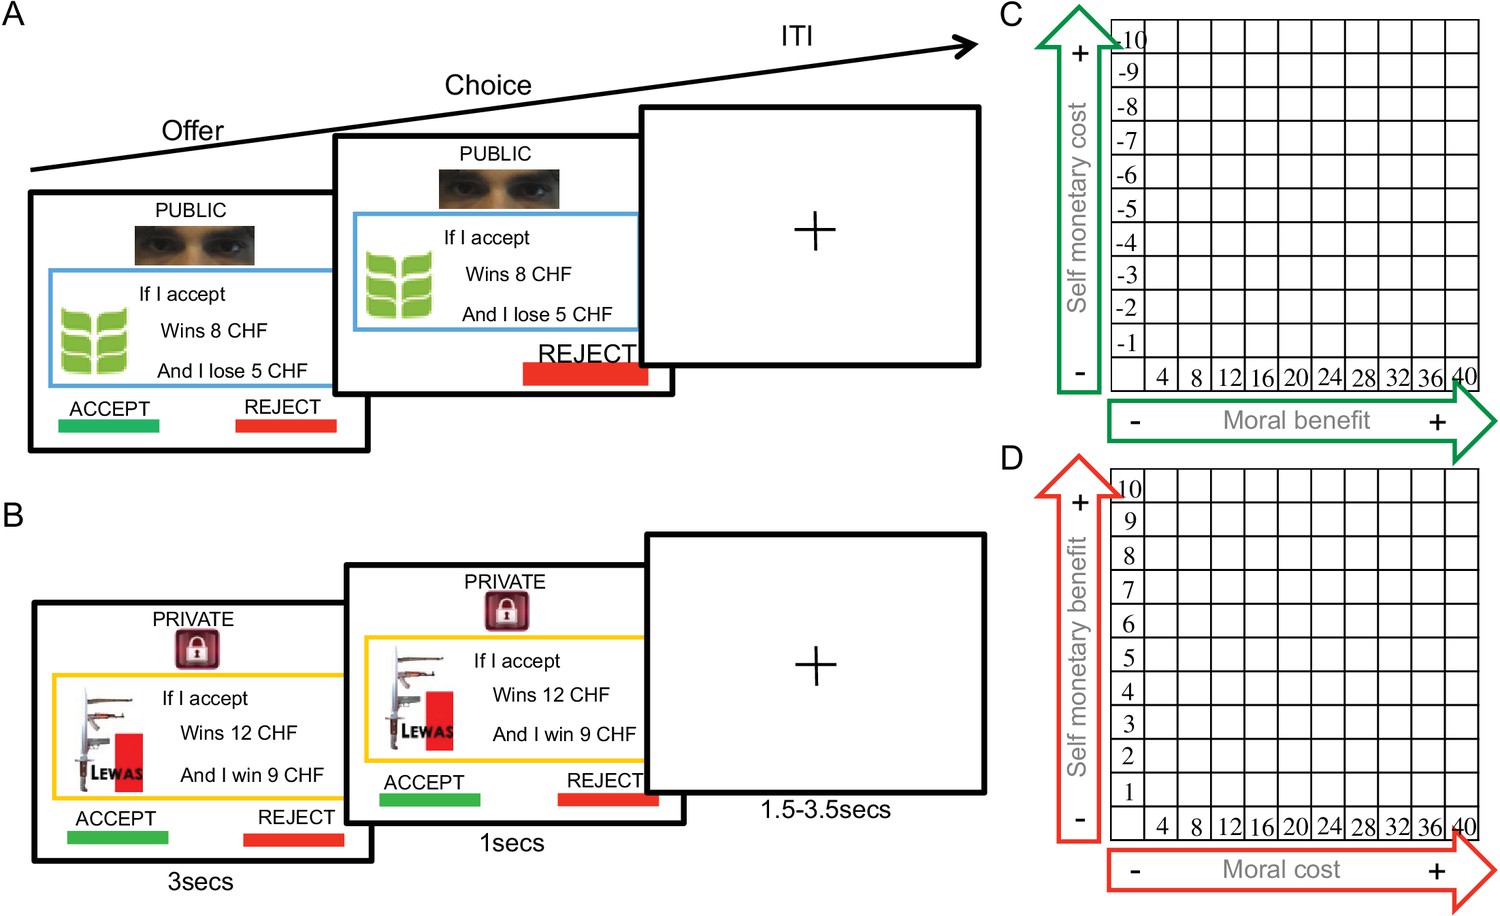
Donation task.
(A) Presentation of moral context and public trial conditions, with green leaf logo from ‘Bread for all’ organization; (B) presentation of immoral context and private trial conditions, showing the ‘Lewas’ organization logo. (C) It shows the trial distribution of the moral context and D the trial distribution of the immoral context.
Figure 1—figure supplement 1
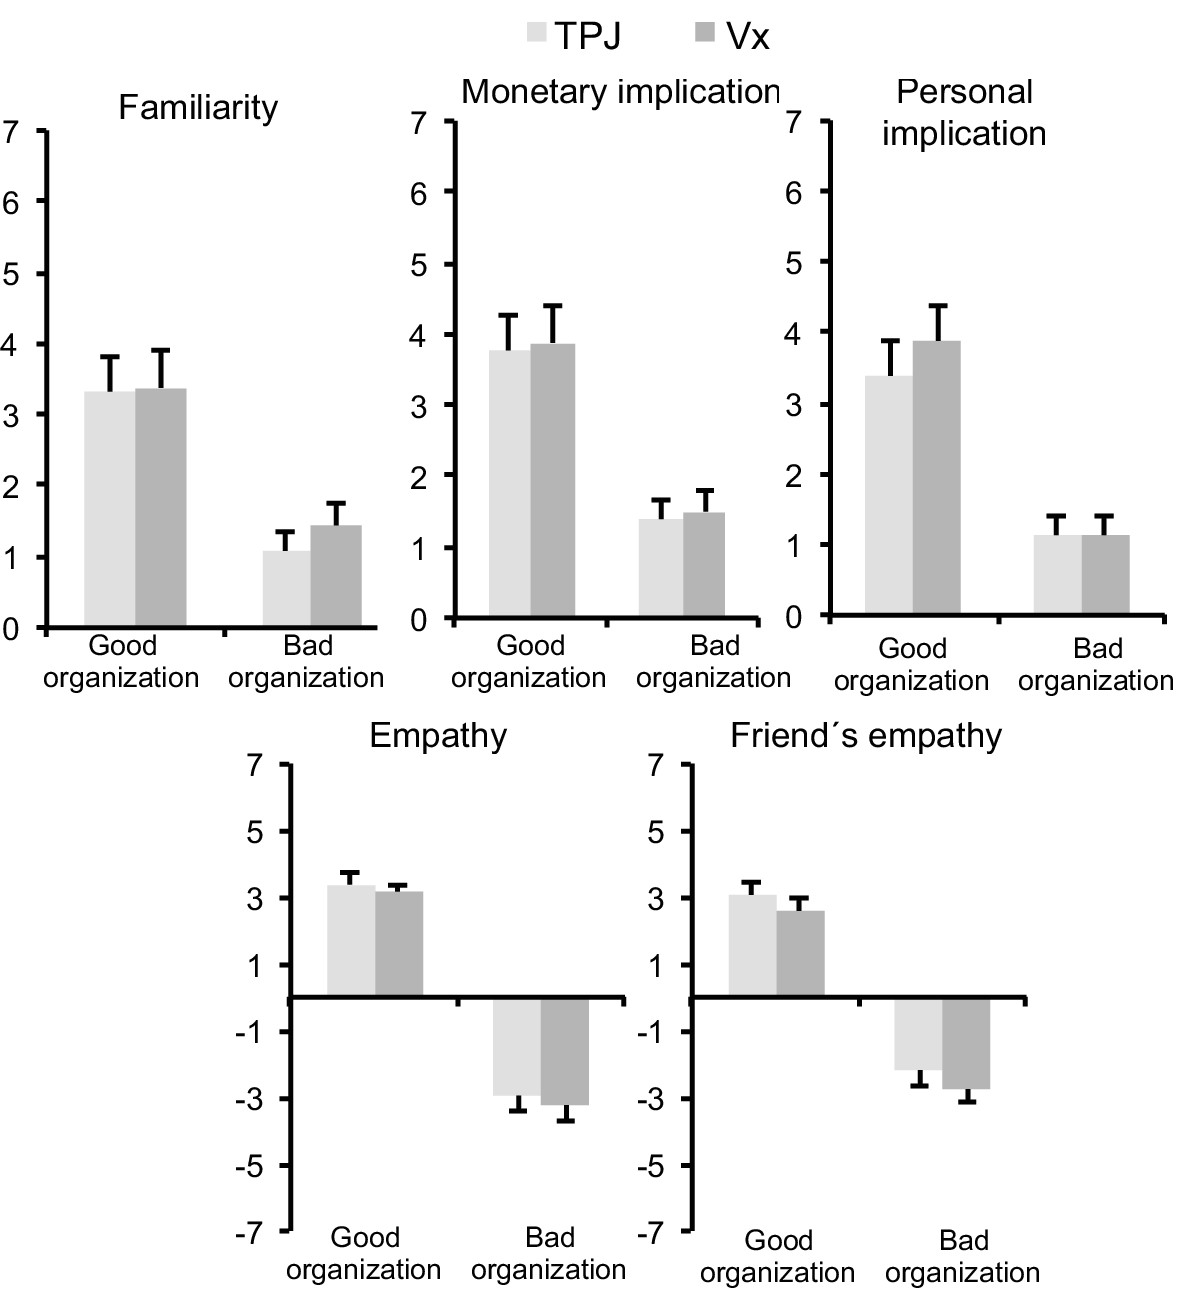
Subjects value rating of organization types used in the donation task.
Every participant rated both organizations based on familiarity (‘How much do you understand and are familiar with the organization?”), monetary implication (‘Will you contribute with your own money for the organization profit?”), personal implication (‘Will you use your own resources (personal time, effort, participate in activities, publicity…) to help the organization?”), empathy (‘How attached or close you feel to the organization?”) and friend´s empathy (‘How attached or close do you think your friends will be to the organization?”).
Figure 1—figure supplement 2
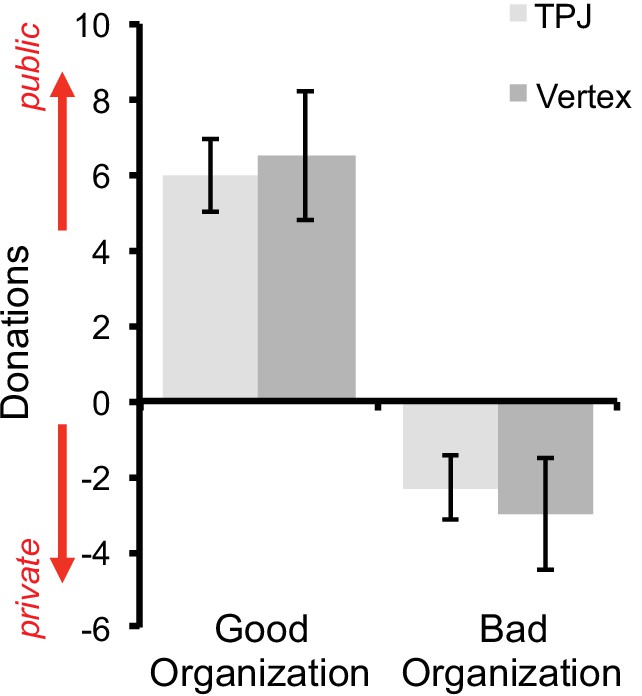
Audience effects are not changed by TMS.
For both stimulation groups, public versus private choices led to similar increased donations to the good organization and similar decreased donations to the bad organization. The audience effect was obtained by subtracting the number of accepted choices in the public minus the private context, separately for each organization type and stimulation group. While an Audience effect was found in the full regression model (Audience coefficient = 0.51; p = 0.043), no Group x Audience interaction was found (Audience x cTBS coefficient = 0.04; p = 0.78).
Figure 1—figure supplement 3
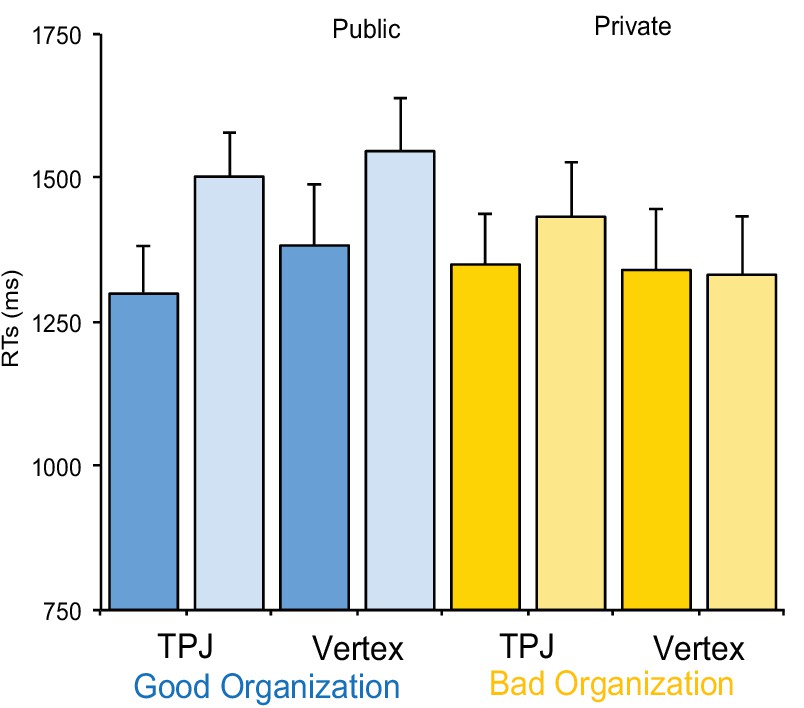
Reaction times for the different conditions show no significant differences [all F´s > 1], suggesting that TMS did not lead to task disengagement or distraction.
https://doi.org/10.7554/eLife.40671.005
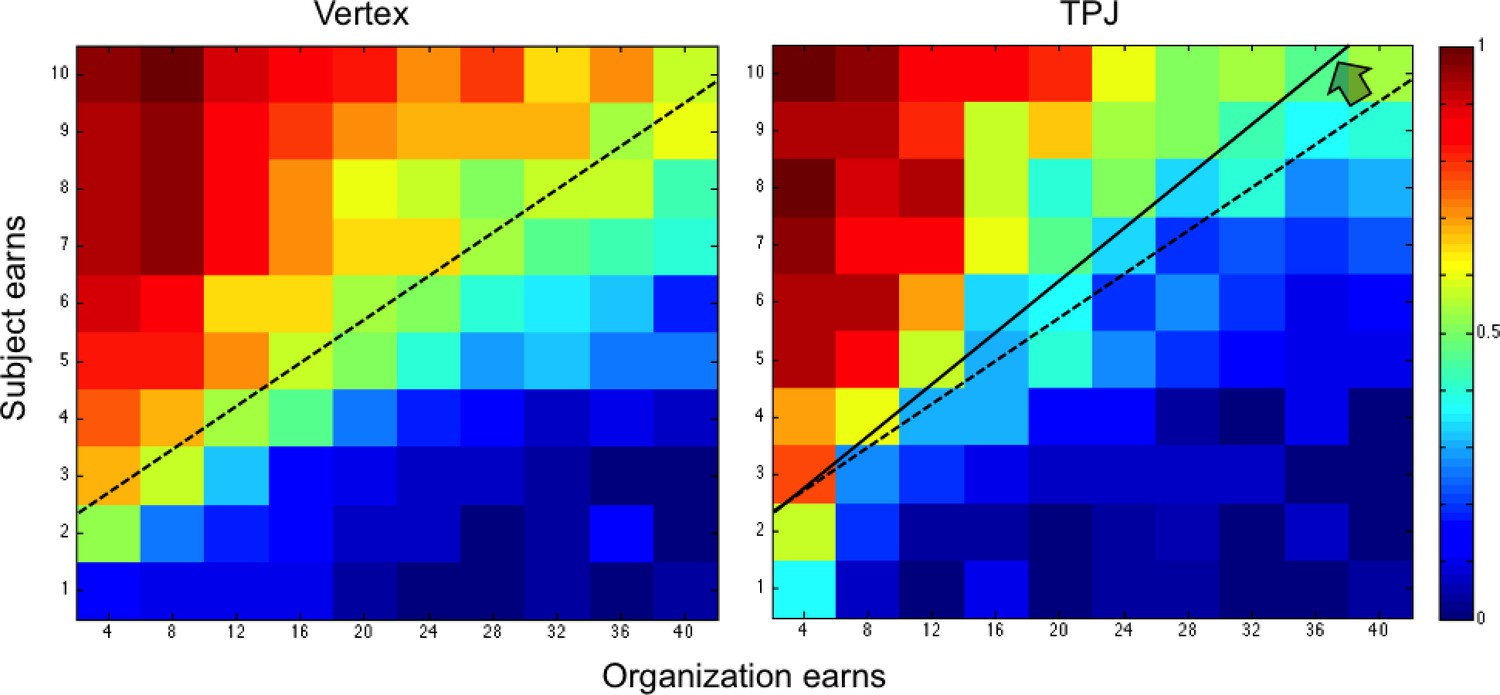
Figure 2 with 2 supplements

Color-coded map for probability of acceptance to donate (warm color shows greater acceptance probability; cold color lower acceptance probability) for the good organization in the control group (vertex) and TPJ group.
Trials relative to both audience conditions (public/private) are shown. The black line represents the control group’s responses at which donations were accepted with 50% probability for each given cost level. Vertical bar indicates the number of times a response was selected, that is one per subject.
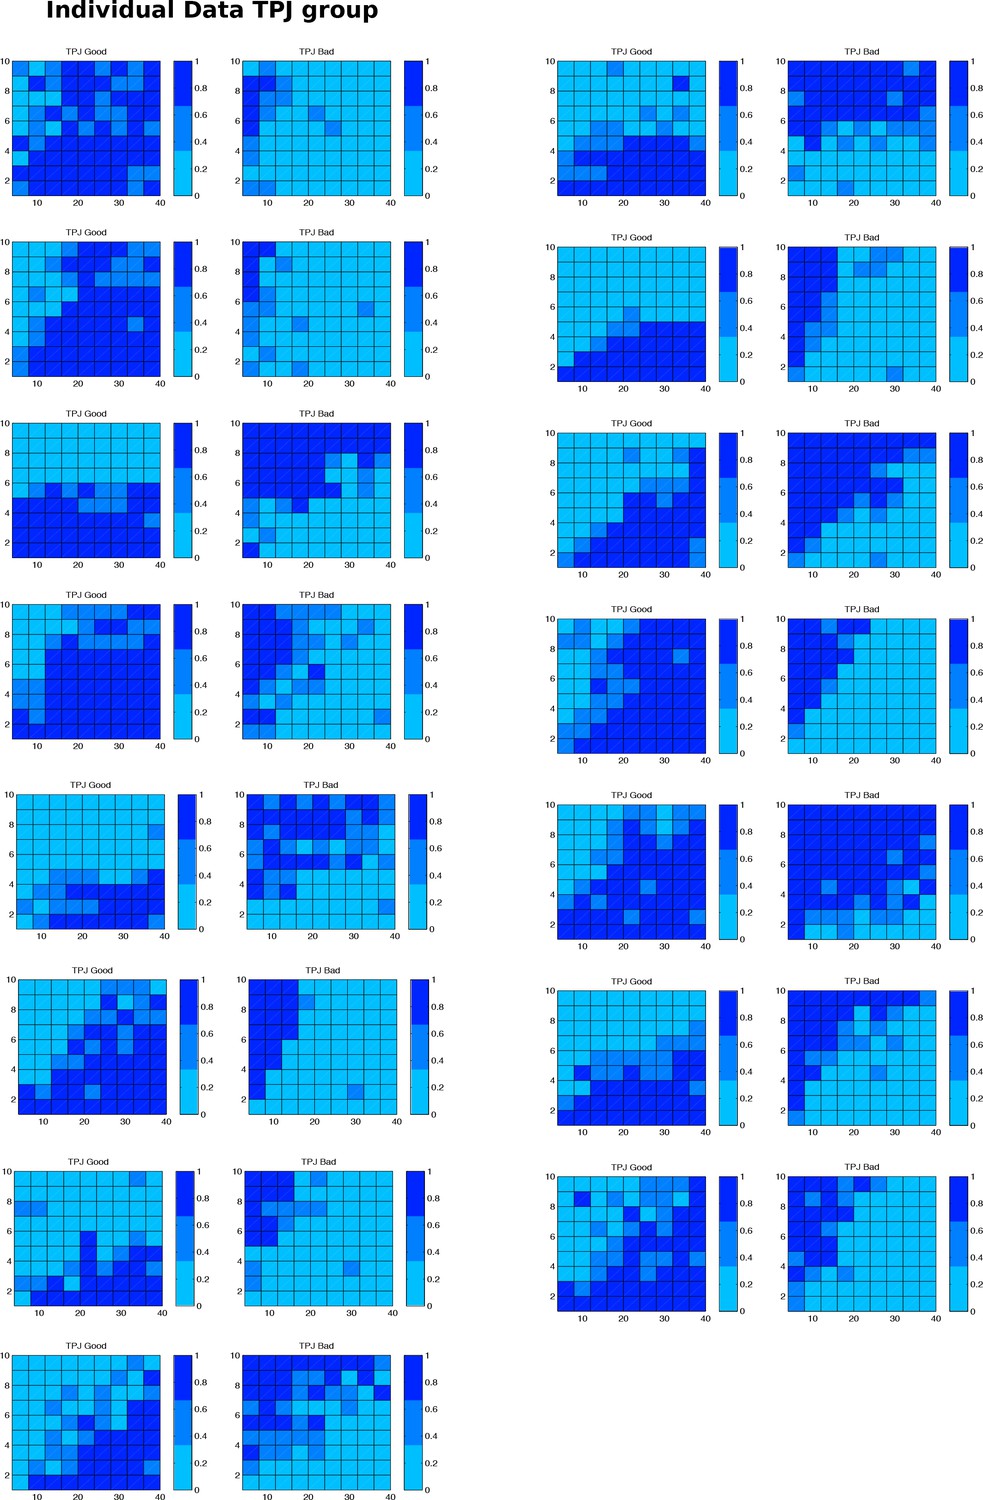
Figure 2—figure supplement 1
Behaviour of individual subjects for the TPJ group and each organization type (good vs bad).
https://doi.org/10.7554/eLife.40671.007
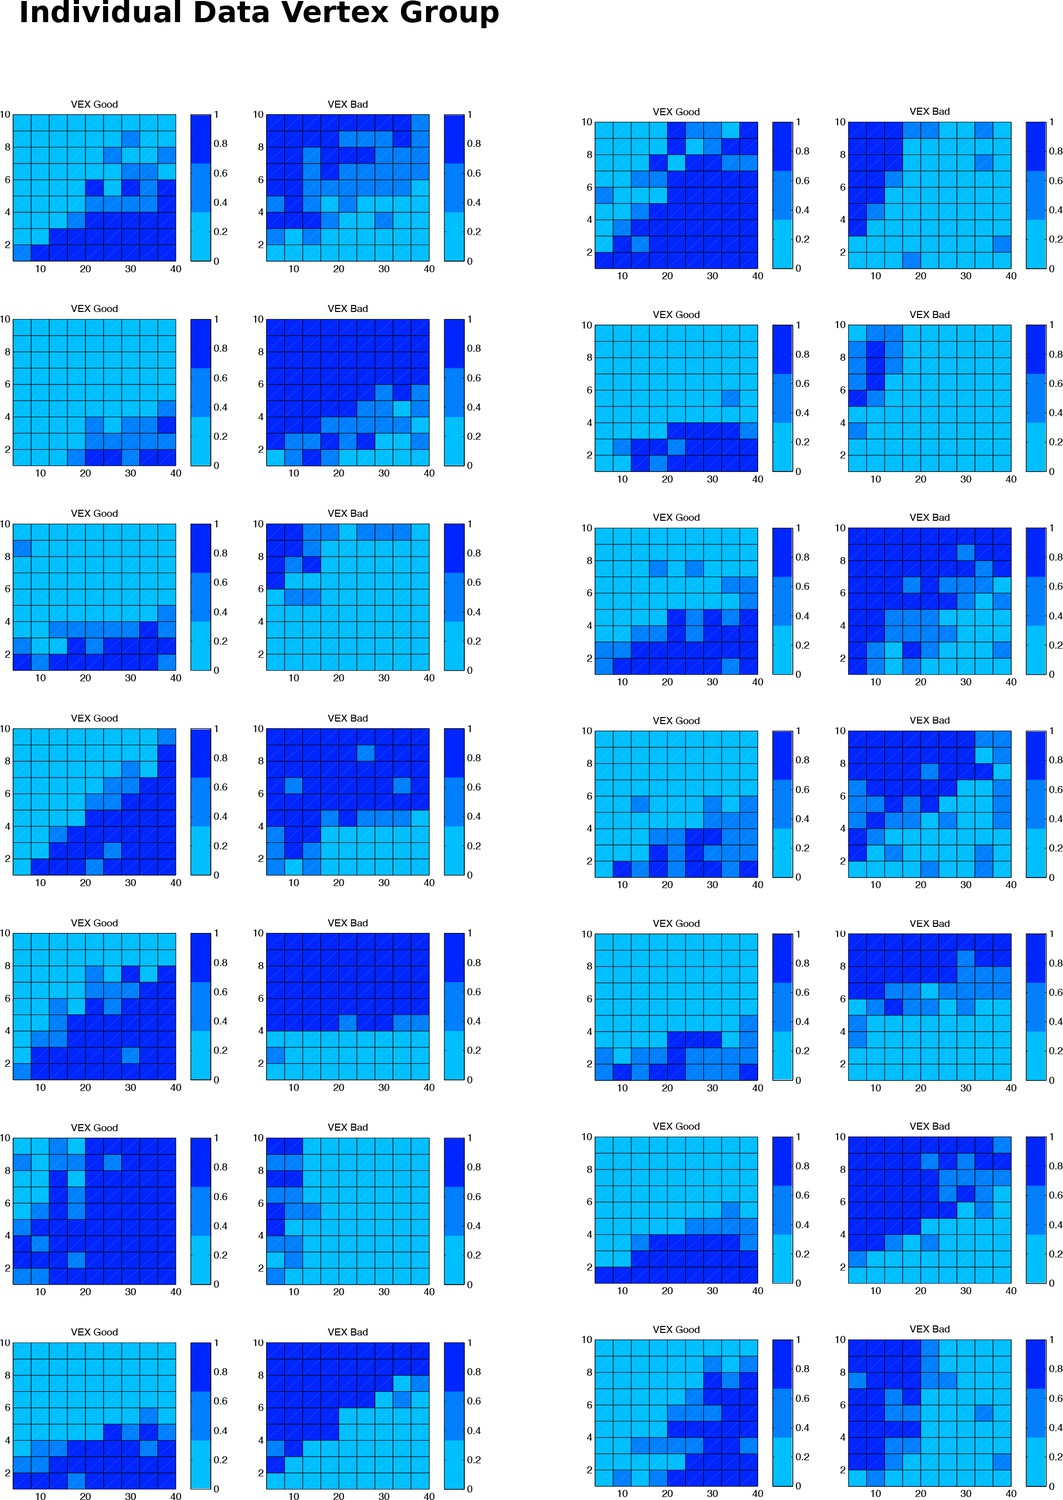
Figure 2—figure supplement 2
Behavior of individual subjects for the Vertex group and each organization type (good vs bad).
https://doi.org/10.7554/eLife.40671.008
Figure 3
Color-coded map for probability of acceptance to donate (warm color shows greater acceptance probability; cold color lower acceptance probability) for the bad organization in the control group (vertex) and TPJ group.
Trials relative to both audience conditions (public/private) are shown. The black line represents the control group’s responses at which donations were accepted with 50% probability for each given cost level. Vertical bar indicates the number of times a response was selected, that is one per subject.
Tables
Table 1
Regression model results.
A, good organization; B, bad organization.
| (A) | ||||||
|---|---|---|---|---|---|---|
| Coefficient | Std. error | Z | P>|z| | 95% Conf. Interval | ||
| Subject loss | −0.7989 | 0.0226 | 35.3 | 0.0001 | 0.7546 | 0.8433 |
| Organization gain | 0.1449 | 0.0120 | 12.04 | 0.0001 | 0.1213 | 0.1684 |
| cTBS | 1.3760 | 0.5994 | 2.3 | 0.022 | 0.2011 | 2.5509 |
| Gain organizationxcTBS | −0.0086 | 0.0075 | −1.14 | 0.254 | −0.0233 | 0.0061 |
| constant | 0.2288 | 0.4353 | 0.53 | 0.599 | −0.6244 | 1.0820 |
| (B) | ||||||
|---|---|---|---|---|---|---|
| Coefficient | Std. error | Z | P>|z| | 95% Conf. Interval | ||
| Subject gain | 0.7415 | 0.0220 | 33.7 | 0.0001 | 0.6983 | 0.7846 |
| Organization gain | −0.2064 | 0.0133 | −15.43 | 0.0001 | −0.2327 | −0.1802 |
| cTBS | 0.0022 | 0.7063 | 0 | 0.997 | −1.3822 | 1.3866 |
| Gain organizationxcTBS | 0.0376 | 0.0079 | 4.72 | 0.0001 | 0.0220 | 0.0533 |
| constant | −1.6118 | 0.5126 | −3.14 | 0.002 | −2.6166 | −0.6069 |
-
Table 1(A):
Equation 1: logit (prob. accept) = βo + β1*GS + β2*GO + α0*cTBS + α1*cTBS*GO
-
Number of obs = 5800; Number of participants = 29; Obs per group: min = 200; max = 200; avg. = 200
Integration points = 7, Wald chi2(4)=1342.55
-
Log Likelihood = −1948.13, Prob > chi2=0.00001
Estimate: 1.65; Standard error: 0.21; cTBS: group
-
Table 1(B):
Number of obs = 5800; Number of participants = 29; Obs per group: min = 200; max = 200; avg. = 200
-
Integration points = 7, Wald chi2(4)=1294.59
Log Likelihood = −1902.89, Prob > chi2=0.00001
-
Estimate: 1.68; Standard error: 0.25; cTBS: group
Additional files
-
Supplementary file 1
Questionnaire scores for both experimental groups.
- https://doi.org/10.7554/eLife.40671.011
-
Supplementary file 2
Full regression audience model.
A, good organization; B, bad organization.
- https://doi.org/10.7554/eLife.40671.012
-
Supplementary file 3
Full regression model.
A, good organization; B, bad organization.
- https://doi.org/10.7554/eLife.40671.013
-
Transparent reporting form
- https://doi.org/10.7554/eLife.40671.014
Download links
A two-part list of links to download the article, or parts of the article, in various formats.
Downloads (link to download the article as PDF)
Open citations (links to open the citations from this article in various online reference manager services)
Cite this article (links to download the citations from this article in formats compatible with various reference manager tools)
A causal role for right temporo-parietal junction in signaling moral conflict
eLife 7:e40671.
https://doi.org/10.7554/eLife.40671


