Membrane fluidity is regulated by the C. elegans transmembrane protein FLD-1 and its human homologs TLCD1/2
- University of Gothenburg, Sweden
- AstraZeneca, Sweden
Figures
Figure 1 with 6 supplements
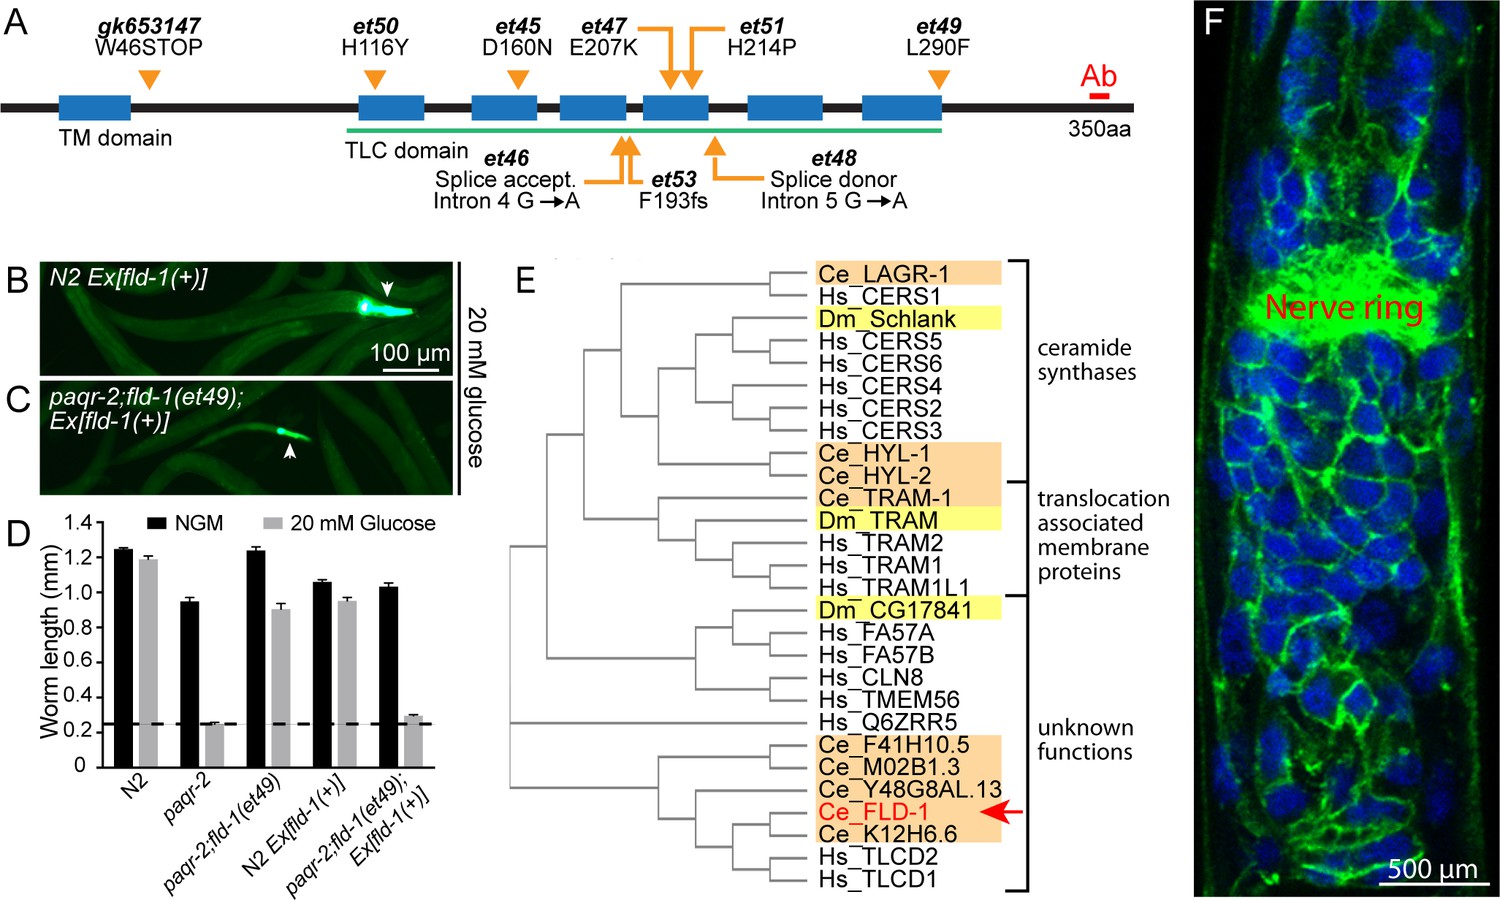
Mutant alleles, homology comparisons and expression profile of C.elegans fld-1.
(A) Positions and effects of mutant fld-1 alleles; transmembrane domains predicted by Phobius are indicated as blue boxes, and the Pfam PF03798 TLC domain is underlined in green. (B–D) Introduction of a wild-type fld-1(+) transgene in control N2 worms has no effect on their growth but restores glucose intolerance in the paqr-2(tm3410);fld-1(et49) double mutant, which shows that fld-1(et49) is a loss-of-function mutation that protects paqr-2 mutant worms from glucose toxicity; transgenic worms are positive for the pharyngeal GFP marker. The dashed line indicates the approximate length of the L1s at the start of the experiment (~250 μm). Note that the experiments involving transgenes were performed separately. (E) Cladogram of the C. elegans (orange shading), D. melanogaster (yellow shading) and human (no shading) proteins homologous to the C. elegans FLD-1 protein (red text and arrow) as per Clustal W. (F) Confocal image of the anterior portion of a fixed C. elegans L1 larva expressing the in vivo translational reporter Pfld-1::FLD-1::GFP. This reporter is ubiquitously expressed in the plasma membrane (green) while the DAPI staining (blue) decorates most of the cytoplasm in each cell since fixation allowed the chromosomal DNA to escape the nucleus.
Figure 1—figure supplement 1
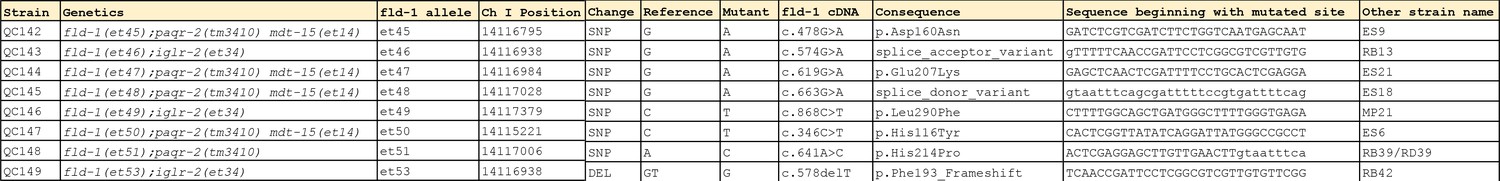
Description of the novel fld-1 mutant alleles.
https://doi.org/10.7554/eLife.40686.004
Figure 1—figure supplement 2
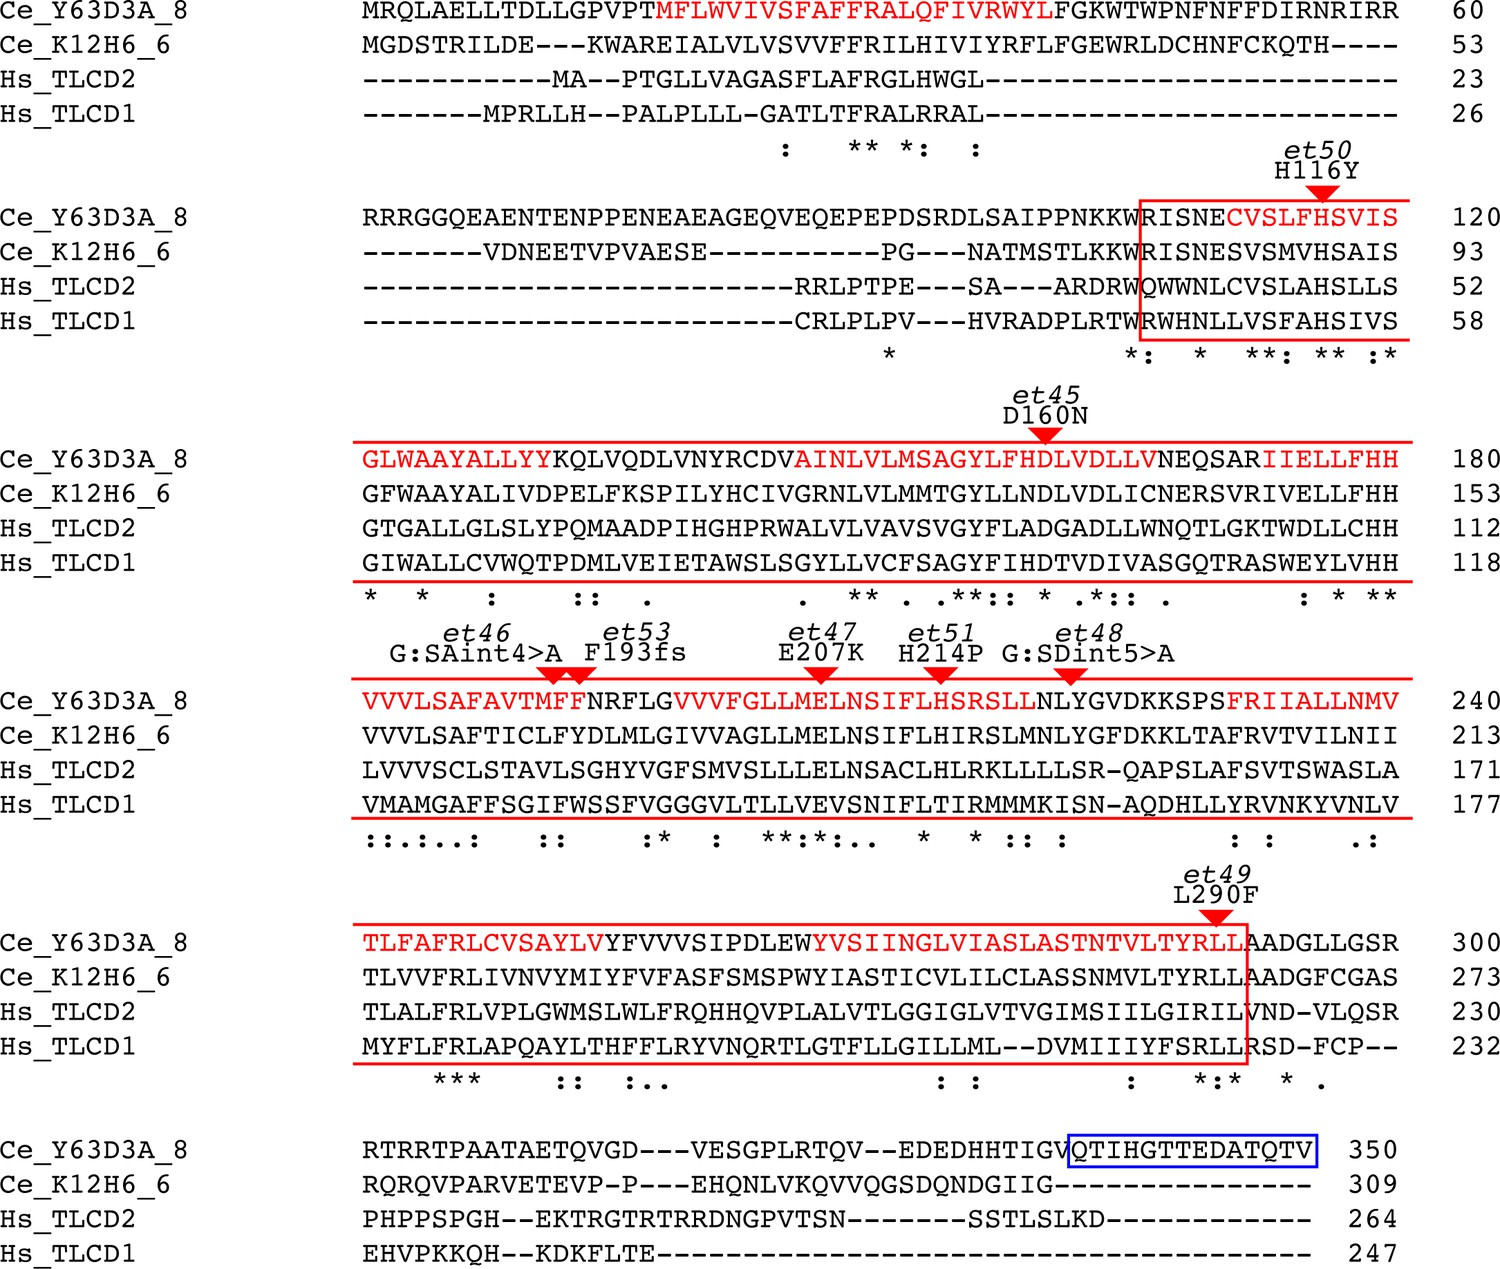
Alignment of Y63D3A.8 (i.e. FLD-1), its closest C. elegans homolog (K12H6.6) and two closest human homologs (TLCD1 and TLCD2).
The alignment produces 86 conserved positions, including, 34 identical position, out of 350 aa. The alignment was generated using Clustal Omega (http://www.ebi.ac.uk/Tools/msa/). The boxed regions correspond to sequence analysis of Y36D3A.8 using InterPro (https://www.ebi.ac.uk/interpro/) and indicates the Pfam PF03798 TLC domain (RED box) as well as the transmembrane domains (red text) as predicted by PHOBIUS (18-40, 111-131, 146-166, 173-193, 199-219, 231-254, 266-291). The positions of the newly isolated mutant alleles are also indicated (red arrowheads). The peptide sequence used for immunization is indicated by the BLUE box.
Figure 1—figure supplement 3
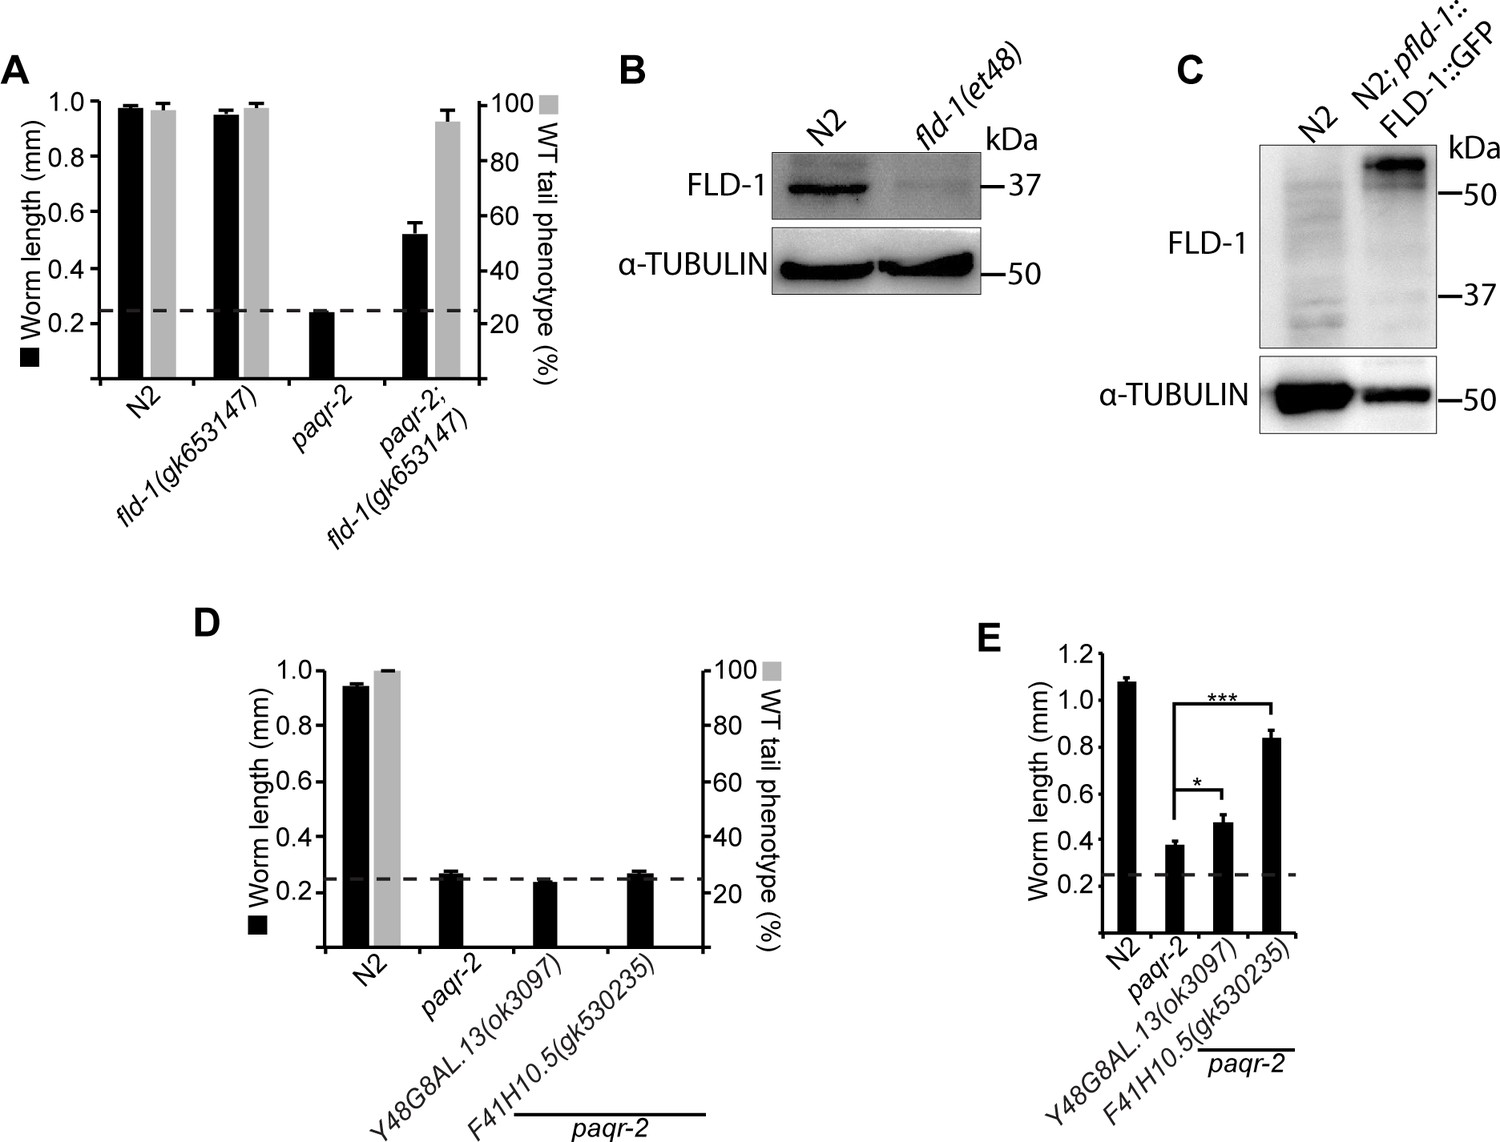
Effect of independently isolated mutant alleles of fld-1, Y48G8AL.13 and F41H10.5.
(A) The fld-1(gk653147) carries a premature STOP codon and suppresses the glucose intolerance and tail tip defect of the paqr-2 mutant. (B–C) Western blot detection of the FLD-1 protein in the indicated strains; α-tubulin was used as a loading control. 100 μg of protein was loaded in (B) and 25 μg in (C). The Y48G8AL.13(ok3097) and F41H10.5(gk530235) mutant alleles do not suppress the glucose intolerance or tail tip defects of the paqr-2 mutant (D) but partially suppress its cold intolerance defect (E). The dashed line indicates the approximate length of the L1s at the start of the experiment (~250 μm).
Figure 1—figure supplement 4

Expression profile of the in vivo reporter Pfld-1::GFP.
(A) Confocal image of a live C. elegans L1 larva expressing the Pfld-1::GFP translational reporter. Note the ubiquitous and clear plasma membrane localization which outlines the shape of each cell. The area shown is the same as in Figure 1F, with anterior to the left. (B–N) Bright field (left panels) and epifluorescence (right panels) of Pfld-1::GFP transgenic worms at different developmental stages. Structures indicated are: nerve ring (nr), head ganglion (hg), pharyngeal muscles (pm), vulva (vul), spermathecal (sp) and gonad sheath cells (gsc). Note the ubiquitous expression in plasma membranes at all stages of development.
Figure 1—figure supplement 5
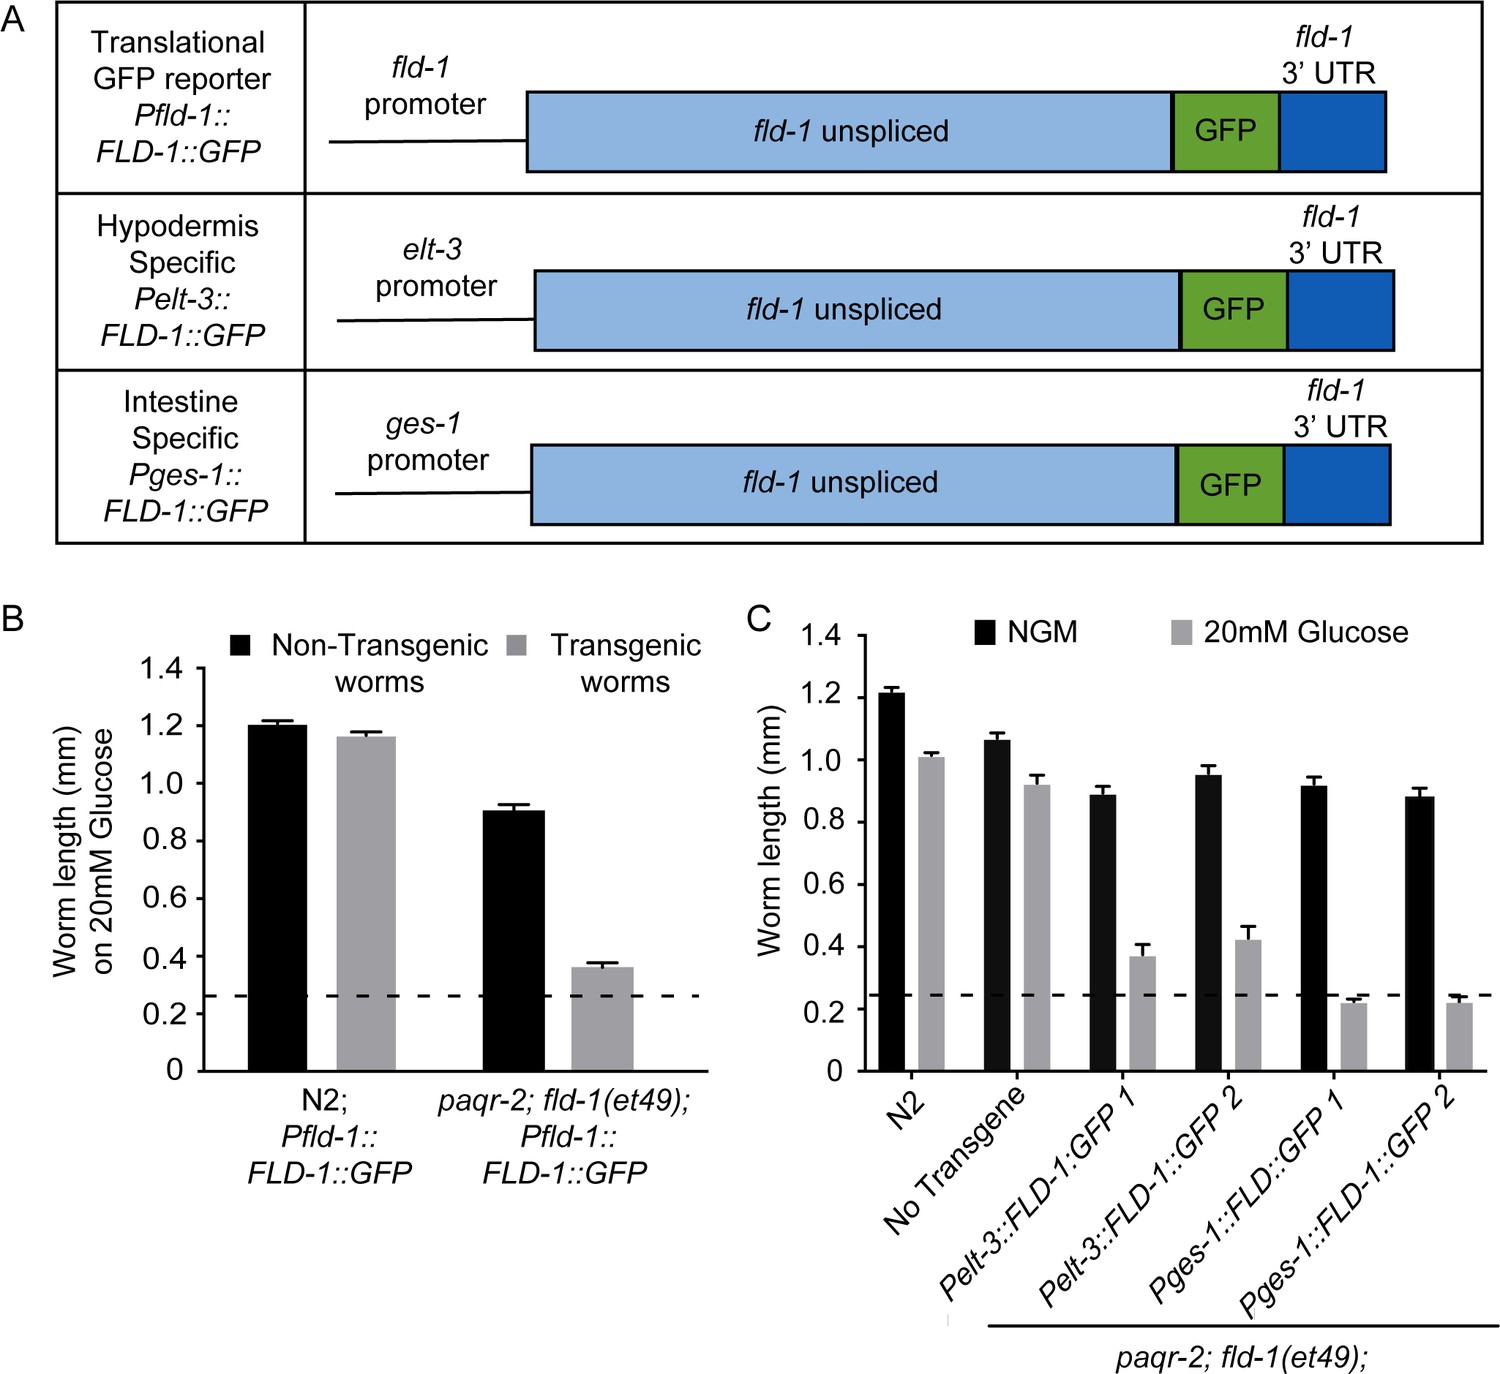
Tissue-specific expression of FLD-1::GFP.
(A) Structure of FLD-1::GFP expression constructs driven by different promoters whereby the fld-1 promoter is ubiquitously expressed, the elt-3 promoter is hypodermis-specific and the ges-1 promoter is intestine-specific. (B) The FLD-1::GFP fusion protein is functional since it restores the glucose sensitivity in paqr-2;fld-1(et49) double mutant worms; note that this construct has no adverse effects in wild-type N2 worms. (C) Expression of FLD-1::GFP in either hypodermis or intestine also restores glucose sensitivity to paqr-2;fld-1(et49) double mutant worms. The dashed lines indicate the approximate length of the L1s at the start of the experiment (~250 μm).
Figure 1—figure supplement 6
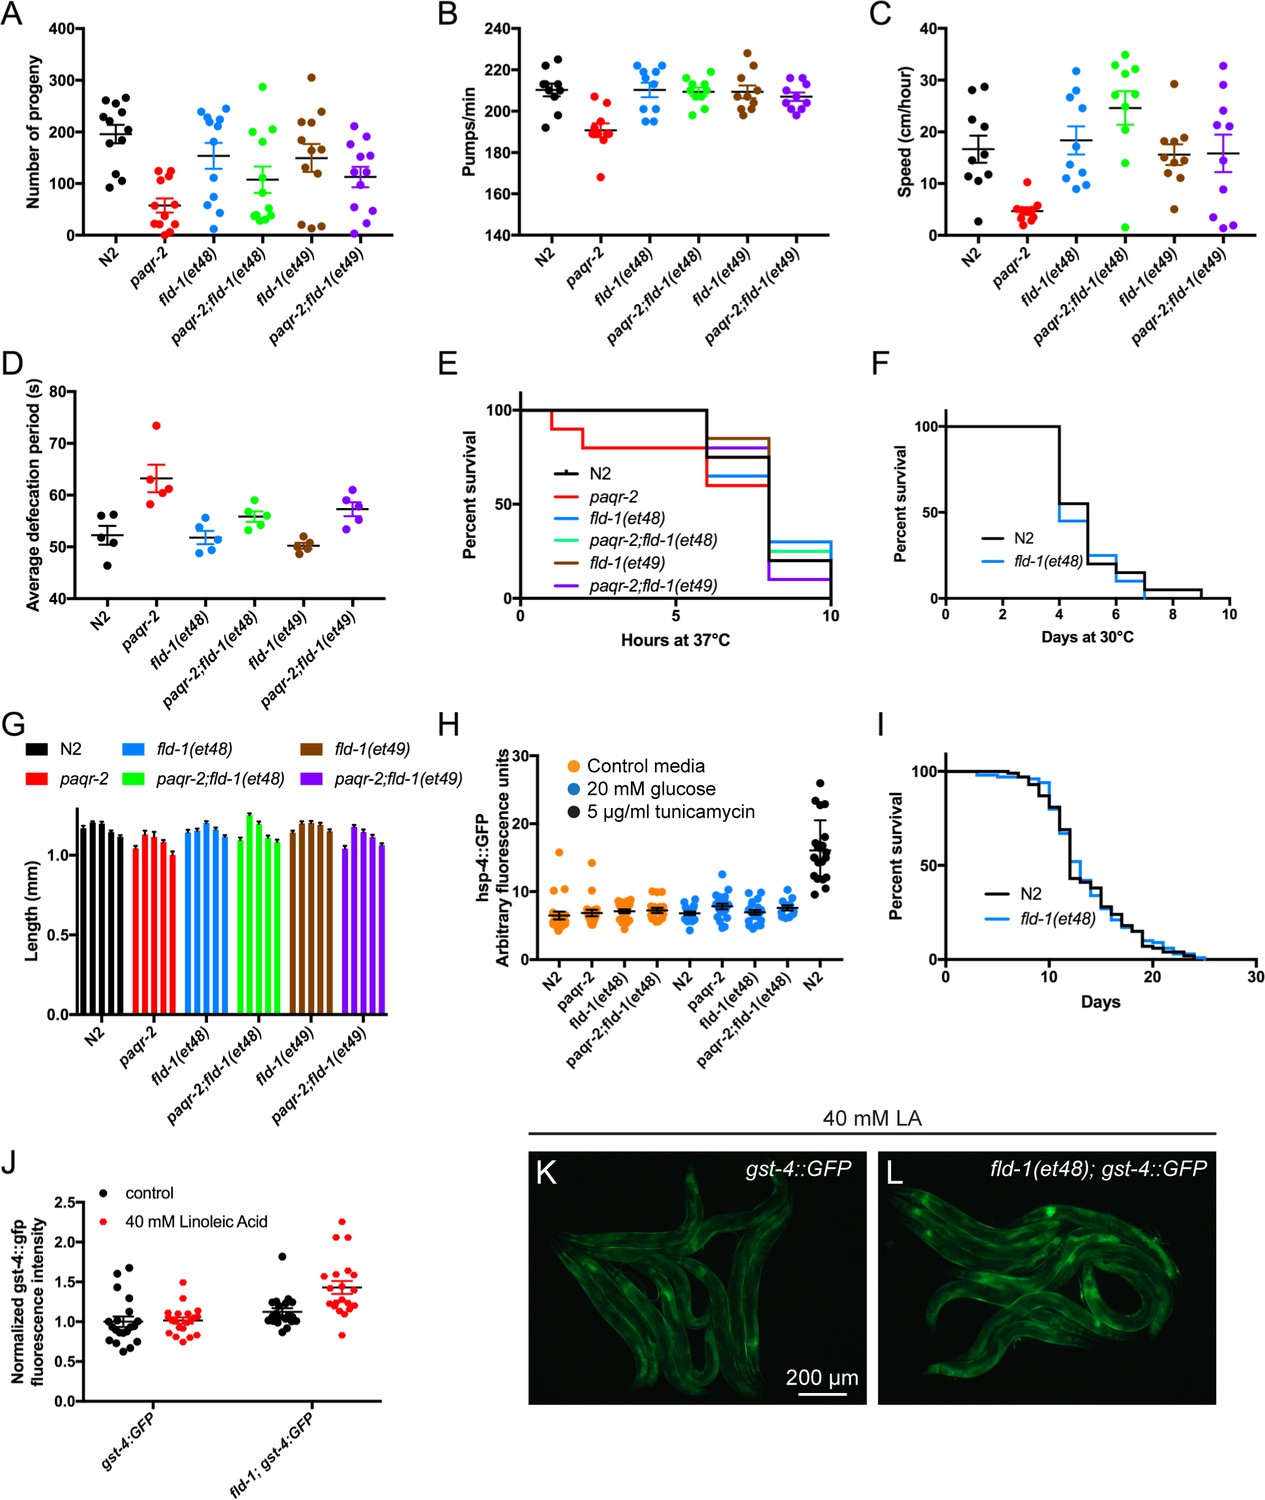
fld-1 single mutant worms have no obvious phenotype.
The single mutants fld-1(et48) and fld-1(et49) had no obvious phenotype though they often suppressed the paqr-2 mutant defects for the following traits: (A) brood size, (B) pharyngeal pumping rate, (C) speed of locomotion, (D) defecation rate, (E) survival at 37°C, (F) survival at 30°C, (G) body length 3 days after placing L1s NGM plates containing various concentration of NP-40 detergent (from left to right for each genotype: 0%, 0.01%, 0.05%, 0.1% and 0.2%) and (H) expression of the UPRer reporter hsp-4::GFP (expressed in arbitrary fluorescence units) and (I) lifespan (done only for control N2 and fld-1(et48). Unless otherwise stated, assays were performed on 1 day old adults. (J) expression of the oxidative stress reporter gst-4::GFP (expressed in fluorescence units normalized to the control) of transgenic worms cultivated with E. coli pre-loaded with/without 40 mM linoleic acid. (K–L) Representative images of worms from the experiment described in (J).
Figure 2
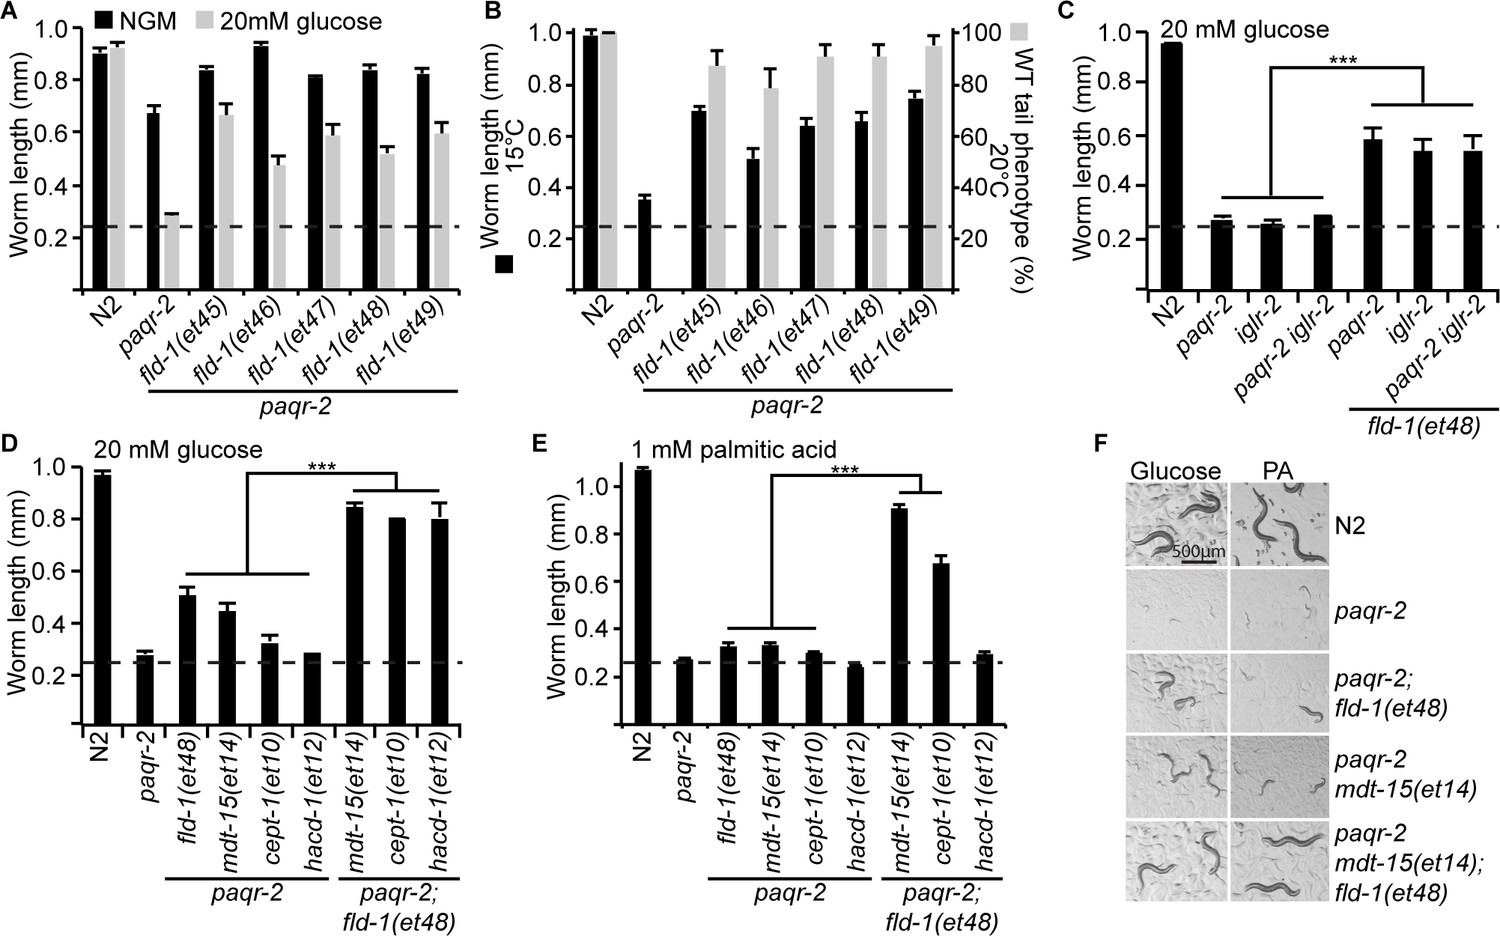
Comparison and genetic interaction of the novel fld-1 alleles with other paqr-2 and iglr-2 suppressors.
(A) The five fld-1 alleles tested improve the growth of the paqr-2 mutant on nematode growth media (NGM) and suppressed the paqr-2 growth arrest phenotype on NGM media containing 20 mM glucose. (B) The five fld-1 alleles tested suppressed the 15°C growth arrest and the 20°C tail tip defect phenotypes of the paqr-2 mutant. (C) The reference fld-1(et48) allele suppresses the growth arrest phenotype of paqr-2, iglr-2 and paqr-2 iglr-2 single and double mutants grown on 20 mM glucose. (D) fld-1(et48) greatly enhances the suppression of the growth arrest phenotype of the paqr-2 mutant cultivated on 20 mM glucose by the mdt-15(et14), cept-1(et10) and hacd-1(et12) mutations, which suggest that it acts in a separate pathway. (E) fld-1(et48) greatly enhances the suppression of the growth arrest phenotype of the paqr-2 mutant fed PA-loaded E. coli by the mdt-15(et14) and cept-1(et10) mutations which suggests that it acts in a separate pathway; hacd-1(et12) did not suppress the growth defect on PA-loaded E. coli even when combined with the fld-1(et48) mutation, suggesting that it is a weaker suppressor of paqr-2 mutant phenotypes. (F) Representative images of worms from the experiment in panel (E). The dashed lines indicate the approximate length of the L1s at the start of the experiment (~250 μm).
Figure 3 with 3 supplements
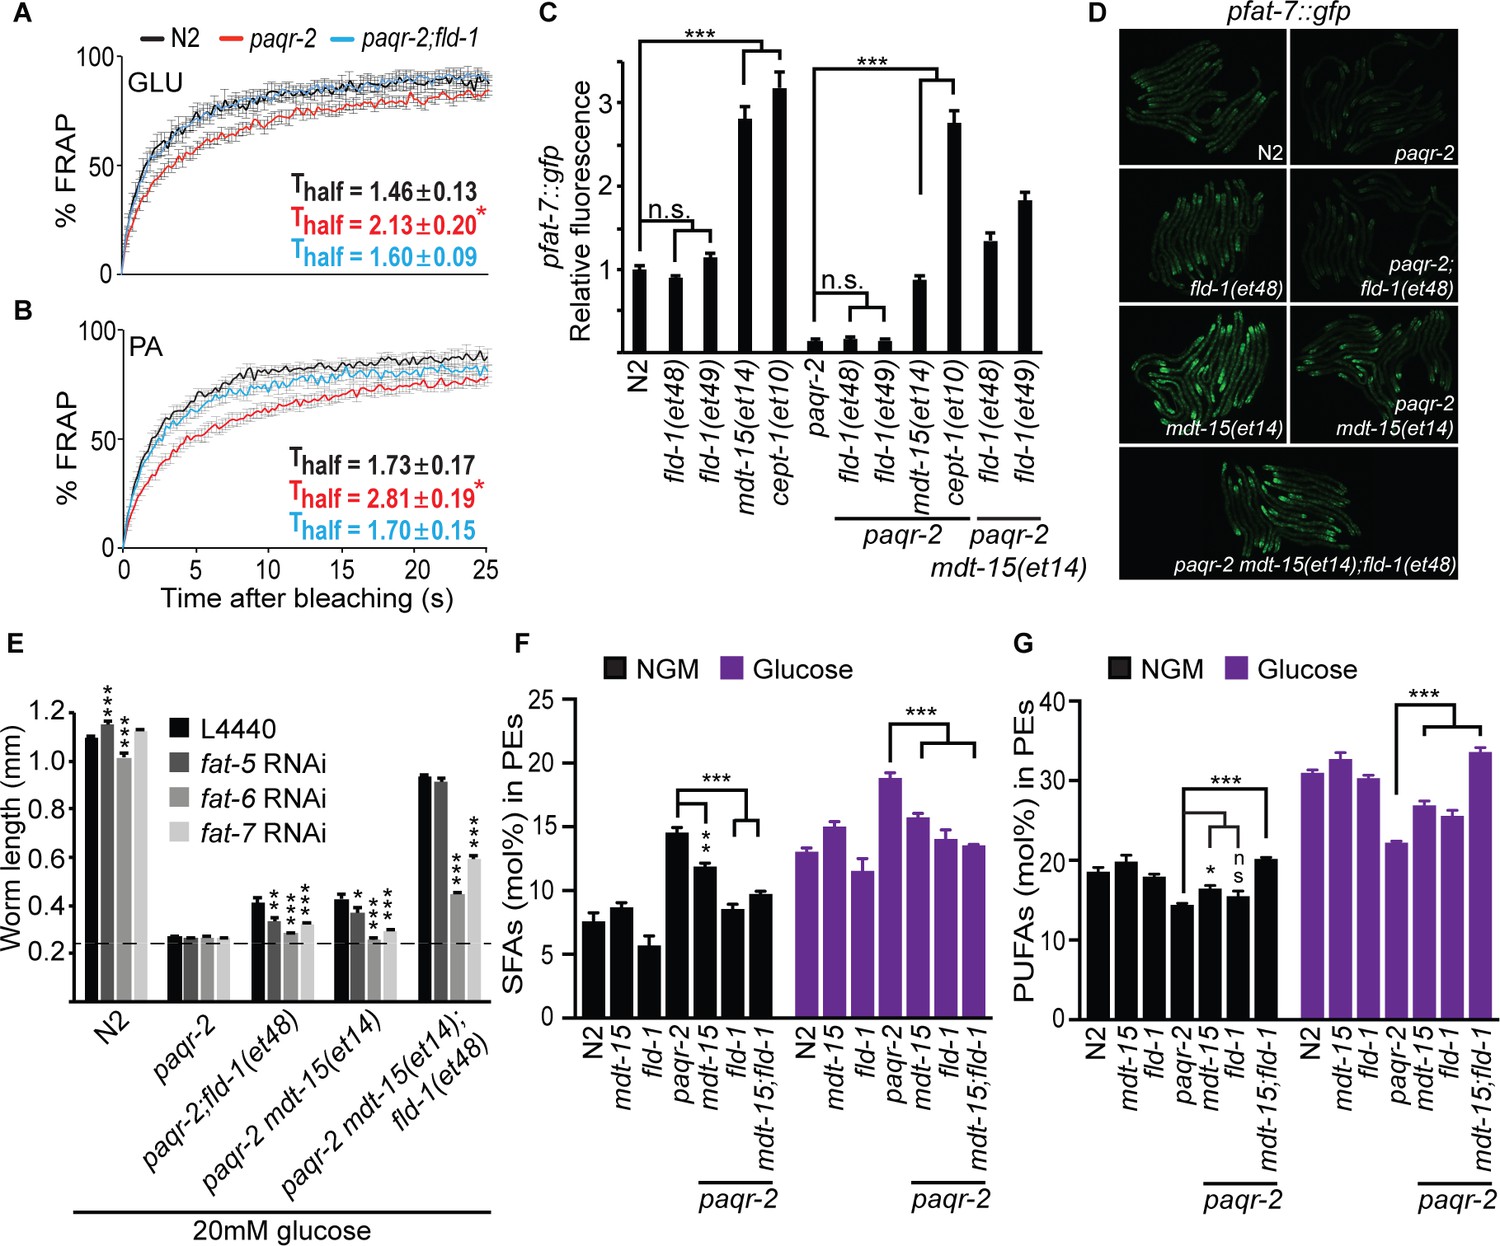
fld-1(et48) corrects membrane phospholipid composition and several membrane defects of the paqr-2 mutant.
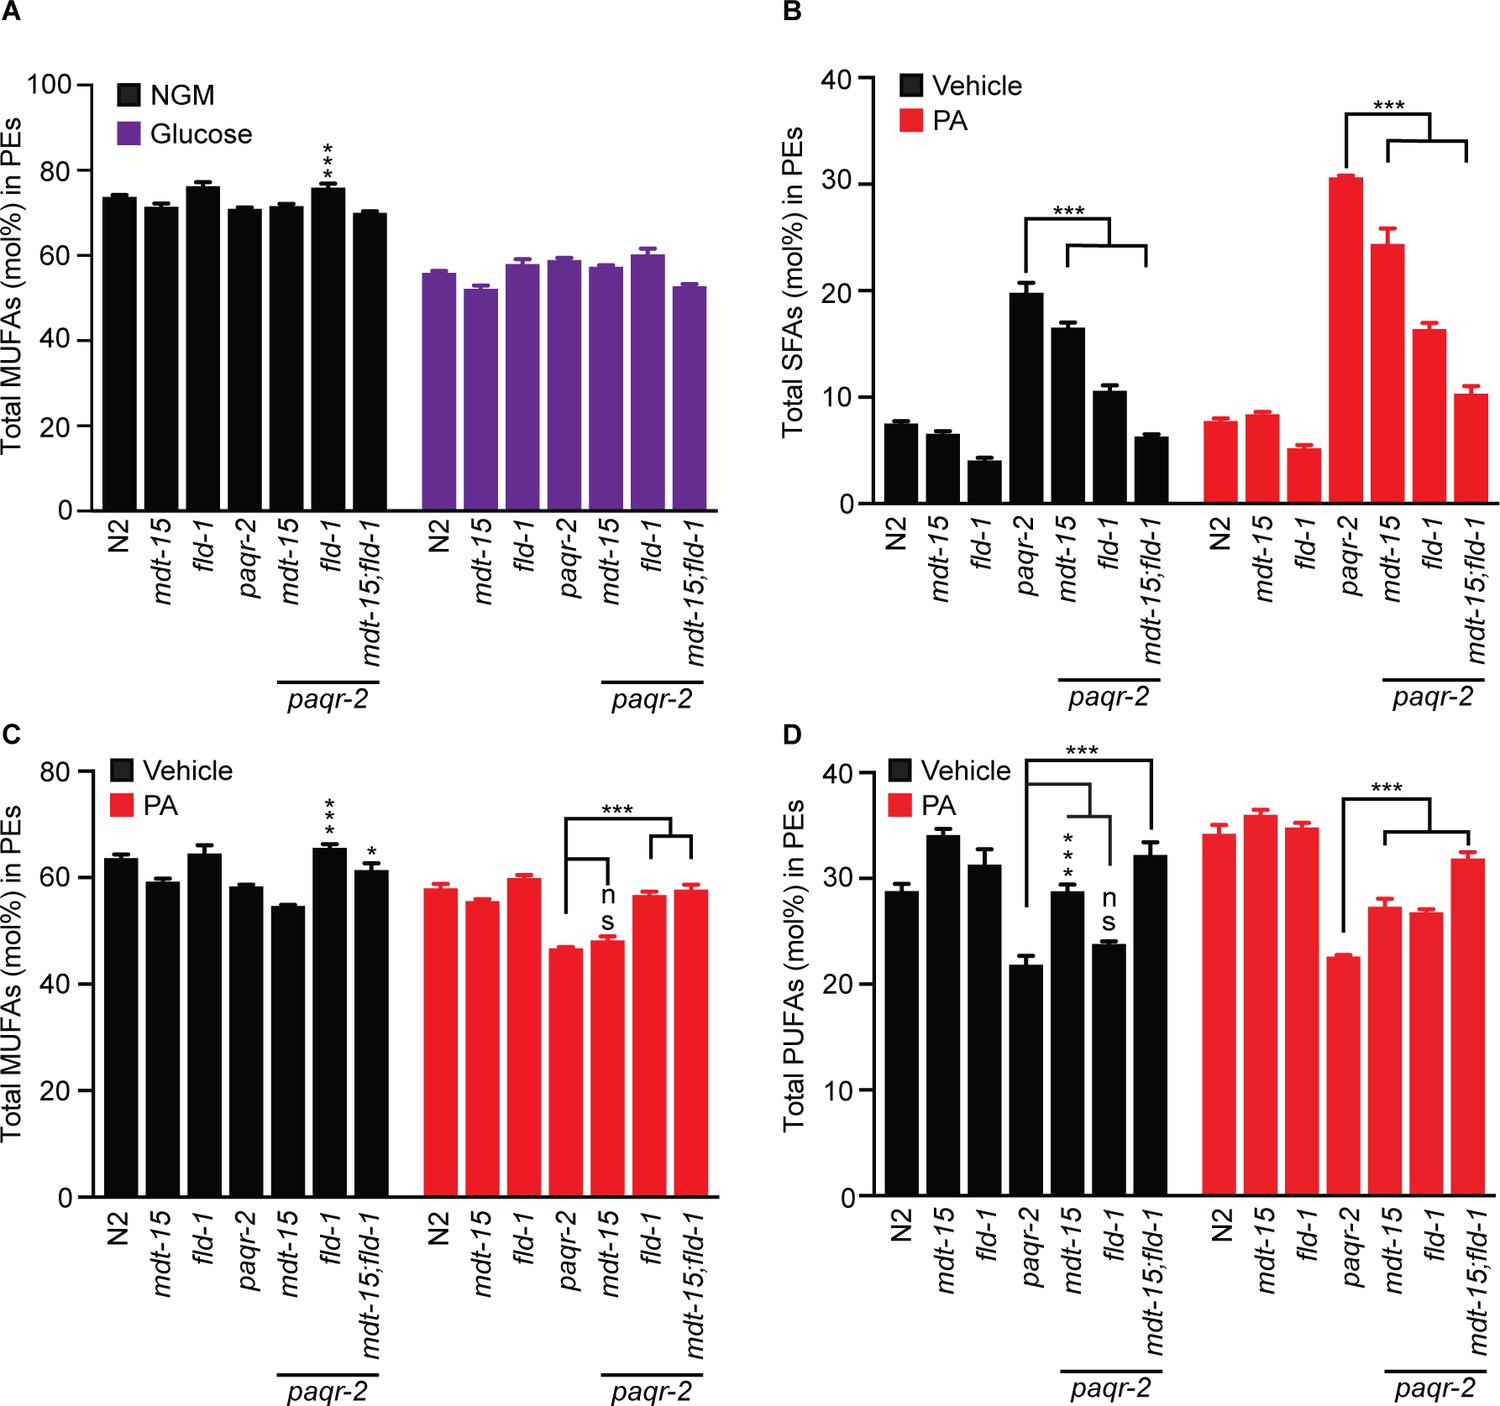
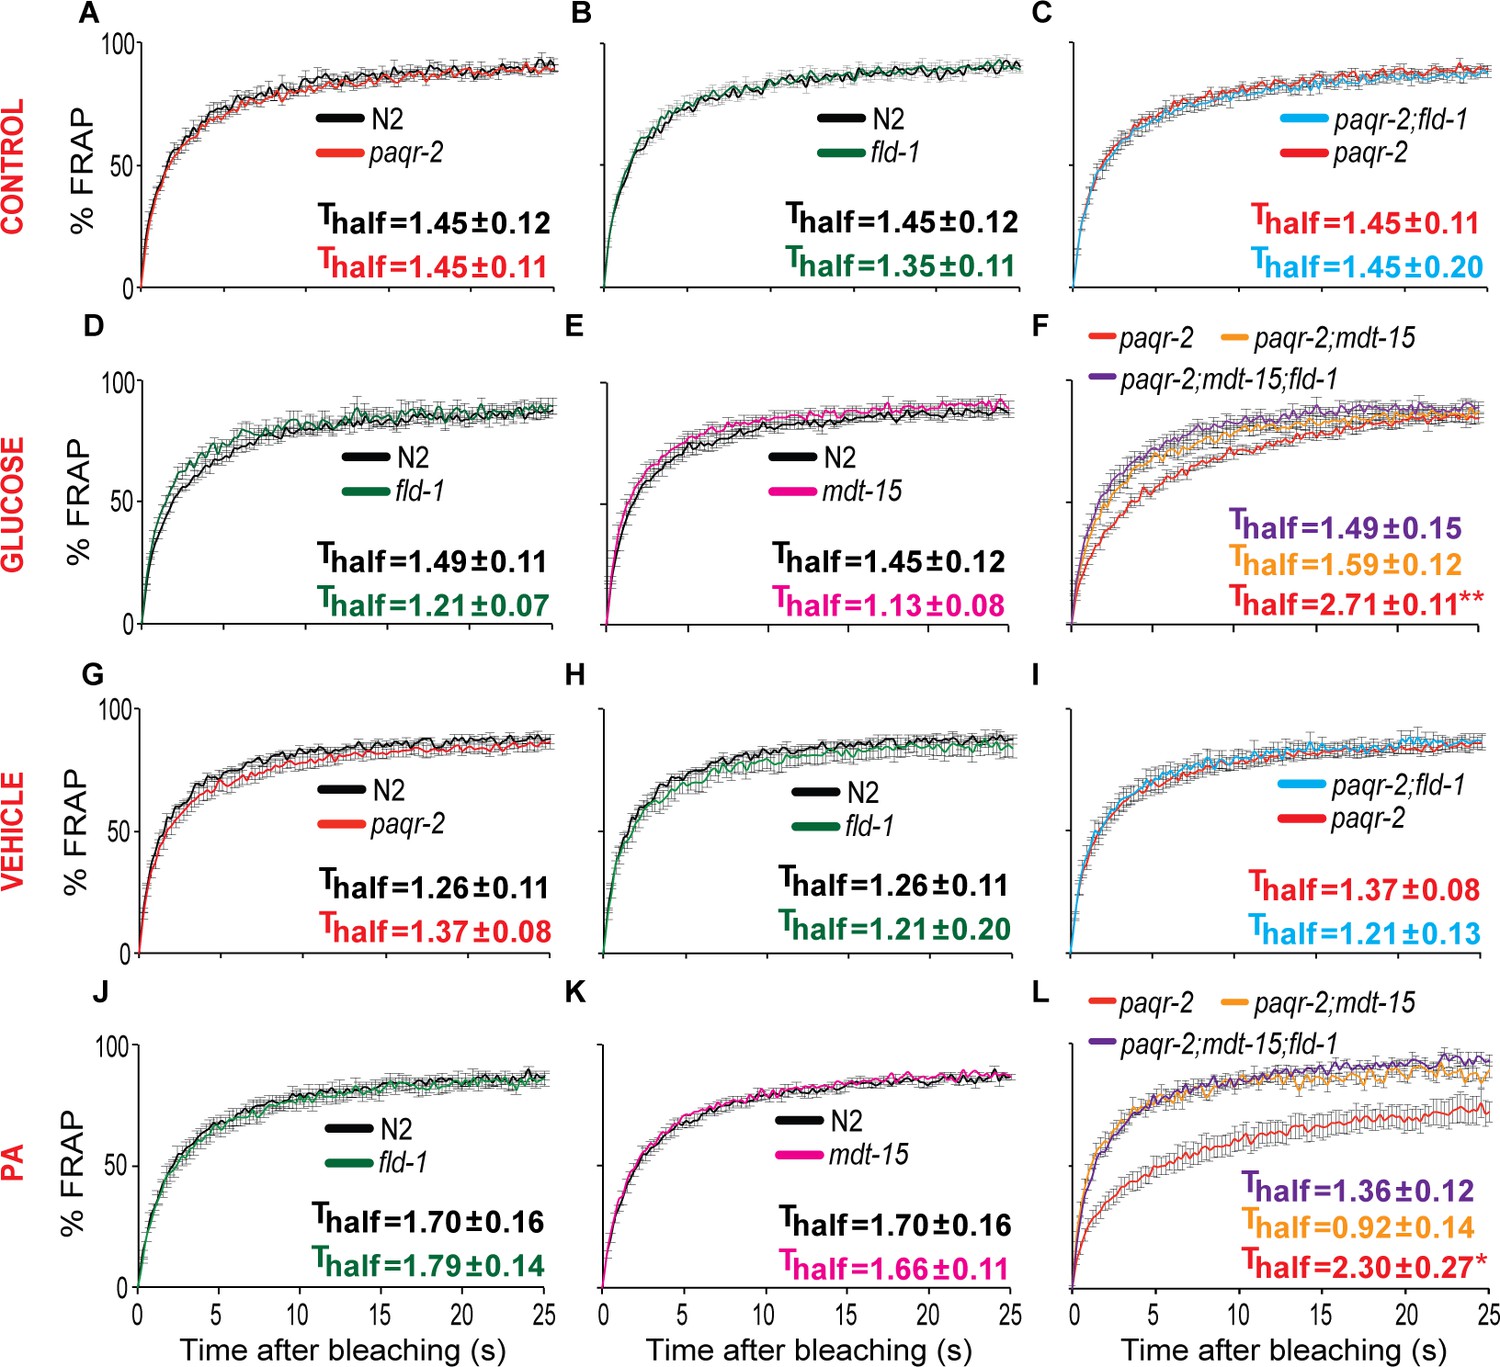
(A–B) In vivo FRAP measurements show that fld-1(et48) suppresses the membrane fluidity defect in paqr-2 mutant worms grown on 20 mM glucose or fed PA-loaded E. coli, respectively; note the normalization of the Thalf in paqr-2;fld-1 double mutants. (C–D) The fld-1(et48) and fld-1(et49) mutations do not induce upregulation of the pfat-7::gfp reporter in wild-type or paqr-2 mutant worms; in contrast, the mdt-15(et14) and cept-1(et10) mutations do cause pfat-7::gfp upregulation in both wild-type and paqr-2 mutant worms. The combination of mdt-15(et14) with fld-1(et48) or fld-1(et49) caused a slight increase in pfat-7::gfp in paqr-2 mutants compared to the effect of mdt-15(et14) alone, likely reflecting their improved health (see Figure 2D). (E) RNAi against the Δ9 desaturases fat-6 and fat-7 impairs the suppression of the paqr-2 mutant growth arrest on 20 mM glucose by fld-1(et48), mdt-15(et14) or mdt-15(et14);fld-1(et48); RNAi against fat-5 has a weaker effect. The dashed line indicates the approximate length of the L1s at the start of the experiment (~250 μm). (F–G) The paqr-2 mutant shows an excess of SFAs and reduced LCPUFAs levels among PEs on control plates and 20 mM glucose plates, and this is partially normalized by the mdt-15(et14) and fld-1(et48) single mutations and fully or nearly fully normalized by combining both mutations.
-
Figure 3—source data 1
Lipidomics data for panel F.
- https://doi.org/10.7554/eLife.40686.020
-
Figure 3—source data 2
Lipidomics data for panel G.
- https://doi.org/10.7554/eLife.40686.021
Figure 3—figure supplement 1
The fld-1(et48) mutation ameliorates the paqr-2 mutant lipid profiles and enhances the protective effects of mdt-15(et14).
(A) MUFA levels are reduced in all mutants grown on 20 mM glucose. (B) The paqr-2 mutant shows an excess of SFAs among the PEs when fed E. coli cultivated on 2% ethanol (vehicle for PA) or E. coli pre-loaded with 2 mM PA, and this defect is corrected by the mdt-15(et14) and fld-1(et49) mutations, and best corrected by a combination of both these mutations. (C) MUFA levels are also reduced in paqr-2 mutants fed PA-loaded E. coli, and this defect is corrected by the fld-1(et48) mutation. (D) The paqr-2 mutant shows reduced PUFAs levels in PEs on control plates and plates seed with PA-pre-loaded E. coli, and this is partially normalized by the mdt-15(et14) and fld-1(et48) single mutations and fully or nearly fully normalized by combining both mutations.
-
Figure 3—figure supplement 1—source data 1
Lipidomics data for panel A.
- https://doi.org/10.7554/eLife.40686.013
-
Figure 3—figure supplement 1—source data 2
Lipidomics data for panel B.
- https://doi.org/10.7554/eLife.40686.014
-
Figure 3—figure supplement 1—source data 3
Lipidomics data for panel C.
- https://doi.org/10.7554/eLife.40686.015
-
Figure 3—figure supplement 1—source data 4
Lipidomics data for panel D.
- https://doi.org/10.7554/eLife.40686.016
Figure 3—figure supplement 2
The fld-1(et48) mutation protects paqr-2 mutants against membrane rigidification.
All FRAP experiments were performed on synchronized L1 worms and each panel shows the results from separate experimental sessions on control NGM plates (CONTROL row), worms grown overnight on 20 mM glucose (GLUCOSE row), worms grown overnight on peptone-free plates seeded with E. coli cultivated in the presence of 2% ethanol (VEHICLE row) or worms grown overnight on peptone-free plates seeded with PA-loaded E. coli (PA row). Note that the fld-1(et48) and mdt-15(et14) restored normal fluidity to the paqr-2 mutant cultivated on glucose or fed PA-loaded E. coli (panels F) and L).
Figure 3—figure supplement 3
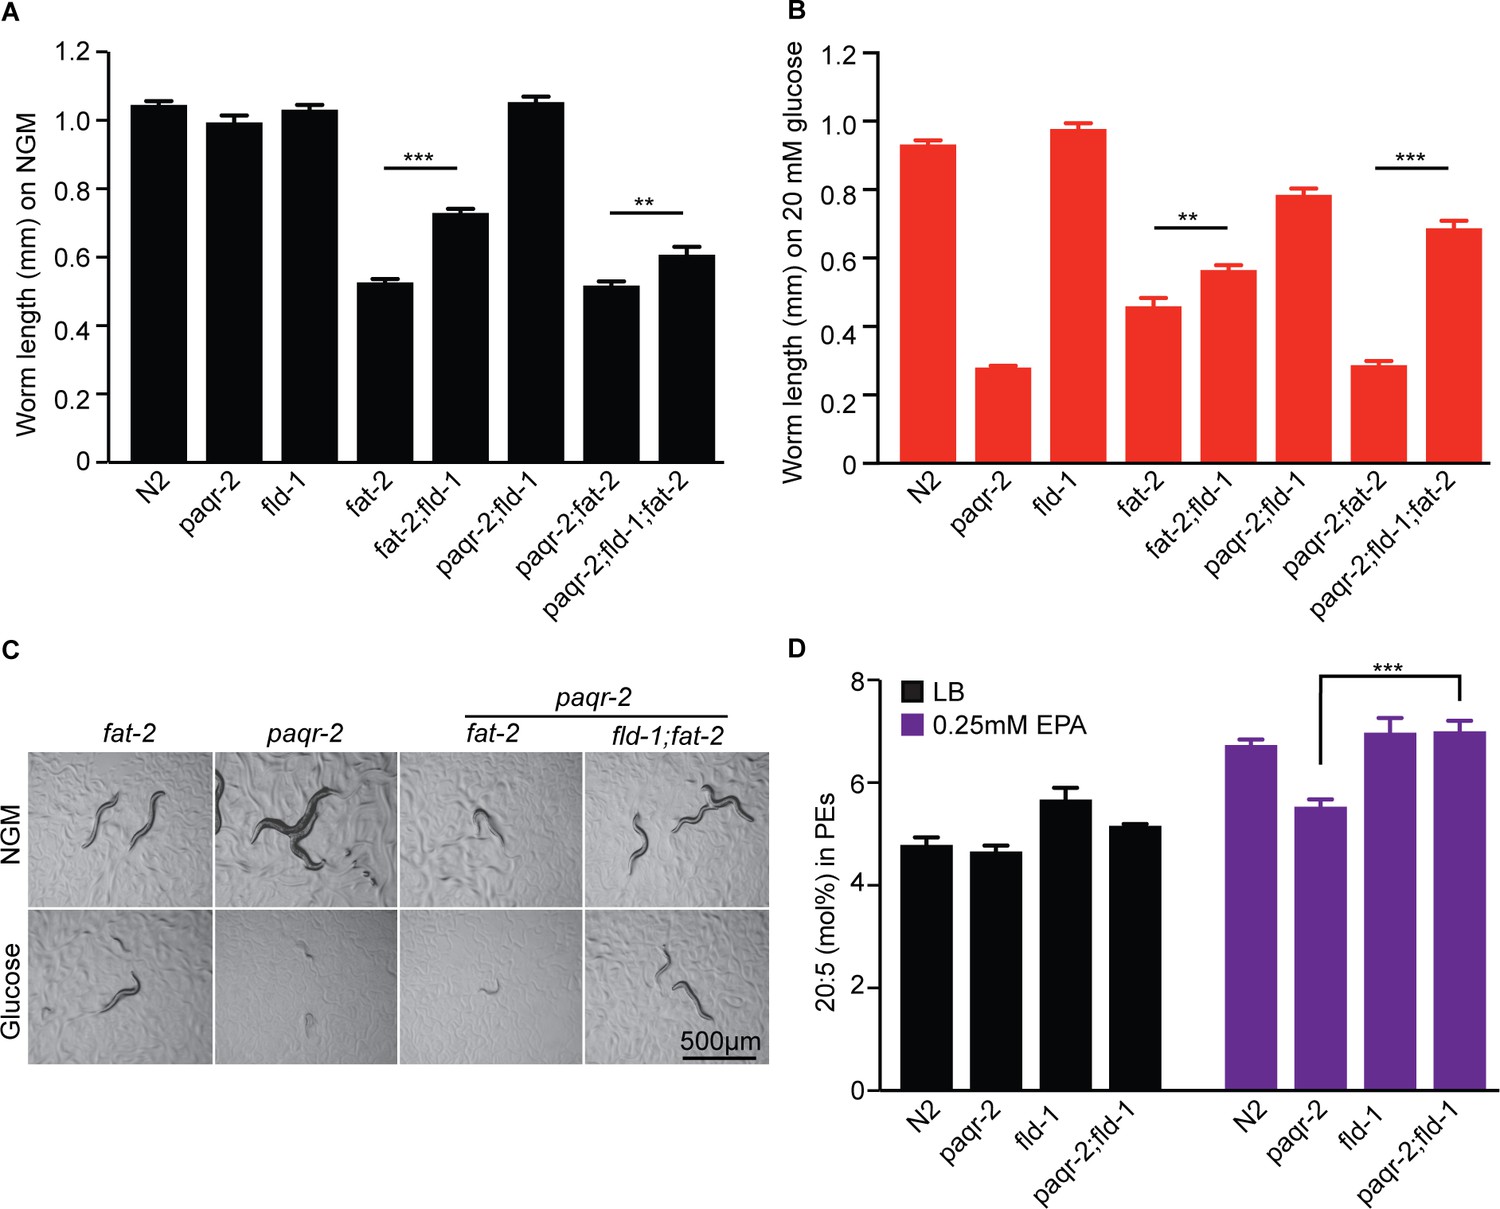
The fld-1(et48) mutation suppresses the growth defect of the fat-2(wa17) mutant and promotes accumulation of the LCPUFA eicosapentaenoic acid (EPA).
The fat-2 has a growth defect on control plates (A) and on plates containing 20 mM glucose (B) that is corrected by the fld-1(et48) mutation; the fld-1(et48) allele also corrects the growth of paqr-2;fat-2(wa17) double mutants. (C) Representative images of worms from panels (A) and (B). (D) The fld-1(et48) mutant contains an excess of EPA when fed LB-grown E. coli and normalizes EPA levels of the paqr-2 mutant when fed E. coli pre-loaded with 0.25 mM EPA.
-
Figure 3—figure supplement 3—source data 1
Lipidomics data for panel D.
- https://doi.org/10.7554/eLife.40686.019
Figure 4 with 6 supplements
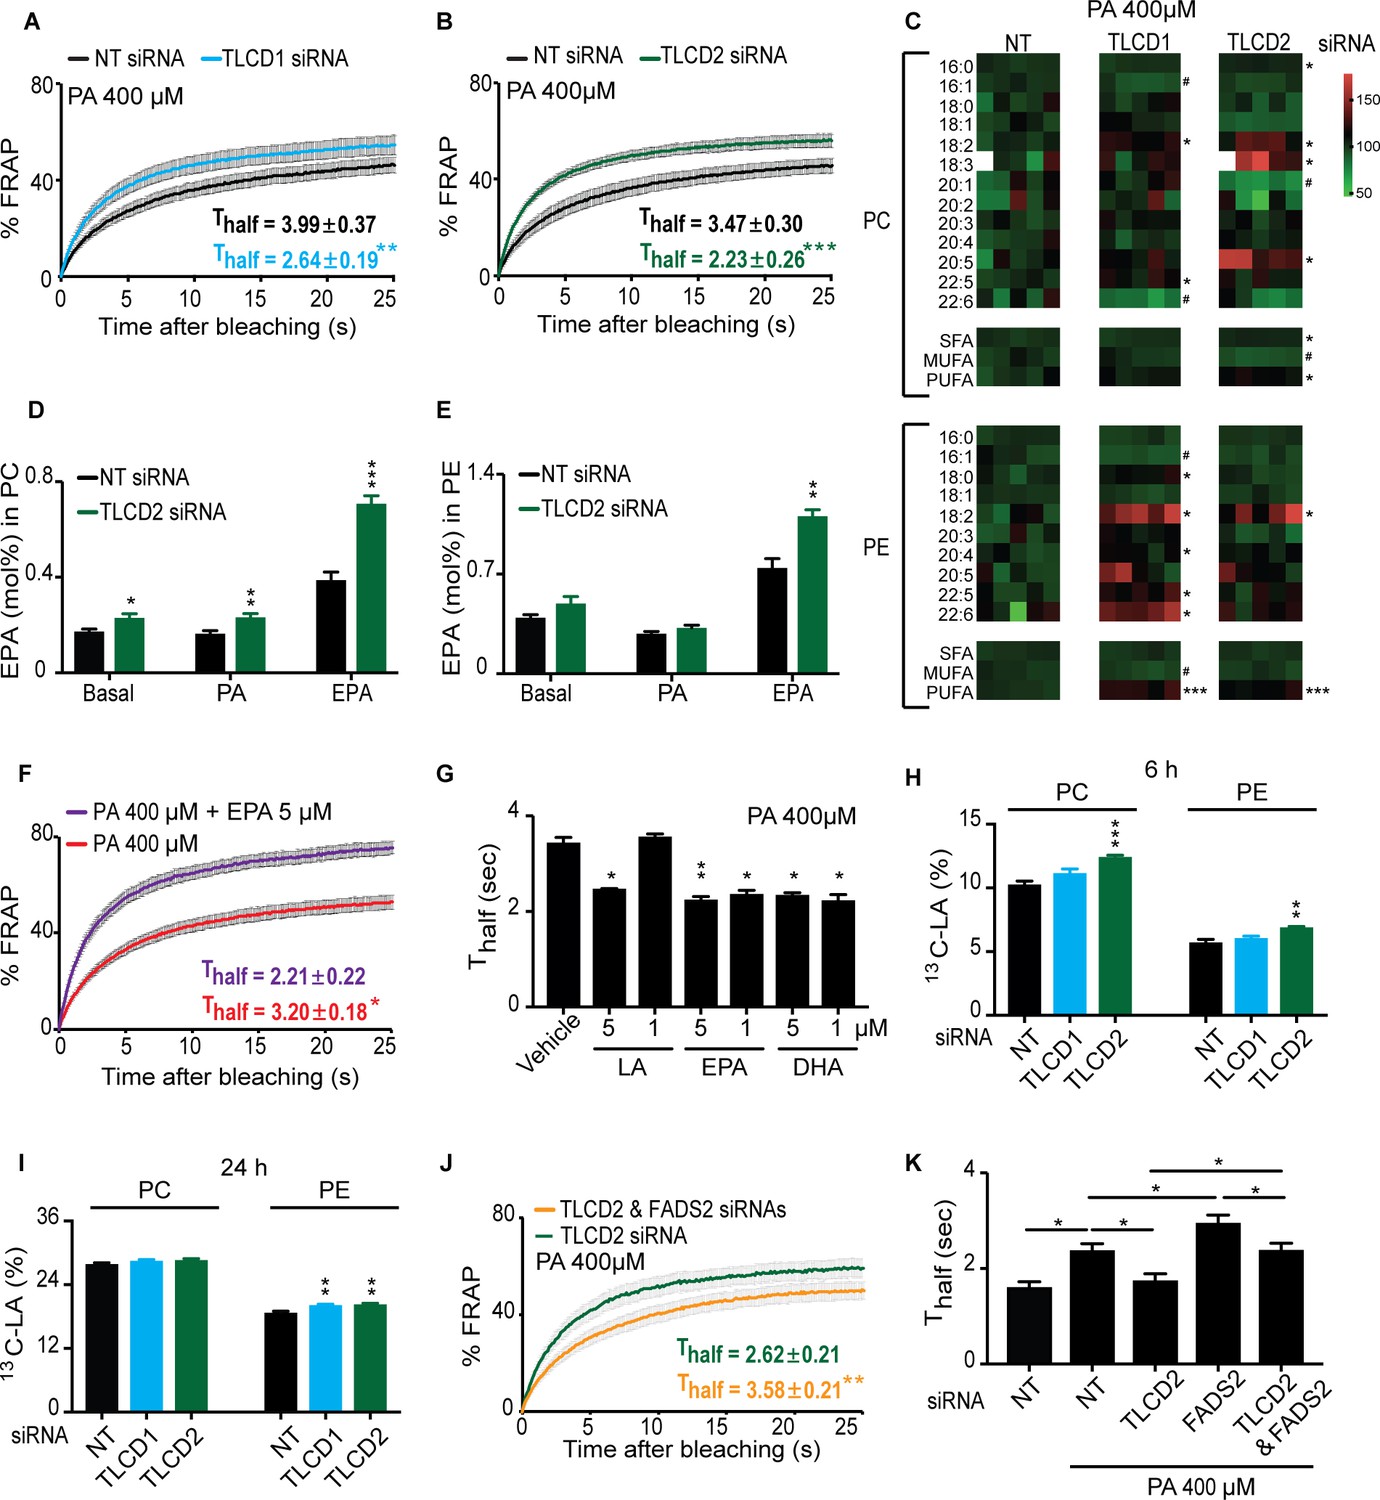
The mammalian TLCD1 and TLCD2 proteins regulate membrane composition and fluidity.
(A–B) FRAP analysis showing that siRNA against TLCD1 or TLCD2 prevent membrane rigidification by 400 μM PA in HEK293 human cells; note the significantly lower Thalf value in the TLCD1 and TLCD2 siRNA samples. (C) Heat map showing the relative abundance of various FAs in PCs and PEs of HEK293 cells treated with siRNA against TLCD1 or TLCD2 and challenged with 400 μM PA; the data are normalized to the non-target siRNA (NT) average value for each FA. Note the strong increase in several individual LCPUFAs (e.g. 18:2 and 22:6) among PEs in TLCD1 siRNA-treated cells and in LCPUFAs among both PCs (e.g. 18:2, 18:3 and 20:5) and PEs (e.g. 18:2) among TLCD2 siRNA-treated cells. TLCD2 siRNA causes an increased accumulation of EPA in PCs under basal, 400 μM PA-treated or EPA-treated conditions (D), and also in PEs when the HEK293 cells are treated with 0.9 μM EPA (E). (F–G) 1 μM EPA or DHA prevents membrane rigidification by 400 μM PA in HEK293 cells, while 5 μM linoleic acid (LA) is required for the same effect. (H–I) Amount of LA-[13C18] present in PCs and PEs after 6 and 24 hr of incubation, respectively, with cells treated with the indicated siRNA (NT, TLCD1 or TLCD2). (J–K) Knockdown of the desaturase FADS2 reduces the membrane fluidity of HEK293 cells cultivated in 400 μM PA but does not prevent the protective effect of TLCD2 knockdown.
-
Figure 4—source data 1
Lipidomics data for panel C.
- https://doi.org/10.7554/eLife.40686.031
-
Figure 4—source data 2
Lipidomics data used in panels D-E.
- https://doi.org/10.7554/eLife.40686.032
-
Figure 4—source data 3
Lipidomics data for panels H-I.
- https://doi.org/10.7554/eLife.40686.033
Figure 4—figure supplement 1

Relative expression levels of TLCD1 and TLCD2 among various mouse tissues.
Note the difference in scale between TLCD1 (A) and TLCD2 (B), which shows a much wider range of expression levels for TLCD2.
Figure 4—figure supplement 2

Specificity of the TLCD1/2 siRNA effects.
(A) QPCR quantification of TLCD1 and TLCD2 48 or 72 hr after siRNA treatment and normalized to cells treated with NT siRNA. (B) Image of BODIPY 500/510 C1, C12-labelled HEK293 cells. Note the widespread fluorescence throughout what appears to be most or all cellular membranes. (C–D) TLCD1 and TLCD2 siRNA have no effect on the membrane fluidity of HEK293 cells grown in normal media. (E) 400 μM PA causes a decrease in the membrane fluidity of HEK293 cells treated with control NT siRNA. (F–G) siRNA against the control gene PPIB does not protect against the rigidifying effects of PA. (H) TLCD1 or TLCD2 knockdown protect against PA-induced apoptosis; apoptotic cells are in the lower right quadrant of each panel. (I) Summary of several apoptosis quantification assays. Note that TLCD1 and TLCD2 knockdown is beneficial to HEK293 cells both in basal conditions and when challenged with PA. (J) The uptake rate of tritiated PA is not affected by TLCD1 or TLCD2 knockdown; phloretin was used as a positive control and strongly inhibited the uptake. (K–L) PA treatment causes an increase in the SFA content in TAGs and also raises the TAG/PC ratio; neither of these PA effects is inhibited by TLCD1 or TLCD2 siRNA. (M–N) Neither TLCD1 nor TLCD2 siRNA had an effect on Nile red staining of lipid stores in HEK2393 cultivated with or without PA, suggesting that these genes do not affect FA sequestration. (O) siRNA against TLCD1 or TLCD2 did not cause an increase in the expression of four tested desaturases; indeed, they significantly caused a decrease in the expression of SCD.
-
Figure 4—figure supplement 2—source data 1
Lipidomics data for panels K-L.
- https://doi.org/10.7554/eLife.40686.025
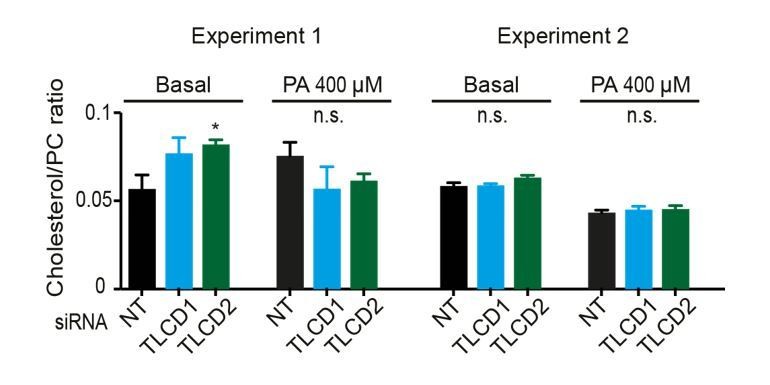
Figure 4—figure supplement 3

Effect of TLCD1/2 knockdown on FA composition and membrane fluidity.
siRNA knockdown does not cause large changes in the FA composition of PCs (A), PEs (B), PC/PE ratio (C), free cholesterol-to-PC ratio (D), or ceramide levels, which are strongly affected by cultivation in the presence of PA (E–H). TLCD2 siRNA does not cause any increase in TAG stores or in EPA storage in TAGs (I–J). (K–L) Amount of LA-[13C18] present in PCs and PEs at 6, 12 and 24 hr after its removals; the cells were treated with the indicated siRNA (NT, TLCD1 or TLCD2) and pre-incubated for 24 hr in the presence of LA-[13C18] prior to its removal. (M) qPCR quantification of the siRNA knockdown efficiency against FADS2. Symbols for statistical significance: * TLCD1 or TLCD2 >NT; # NT >TLCD1; $ NT >TLCD2; in panel K), NT differed from TLCD1 and TLCD2 with p<0.05 and p<0.005 at the 6 hr time point.
-
Figure 4—figure supplement 3—source data 1
Lipidomics data for panels A-B.
- https://doi.org/10.7554/eLife.40686.027
-
Figure 4—figure supplement 3—source data 2
Lipidomics data for panels C-D.
- https://doi.org/10.7554/eLife.40686.028
-
Figure 4—figure supplement 3—source data 3
Lipidomics data for panels E-H.
- https://doi.org/10.7554/eLife.40686.029
-
Figure 4—figure supplement 3—source data 4
Lipidomics data for panels I-J.
- https://doi.org/10.7554/eLife.40686.030
Figure 4–video 1
Movie of a FRAP experiment on NT siRNA-treated HEK293 cells.
https://doi.org/10.7554/eLife.40686.034
Figure 4–video 2
Movie of a FRAP experiment on NT siRNA-treated HEK293 cells cultivated in the presence of 400 μM PA.
https://doi.org/10.7554/eLife.40686.035
Figure 4–video 3
Movie of a FRAP experiment on TLCD2 siRNA-treated HEK293 cells cultivated in the presence of 400 μM PA.
https://doi.org/10.7554/eLife.40686.036
Figure 5 with 1 supplement
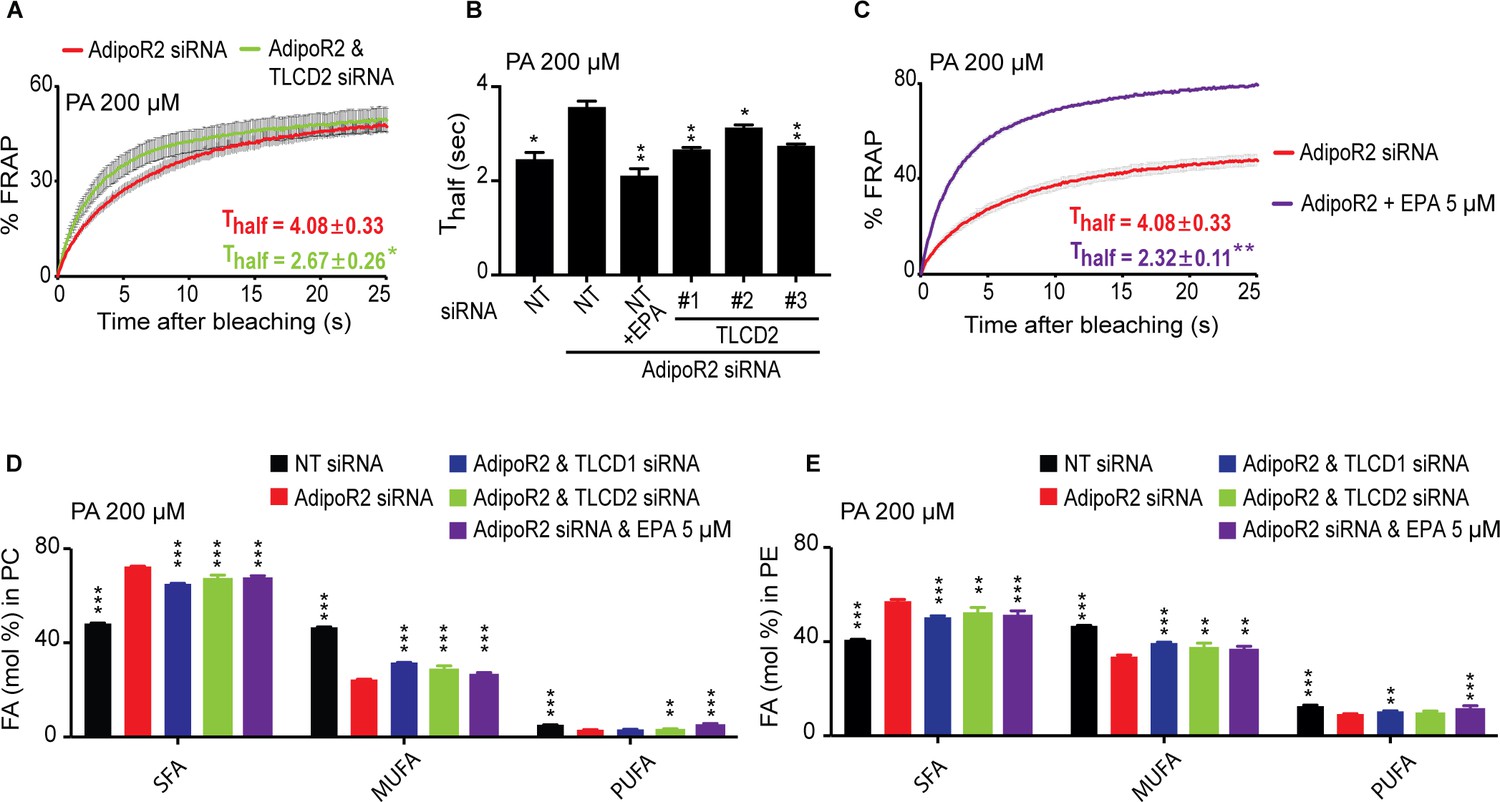
TLCD2 knockdown protects against AdipoR2 knockdown.
(A–C) FRAP analysis showing that siRNA against TLCD2 or inclusion of 5 μM EPA protects against the rigidifying effects of 200 μM PA in cells where AdipoR2 is also knocked down. Note the significantly lower Thalf value in the TLCD2 siRNA and EPA-treated samples. (D–E) AdipoR2 siRNA causes an excess of SFAs and depletion of MUFAs and PUFAs in the PCs and PEs of HEK293 cells; these effects of AdipoR2 knockdown are partially abrogated by siRNA against TLCD2 or by the inclusion of 5 μM EPA.
-
Figure 5—source data 1
Lipidomics data used in panel D.
- https://doi.org/10.7554/eLife.40686.040
-
Figure 5—source data 2
Lipidomics data for panel E.
- https://doi.org/10.7554/eLife.40686.041
Figure 5—figure supplement 1

Protective effects of TLCD1/2 knockdown against AdipoR2 knockdown.
(A) qPCR quantification of the siRNA knockdown efficiency against AdipoR2 and TLCD2. (B–E) Effect of AdipoR2, TLCD1, TLCD2 knockdown and 5 μM EPA on ceramide composition. Note that exogenous TLCD1 and TLCD2 knockdown have effects similar to that of exogenous EPA.
-
Figure 5—figure supplement 1—source data 1
Lipidomics data used in panels B-E
- https://doi.org/10.7554/eLife.40686.039
Figure 6

Updated model of membrane fluidity regulation in C. elegans.
Loss of membrane fluidity, which may result from lowered temperature or SFA-rich diets, is sensed by the PAQR-2/IGLR-2 complex that then signals to promote FA desaturation, hence restoring fluidity; lof and gof mutations in the genes labelled in red and green, respectively, can act as paqr-2/iglr-2 suppressors (Devkota et al., 2017; Svensk et al., 2016a; Svensk et al., 2013). The present study shows that an alternative route to promote membrane fluidity is to inhibit FLD-1, for example by mutation, which results in reduced turnover of LCPUFA-containing phospholipids, hence allowing their accumulation. The names of mammalian homologs for PAQR-2 and FLD-1 are indicated in parenthesis; the mammalian homolog of IGLR-2 is not yet identified. The possibility that PAQR-2 regulates FLD-1 (dashed line) is suggested by the fact that lof mutations in fld-1 suppress paqr-2 mutant phenotypes; there is at present no evidence for physical interactions.
Author response image 1
Tables
Key resources table
| Reagent type (species) or resource | Designation | Source or reference | Identifiers | Additional information |
|---|---|---|---|---|
| Strain, strain background (C. elegans) | N2 | C. elegans Genetics Center (CGC) | ||
| Strain, strain background (C. elegans) | CL2166 (dvIs19 [(pAF15)gst- 369 4 p::GFP::NLS] | C. elegans Genetics Center (CGC); PMID: 12078522 | ||
| Strain, strain background (C. elegans) | HA1842 [rtIs30(pfat-7::GFP)] | PMID: 22035958 | Gift from Amy Walker | |
| Genetic reagent (C. elegans) | fld-1(et45); fld-1(et46); fld-1(et47); fld-1(et48); fld-1(et49); fld-1(et50); fld-1(et51); fld-1(et53) | This paper | et45, et48 and et49 will be deposited at CGC | |
| Genetic reagent (C. elegans) | SJ4005 [zcIs4 (hsp-4::GFP)] | C. elegans Genetics Center (CGC) | ||
| Genetic reagent (C. elegans) | fld-1(gk653147) | C. elegans Genetics Center (CGC) | From strain VC40470 | |
| Genetic reagent (C. elegans) | paqr-2(tm3410) | C. elegans Genetics Center (CGC); doi:10.1371/ journal.pone.0021343 | ||
| Genetic reagent (C. elegans) | iglr-2(et34) | C. elegans Genetics Center (CGC); PMID 27082444 | ||
| Genetic reagent (C. elegans) | mdt-15(et14) | C. elegans Genetics Center (CGC); DOI 10.1371/journal. pgen.1003801.s013 | ||
| Genetic reagent (C. elegans) | cept-1(et10) | C. elegans Genetics Center (CGC); DOI 10.1371/journal. pgen.1003801.s013 | ||
| Genetic reagent (C. elegans) | hacd-1(et12) | C. elegans Genetics Center (CGC); DOI 10.1371/journal.pgen.1003801.s013 | ||
| Genetic reagent (C. elegans) | Y48G8AL.13 (ok3097) | C. elegans Genetics Center (CGC) | ||
| Genetic reagent (C. elegans) | F41H10.5 (gk530235) | C. elegans Genetics Center (CGC) | From strain VC40240 | |
| Cell line (Homo sapiens) | HEK293 | |||
| Antibody | Rabbitt anti-FLD-1 | This paper | Raised by GeneScript against this peptide: TQVGDVESGPLRTQ. Used at 1:500 dilution for Western blot. | |
| Recombinant DNA reagent | Pfld-1::FLD-1 | This paper | ||
| Recombinant DNA reagent | Pfld-1::FLD-1::GFP | This paper | ||
| Recombinant DNA reagent | Pelt-3::FLD-1::GFP | This paper | ||
| Recombinant DNA reagent | Pges-1::FLD-1::GFP | This paper | ||
| Sequence- based reagent | TLCD1 siRNA | Dharmacon | J-015483–10 | |
| Sequence- based reagent | TLCD2 siRNA | Dharmacon | J-180826–09; J-180826–16; J- 180826–17 | |
| Sequence- based reagent | AdipoR2 siRNA | Dharmacon | J-007801 | |
| Sequence- based reagent | NT siRNA | Dharmacon | D-001810–10 | Non-target control |
| Sequence- based reagent | FADS2 siRNA | Dharmacon | J-008211–09 | |
| Sequence- based reagent | PPIB siRNA | Dharmacon | D-001820–10 | |
| Commercial assay or kit | FITC Annexin V Apoptosis Detection Kit I | BD Bioscience | Cat No 556547 | |
| Commercial assay or kit | RevertAid H Minus First Strand cDNA Synthesis Kit | ThermoFisher | K1631 | |
| Commercial assay or kit | High Capacity cDNA Reverse Transcription Kit | Applied Biosystem | 10400745 | |
| Commercial assay or kit | Hot FIREPol EvaGreen qPCR Supermix | Solis Biodyne | 08-36-00001 | |
| Commercial assay or kit | Viromer Blue | Lipocalyx | VB-01LB-01 | |
| Chemical compound, drug | Palmitic acid | Sigma-Aldrich | P0500 | |
| Chemical compound, drug | Linoleic acid | Sigma-Aldrich | L1376 | |
| Chemical compound, drug | Eicosapentaenoic acid | Sigma-Aldrich | E2011 | |
| Chemical compound, drug | [9,10-3H(N)]-Palmitic Acid | Perkin Elmer | NET043001MC | |
| Chemical compound, drug | Linoleic acid-[13C18] | IsoSciences | S14495-1.0 | IsoSciences provided a stock dissolved in DMSO |
| Chemical compound, drug | BODIPY 500/510 C1,C12 | Invitrogen | D3823 |
Additional files
-
Transparent reporting form
- https://doi.org/10.7554/eLife.40686.043
Download links
A two-part list of links to download the article, or parts of the article, in various formats.
Downloads (link to download the article as PDF)
Open citations (links to open the citations from this article in various online reference manager services)
Cite this article (links to download the citations from this article in formats compatible with various reference manager tools)
Membrane fluidity is regulated by the C. elegans transmembrane protein FLD-1 and its human homologs TLCD1/2
eLife 7:e40686.
https://doi.org/10.7554/eLife.40686


