Elevated synaptic vesicle release probability in synaptophysin/gyrin family quadruple knockouts
- Universidad de Navarra, Spain
- Max Planck Institute for Biophysical Chemistry, Germany
- Institute for Neurosciences CSIC-UMH, Spain
Figures
Figure 1 with 1 supplement
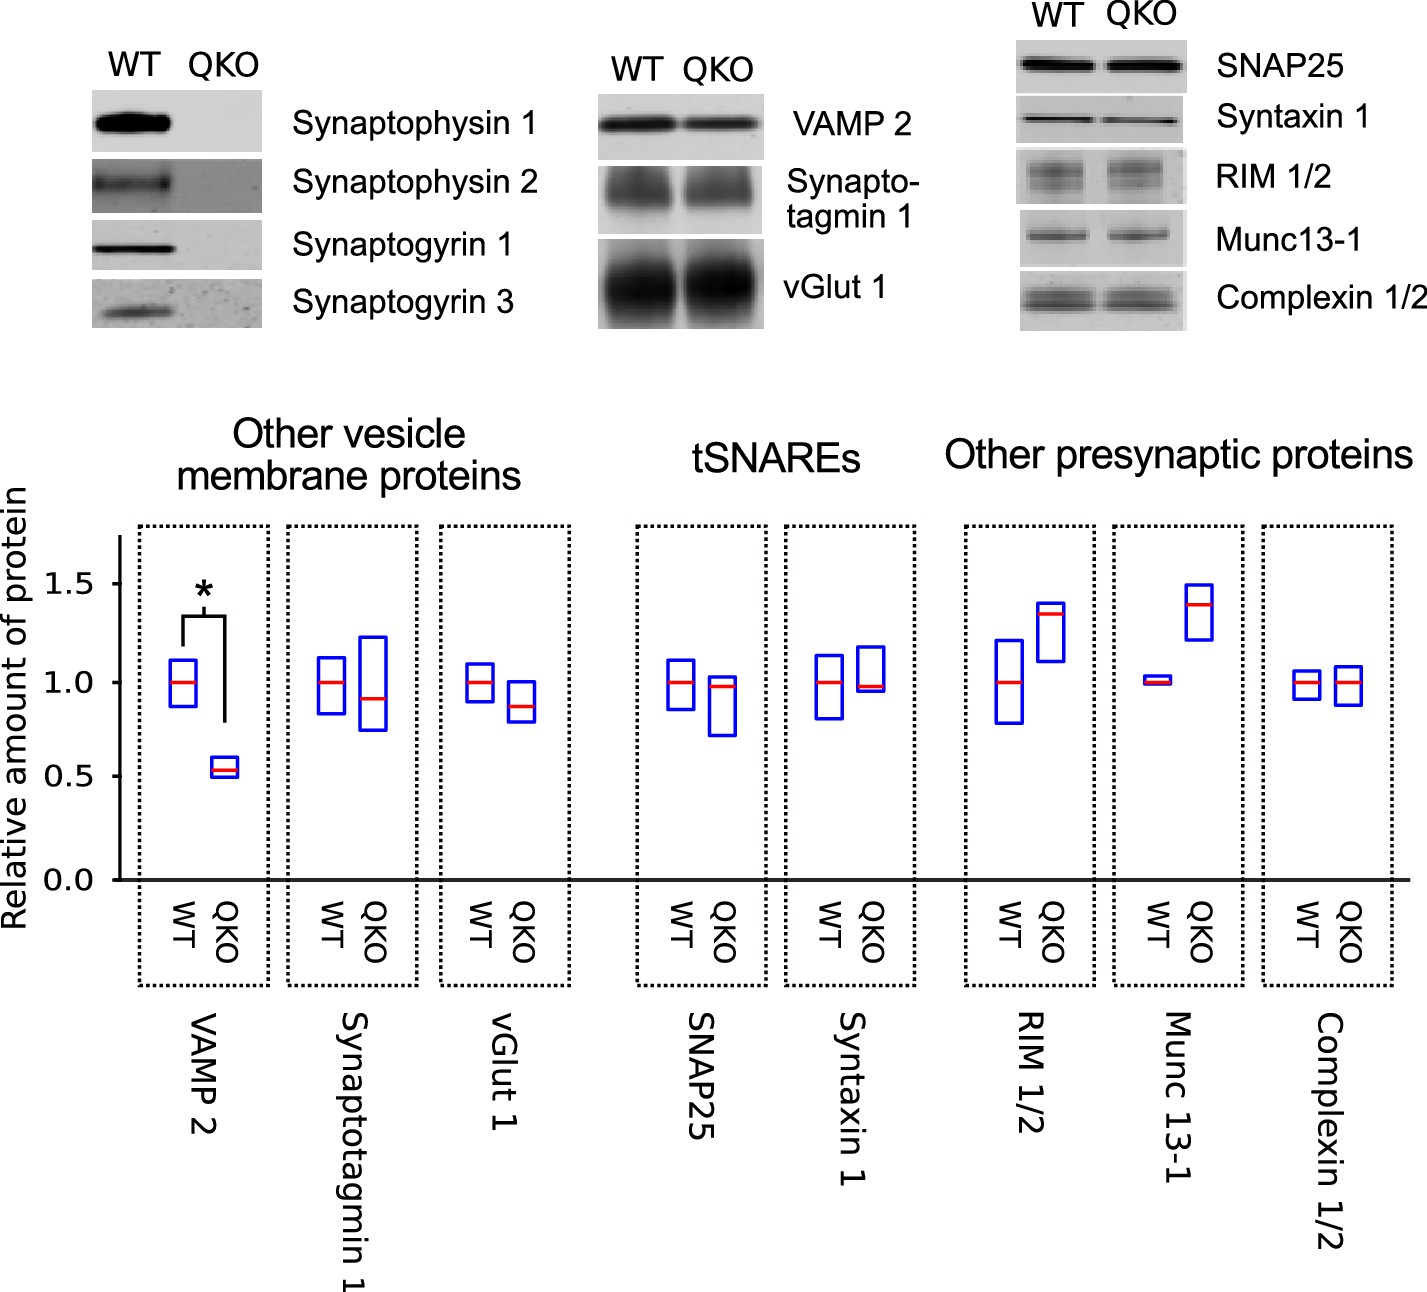
Selective decrease in VAMP 2 levels in synaptosomes of QKO mice.
Representative immunoblots and quantification of the indicated proteins from synaptosomes purified from brains of 3-month-old WT and QKO mice. Synaptosomes were prepared separately from cohorts of four male and four female individuals, but results were pooled because no substantial differences were detected between sexes. Horizontal lines are median values, boxes are the middle two quartiles. *p<0.05; Wilcoxon rank sum with Bonferonni correction for multiple comparisons; n (2 independent preparations; samples were run at least 3 times).
Figure 1—figure supplement 1
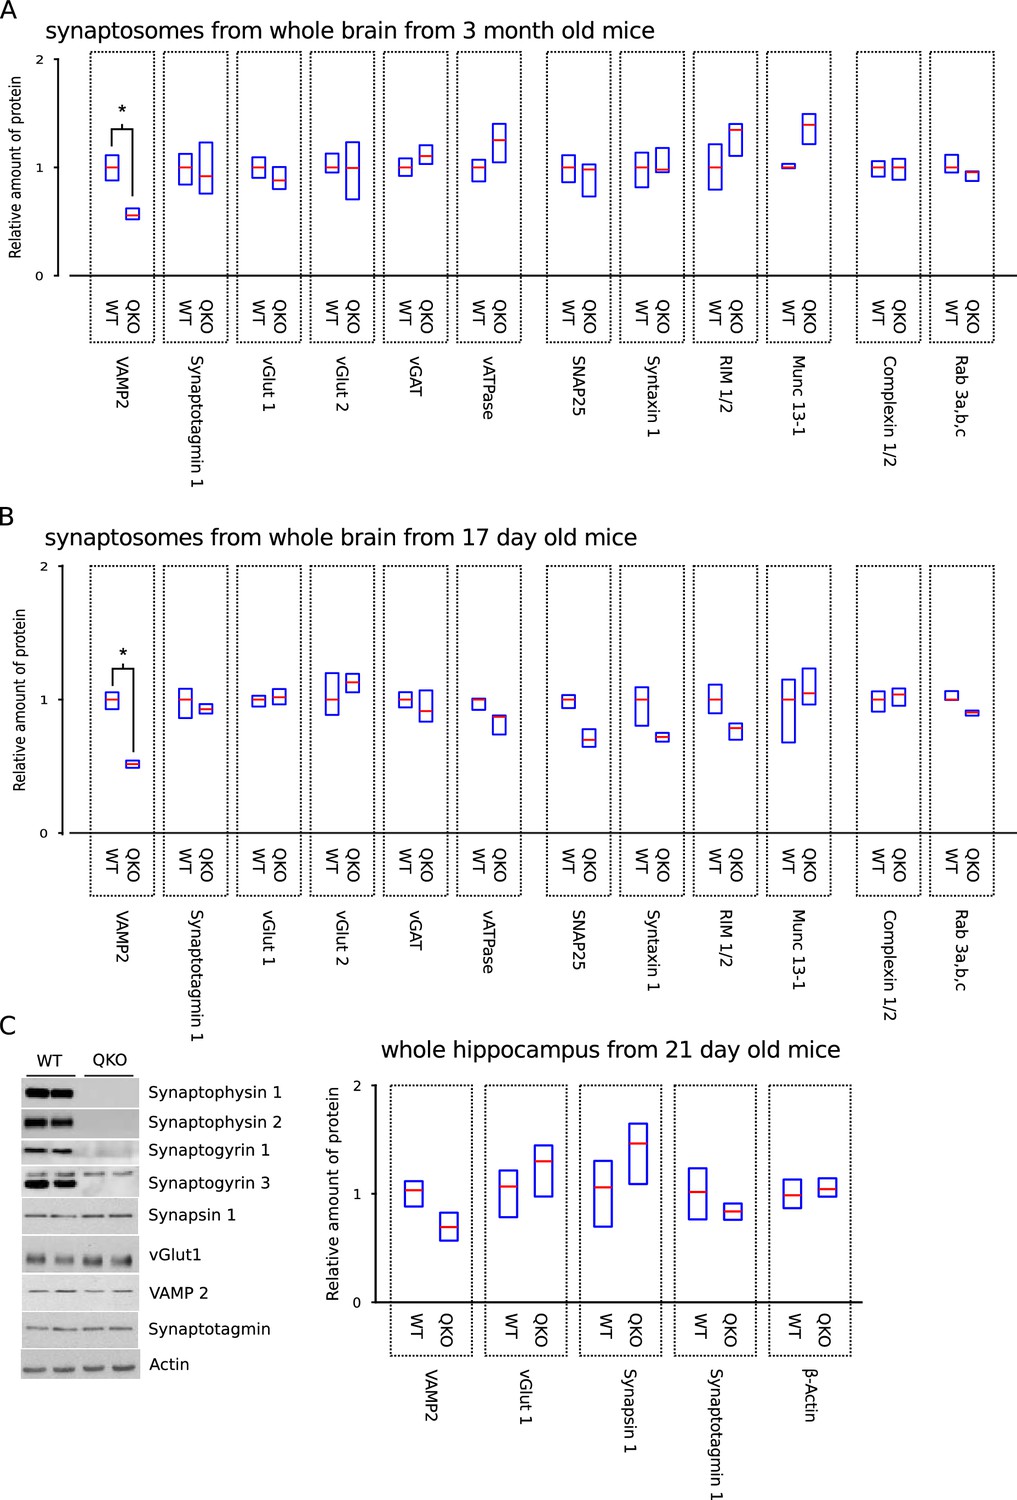
More extensive biochemical analysis including more proteins, different ages, and different methods for sample preparation.
More extensive biochemical characterization of QKO brains. (A,B) Full panel of synaptic proteins analyzed in purified synaptosomes from whole brain of 3-month-old and 17-day-old WT and QKO mice; a subset of the results from 3-month-old are plotted in Figure 1. Cohorts of 5 animals (3 males, 2 females for each genotype) were used for younger mice. *p<; Wilcoxon rank sum with Bonferonni correction for multiple comparisons; n . (C) Representative immunoblots and quantification of the indicated proteins in homogenates of hippocampus from n = 4 21-day-old male mice for each genotype. No significant differences between WT and QKO were detected for any of the proteins (two sample t-tests with significance levels adjusted using the Bonferroni correction for multiple comparisons). In all panels, horizontal lines are median values, boxes are the middle two quartiles.
Figure 2 with 1 supplement
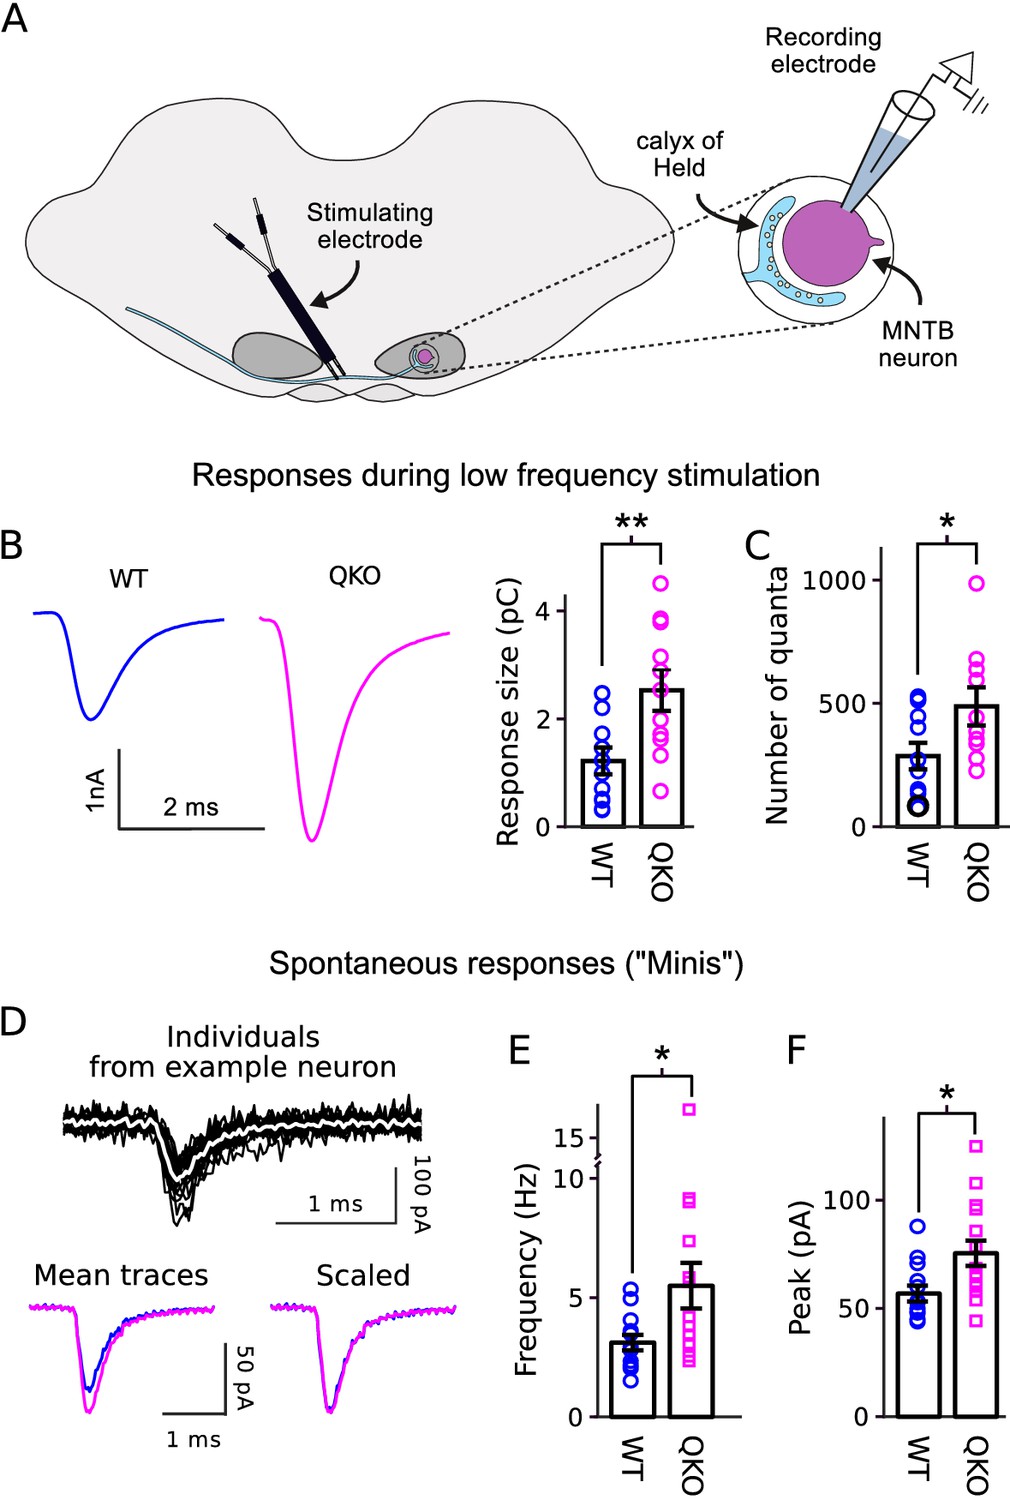
Increased transmitter release at QKO calyces of Held.
(A) Diagram of calyx of Held preparation; MNTB is the medial nucleus of the trapezoid body. (B) Larger responses at QKO synapses after isolated/low frequency presynaptic action potentials (i.e., each after at least 1 min of rest). Traces are average responses across all preparations; n calyces for both WT and QKO, each from a separate slice; experimenter was blind to genotype; extracellular 1mM kynurenic acid was used throughout. (C) Response sizes from (B) after normalizing by quantal size calculated as in Mahfooz et al. (2016). (D-F) Analysis of spontaneous responses recorded before adding kynurenic acid; n calyces for both WT and QKO. (D) Black traces are overlay of all individuals from a single QKO neuron. The white trace is the mean that was used later for quantification. Mean traces are means of all individuals across all preparations. (E and F) Data points correspond to single preparations. Bars are mean ± s.e.m.; *p < 0.05; **p < 0.01; Wilcoxon rank sum.
Figure 2—figure supplement 1

No difference in shape of EPSC at QKO calyces of Held.
No difference in shape of EPSC at QKO calyces of Held. (A) Scaled overlay of traces in Figure 2B. (B) Quantification of 20% to 80% rising phase of EPSCs. (C) Quantification of shape of EPSCs by dividing the current integral by the peak . (D and E) Quantification of shape of spontaneous events documented in Figure 2D–F.
Figure 3 with 1 supplement

Selective increase in probability of release at QKO calyces of Held.
(A) Diagram illustrating the RRP when nearly full during low-frequency stimulation (left) and when driven to a near-empty steady state by high-frequency stimulation (right). Gray circles represent vesicles, vesicles docked to release sites (squares) are readily releasable. By definition, the quantal content of individual synaptic responses is equal to the mean probability of release per vesicle within the RRP - - multiplied by the number of vesicles within the RRP. However, the precise value of ceases to be relevant when the RRP is driven to a near-empty steady state because vesicles undergo exocytosis soon after being recruited and, as a consequence, recruitment to the RRP (black arrows, right panel) supplants vesicle exocytosis as the rate-limiting mechanism. (B) Average response across all calyces during 300 ms of 300 Hz stimulation after blanking stimulus artifacts. Scale bars are 1 nA vs 100 ms (outer) and 1 nA vs 10 ms (inner, corresponding to the insets showing first 15 responses). (C) Mean number of quanta for each response vs time. Responses were first measured as the current integral after subtracting a baseline calculated from the 100 ms before stimulation began, and then normalized by mean quantal size. (D) Cumulative number of quanta. Theoretical curves are estimates of the cumulative response generated by release of transmitter recruited to the RRP during ongoing stimulation plus the offset needed to make the phase between 150 ms and 300 ms match the cumulative release; the value at Time = 0 equals the capacity of the RRP for storing vesicles. Lines marked ‘S’ are calculated using the method in Schneggenburger et al. (1999), whereas lines marked ‘M’ are calculated using Eqn (1) in Mahfooz et al. (2016), and describe the model illustrated in (A); note that both curves for both genotypes are plotted (magenta for QKO, blue for WT). The full 300 ms of 300 Hz stimulation elicited multiple rounds of exocytosis of readily releasable vesicles for both genotypes, including a total of 7076 ± 531 quanta at QKO synapses, which is more than double even the largest estimates of RRP content (ordinate intercept of ‘M’). (E) for calyces calculated using the theories in (D) to estimate vesicle recruitment (p < 0.01; rank sum; same preparations as Figure 2). (F) Unitary recruitment rate for individual calyces. The unitary recruitment rate is defined as the fraction of vacant space within the RRP replenished in a given amount of time; the concept is depicted by the black arrows in (A), right, and is analogous to a rate constant in first-order kinetics.
Figure 3—figure supplement 1
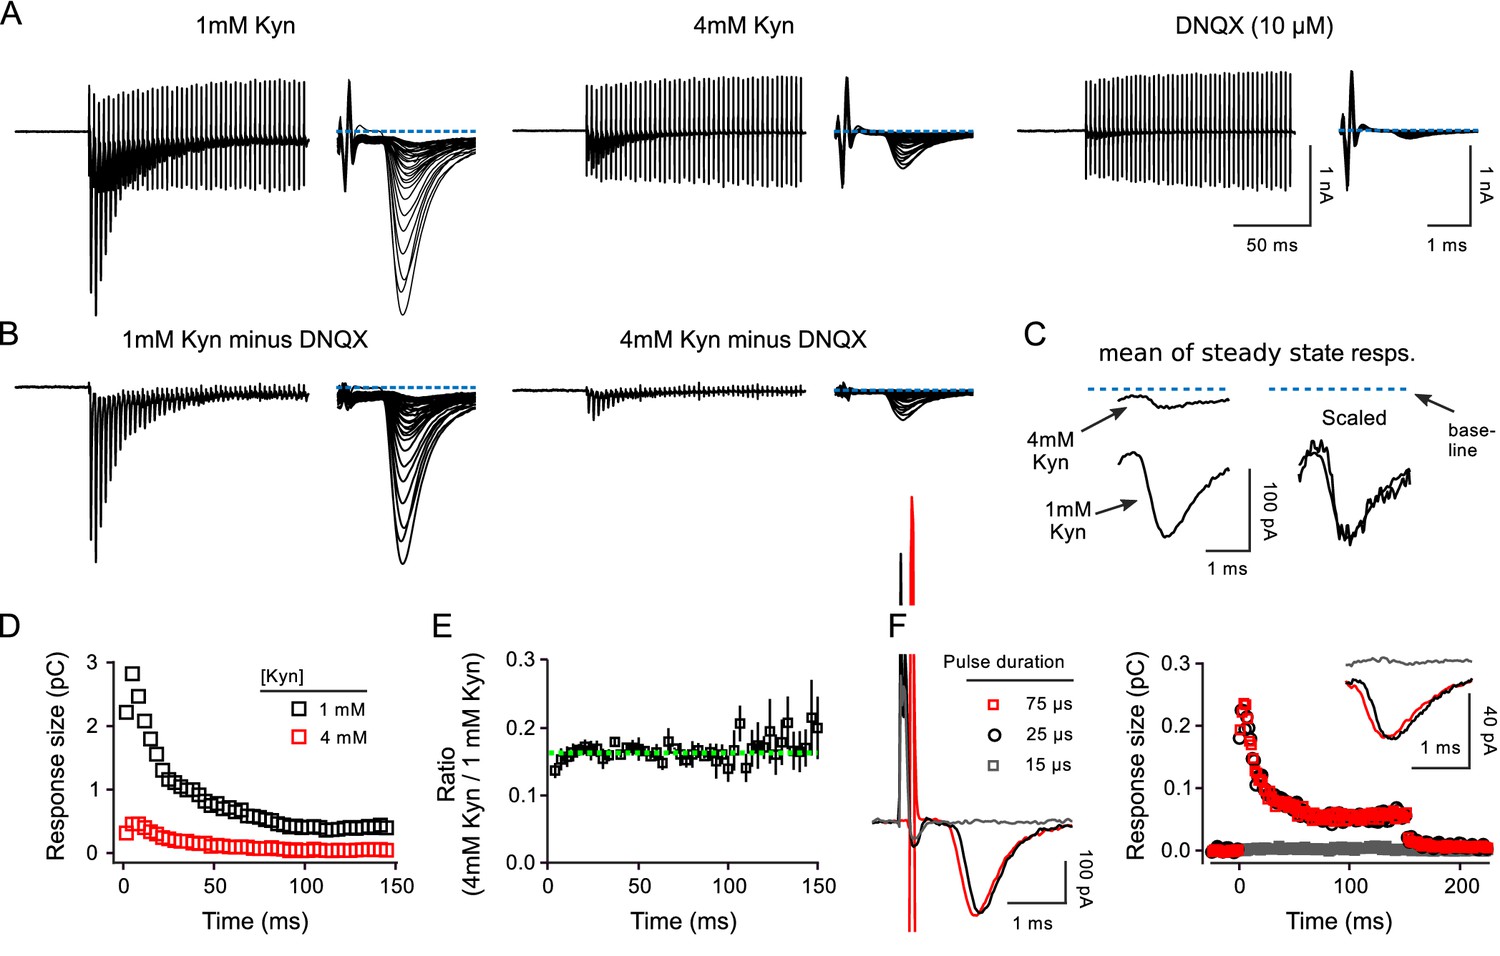
Controls for receptor desensitization.
Controls for receptor desensitization and spill over at calyx of Held. (A-E) Comparison of postsynaptic responses during 300 Hz stimulation in 1 vs in 4 mM kynurenic acid at QKO synapses. (A) Responses in 1 and 4 mM kynurenic acid, and in 10 μM DNQX. (B) Differential responses generated by subtracting the trace recorded in DNQX. (C) Mean of responses during steady state achieved after inducing depression. No difference was detected in either the phasic or tonic components in 1 vs 4 mM kynurenic acid. The tonic component is likely caused by so-called asynchronous release, which is evoked vesicular glutamate release that is only loosely coupled in time to the evoking action potentials, and occurs more often during high-frequency stimulation when the residual Ca2+ level is high (Atluri and Regehr, 1998; Sakaba, 2006). (D and E) No difference in 1 vs 4mM kynurenic acid in the measures of short-term plasticity used in the main manuscript for calyx of Held synapses. (D) Current integral measurements for traces in (B). (E) Quantification from n = 3 preparations (mean ± s.e.m.; all QKO). Green dashed line is the mean value of all data points. The small deviation of the first one or two data points indicates that 4 mM kynurenic acid blocked the response to the first pulse of stimulation by slightly more than subsequent responses. The cause of the deviation is not known, but likely does not involve AMPA receptor desensitization, which would be expected to affect later responses more than earlier responses. In any case, the effect was not enough to alter estimates of the timing of vesicle recruitment. A similar effect was seen at WT synapses (not shown). Results in (D–E) rule out a substantive contribution of receptor desensitization to our calyx of Held measurements by the following logic: (i) kynurenic acid prevents receptor desensitization by preventing activation; (ii) switching from 1 to 4mM decreases response size and therefore receptor occupancy by 7-fold and would therefore reduce the amount of desensitization by a large amount, which would alter short-term plasticity; (iii) thus, the absence of substantive alterations in short-term plasticity indicates that receptor desensitization did not play a role when synapses were bathed in 1 mM kynurenic acid, or more. Note that the situation may be different in tissue from younger animals (Neher and Sakaba, 2001). (F) Comparison of postsynaptic responses during 300 Hz stimulation when the duration of stimulation pulses was: just above threshold (black); 3X higher (red); and just below threshold (gray). Kynurenic acid was 2 mM. The traces to the left are the responses to the first pulses of stimulation. Traces in the inset are the mean traces when the synapses are in a depressed steady state. These results argue against a contribution of neurotransmitter spill over from nearby synapses to the steady state response.
Figure 4
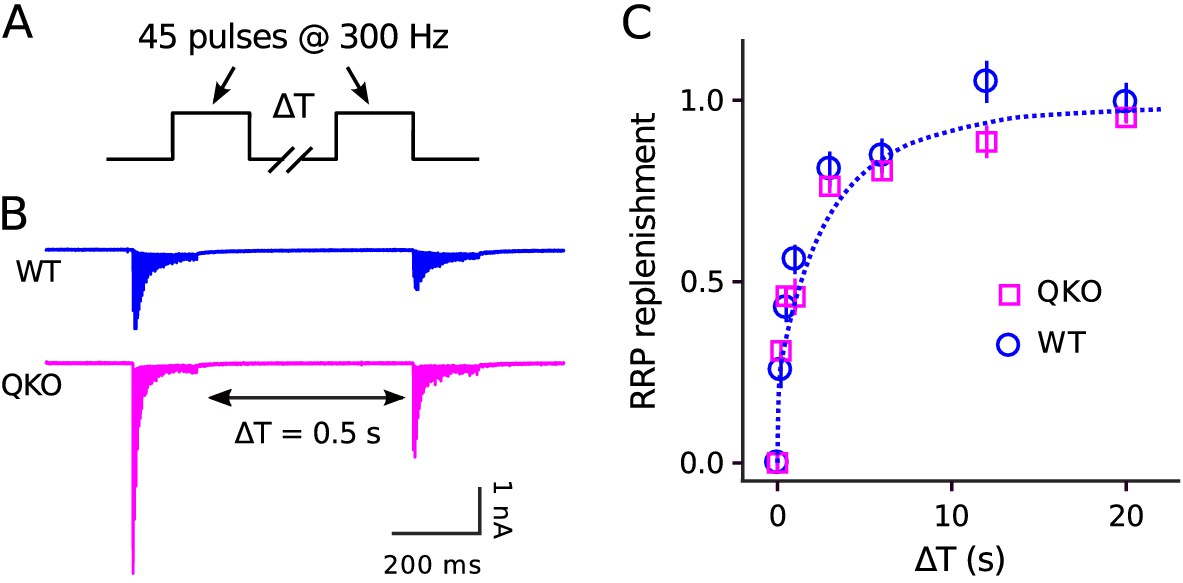
No alteration in timing of RRP replenishment at QKO calyces of Held.
(A) Experimental design. (B) Averaged recordings for trials with a rest interval of 0.5s between trains from single preparations. (C) RRP replenishment vs time estimated as in Mahfooz et al. (2016); n trials from 7 calyces for QKO and 8 trials from 3 calyces for WT. The dashed line is with the decaying exponential defined by Eqn (4) in Mahfooz et al. (2016), except to match the value used to generate curve ‘M’ in Figure 3D.
Figure 5 with 2 supplements
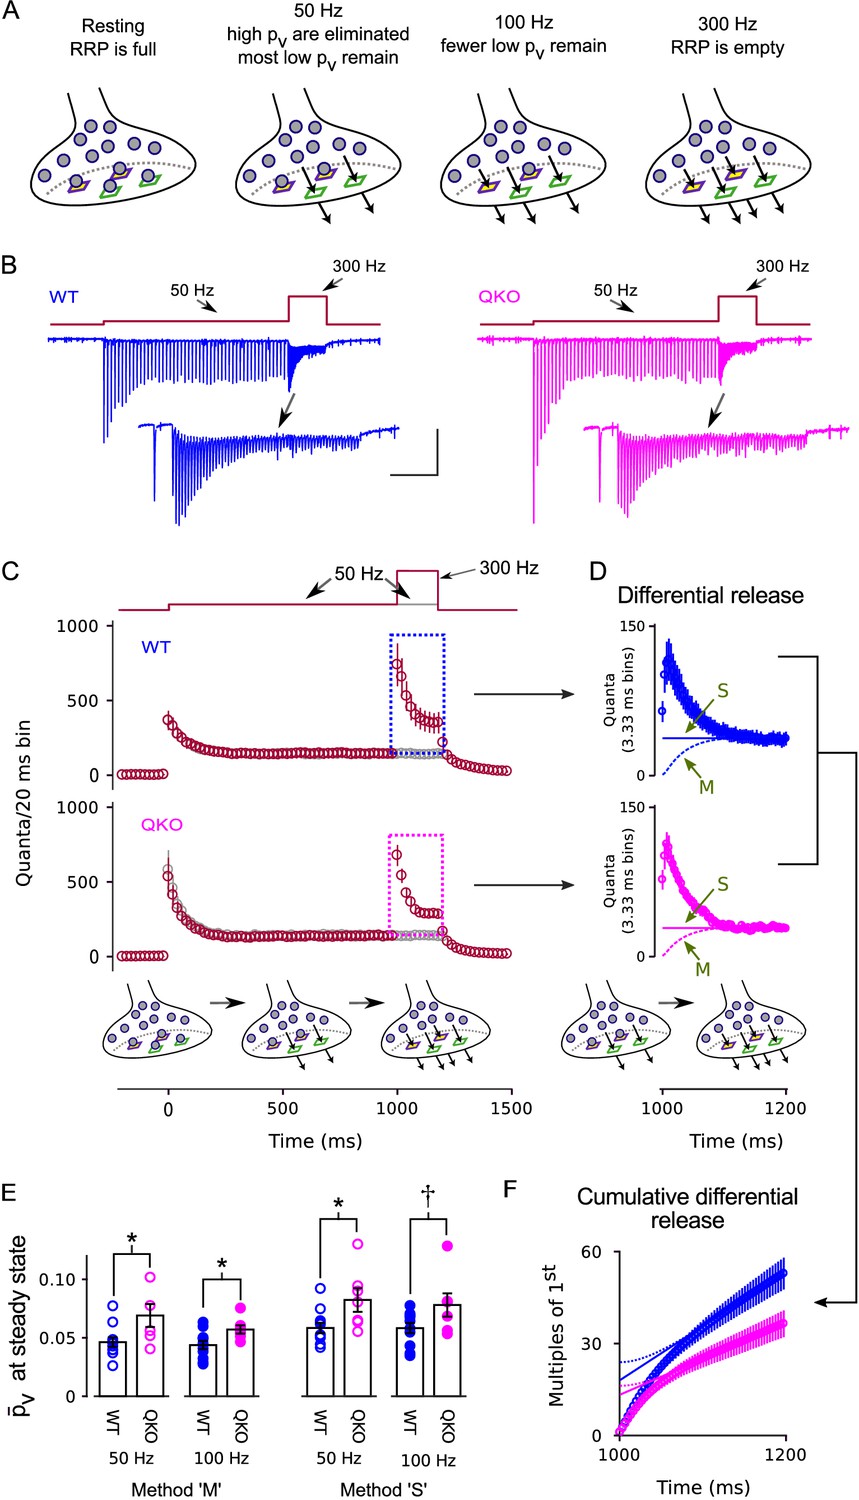
Enhanced release of vesicles with low remaining in RRP after 50 Hz or 100 Hz stimulation at QKO synapses.
(A) Diagram illustrating the steady state contents of the RRP for a range of stimulating frequencies. Release sites are depicted as stable, and are characterized by either a high (green squares) or a low (purple squares with yellow interior) probability of catalyzing the exocytosis of docked vesicles (i.e. high or low release sites). Alternative models where the readily releasable vesicles transition back and forth between high and low states would be the same except the release sites would not have a defined when empty, and the locations of the high and low vesicles would change over time. In either case, 50 Hz and 100 Hz stimulation is rapid enough to eliminate the vesicles with high from the RRP, but leaves a flow through pool of low vesicles that can then be released by subsequent 300 Hz stimulation. (B) Example recordings for trials where the stimulation frequency was increased from 50 Hz to 300 Hz; blue is WT, magenta is QKO. The insets are the last response during 50 Hz stimulation and responses during subsequent 300 Hz stimulation. The scale bars pertain to both sets of traces: the vertical bar is 1 nA and the horizontal is 250 ms for the full traces; and 500 pA and 50 ms for the insets. (C) Mean responses for the full data set quantified as the number of quanta released during sequential 20 ms segments, allowing direct comparison of the time-averaged rate of release when stimulation was 50 vs when 300 Hz; single segments contain the quantal content of responses to single action potentials for times when the stimulating frequency was 50 Hz, and of responses to consecutive action potentials when the frequency was 300 Hz. Red symbols are for trials where stimulation was increased from 50 to 300 Hz, and gray are for trials where stimulation was maintained at 50 Hz throughout, as diagrammed at top. Boxes demarcate responses used to calculate the differential release in (D). (D) The additional release - termed differential release here - elicited by increasing the stimulation frequency to 300 Hz was calculated by subtracting the time-averaged values during continued 50 Hz stimulation from the corresponding values during 300 Hz stimulation. The theoretical curves are estimates of the fraction of the differential release produced by exocytosis of neurotransmitter that was recruited to the RRP during ongoing stimulation. ‘M’ and ‘S’ signify the same as in Figure 3D; ‘M’ describes the model in the illustrations at bottom and in (A). (E) values for individual calyces during steady state 50 and 100 Hz stimulation using the same methods ‘M’ and ‘S’ used to generate the theoretical curves in (D) ( is p < 0.1, * is p < 0.05; n ; rank sum). (F) Cumulative version of the plot in (D), except after normalizing by the quantal content of the first differential response. Solid and dashed lines represent theories ‘M’ and ‘S’ as in (D) except offset to match the rightmost data points. Without the normalization, the lines would intersect the y-axis at the value that corresponds to the contents of the RRP at the start of 300 Hz stimulation (Schneggenburger et al., 1999). However, the normalization converts the estimate into multiples of the quantal content of the first response, making the intersection equal to /.
Figure 5—figure supplement 1
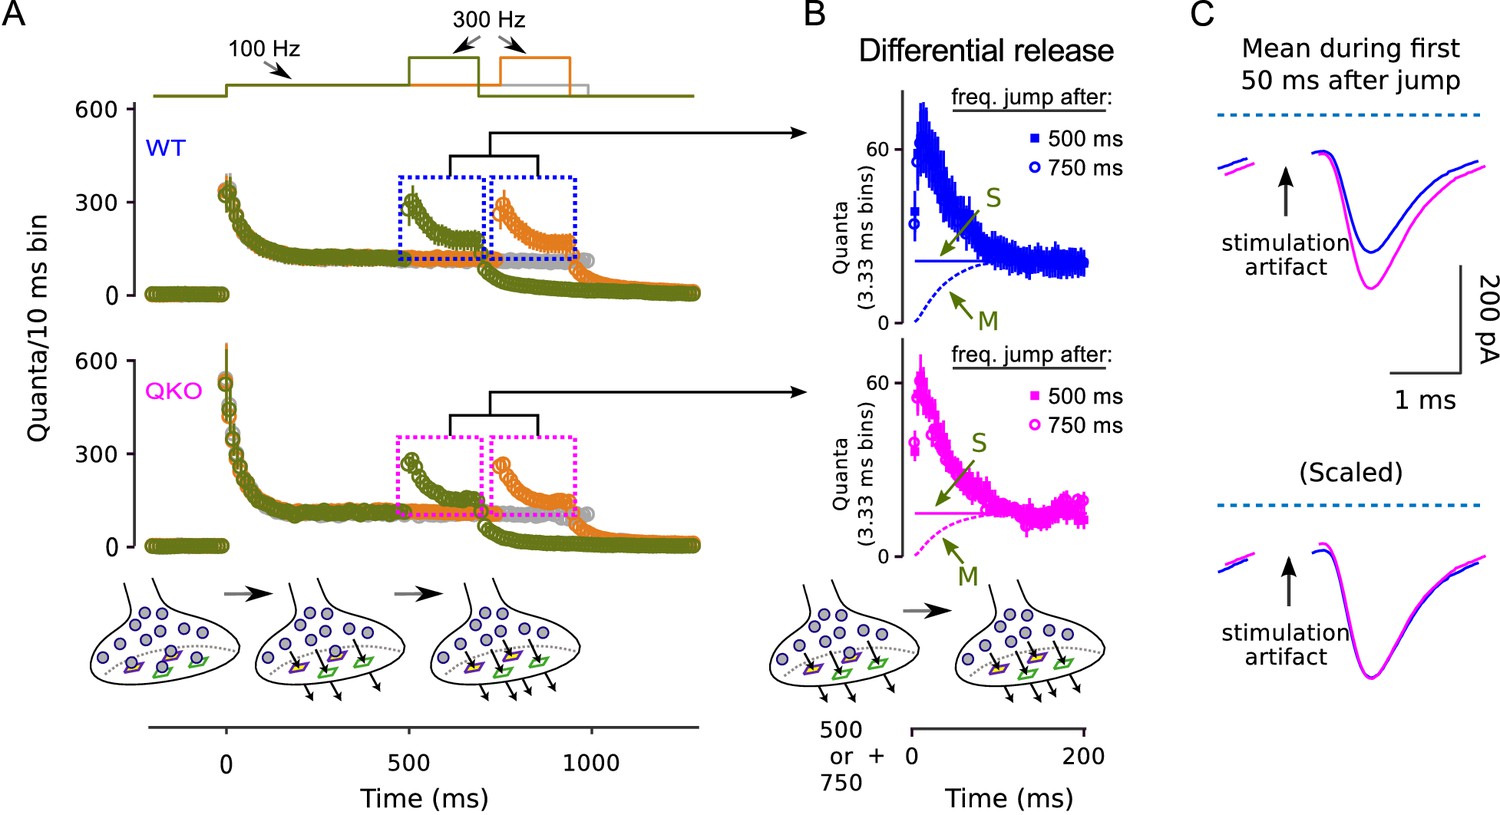
Frequency jumps from .
Frequency jumps from 100 to 300 Hz. (A) Analogous to Figure 5C. Displayed are results from three types of trials: one where the frequency of stimulation was increased to 300 Hz after 500 ms at 100 Hz (green); one where the increase to 300 Hz occurred after 750 ms of 100 Hz; and one where stimulation was maintained at 100 Hz throughout, all as diagrammed at top. Mean responses are quantified as the quantal content of sequential 10 ms segments, allowing direct comparison of the rate of release when stimulation was 100 to when 300 Hz; single segments contain quanta released by a single action potential for times when the stimulating frequency was 100 Hz, and three consecutive action potentials when the frequency was 300 Hz. Boxes demarcate responses used to calculate the differential release in (B). (B) Differential release calculated as for Figure 5D; ‘M’ and ‘S’ signify the same as in Figure 5D. Note that the amount of differential release after 500 ms of 100 Hz stimulation was equivalent to after 750 ms, confirming that 100 Hz stimulation drives the standing fullness of the RRP to a steady state. (C) Average of traces during first 50 ms after jump to 300 Hz after 500 ms of 100 Hz stimulation. Blue is WT, magenta is QKO. Dashed light blue lines are baseline.
Alternate scenario: We use the results in Figure 5 and here to conclude that the probability of release of low vesicles is elevated at QKO synapses. We have additionally considered the alternate scenario where the low vesicles are not immediately releasable (Miki et al., 2016; Gustafsson et al., 2019). In this case, the ongoing synchronous transmitter release occurring after eliminating high vesicles could be explained by a fast recruitment mechanism that would transfer a tiny fraction of the vesicles from the un-releasable state to a releasable state in the time between action potentials. The fraction would be the value of for the low vesicles. However, this alternate scenario is not compatible with the results of the frequency jump experiments because the acceleration mechanism could not influence the rate of transfer from the un-releasable to releasable state until after the first 3.33 ms interstimulus interval during 300 Hz stimulation. In contrast, the rate of transfer during the first 3.33 ms interstimulus interval would have to be equivalent to the rate during the first 3.33 ms of the 20 or 10 ms interstimulus intervals during the preceding 50 or 100 Hz stimulation. Therefore, one would expect 6-fold or 3-fold fewer new releasable vesicles at the end of the first 3.33 ms interstimulus interval compared to before the preceding action potential. If so, the second pulse during 300 Hz stimulation would elicit paired-pulse depression rather than the robust facilitation seen in Figure 5D and (B). And, indeed, one would expect twice as much paired-pulse depression in Figure 5D compared to in (B) (i.e. because the transfer rate during 50 Hz stimulation would be half the rate when stimulation is 100 Hz).
Figure 5—figure supplement 2

Cumulative plots for full experiment.
Cumulative plots of release during frequency jump experiments. Cumulative release during 300 Hz stimulation without and with prior submaximal stimulation at 50 or 100 Hz; same experiments as documented in Figure 5. The lesser release after 100 Hz compared to after 50 Hz indicates that 100 Hz stimulation depleted the RRP to a greater extent than 50 Hz stimulation. This is expected - even if 50 Hz stimulation is sufficient to completely eliminate vesicles with high - because the vesicles with low are released at a low rate during submaximal stimulation, causing partial depletion of the low subdivision of the RRP in addition to the full depletion of the high subdivision; see Mahfooz et al. (2016).
Figure 6
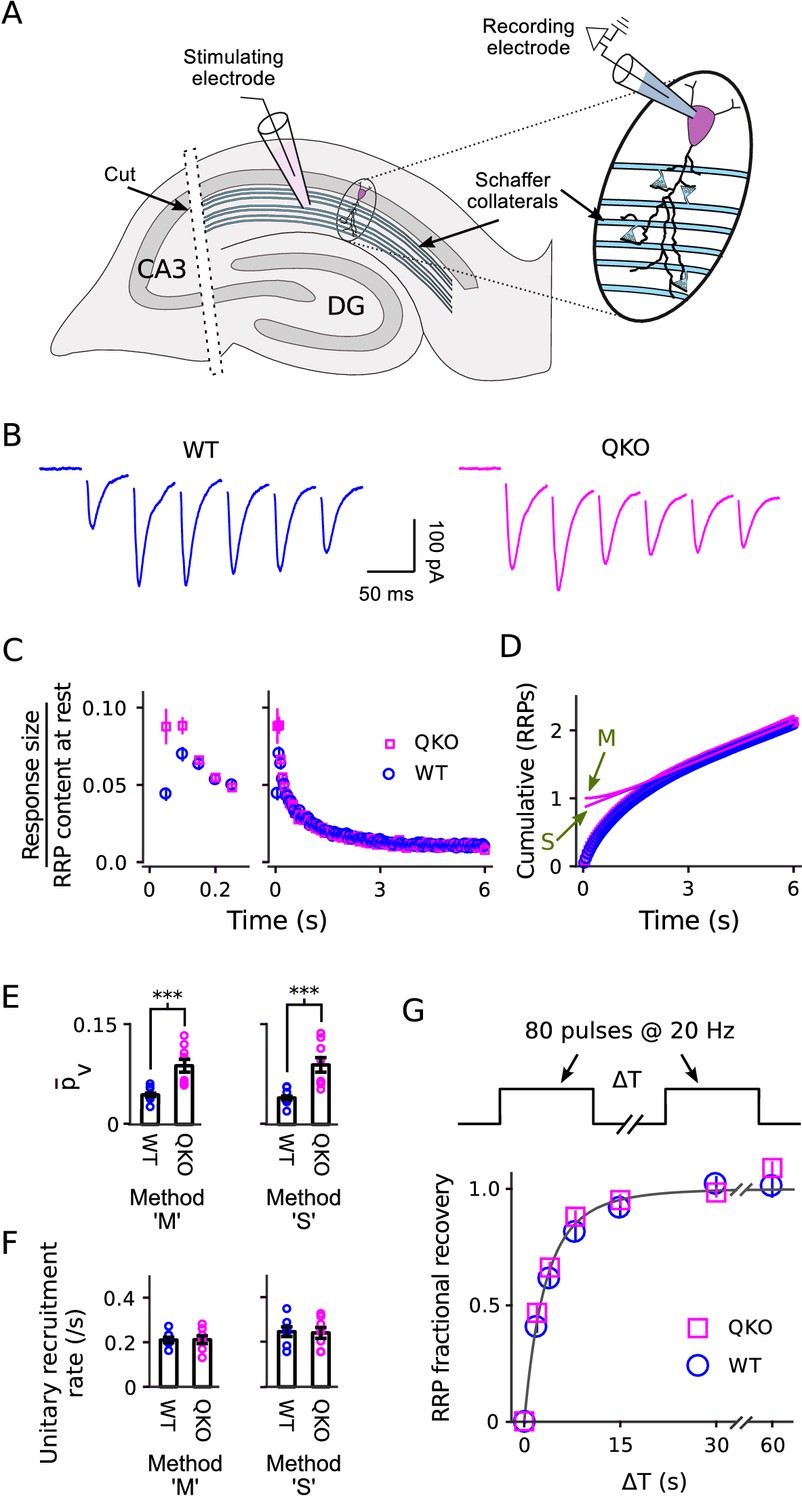
Electrophysiological analysis of Schaffer collateral synapses.
(A) Diagram of ex vivo hippocampal slice preparation. (B-F) Increased at QKO synapses, but no differences in timing of vesicle trafficking during ongoing stimulation. (B) Responses during 20 Hz stimulation; shown are the first 300 ms of -long trains from individual preparations; traces are the average of four trials. (C) Mean sizes of responses vs time. Individual trials were repeated at least three times for each preparation, and each preparation was allowed to rest at least 4 min before beginning each trial (n = 8 preparations per genotype). Responses were measured as the current integral and then normalized by the RRP contents at the start of stimulation calculated as in Wesseling et al. (2002); when normalized this way, the leftmost values are then equal to . (D) Cumulative responses, normalized as in (C). Theoretical curves are labeled as in Figure 3D, except here ‘M’ refers to the theory described in Wesseling et al. (2002), which is analogous to Mahfooz et al. (2016) but specific for hippocampal synapses. (E) values across preparations (p < 0.001; rank sum). Methods ‘M’ and ‘S’ are the same as for Figure 3E. (F) Values for the unitary recruitment rate across preparations. (G) RRP replenishment vs time; the dashed line is with the decaying exponential in Wesseling et al. (2002).
Figure 7 with 1 supplement
Higher throughput analysis of triple and double knockout synapses.
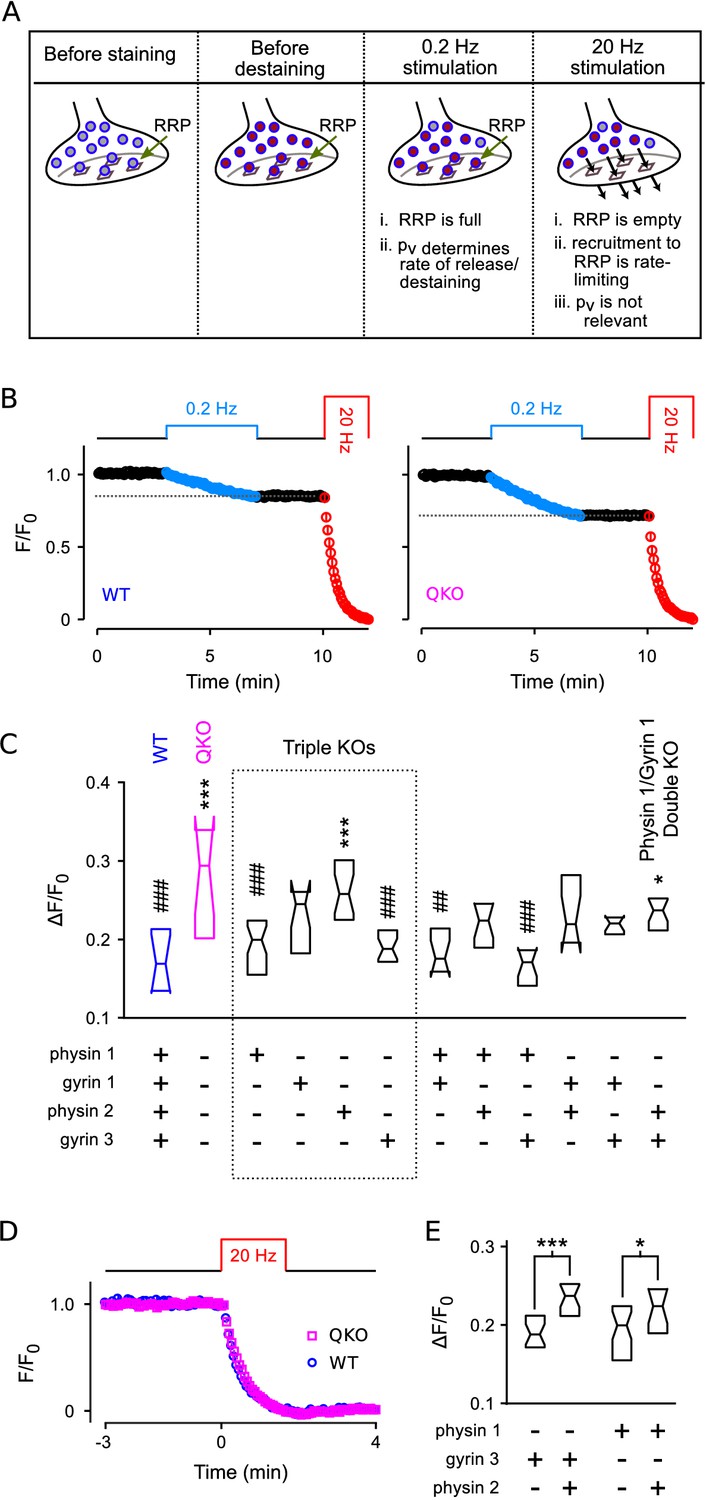
(A) Diagram of concepts. Recycling vesicles are first stained by driving synaptic vesicle exocytosis and subsequent recycling using electrical stimulation in the presence of FM4-64 in the extracellular fluid. Extracellular dye is then removed and dye stuck to the outside of the plasma membrane is washed off. Fluorescence levels are then monitored with time-lapse imaging as synapses are destained by triggering action potentials at low frequency (0.2 Hz). At such a low frequency, the RRP remains almost completely full because the time between action potentials (5 s) is enough for recruitment of new vesicles to replace the ones that undergo exocytosis. Since each action potential releases a higher fraction of the RRP contents at QKO synapses - i.e., because is higher - more vesicles undergo exocytosis, and destaining is faster as a consequence. In contrast, recruitment to the RRP becomes rate-limiting during high frequency stimulation that is fast enough to drive the RRP to a near empty steady state (20 Hz). As a consequence, the amount of destaining no longer depends on , and the synaptophysin family proteins no longer influence the timing. (B) Destaining during electrical stimulation for WT and QKO. Data points are mean ± s.e.m. of median values from each preparation; preparations, each with >250 ROIs. values in (C and E) are calculated as 1 minus the value indicated by the horizontal dashed line. (C) Comparison across genotypes of amount of destaining during the 0.2 Hz train of stimulation. Experimenter was blind to genotype. Boxes are middle two quartiles; horizontal lines are medians; notches signify 95% confidence intervals (***, *, compared to WT; ###, ##, compared to QKO; ANOVA followed by Tukey’s honest significant difference criterion; for each). (D) No difference between WT and QKO in time course of destaining when the frequency of stimulation was 20 Hz; n preparations. (E) Follow-on paired tests indicate that synaptophysin 2 lessens the amount of compensation produced by synaptogyrin 3 or synaptophysin 1 when expressed alone (***, *; rank sum).
Figure 7—figure supplement 1
Example experiment.
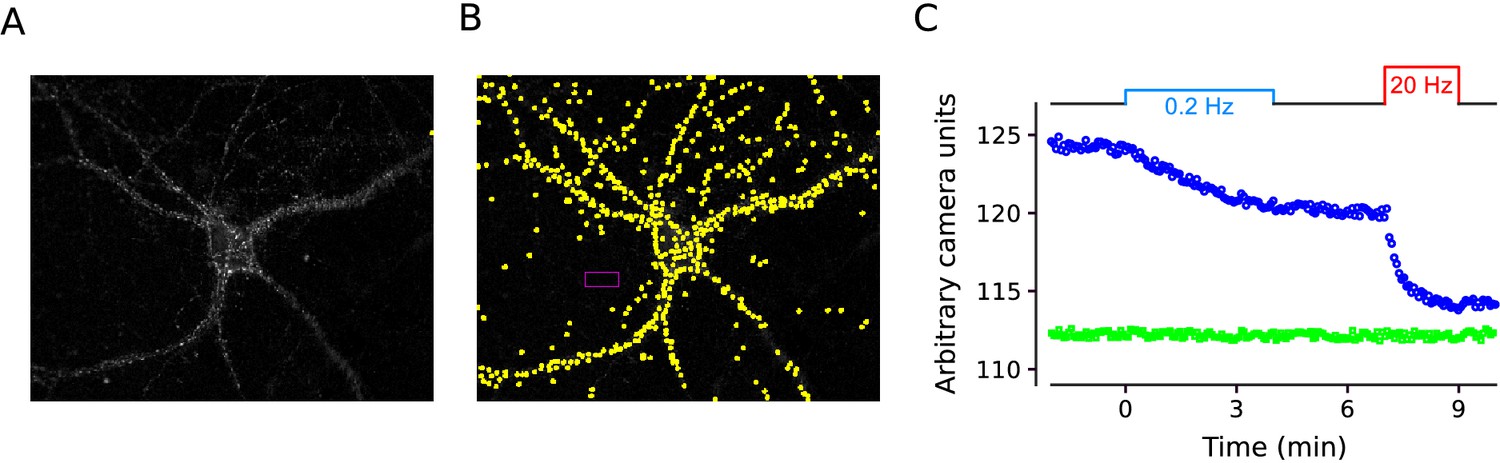
Example of FM4-64 experiments quantified in Figure 7. (A) Difference image generated by subtracting the mean of 10 images after destaining from the mean of the 30 baseline images after staining, but before destaining with electrical stimulation. (B) Same as in (A) with 540 regions of interest (ROIs) demarcated in yellow, and the area used to calculate the background fluorescence demarcated in magenta. Images from time-lapse experiments were aligned using the imagej plugin StackReg:Translation (Thévenaz et al., 1998) and in house software. Sampling frequency was 1 image every 4s. ROIs were 2 X 2 camera pixels, corresponding to an image area of 1 μm X 1 μm, and were detected with in house software based on the change in contrast compared to surrounding area over the full experiment. (C) Blue circles are median values of ROIs vs time for experiment in (A and B), green squares are mean values of background area.
Figure 8
Reduced paired-pulse facilitation at QKO synapses is caused by occlusion.
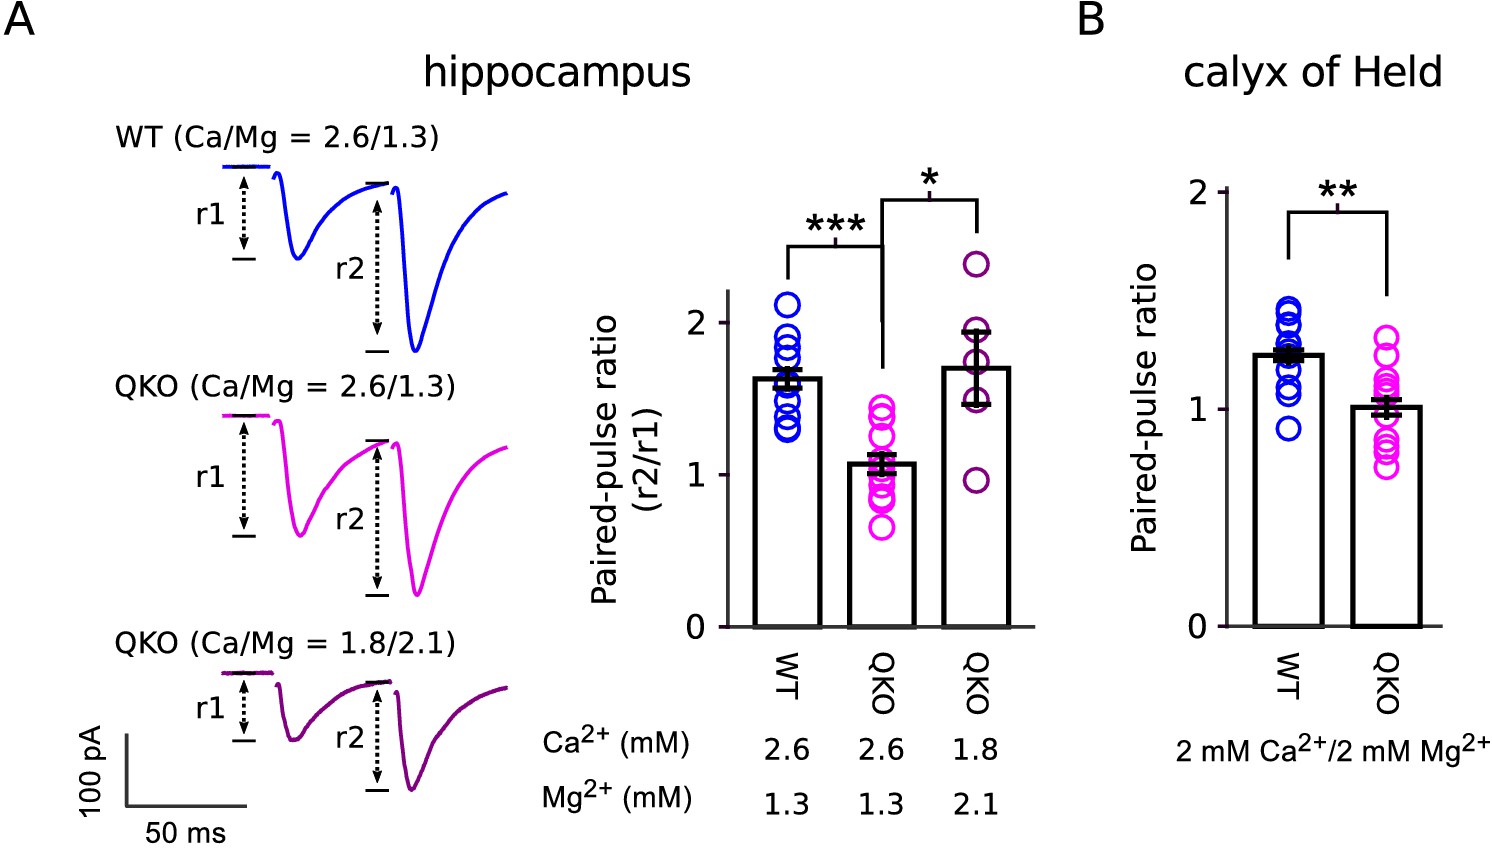
(A) Schaffer collateral synapses of the hippocampus. Traces are the average of the first two responses during 20 Hz stimulation across the entire data set (inter-pulse interval was 50 ms; n = 8 preparations for WT in 2.6 mM Ca2+/1.3 mM Mg2+; n = 12 for QKO in 2.6 mM Ca2+/1.3 mM Mg2+; and n = 5 for QKO in 1.8 mM Ca2+/2.1 mM Mg2+; * signifies p < 0.05, *** is p < 0.001; Wilcoxon rank sum; bars are mean ± s.e.m.). 1.8 mM Ca2+/2.1 mM Mg2+ was chosen for these exeriments because the paired-pulse ratio at QKO synapses then matched WT synapses when bathed in 2.6 mM Ca2+/1.3 mM Mg2+. QKO synapses exhibited even more paired-pulse facilitation when Ca2+ was lowered and/or Mg2+ increased further. (B). Calyx of Held synapses also exhibited significantly less paired-pulse facilitation in the experiments documented in Figure 3 (** signifies p < 0.01; Wilcoxon rank sum; bars are mean ± s.e.m.). .
Tables
Key resources table
| Reagent type (species) or resource | Designation | Source or reference | Identifiers | Additional information |
|---|---|---|---|---|
| Chemical compound, drug | DL-APV | Abcam | Cat# ab120271 | 50 or 100 μM |
| Chemical compound, drug | DNQX | Abcam | Cat# ab120169 | 10 μM |
| Chemical compound, drug | kynurenic acid | Sigma | Cat# K3375 | 1-4 mM |
| Chemical compound, drug | picrotoxin | Sigma | Cat# P1675 | 50 μM |
| Chemical compound, drug | strychnine | Abcam | Cat# ab120416 | 0.5 μM |
| Chemical compound, drug | Advasep-7 | Cydex | Cat# ADV7-03A-03105 | 1 mM |
| Chemical compound, drug | FM4-64 | Biotium | Cat# BT70021 | 15 μM |
| Strain, strain background (mouse) | RRID:IMSR_JAX:008454 | Jackson | Cat# 008454 | CRE expressor |
| Strain, strain background (mouse) | RRID: IMSR_JAX:008415 | Jackson | Cat# 008415 | Syp KO/Syngr1 KO/ Synpr KI/Syngr3 KI |
| Antibodies | All | see Table 1 |
Table 1
Antibodies
https://doi.org/10.7554/eLife.40744.016| Protein | Designation | Source | Species | Dilution | synapto-somes | hipp. tissue |
|---|---|---|---|---|---|---|
| Synaptophysin 1 | RRID:AB_2313839 | Millipore | mouse | 1:2000 | ✔ | |
| Cl7.2 | Jahn et al., 1985 | mouse | 1:1000 | ✔ | ||
| Synaptophysin 2 | RRID:AB_887841 | Synaptic Sys. | rabbit | 1:1000 | ✔ | |
| 1:2000 | ✔ | |||||
| Synaptogyrin 1 | RRID:AB_887818 | Synaptic Sys. | rabbit | 1:2000 | ✔ | |
| 1:1000 | ✔ | |||||
| Synaptogyrin 3 | RRID:AB_2619752 | Synaptic Sys. | rabbit | 1:1000 | ✔ | ✔ |
| Synaptotagmin 1 | RRID:AB_10622660 | Enzo | mouse | 1:2000 | ✔ | |
| RRID:AB_11042457 | Synaptic Sys. | rabbit | 1:1000 | ✔ | ||
| Synapsin 1 | RRID:AB_2619772 | Synaptic Sys. | mouse | 1:5000 | ✔ | |
| VAMP 2 | RRID:AB_887811 | Synaptic Sys. | mouse | 1:1000 | ✔ | |
| 1:2000 | ✔ | |||||
| RIM1/2 | RRID:AB_887774 | Synaptic Sys. | rabbit | 1:1000 | ✔ | |
| Munc13-1 | RRID:AB_887733 | Synaptic Sys. | rabbit | 1:1000 | ✔ | |
| Complexin1/2 | RRID:AB_887709 | Synaptic Sys. | rabbit | 1:1000 | ✔ | |
| vATPase | RRID:AB_887696 | Synaptic Sys. | rabbit | 1:500 | ✔ | |
| Syntaxin 1 | RRID:AB_887844 | Synaptic Sys. | mouse | 1:1000 | ✔ | |
| -actin | RRID:AB_11042458 | Synaptic Sys. | rabbit | 1:1000 | ✔ | |
| RRID:AB_476744 | Sigma | mouse | 1:10000 | ✔ | ||
| SNAP-25 | RRID:AB_2315340 | Synaptic Sys. | mouse | 1:1000 | ✔ | |
| Rab3a,b,c | Cl42.1 | Matteoli et al., 1991 | mouse | 1:1000 | ✔ | |
| vGAT | SA5387 | Takamori et al., 2000 | rabbit | 1:500 | ✔ | |
| vGlut 1 | RRID:AB_2187690 | Santa Cruz | goat | 1:1000 | ✔ | |
| Shigeo3 | Takamori et al., 2001 | rabbit | 1:2000 | ✔ | ||
| vGlut 2 | Shigeo6 | Takamori et al., 2001 | rabbit | 1:1000 | ✔ |
Additional files
-
Transparent reporting form
- https://doi.org/10.7554/eLife.40744.017
Download links
A two-part list of links to download the article, or parts of the article, in various formats.
Downloads (link to download the article as PDF)
Open citations (links to open the citations from this article in various online reference manager services)
Cite this article (links to download the citations from this article in formats compatible with various reference manager tools)
Elevated synaptic vesicle release probability in synaptophysin/gyrin family quadruple knockouts
eLife 8:e40744.
https://doi.org/10.7554/eLife.40744


