Altered hippocampal interneuron activity precedes ictal onset
- Yale University School of Medicine, United States
- Yale University, United States
Figures
Figure 1 with 3 supplements
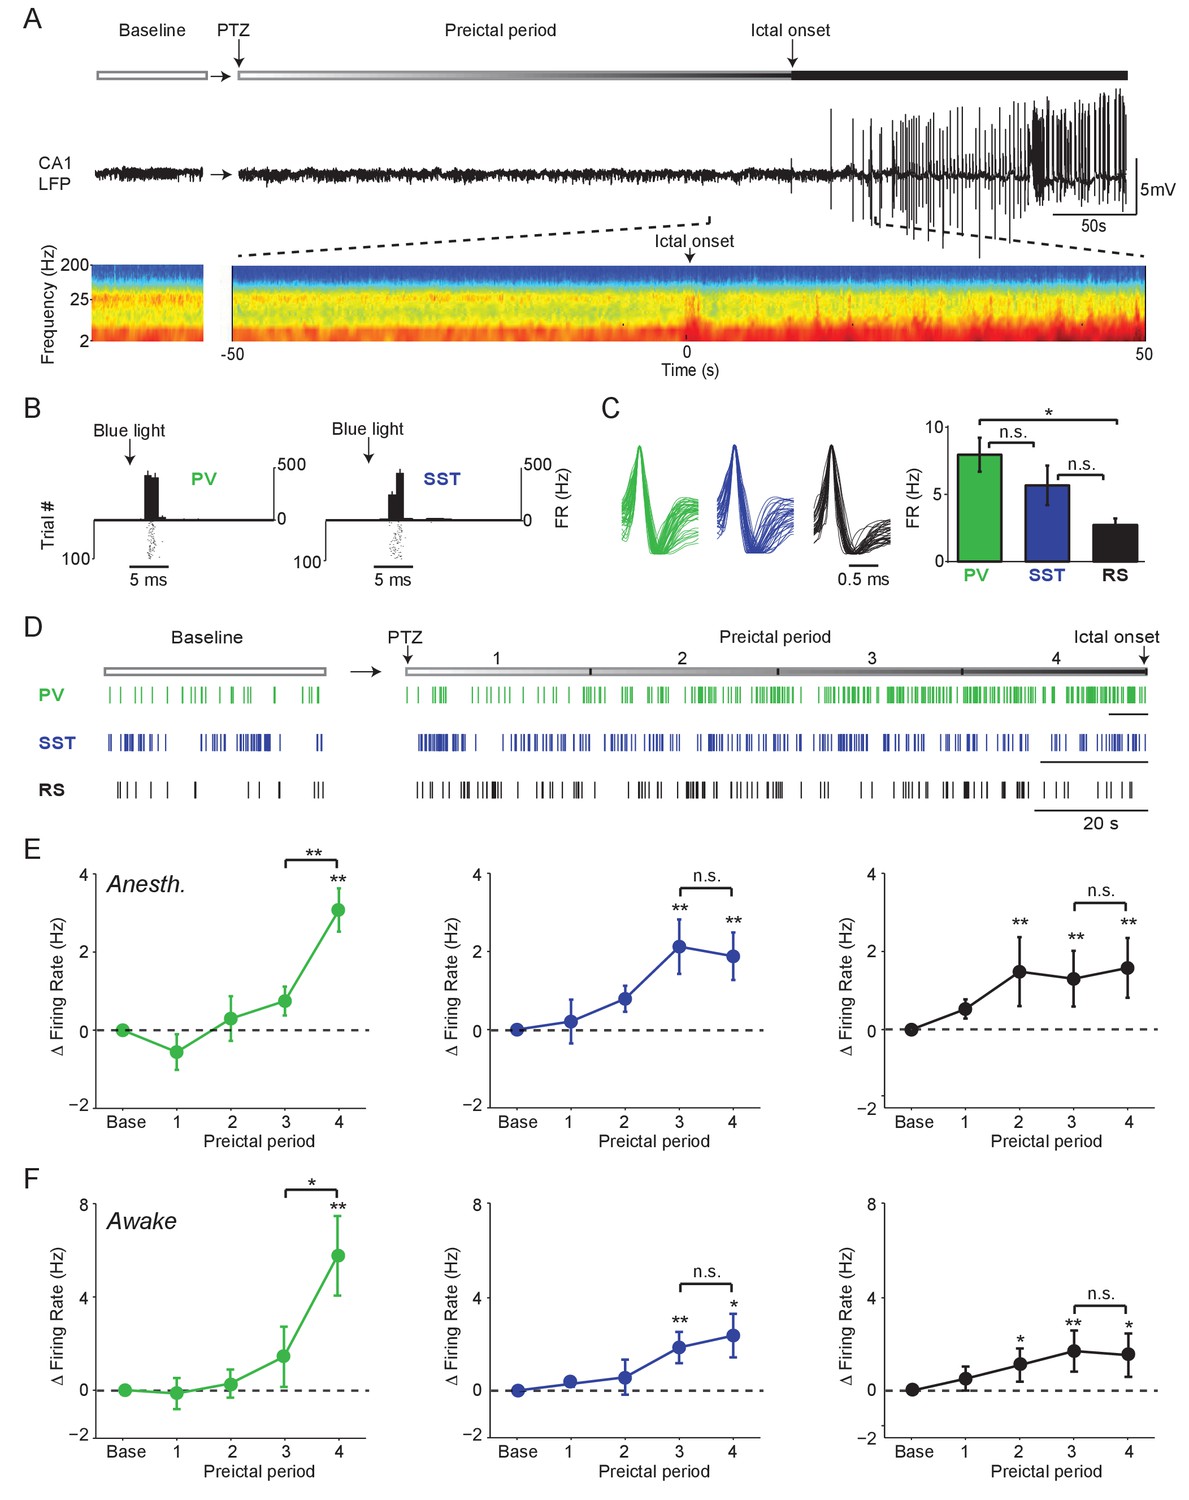
Firing rate changes of ChR2-tagged interneurons precede seizure initiation (A) Upper: Schematic of experimental paradigm showing baseline, PTZ injection and preictal period leading up to ictal onset.
Middle: LFP trace from hippocampal CA1 recording. Lower: Spectrogram showing LFP power as a function of time from ictal onset (x-axis) and frequency (y-axis; shown on log-10 scale). (B) Peri-pulse time-histogram around 5 ms laser pulses together with raster plot during baseline for example PV- and SST-expressing interneurons in PV-Cre/ChR2 and SST-Cre/ChR2 mice, respectively. (C) Left: Averaged, normalized action potential waveforms for all recorded PV, SST and putative RS cells. Right: Mean baseline firing rates (Hz) for PV, SST and RS cells recorded from hippocampal CA1. (D) Spike trains for example PV, SST and RS cells. All horizontal scale bars correspond to 20 s. Note that cells were recorded from different animals that each had different latencies to ictal onset. (E) Mean changes in firing rate as compared to baseline over four preictal periods for PV (n = 18 cells in 13 mice), SST (n = 16 cells in 10 mice) and RS (n = 20 cells in 12 mice) populations in lightly anesthetized animals. (F) Mean changes in firing rate as compared to baseline over four preictal periods for PV (n = 16 cells in 12 mice), SST (n = 14 cells in 13 mice), and RS (n = 28 cells in 16 mice) populations in awake behaving animals. Note that pairwise statistical comparisons are only shown between 3rd and 4th preictal period. Error bars denote mean ±s.e.m. *p<0.0125, **p<0.0025.
-
Figure 1—source data 1
Figure 1 - Statistical results.
- https://doi.org/10.7554/eLife.40750.006
Figure 1—figure supplement 1
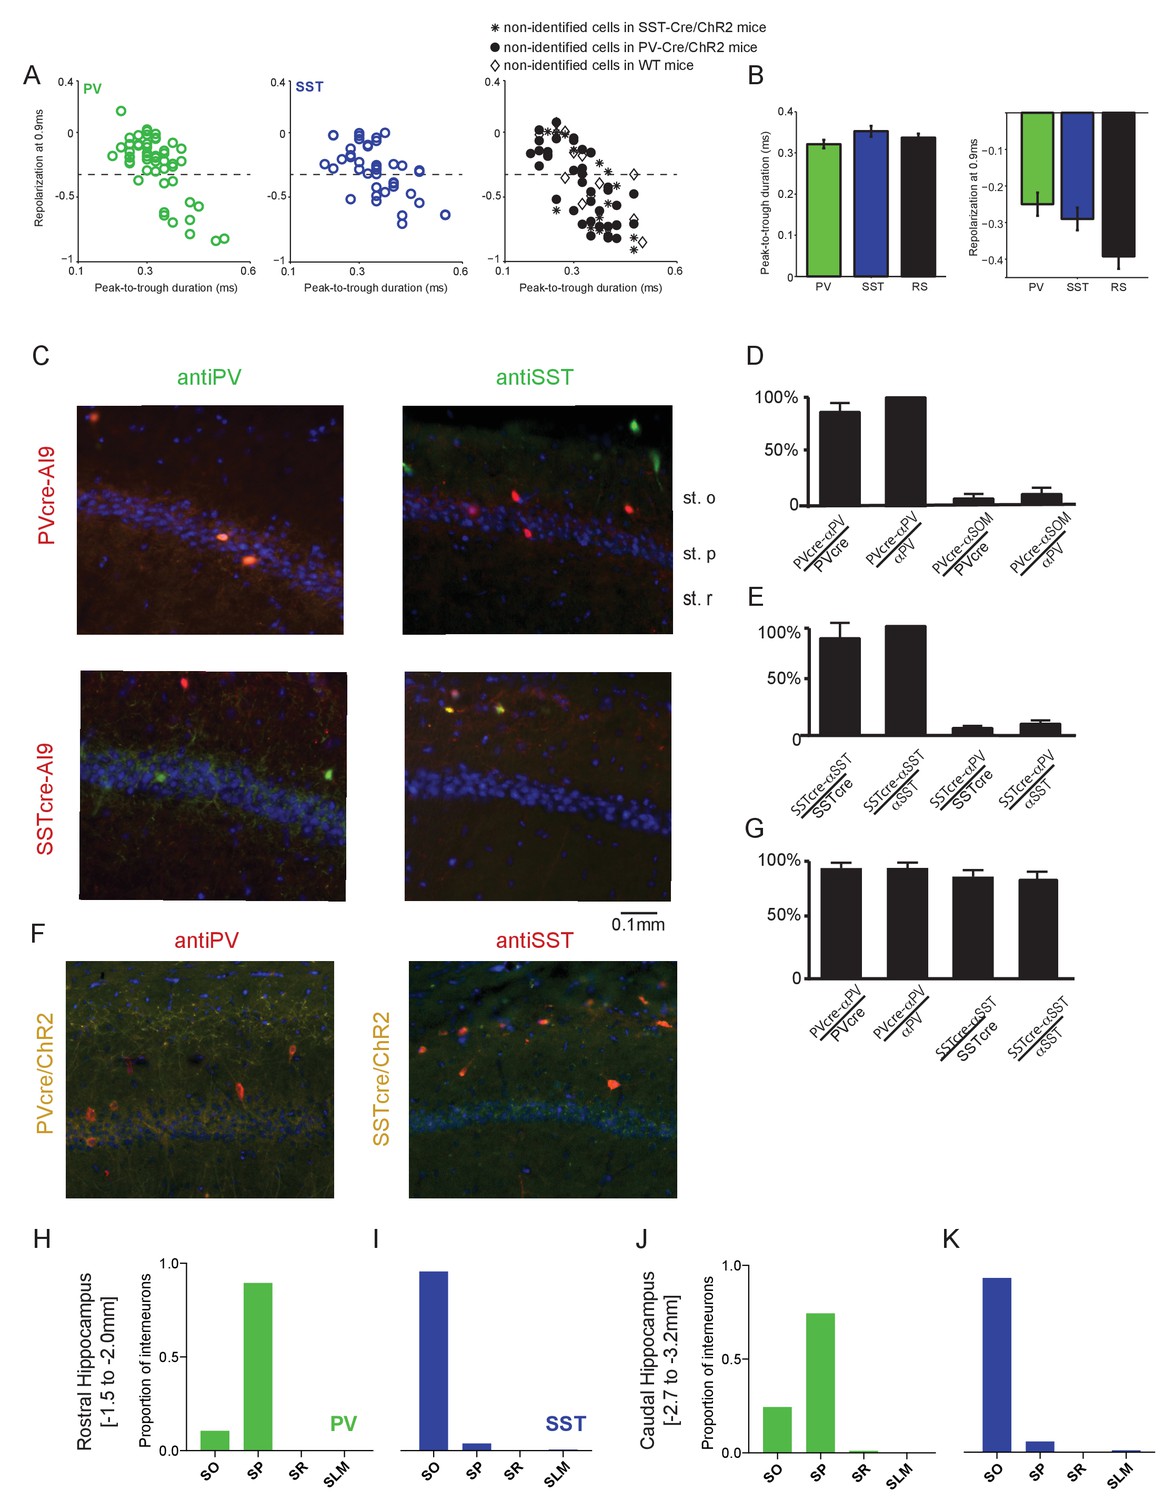
Spike waveform properties and histological characterization of hippocampal CA1 interneurons.
(A) Average action potential waveforms of units plotted using their peak-to-trough duration in ms (x-axis) against their repolarization value at 0.9 ms (y-axis; see Materials and methods) for PV, SST and non-identified cells. Non-identified, ChR2-negative cells were recorded in experiments using PV-Cre, SST-Cre, or wild-type mice. RS cells were defined as cells having a repolarization value smaller than −0.35 (dotted lines). Note that the RS population may potentially include a small number of unidentified interneurons. (B) Mean peak-to-trough duration (left) and repolarization at 0.9 ms (right) were not significantly different across the three populations. (C) The two interneuron populations of interest were verified by crossing PV-Cre or SST-Cre mice with a red reporter line (Ai9) to express tdTomato in PV- or SST-expressing cells, respectively. Upper: Representative coronal sections from PV-Cre+/-Ai9f/- mice showing sparse cells immunostained for PV (green; Left) or SST (green; Right) in hippocampal CA1. Note the co-labeling with tdTomato in all PV-expressing cells and the absence of overlap in SST-expressing cells. Lower: In hippocampal sections from SST-Cre+/-Ai9f/- mice, note co-labeling for tdTomato in SST- (green; Right) but not PV-expressing (green; Left) cells. In all sections, DAPI counterstaining highlights the hippocampal CA1 anatomy (stratum pyramidale (st.p), stratum oriens (st.o) and stratum radiatum (st. (r)). (D) Bars showing the percentage of PV-expressing neurons that are fate mapped by the PV-CreAi9 line in mouse hippocampal CA1 (n = 3 independent brains for each genotype); percentage of PV-Cre/Ai9 fate mapped interneurons that express PV (n = 3 independent brains for each genotype); percentage of SST-expressing neurons that are fate mapped by the PV-CreAi9 line; and the percentage of PV-Cre/Ai9 fate mapped interneurons that express SST. Data represent mean ±SEM. (E) Same as for (D) but for SST-Cre/Ai9 mice (n = 3 independent brains for each genotype). Data represent mean ±SEM. (F) Representative images from a PV-Cre/ChR2 mouse (yellow) immunostained for PV (red, left) and a SST-Cre/ChR2 mouse (yellow) immunostained for SST (red, right). (G) Bars showing the percentage of Cre + neurons stained by antibody and percentage of Ab +neurons labeled by Cre for each mouse line. (H) In the rostral hippocampus where recordings were performed (AP −1.5 to −2.0 mm), the cell bodies of ~90% of PV interneurons identified by Cre-dependent expression of tdTomato were located in the stratum pyramidale (SP), with ~10% in the statum oriens (SO). (I) In the same rostral region, ~95% of SST interneurons had cell bodies located in the SO, with ~5% in the SP. (J) In contrast, PV cells caudal to the recording area (AP −2.7 to −3.2 mm) showed a different distribution, with ~75% of cell bodies in the SP and ~25% in the SO, along with a small number in the stratum radiatum (SR). (K) SST interneuron cell body distribution was similar along the rostral-caudal axis, with ~95% of cell bodies in the caudal CA1 located in the SO and a small number in the SP and stratum lacunosum moleculare (SLM). Data were collected from PV-Cre+/-Ai9f/- (n = 4) and SST-Cre+/-Ai9f/- (n = 4) animals.
Figure 1—figure supplement 2
Spontaneous preictal firing rate trajectories.
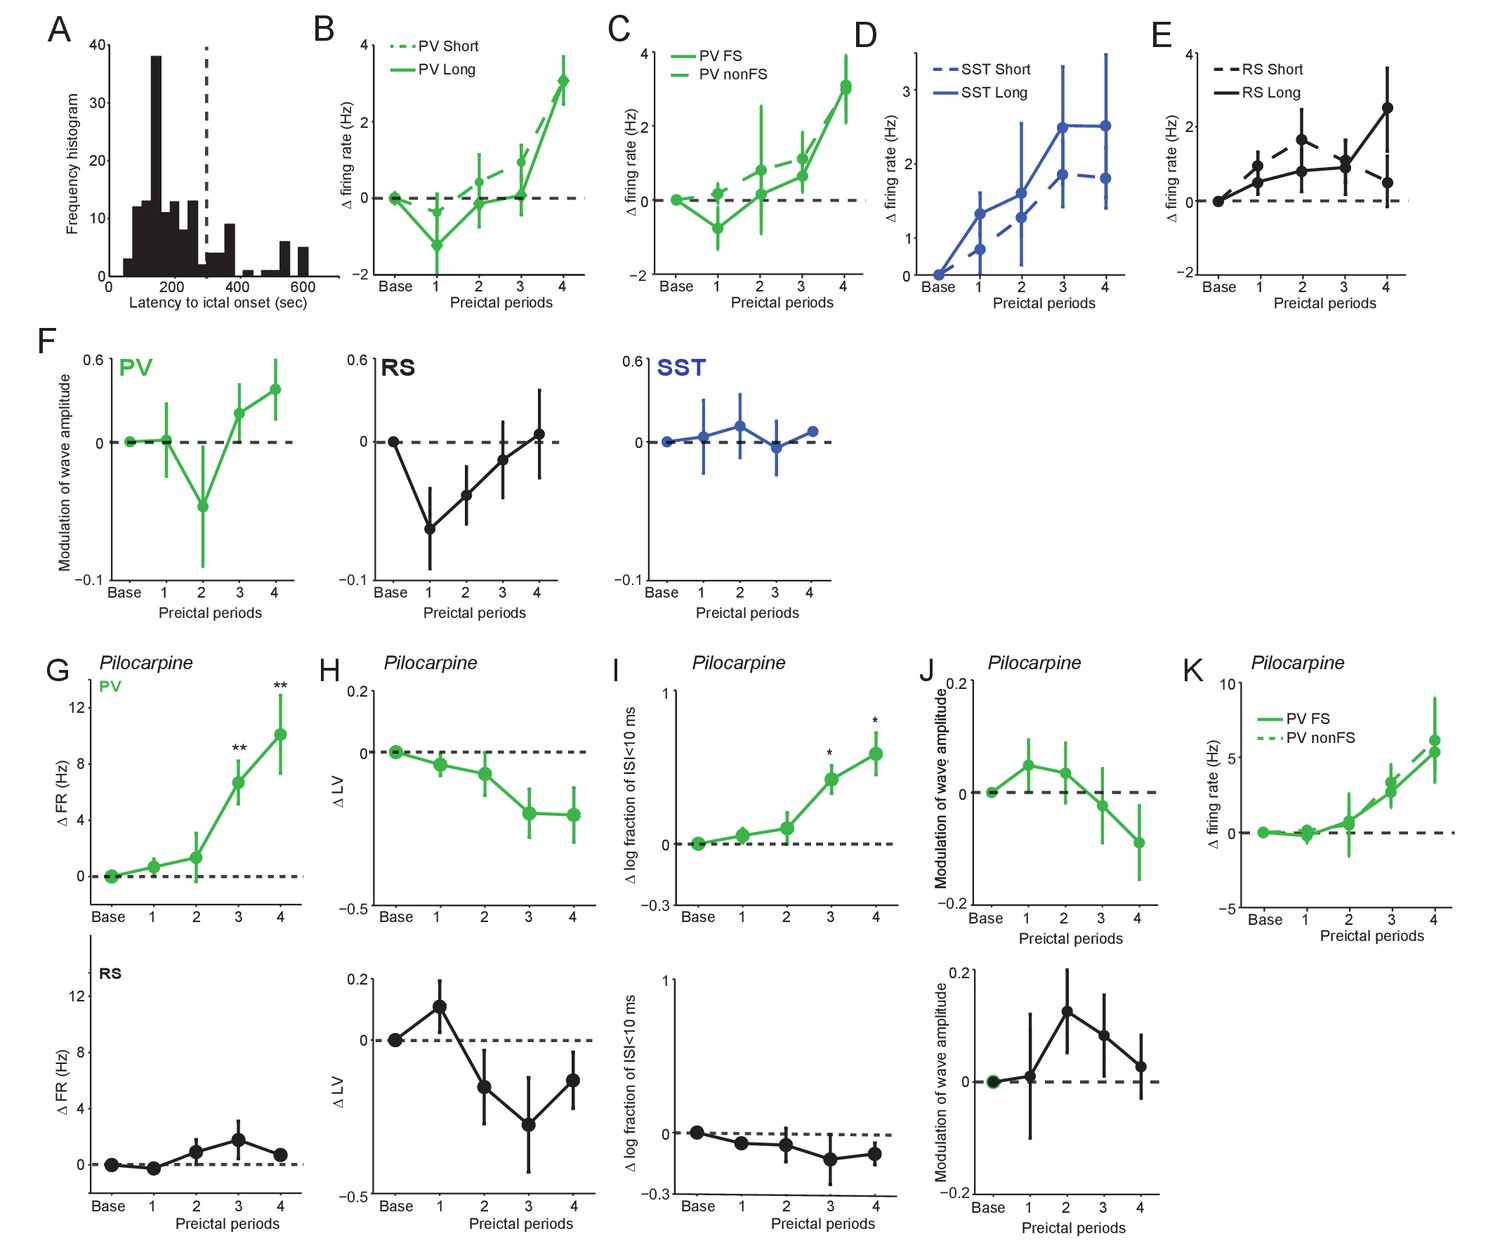
(A) Frequency histogram of latency to ictal onset (s) in acute PTZ seizure for all anesthetized experiments. (B) Mean ±SEM changes in PV firing rate (Hz) as compared to baseline over four preictal periods for seizures having either short (<300 s; n = 14) or long (>300 s;n = 4) latencies. (C) Mean ±SEM changes in PV fast-spiking (FS) and PV non-FS cell firing rate as compared to baseline (n = 24 PV FS and 9 PV non-FS). (D) Mean ±SEM changes in SST firing rate (Hz) as compared to baseline for seizures having either short (n = 24) or long (n = 7) latencies. (E) Mean ±SEM changes in RS firing rate (Hz) as compared to baseline for seizures having either short (n = 12) or long (n = 8) latencies. (F) Mean ±SEM modulation (defined as [a-b]/[a + b], where a is preictal and b is baseline) of spike waveform amplitude as compared to baseline over four preictal periods for PV(green), SST (blue), and RS (black) cells for acute PTZ seizures. None of the comparisons to baseline (dotted lines) reached statistical significance at p<0.0125. (G–K) Data from acute Pilocarpine seizure model. (G) Mean ±SEM changes in firing rate as compared to baseline over four preictal periods for PV (n = 10 cells in eight mice; upper, green) and RS (n = 6 cells in four mice; lower, black) cells. See Figure 1E for comparison with PTZ-model. Note that these changes occurred in the absence of significant changes in waveform amplitude. (H) Mean ±SEM changes in local variation (LV) of firing as compared to baseline over four preictal periods for PV and RS cells. See Figure 4A for comparison with PTZ-model. (I) Mean ±SEM changes in the log10-ratio of short inter-spike-intervals (ISI;<10 ms) over long ISI (>10 ms) intervals. Significance to baseline in all plots: *p<0.0125, **p<0.0025. (J) Mean ±SEM modulation (defined as [a-b]/[a + b]) of spike waveform amplitude as compared to baseline over four preictal periods for PV (upper, green) and RS (lower, black) cells for acute Pilocarpine seizures. None of the comparisons to baseline (dotted lines) reached statistical significance at p<0.125. (K) Mean ±SEM changes in firing rate as compared to baseline for fast-spiking (FS; n = 6) and non fast-spiking (nonFS; n = 4) PV interneurons over four preictal periods.
Figure 1—figure supplement 3
Preictal changes in interneuron activity during awake seizure initiation.
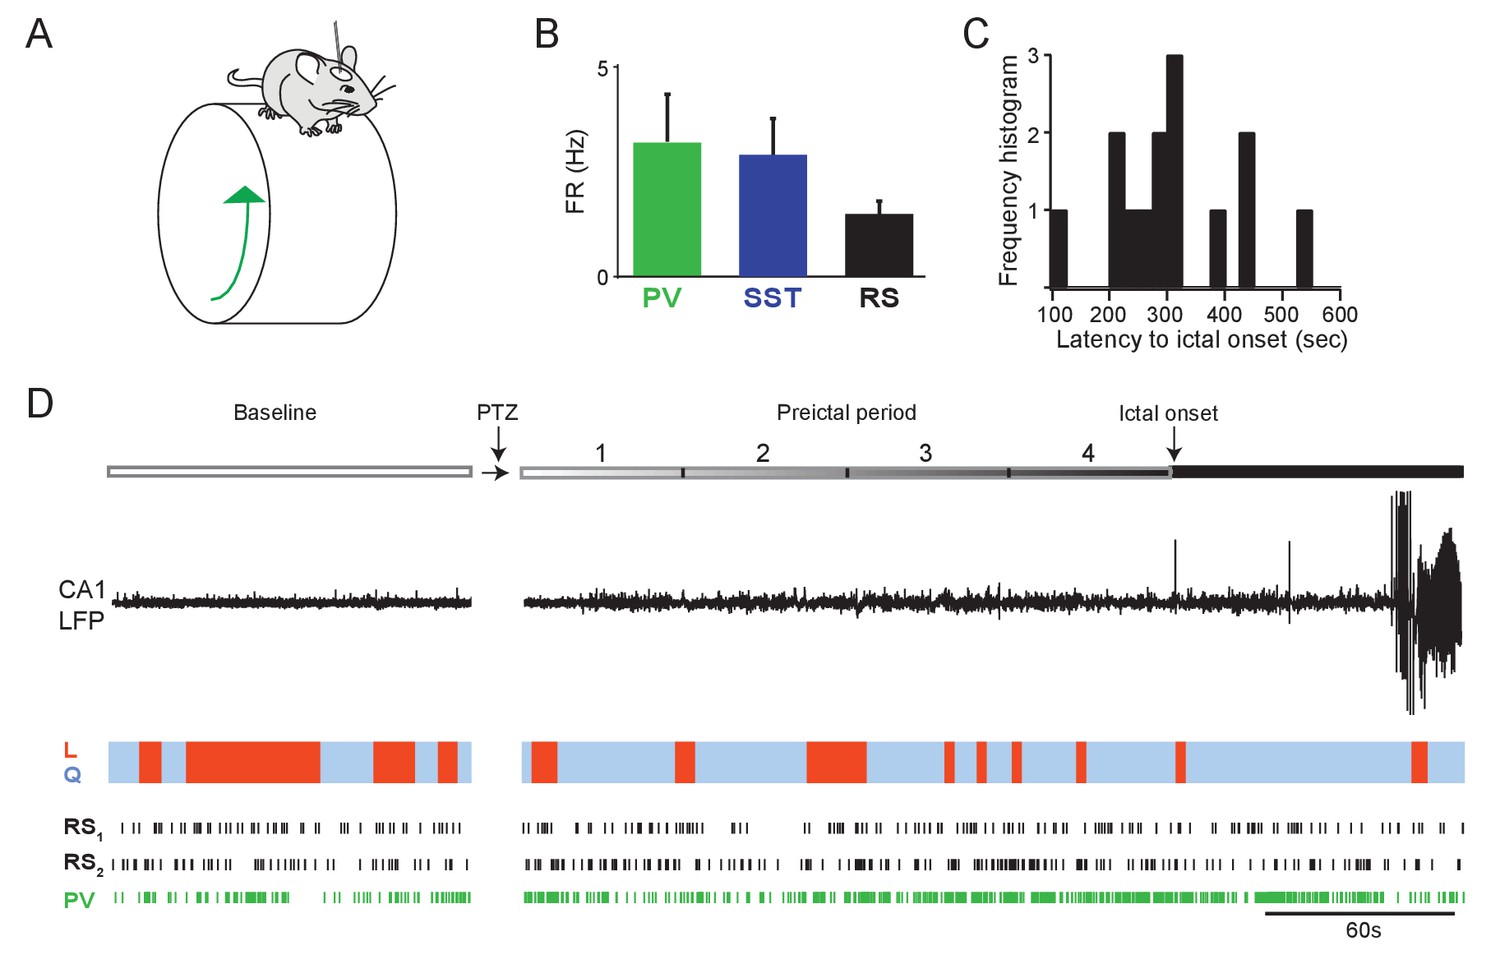
(A) Schematic of head-fixed mouse on running wheel. Wheel motion was measured using a linear angle detector. (B) Mean baseline firing rates (Hz) were not significantly different between PV, SST and RS cells recorded from hippocampal CA1 during wakefulness. (C) Histogram of awake seizure latencies. (D) Upper: Schematic of experimental paradigm showing baseline, PTZ injection and preictal period leading up to ictal onset. Middle: LFP trace from hippocampal CA1 recording. Colored bar denotes behavioral state of the mouse, with blue indicating quiescent sitting periods (Q) and red indicating periods of locomotion (L). Lower: Spike trains for two example RS cells and one PV cell recorded in one animal during seizure initiation. Error bars denote S.E.M. *p<0.0125.
Figure 2
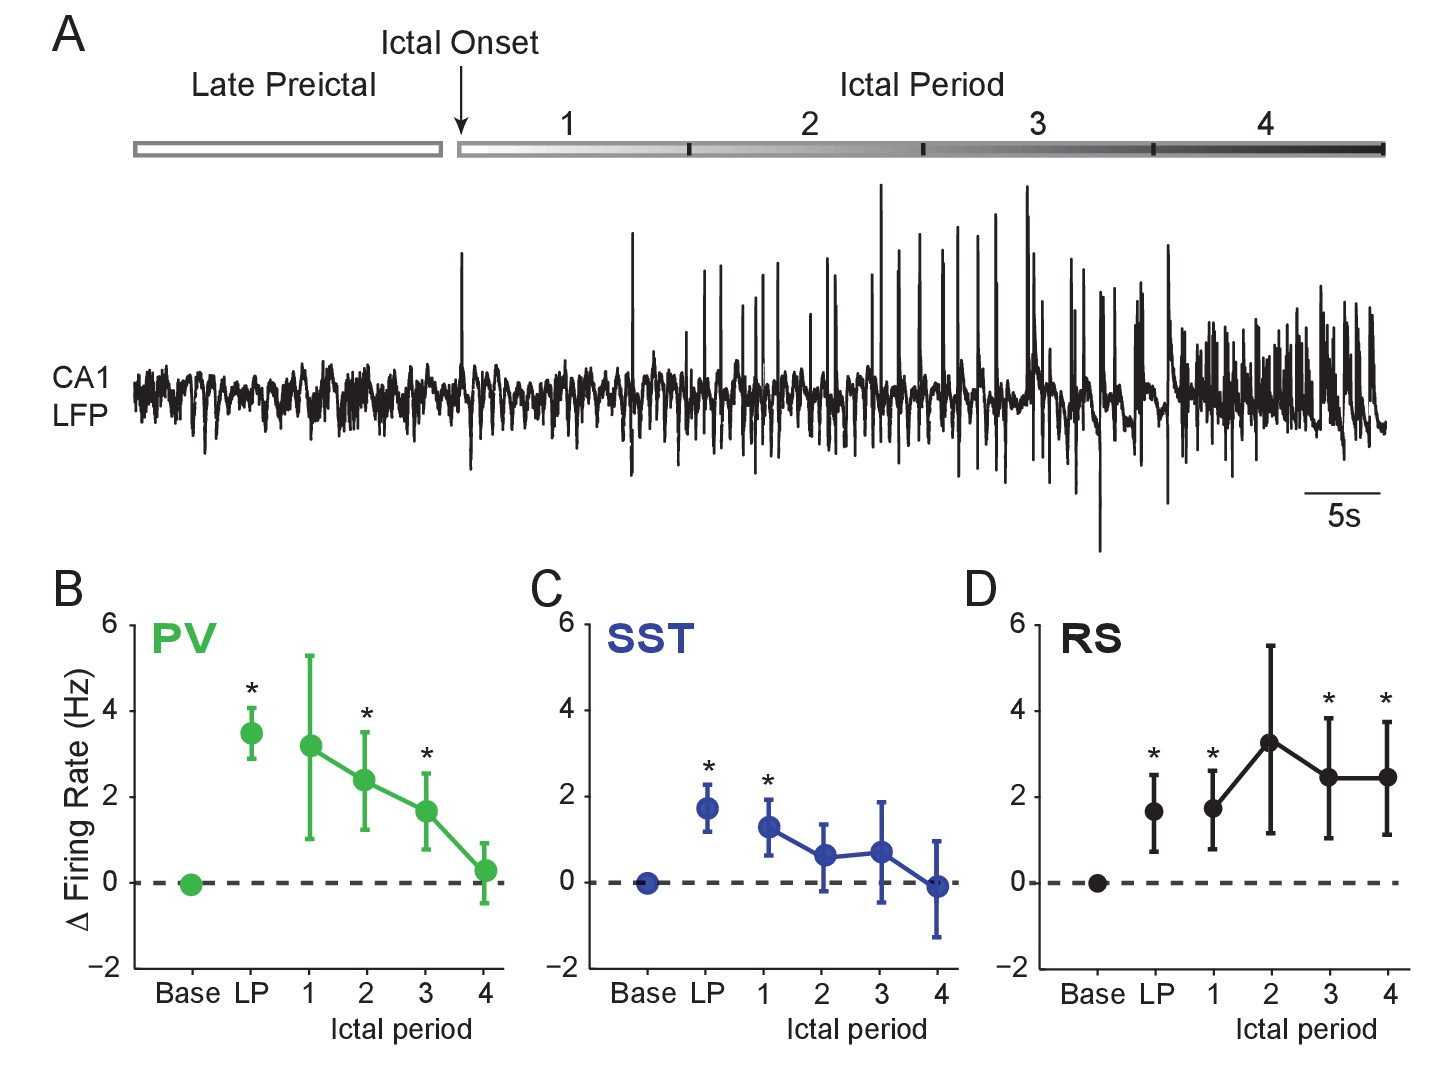
Interneuron firing rates decrease after ictal onset.
(A) Upper: Schematic of experimental paradigm showing the late preictal (LP) period, ictal onset timepoint, and ictal period. Lower: LFP trace from hippocampal CA1 recording. (B) Mean changes in firing rate as compared to baseline during four ictal periods for PV interneurons (n = 9 cells in eight mice). Firing rate in fourth ictal period was significantly lower than in the LP period for PV cells. (C) Mean ictal changes in SST interneuron firing rate (n = 18 cells in 17 mice). (D) Mean ictal changes in RS cell firing rate (n = 16 cells in nine mice). Note, LP values are taken from the 4th preictal period shown in Figure 1. All statistical comparisons are to the baseline period. Error bars denote mean ±s.e.m. *p<0.0125, **p<0.0025.
-
Figure 2—source data 1
Figure 2 - Statistical results.
- https://doi.org/10.7554/eLife.40750.008
Figure 3 with 1 supplement
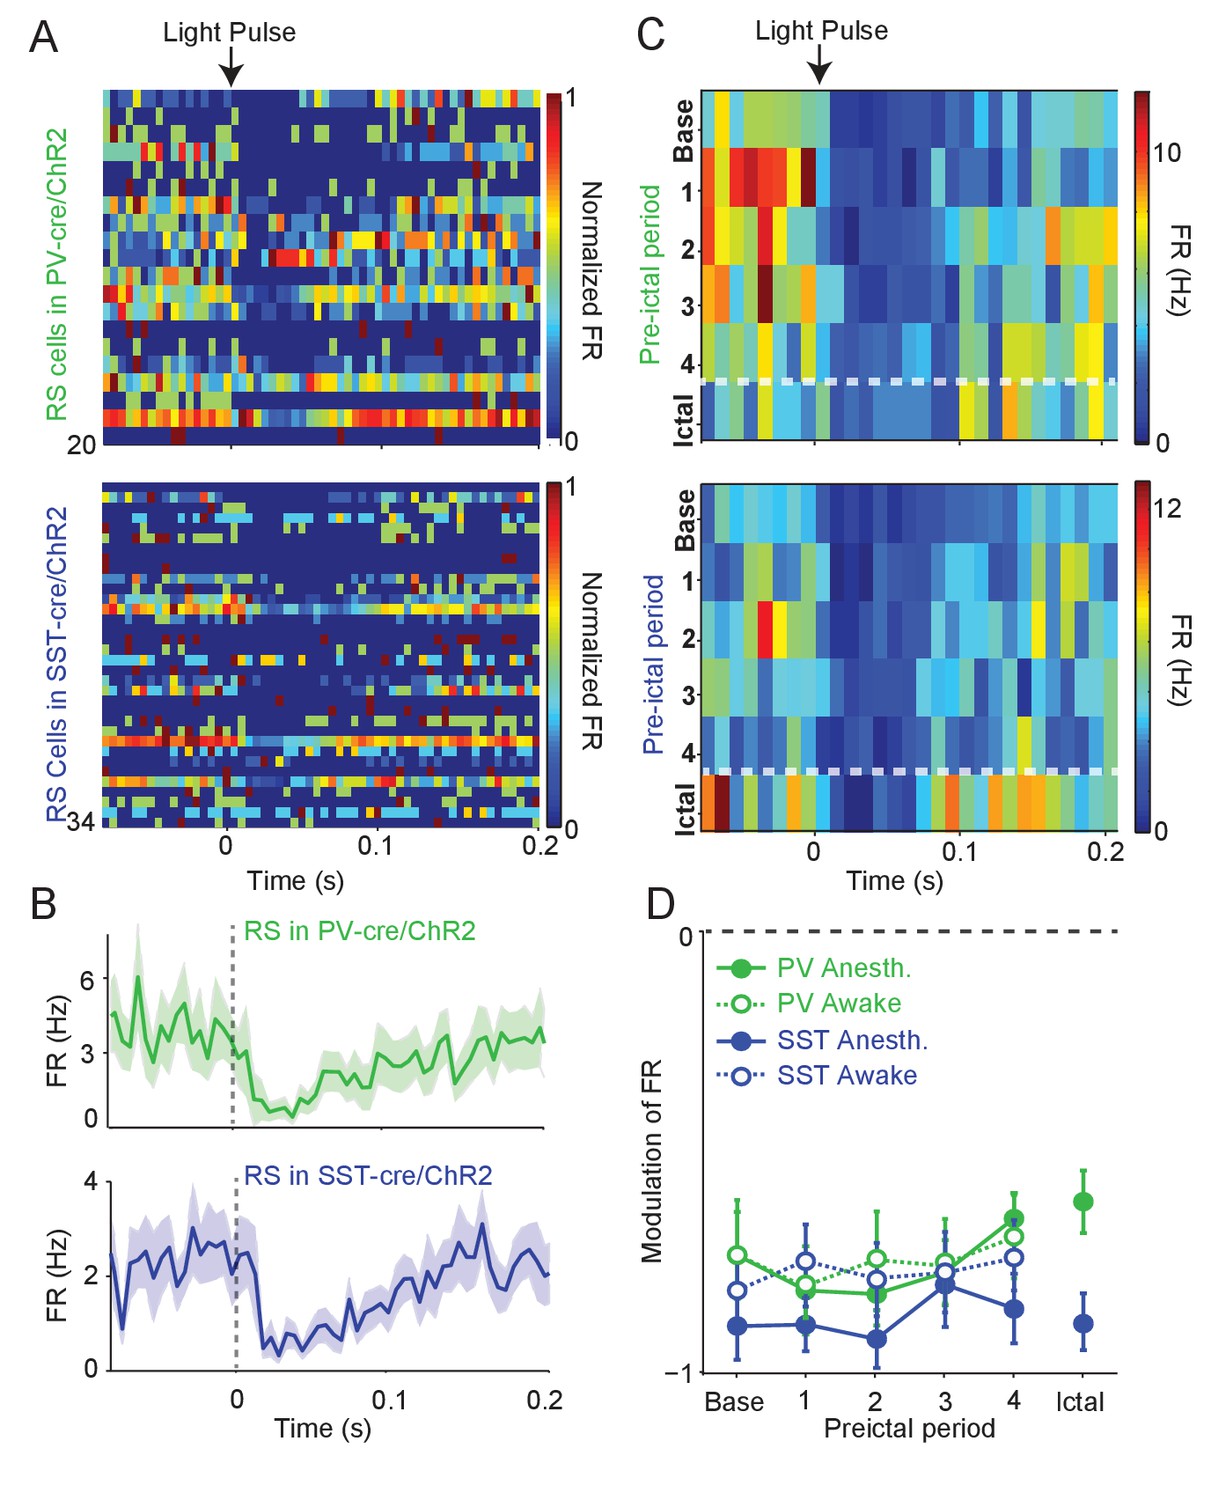
Intact preictal suppression of RS firing by evoked inhibition.
(A) Normalized firing rate (FR) as a function of time (s) from laser pulse onset (t = 0) for RS cells recorded simultaneously with PV cells in PV-Cre/ChR2 mice (n = 20 cells in 12 mice) or recorded with SST cells in SST-Cre/ChR2 mice (n = 34 cells in 16 mice) during baseline activity. For purposes of visualization, firing rates were normalized to the maximum firing rate for each cell. (B) Mean changes in baseline firing rate (Hz) of RS cells as a function of time (s) from laser pulse onset (dashed grey line). (C) Upper: Average firing rate of RS cells (n = 11 cells in eight mice) recorded during PV/ChR2 experiments as a function of time (s) from laser pulse onset during baseline, the four preictal periods and a 60 s period following ictal onset after PTZ administration (see Materials and methods). Lower: Average firing rate of RS cells (n = 11 cells in seven mice) recorded during SST/ChR2 experiments as a function of time (s) from laser pulse onset during baseline, the four preictal periods and following ictal onset. For these plots, we considered only light pulses of high light intensity (see Materials and methods). (D). Mean modulation of firing rate (see Materials and methods) after high-intensity laser pulse (0 to 50 ms) compared to pre-pulse (−200 to 0 ms) firing rate for RS cells recorded during PV/ChR2 (green) and SST/ChR2 (blue) experiments. Data from lightly anesthetized animals are shown as filled symbols and data from awake animals are shown as open symbols. Modulation scores for RS in PV-Cre and RS in SST-Cre were significantly different from zero for all periods. Error bars denote mean ±s.e.m.
-
Figure 3—source data 1
Figure 3 - Statistical results.
- https://doi.org/10.7554/eLife.40750.011
Figure 3—figure supplement 1
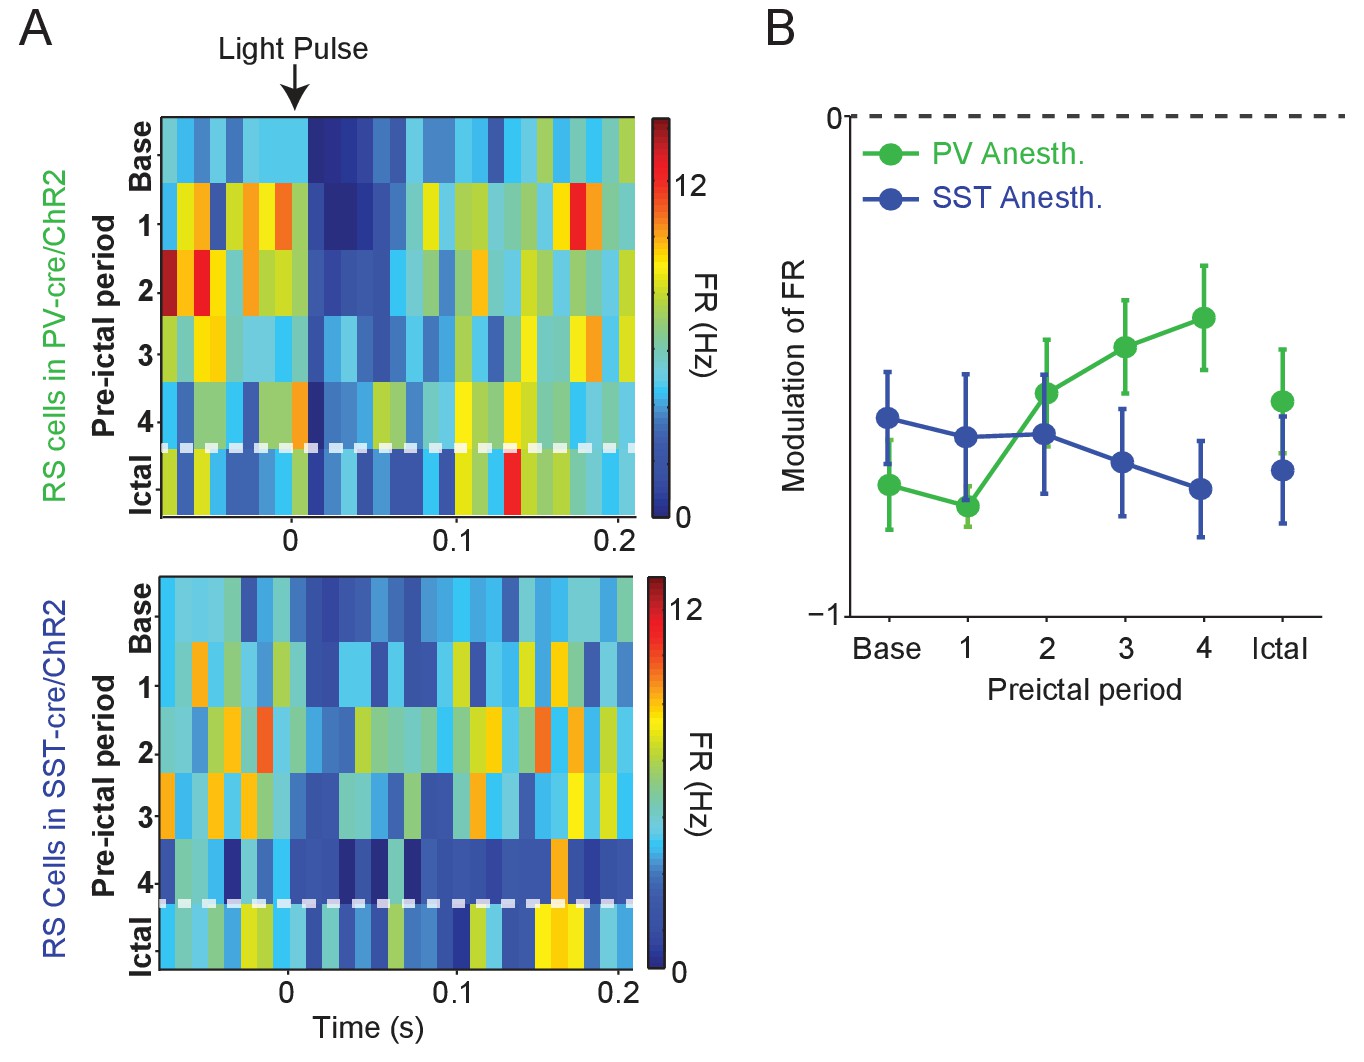
Modulation of RS firing by medium intensity stimulation of local inhibitory interneurons.
(A) Upper: Average firing rate of RS cells (n = 11 cells in eight mice) recorded during PV/ChR2 experiments as a function of time (s) from laser pulse onset during baseline, the four preictal periods and a 60 s period following ictal onset after PTZ administration (see Materials and methods). Lower: Average firing rate of RS cells (n = 11 cells in seven mice) recorded during SST/ChR2 experiments as a function of time (s) from laser pulse onset during baseline, the four preictal periods and following ictal onset. For these plots, we considered only light pulses of mediumlight intensity (see Materials and methods). (B). Mean modulation of firing rate (see Materials and methods) after medium-intensity laser pulse (0 to 50 ms) compared to pre-pulse (−200 to 0 ms) firing rate for RS cells recorded during PV/ChR2 (green) and SST/ChR2 (blue) experiments. Modulation scores for RS in PV-Cre and RS in SST-Cre were significantly different from zero for all periods.
Figure 4 with 1 supplement

Preictal changes in temporal patterning of interneuron activity (A) Mean changes in local variation (LV) of firing as compared to baseline over four preictal periods for PV and SST cells during acute PTZ seizure in lightly anesthetized animals.
LV is a measure of firing irregularity, where decreases in LV indicate more regular firing (see Materials and methods). (B) Same as A, but for interneurons recorded in awake animals. (C) Mean spike-field coherence (SFC) as a function of frequency (Hz) during baseline and fourth preictal period for PV-expressing cells. (D) Mean changes in SFC in 20 – 28 Hz band as compared to baseline over four preictal periods for PV and SST cells. Error bars denote mean ±s.e.m. *p<0.0125.
-
Figure 4—source data 1
Figure 4 - Statistical results.
- https://doi.org/10.7554/eLife.40750.014
Figure 4—figure supplement 1
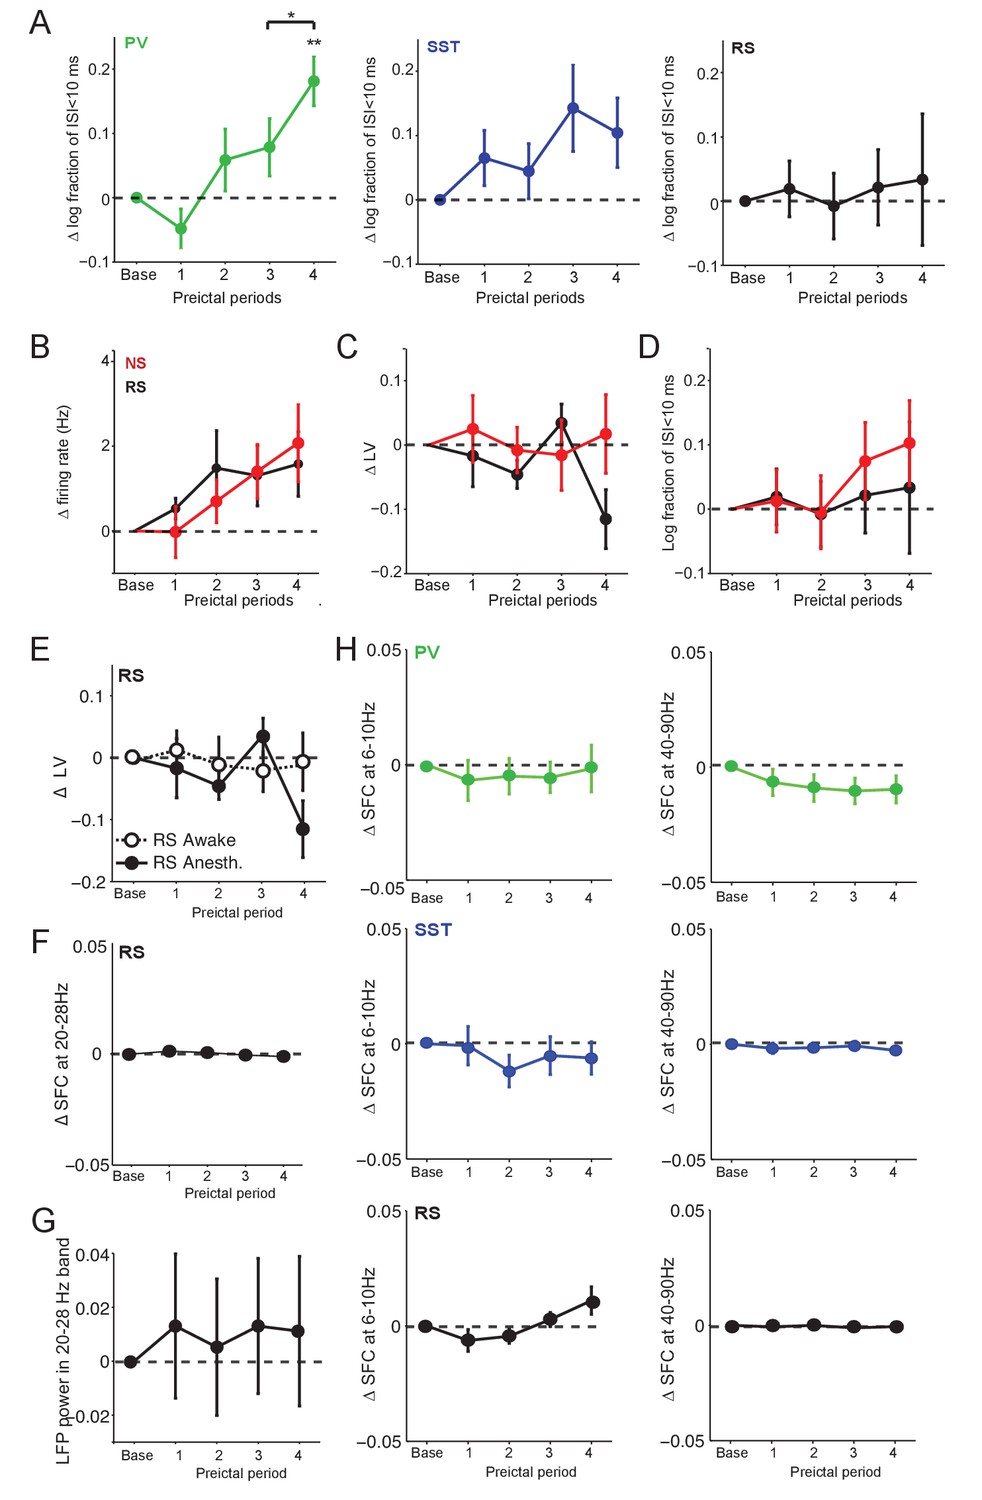
Preictal changes in the temporal pattern of interneuron activity.
(A) Mean ±SEM changes in the log10-ratio of short inter-spike-intervals (ISI;<10 ms) over long ISI (>10 ms) intervals, comparing baseline to four preictal periods for PV, SST and RS cells in acute PTZ seizure. **p<0.0025 for statistical comparisons to baseline. (B) A subset of the unidentified, ChR2-negative cells exhibited narrow spiking waveforms. Mean ±SEM changes in firing rate as compared to baseline over four preictal periods for RS cells (n = 20 cells in 12 mice) and the non-identified cells with narrow spike (NS) waveforms (n = 19 cells in 12 mice; see Figure 1—figure supplement 1) in the acute PTZ seizure model. See Figure 1E for comparison. (C) Mean ±SEM changes in local variation (LV) of firing as compared to baseline over four preictal periods for putative RS and NS cells. See Figure 4A for comparison. (D) Mean ±SEM changes in the log10-ratio of short inter-spike-intervals (ISI;<10 ms) over long ISI (>10 ms) intervals, comparing baseline to four preictal periods for RS cells and NS cells. (E) Change in LV of firing for RS cells over the four preictal periods in anesthetized and awake mice. See Figure 4A–B for comparison. (F) Quantification of spike-field coherence (SFC) for RS cells with the 20 – 28 Hz low gamma band during the four preictal periods as compared to baseline. See Figure 4D for comparison. (G) Mean ±SEM modulation in LFP power in different preictal periods as compared to baseline in the 20 – 28 Hz band for acute PTZ seizure. Modulation of LFP power was quantified as the log-ratio of LFP power during a preictal period over the LFP power during baseline. (H) Quantification of spike-field coherence (SFC) for PV (upper, green), SST (middle, blue), and RS (lower, black) cells with the theta (6 – 10 Hz, left) and high gamma (40 – 90 Hz, right) LFP bands. None of the comparisons to baseline (dotted lines) reached significance at p<0.0125.
Figure 5 with 1 supplement
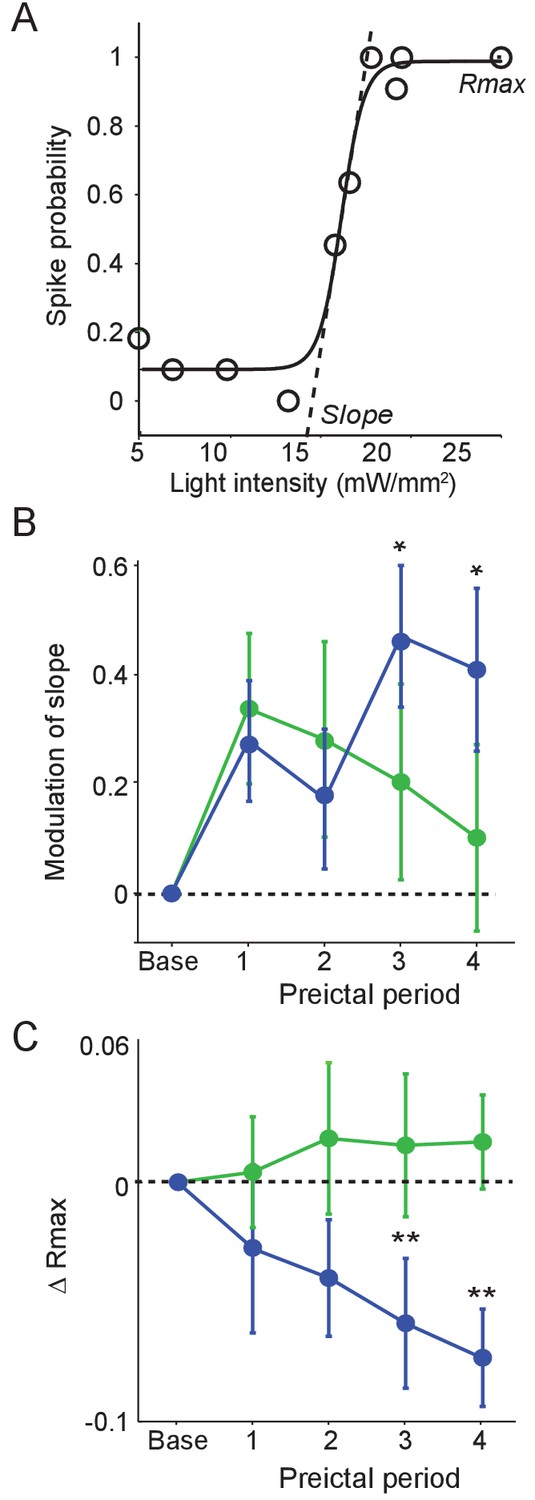
Preictal changes in interneuron sensitivity to inputs (A) Example response curve of spike probability as a function of light pulse intensity (mW/mm2) with sigmoid curve fit, showing slope and maximal response probability (Rmax).
(B) Mean modulation of the slope parameter compared to baseline over four preictal periods for PV (n = 17 cells in 15 mice) and SST (n = 21 cells in 20 mice) cells. (C) Mean change in Rmax compared to baseline (dotted line) over four preictal periods for PV and SST cells. (B–C) Significance to baseline: *p<0.0125, **p<0.0025, ***p<0.00025. Error bars denote mean ±s.e.m.
-
Figure 5—source data 1
Figure 5 - Statistical results.
- https://doi.org/10.7554/eLife.40750.017
Figure 5—figure supplement 1
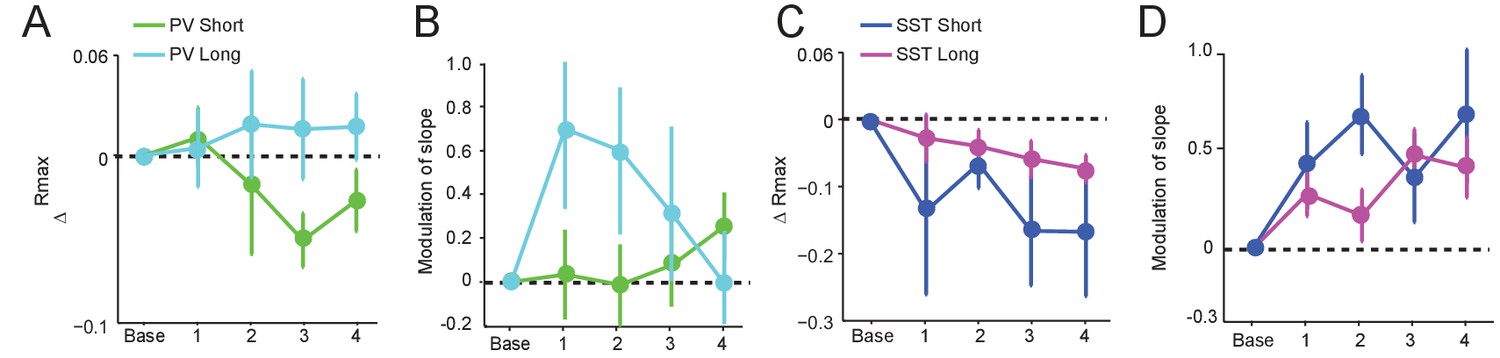
Data for ChR2 stimulation reported in Figure 5 were divided into short (<300 s) and long (>300 s) groups according to preictal latency (See Figure 1—figure supplement 2).
(A) Mean change in Rmax compared to baseline over four preictal periods for PVSHORT (n = 10) and PVLONG (n = 7). (B) Mean modulation of the slope parameter compared to baseline over four preictal periods for PVSHORT and PVLONG. (C) Mean change in Rmax compared to baseline for SSTSHORT (n = 4) and SSTLONG (n = 17). (D) Mean modulation of slope compared to baseline for SSTSHORT and SSTLONG.
Additional files
-
Transparent reporting form
- https://doi.org/10.7554/eLife.40750.018
Download links
A two-part list of links to download the article, or parts of the article, in various formats.
Downloads (link to download the article as PDF)
Open citations (links to open the citations from this article in various online reference manager services)
Cite this article (links to download the citations from this article in formats compatible with various reference manager tools)
Altered hippocampal interneuron activity precedes ictal onset
eLife 7:e40750.
https://doi.org/10.7554/eLife.40750


