Plasticity of Escherichia coli cell wall metabolism promotes fitness and antibiotic resistance across environmental conditions
- Washington University in St. Louis, United States
- Newcastle University, United Kingdom
- Utrecht University, Netherlands
Figures
Figure 1 with 3 supplements
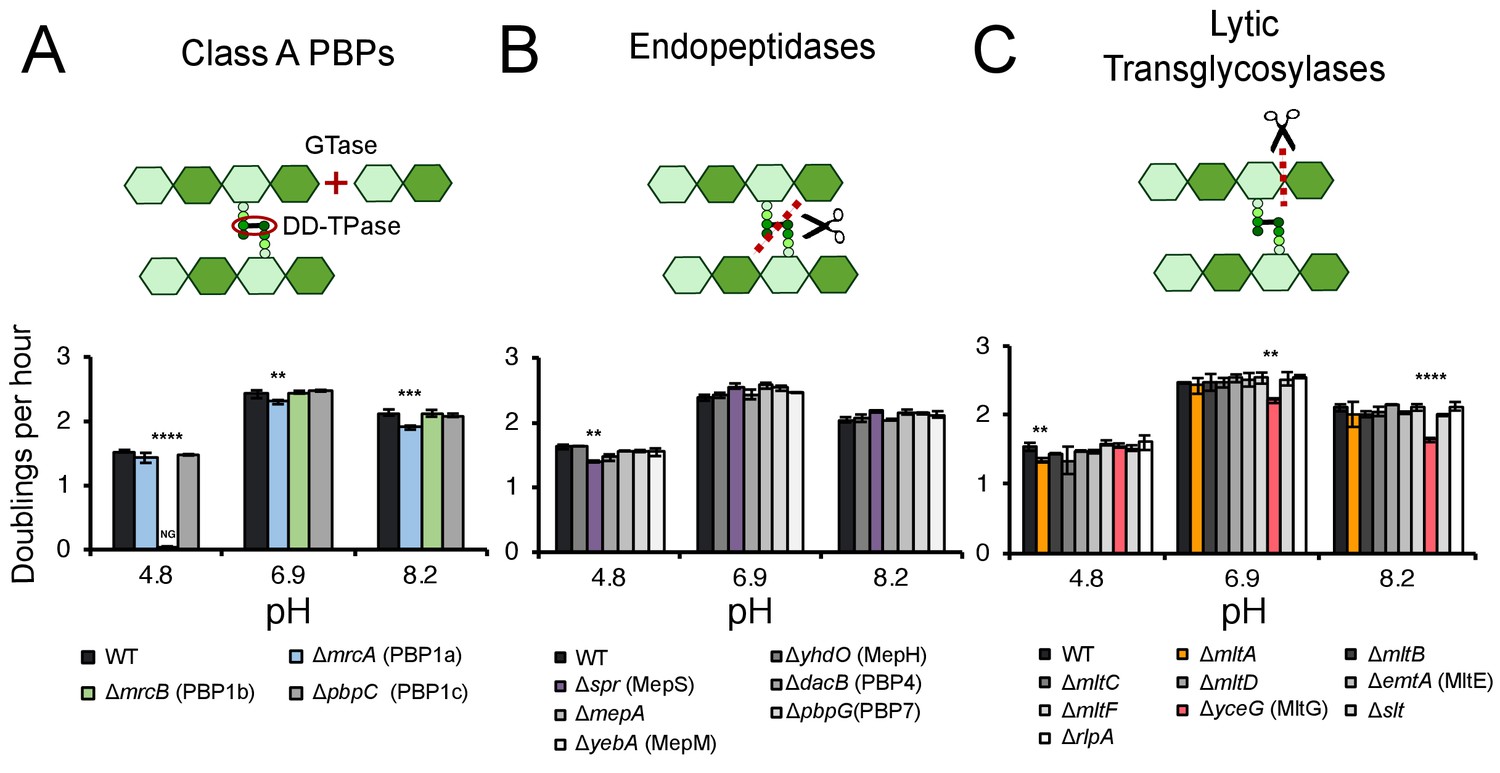
Identification of pH specialist cell wall enzymes.
Mutants in genes encoding for non-essential class A PBPs (A), endopeptidases (B), and lytic transglycosylases (C) were screened for growth defects compared to the parental strain in LB media buffered to pH 4.8, 6.9, or 8.2. Bars depict mean mass doublings per hour ±SD of three independent biological replicates. NG denotes ‘no growth’ observed throughout the course of the experiment (20 hr). Cartoons depict enzymatic activity of the indicated enzyme class with GTase and DD-TPase referring to glycosyltransferase and DD-transpeptidase activity, respectively. Asterisks denote a significant >5% growth defect as determined by a one-way ANOVA corrected for multiple comparisons as follows: **, p<0.01; ***, p<0.001; ****p<0.0001. Mean ± SD values for mutants in this figure and all additional mutants tested can be viewed in Supplementary file 3. Representative growth curves, fits, and source data from the class A PBP mutants can be viewed in Figure 1—figure supplement 1 and Figure 1—source datas 1–3.
-
Figure 1—source data 1
Representative source data for class A PBP mutants at pH 4.8.
Supports Figure 1 and Figure 1—figure supplement 1. This data was used to generate growth curves, fits, and fit statistics in Figure 1—figure supplement 1.
- https://doi.org/10.7554/eLife.40754.006
-
Figure 1—source data 2
Representative source data for class A PBP mutants at pH 6.9.
Supports Figure 1 and Figure 1—figure supplement 1. This data was used to generate growth curves, fits, and fit statistics in Figure 1—figure supplement 1.
- https://doi.org/10.7554/eLife.40754.007
-
Figure 1—source data 3
Representative source data for class A PBP mutants at pH 8.2.
Supports Figure 1 and Figure 1—figure supplement 1. This data was used to generate growth curves, fits, and fit statistics in Figure 1—figure supplement 1.
- https://doi.org/10.7554/eLife.40754.008
Figure 1—figure supplement 1
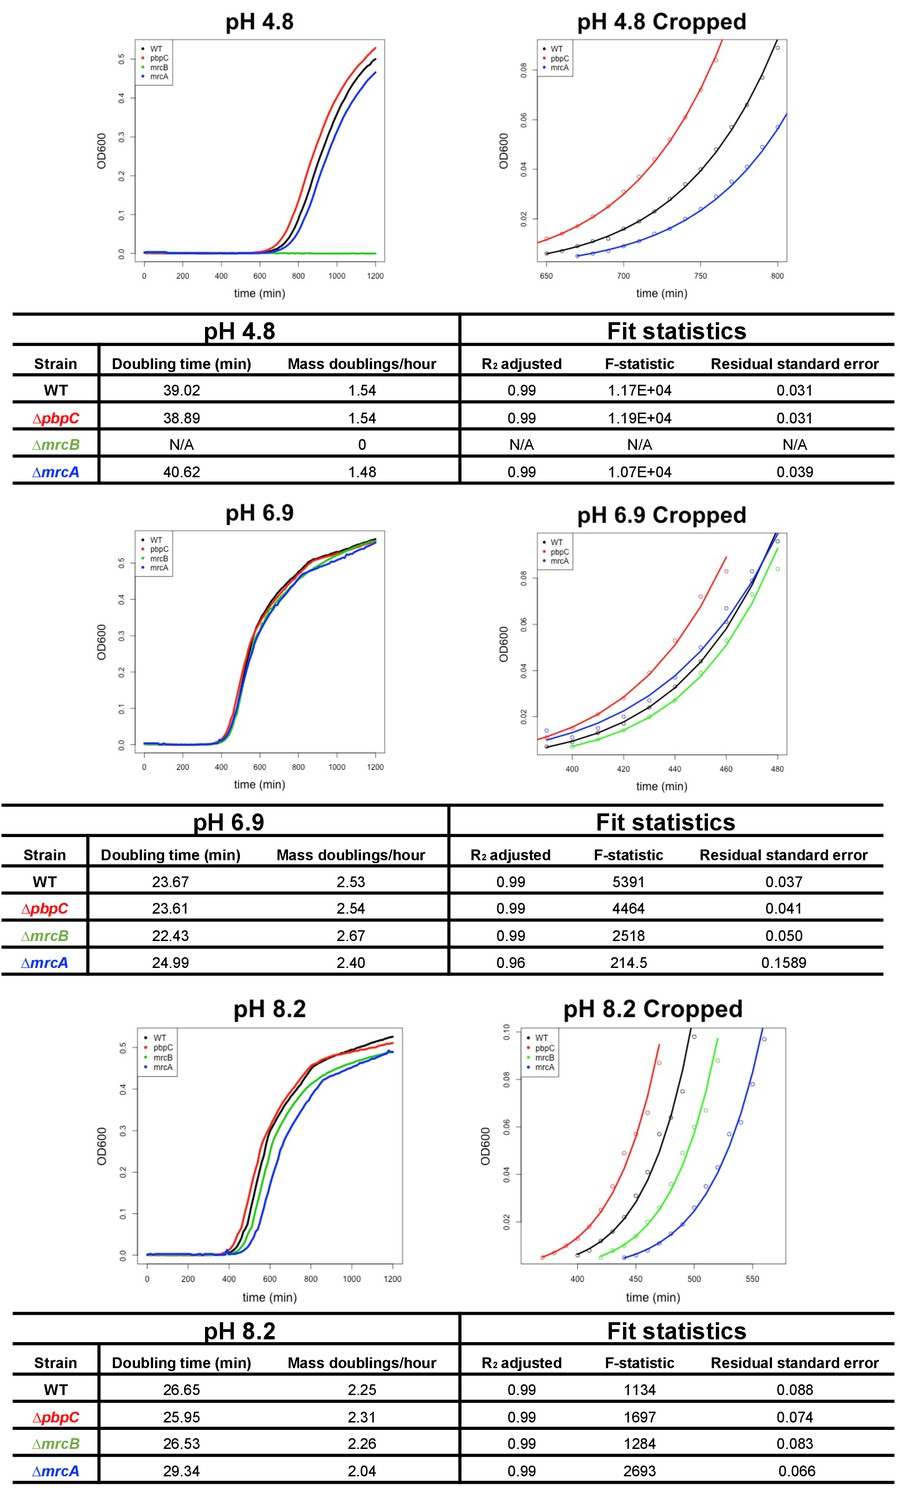
Growth rate determination pipeline.
Growth rate (mass doublings per hour) for each mutant was assessed in buffered LB (various pH values) during growth in a 96-well microtiter plate at 37°C with aeration. Cells were inoculated into the plate at 1 × 10³ CFU/mL, and OD600 was measured every 10 min for 20 hr. From this data, growth curves were plotted and cropped to early exponential phase (OD600 values between 0.005–0.1). The resulting data used to determine DPH by least-squares fitting in R. Full and cropped growth curves, including best fit lines and fit statistics, of a single replicate for cells defective for each of the three class A PBPs and the parental strain at pH 4.8, 6.9, and 8.2 are shown here as representative examples. Fits with R2 values < 0.95 were excluded from further analysis. Source data presented here can be found in Figure 1—source data 1–3, and a representative script is included in Supplementary file 7.
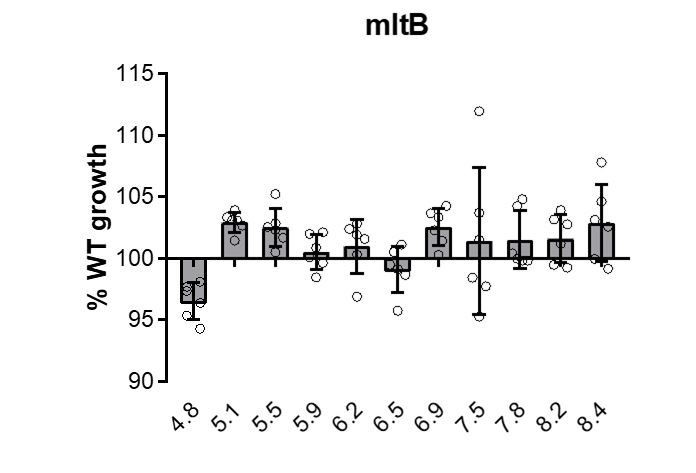
Figure 1—figure supplement 2
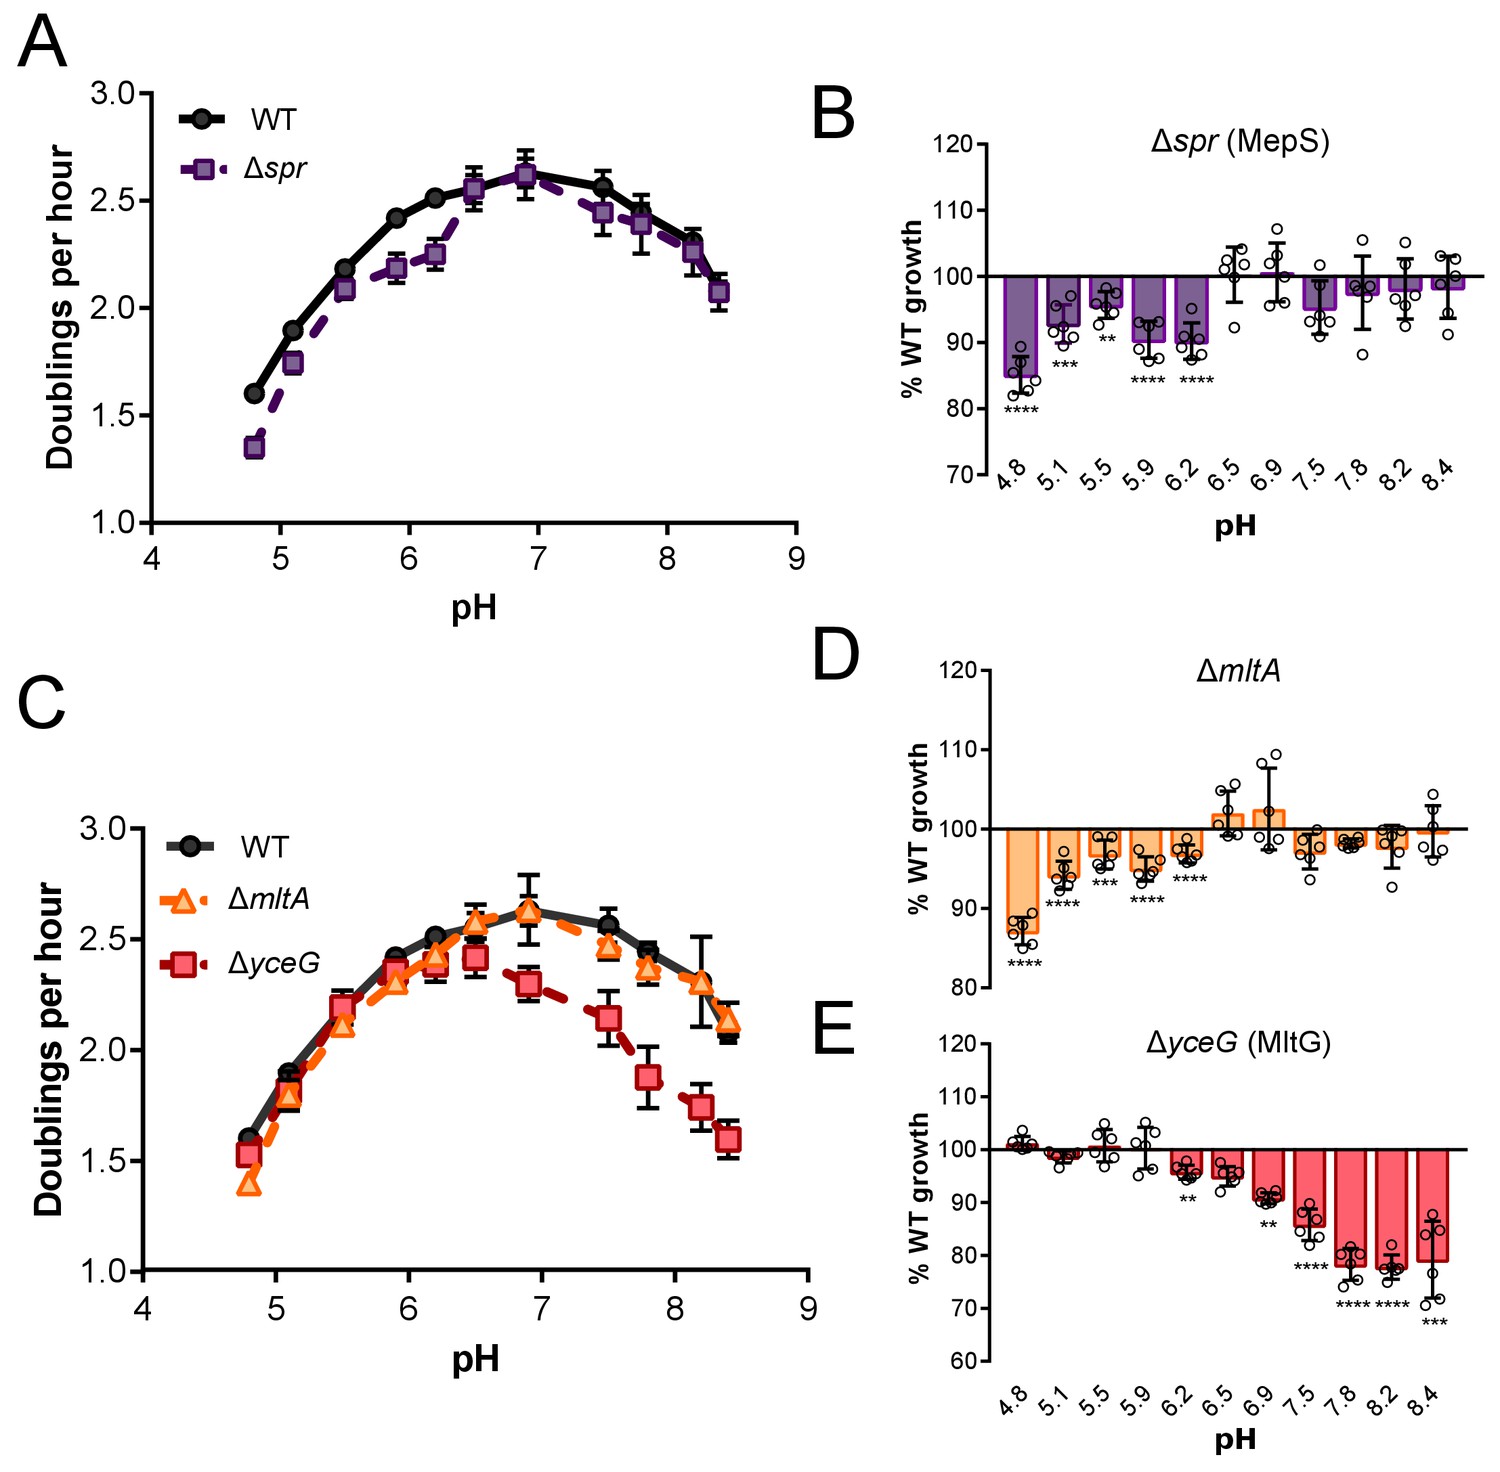
Growth rate determination of hits across an expanded set of pH conditions.
Mean mass doublings per hour and transformed percent parental growth for endopeptidase mutant Δspr (EAM1032; A and B) and lytic transglycosylase mutants ΔmltA and ΔyceG (EAM790 and EAM798; C–E). Significance was determined by an unpaired t-test corrected for multiple comparisons using the Holm-Sidak method. Error bars represent SD from six independent biological replicates. Asterisks denote significance as follows: **, p<0.01; ***, p<0.001; ****p<0.0001.
Figure 1—figure supplement 3
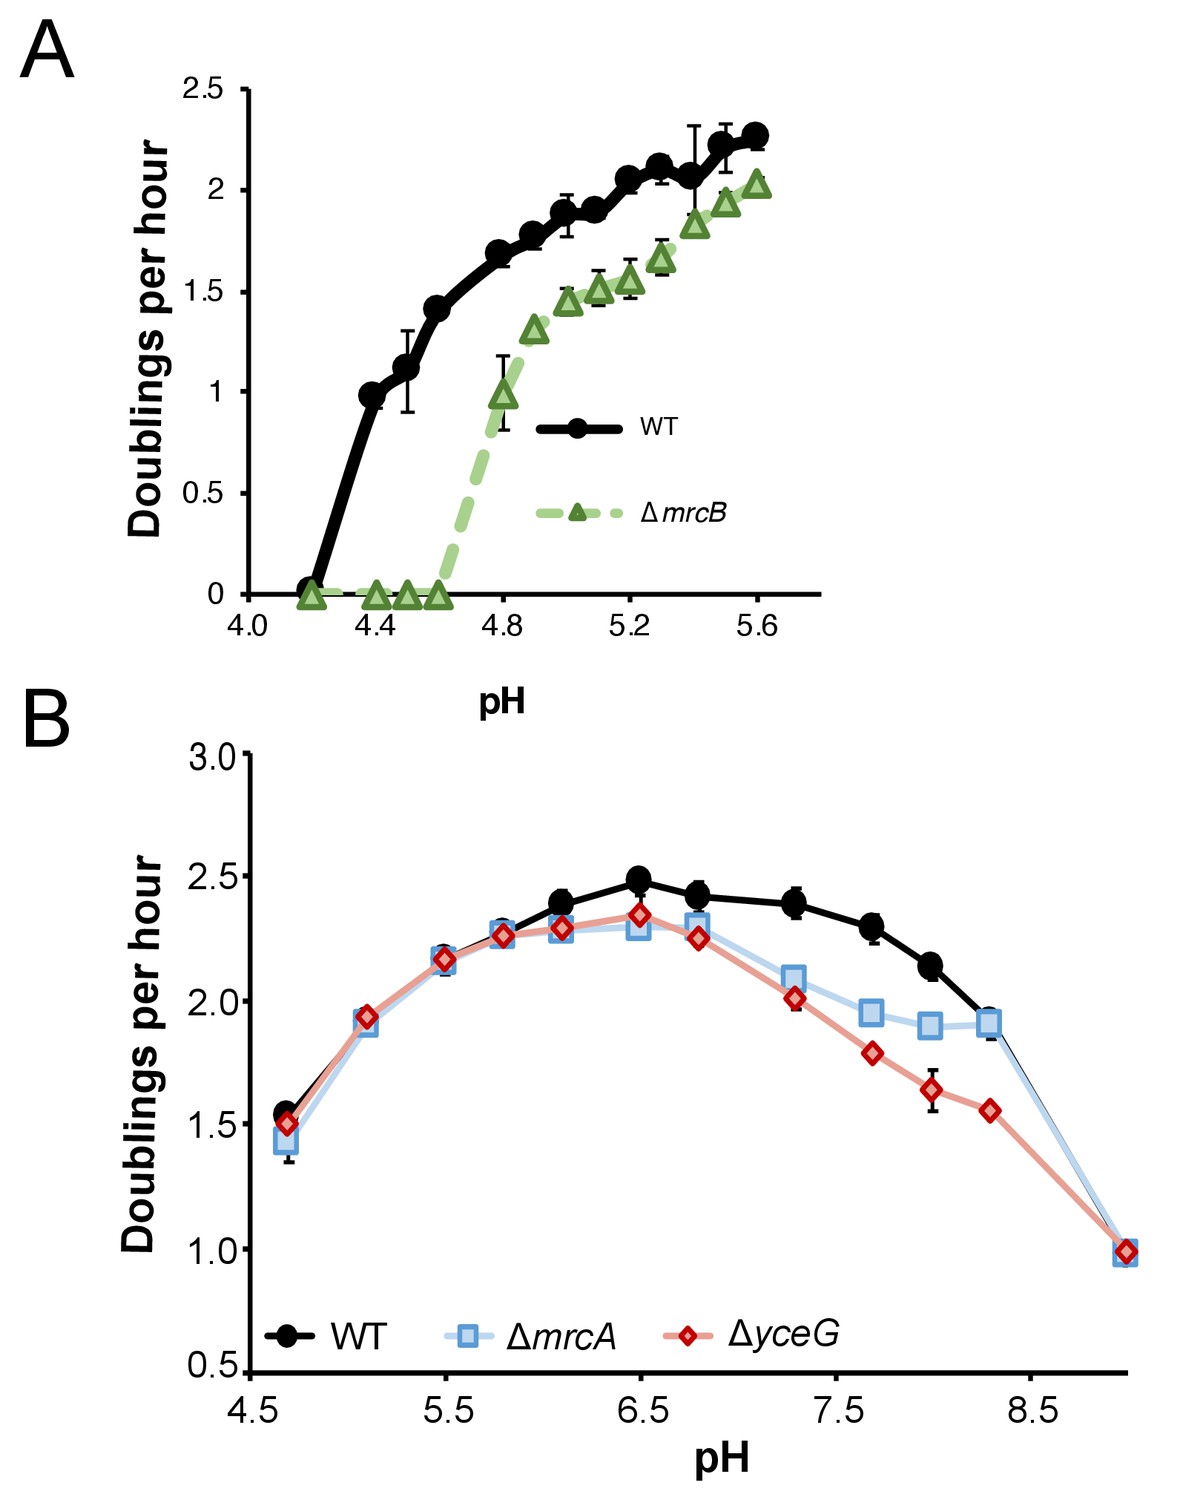
Growth of class A PBP mutants in extreme pH conditions.
(A) Mean mass doublings per hour of ∆mrcB (PBP1b; EAM546) and the parental strain (MG1655) in LB media buffered from pH 4.2–5.8. Strains were pre-cultured in acidic media (LB +MMT, pH 5.5). (B) Mean mass doublings per hour of ∆mrcA (PBP1a; EAM543), ∆yceG (EAM798), and the parental strain (MG1655) from pH 4.8–9.0. Error bars represent SD from three biological replicates for both A and B.
Figure 2 with 2 supplements
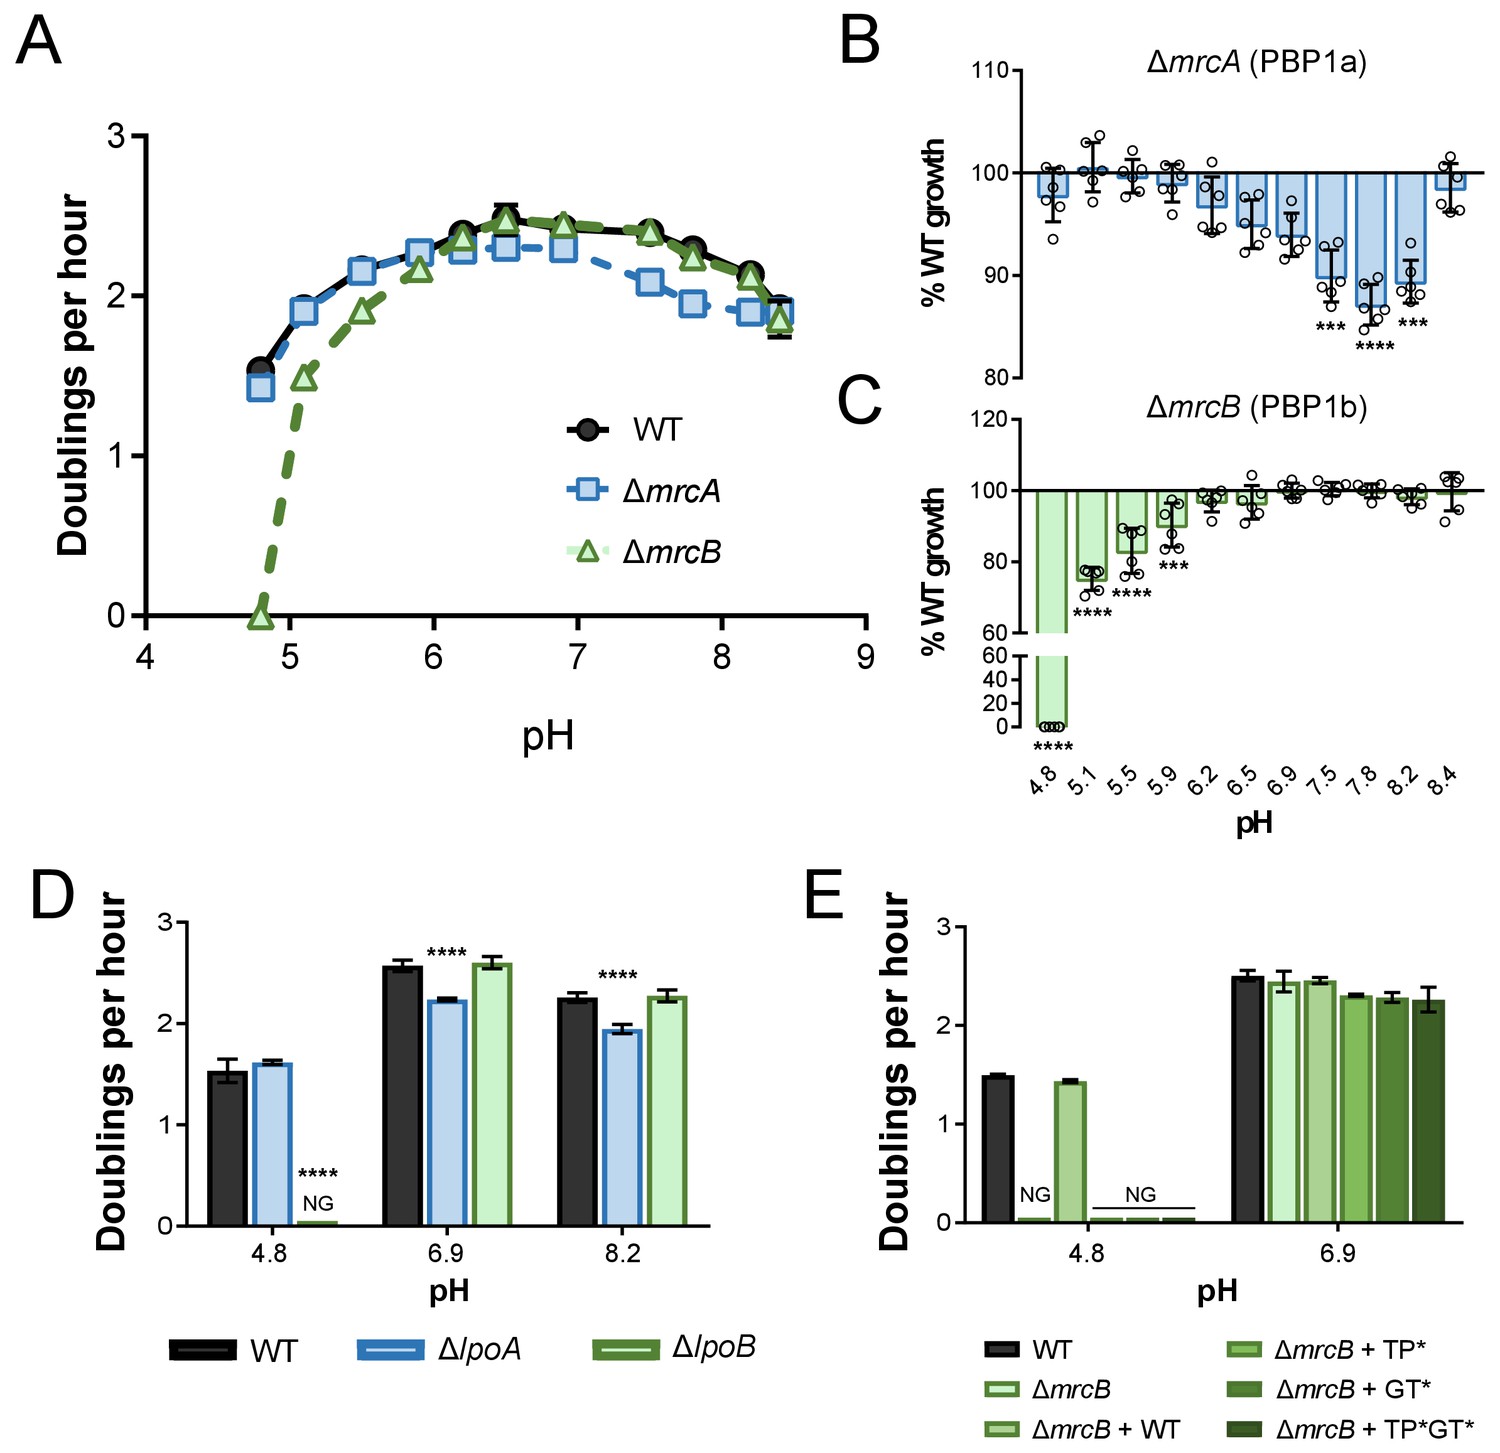
pH-dependent growth requires class A PBP activity.
(A–C) Mean mass doublings per hour and transformed percent parental growth for ∆mrcA (PBP1a; EAM543) and ∆mrcB (PBP1b; EAM546) deletions compared to parental strain (MG1655) in LB media buffered from pH 4.8–8.4 Significance was determined by an unpaired t-test corrected for multiple comparisons using the Holm-Sidak method. Error bars represent SD from six independent biological replicates. (D) Growth rate analysis of cells defective for LpoA (EAM657) and LpoB (EAM659) cultured in buffered LB at pH 4.8, 6.9, or 8.0. Bars represent mean mass doublings per hour ± SD from three independent biological replicates. Asterisks denote significance as determined by a one-way ANOVA corrected for multiple comparisons as follows: ****, p<0.0001. Growth of these mutants across an expanded set of pH conditions can be viewed in Figure 2—figure supplement 2. (D) Complementation analysis of PBP1b variants synthesized from a plasmid (pUM1Bα, pUM1Bα*, pUM1BTG*α, or pUM1BTG*α*) and induced with 5 μM IPTG in the ΔmrcB (EAM696) background in buffered LB at pH 4.8 and 6.9. Bars represent mean mass doublings per hour ± SD from three independent biological replicates. NG denotes ‘no growth’ observed throughout the course of the experiment (20 hr).
Figure 2—figure supplement 1
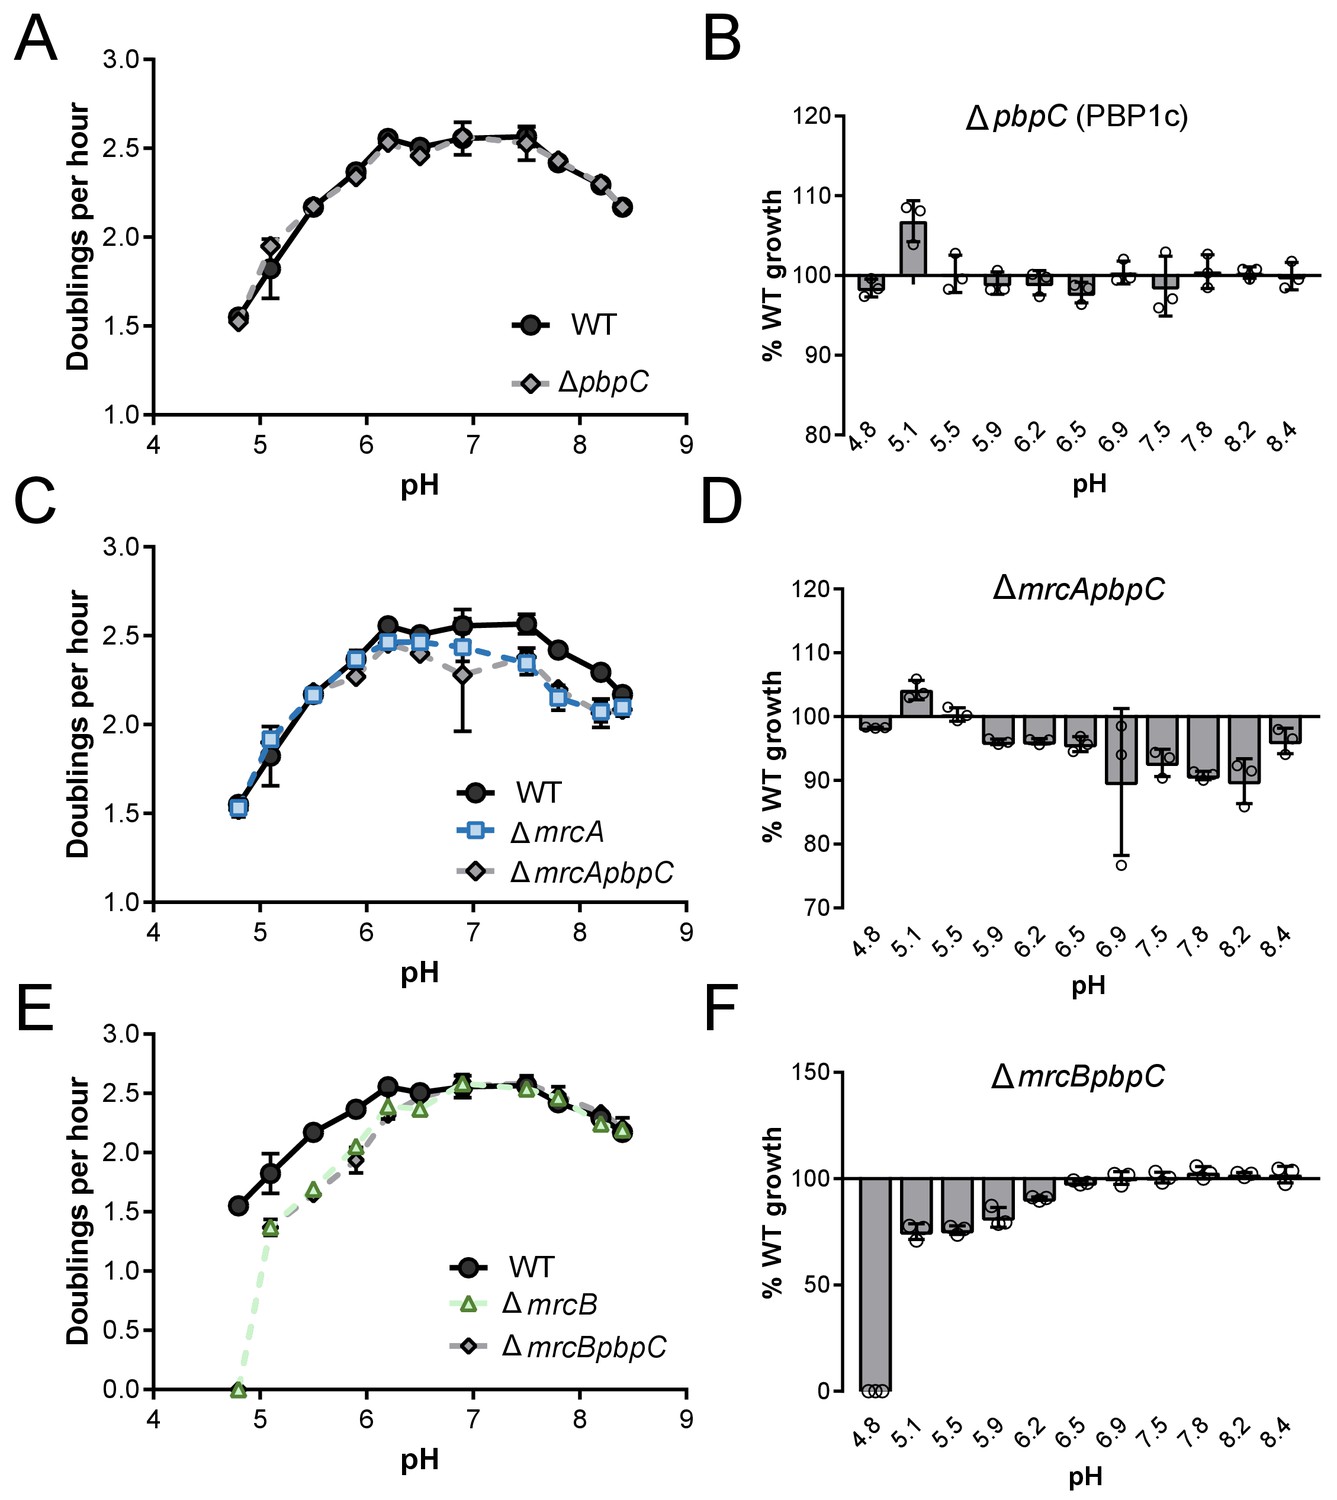
Growth rate analysis of strains defective for PBP1c.
Mean mass doublings per hour and transformed percent parental growth for ∆pbpC (EAM694; A, B), ∆mrcApbpC (EAM1137; C, D), and ∆mrcBpbpC (EAM1139; E, F) compared their parental strains in LB media buffered from pH 4.8–8.4. Error bars indicate SD of three independent biological replicates.
Figure 2—figure supplement 2
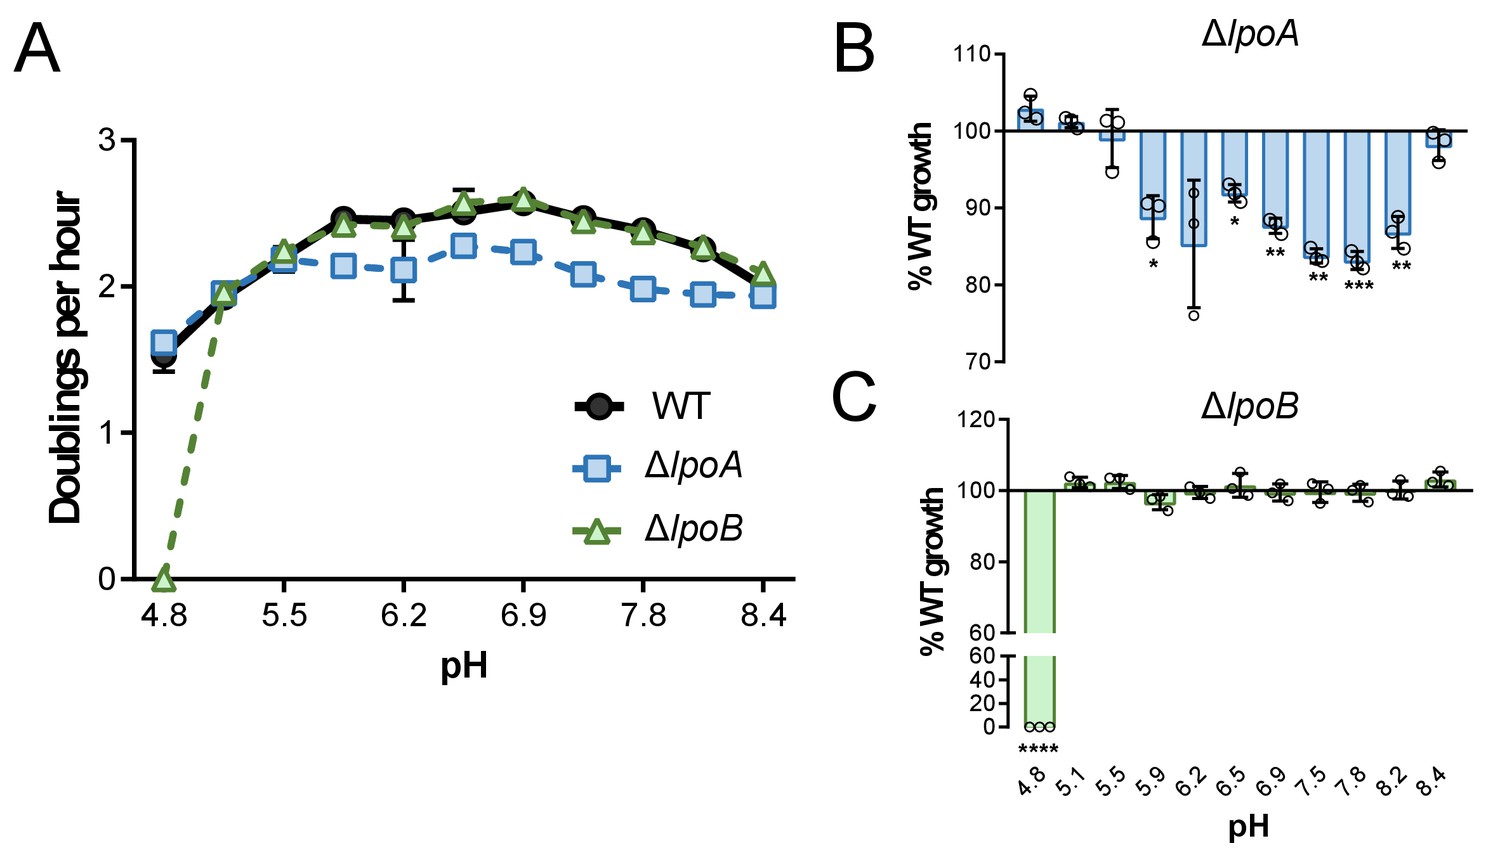
Growth rate determination of lpo mutants across an expanded set of pH conditions.
Mean mass doublings per hour and transformed percent parental growth for ∆lpoA (EAM657) and ∆lpoB (EAM659) mutants compared to the parental strain (MG1655) from pH 4.8–8.4. Significance was determined by an unpaired t-test corrected for multiple comparisons using the Holm-Sidak method. Error bars represent SD from six independent biological replicates. Asterisks denote significance as follows: *, p<0.05; **, p<0.01; ***, p<0.001; ****, p<0.0001.
Figure 3 with 1 supplement
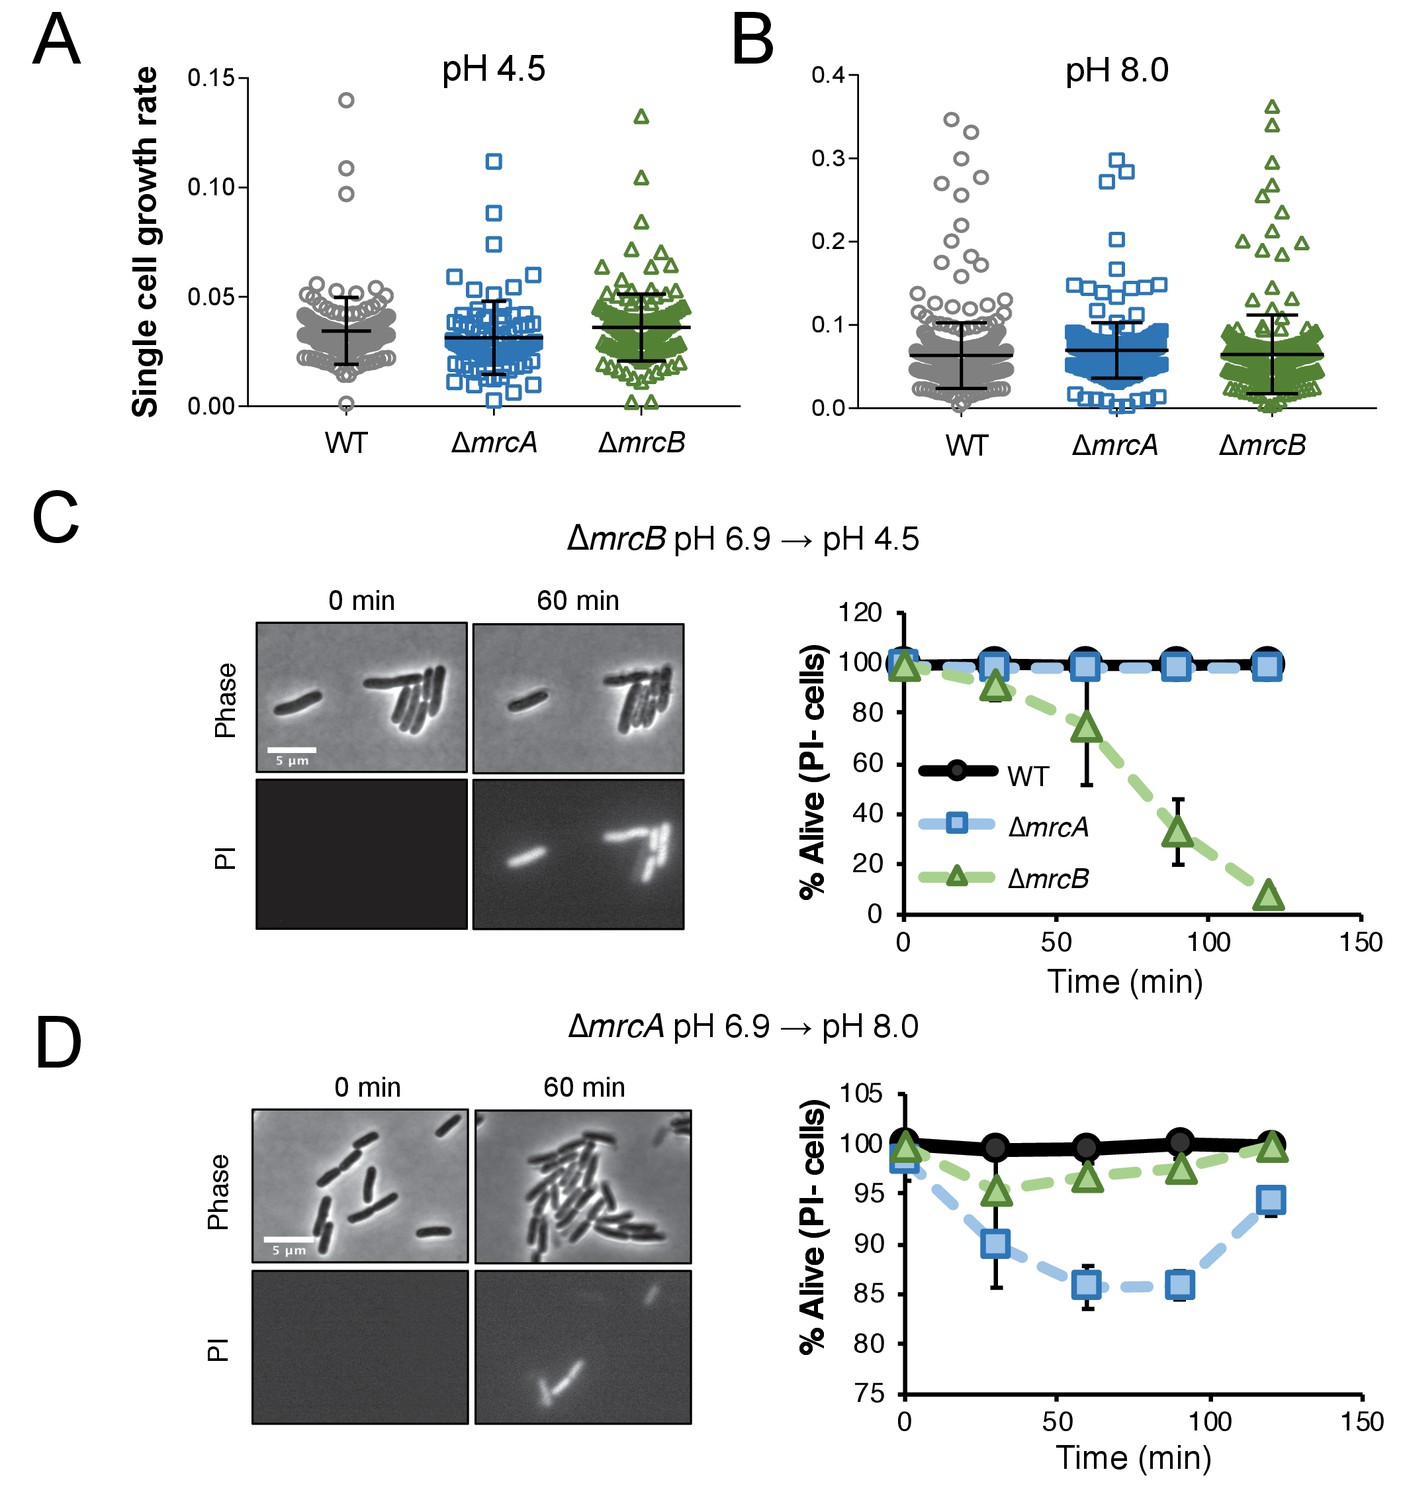
Cells defective for class A PBPs lyse upon exposure to non-permissive pH conditions.
(A–B) Single cell elongation rates for wild-type (MG1655), ∆mrcA (EAM543), and ∆mrcB (EAM546) cells during growth on agarose pads at pH 4.5 (A; n = 134, 81, and 155 cells) and pH 8.0 (B; n = 386, 257, and 246 cells). Rates were determined in the MATLAB-based program SuperSegger as described in the methods. Error bars represent SD. (C–D) Micrographs depicting representative images of propidium iodide incorporation in ∆mrcA (D, left) and ∆mrcB (C, left) mutants at t = 0 or 60 min post indicated pH shift. Scale bar represents 5 μm. Cell viability curves for wild-type, ∆mrcA (PBP1a), and ∆mrcB (PBP1b) strains after acidic (D, right) or alkaline pH (C, right) shift as indicated. Cell death was determined by uniform cytoplasmic staining with propidium iodide. Markers indicate mean percent viability ± SD of three biological replicates. Greater than 100 cells were analyzed for each strain at each time point per replicate.
Figure 3—figure supplement 1

Cytoplasmic GFP loss correlates with propidium iodide staining.
Representative micrographs for ∆mrcB (EAM546) (A) and time course of fluorescence signal (B–C) for ∆mrcA (EAM543) and ∆mrcB mutants expressing gfp from an IPTG-inducible promoter (pBH234) when exposed to indicated non-permissive pH conditions. EAM543 and EAM546 were induced with 10 and 20 μM IPTG, respectively. Markers represent percent of cells straining positive for GFP (triangles) or PI (squares) ± SD for three independent biological replicates. (D) Propidium iodide staining for ∆mrcA (EAM543) cells grown in liquid culture at pH 8.2 at indicated time points. Markers indicate mean percent viability ± SD of three biological replicates. For each time point, at least 100 cells were analyzed per replicate (panels B-D).
Figure 4 with 2 supplements
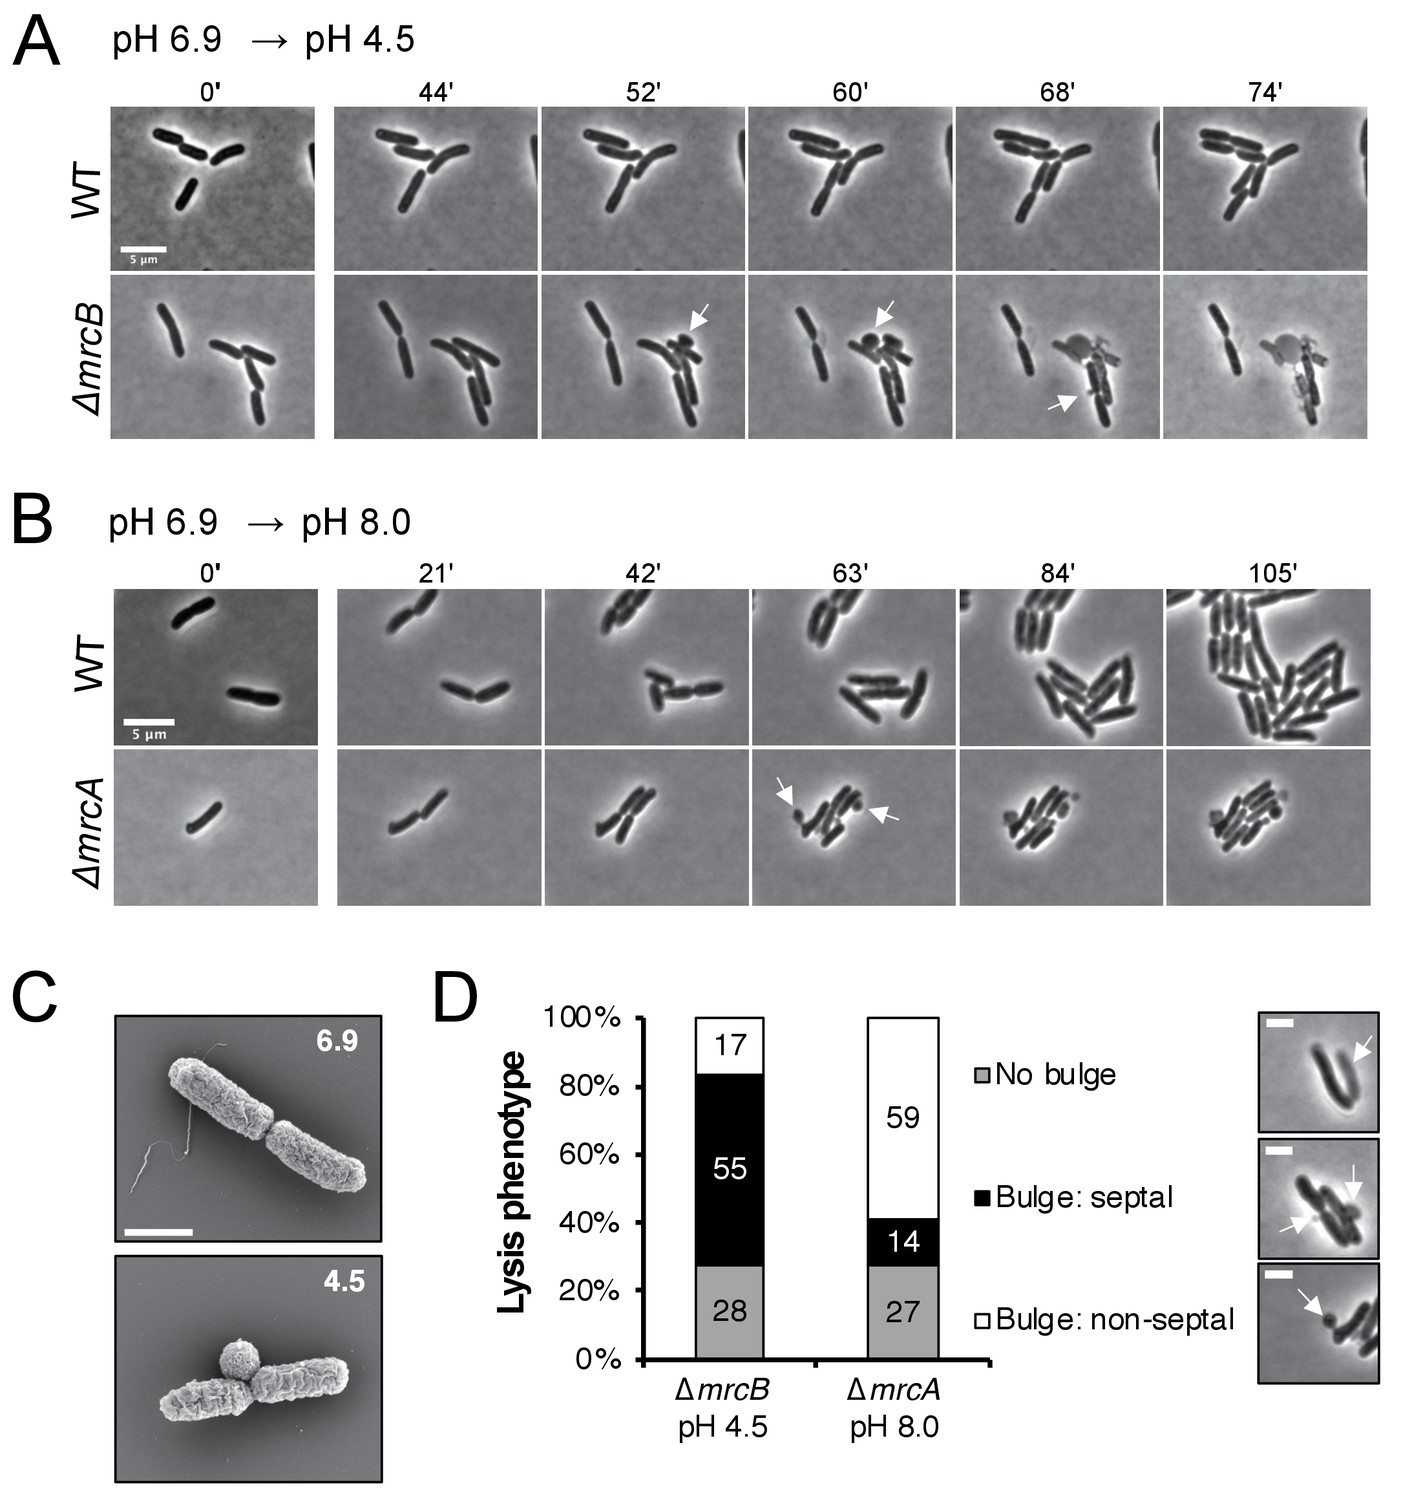
Distinct lytic phenotypes for cells defective for PBP1a and PBP1b upon pH shift.
(A–B) Representative phase contrast frames of time lapse imaging of ∆mrcB (PBP1b; EAM546) and ∆mrcA (PBP1a; EAM543) mutants upon acidic (A) or alkaline (B) pH shift, respectively, as compared to the parental strain (MG1655). White arrows indicate membrane bulges. Scale bar denotes 5 μm. Full videos can be viewed in Figure 4—videos 1 and 2. (C) Representative scanning electron microscopy micrographs for ∆mrcB (PBP1b; EAM546) mutant shifted to either pH 6.9 or pH 4.5 for two hours prior to fixation. Scale bar represents 1 μm. (D) Quantification of lysis phenotype between mutants. Lytic terminal phenotype was categorized into three groups: lysis via septal bulge, non-septal bulge, or no bulge. Determination of lytic phenotype was based on the frames preceding propidium iodide incorporation (time step = 3 min). Micrographs (top to bottom) depict representative images of no bulge, septal bulge, and non-septal bulge, respectively with arrows (scale bar = 2 μm). At least 50 cells across at least two independent biological replicates were assessed (ΔmrcA, n = 128; ΔmrcB, n = 278 cells). Bars are subdivided based on percent lytic phenotype in each mutant.
Figure 4—video 1
∆mrcB cells undergo septal lysis upon exposure to acidic media.
Representative video of ∆mrcB cell growth and lysis. Cells were cultured at pH 6.9 to early exponential phase (OD600 ~0.05–0.1) then spotted on agarose pads buffered to pH 4.5. Cells were allowed to dry for 10 min at room temperature prior to imaging at 37°C. Still images corresponding to this video are shown in Figure 4A.
Figure 4—video 2
Subpopulation of ∆mrcA cells lyse upon exposure to alkaline media.
Representative video of ∆mrcA cell growth and lysis. Cells were cultured at pH 6.9 to early exponential phase (OD600 ~0.05–0.1) then spotted on agarose pads buffered to pH 8.0. Cells were allowed to dry for 10 min at room temperature prior to imaging at 37°C. Still images corresponding to this video are shown in Figure 4B.
Figure 5 with 4 supplements
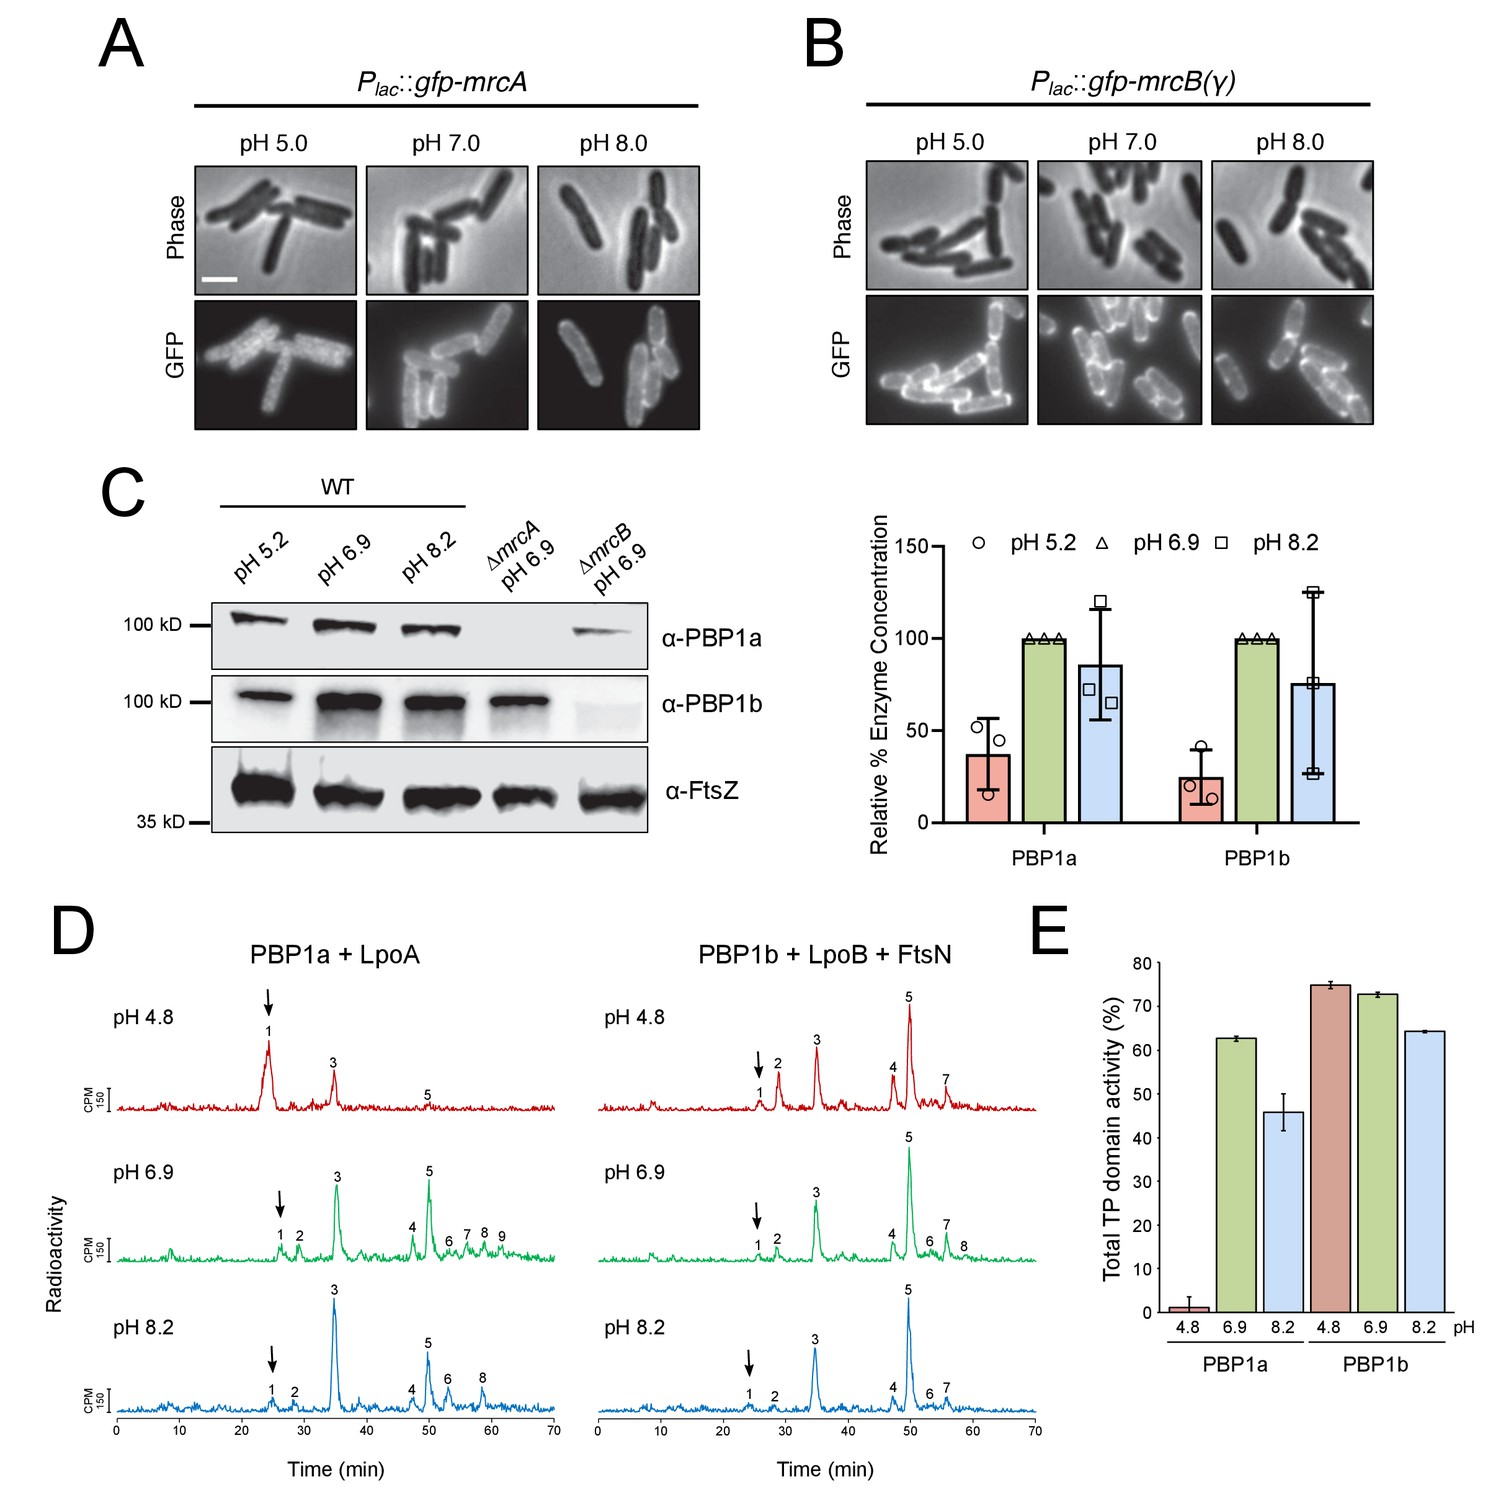
pH-dependence of aPBP localization, production and activity.
(A, B) Representative micrographs illustrating aPBP localization in strains expressing Plac::gfp-mrcA (EAM707) and Plac::gfp-mrcB (EAM718) grown in AB minimal media supplemented with 0.2% maltose and 250 μM IPTG at pH 5.0, 7.0 and 8.0. Scale bar indicates 2 μm. (C) Western blot depicting representative biological replicates of PBP1a, PBP1b, and FtsZ levels in wild-type cells (MG1655) cultured at pH 4.8, 6.9, and 8.2. Percent aPBP level (using FtsZ levels as an internal loading control and normalized to pH 6.9 values) across pH conditions is shown to the right. Ponceau staining for total protein levels can be viewed in Figure 5—figure supplement 1. (D) Representative HPLC chromatograms of muropeptide analysis. Peak 1 (black arrows), Penta-P (stems from remaining lipid II/glycan chain ends); peak 2; Tetra (GT and CPase product); peak 3, Penta (GTase product); peak 4, TetraTetra (GTase, TPase and CPase product); peak 5, TetraPenta (GTase and TPase product), peak 6, TetraTetraTetra (GTase, TPase and CPase product); peak 7, TetraTetraPenta (GTase and TPase product); peak 8, TetraTetraTetraTetra (GTase, TPase and CPase product). (E) Quantification of TPase domain activity (sum of TPase and CPase products) of PBP1A + LpoA and PBP1B + LpoB and FtsN at pH 4.8, 6.9 and 8.2. Data is the mean ± range of two replicates. Corresponding representative HPLC chromatograms are shown in D.
Figure 5—figure supplement 1
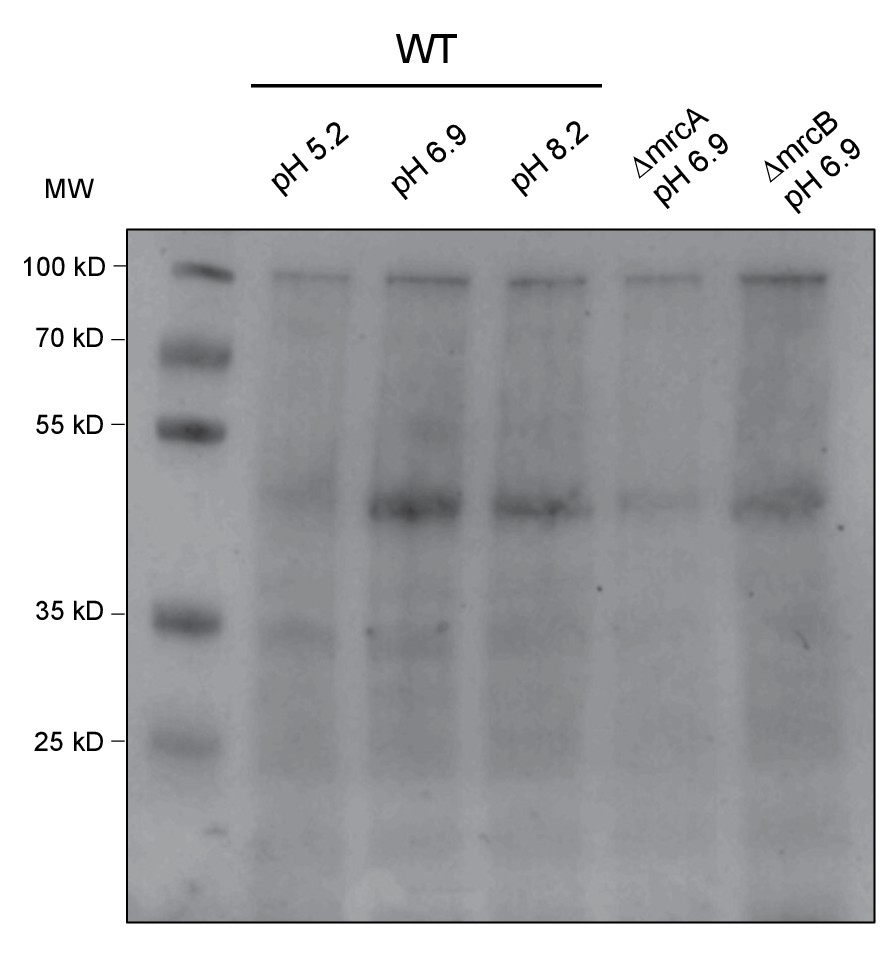
Total protein quantification of class A PBP Western Blot.
Corresponding Ponceau stain for blot shown in Figure 5C.
Figure 5—figure supplement 2
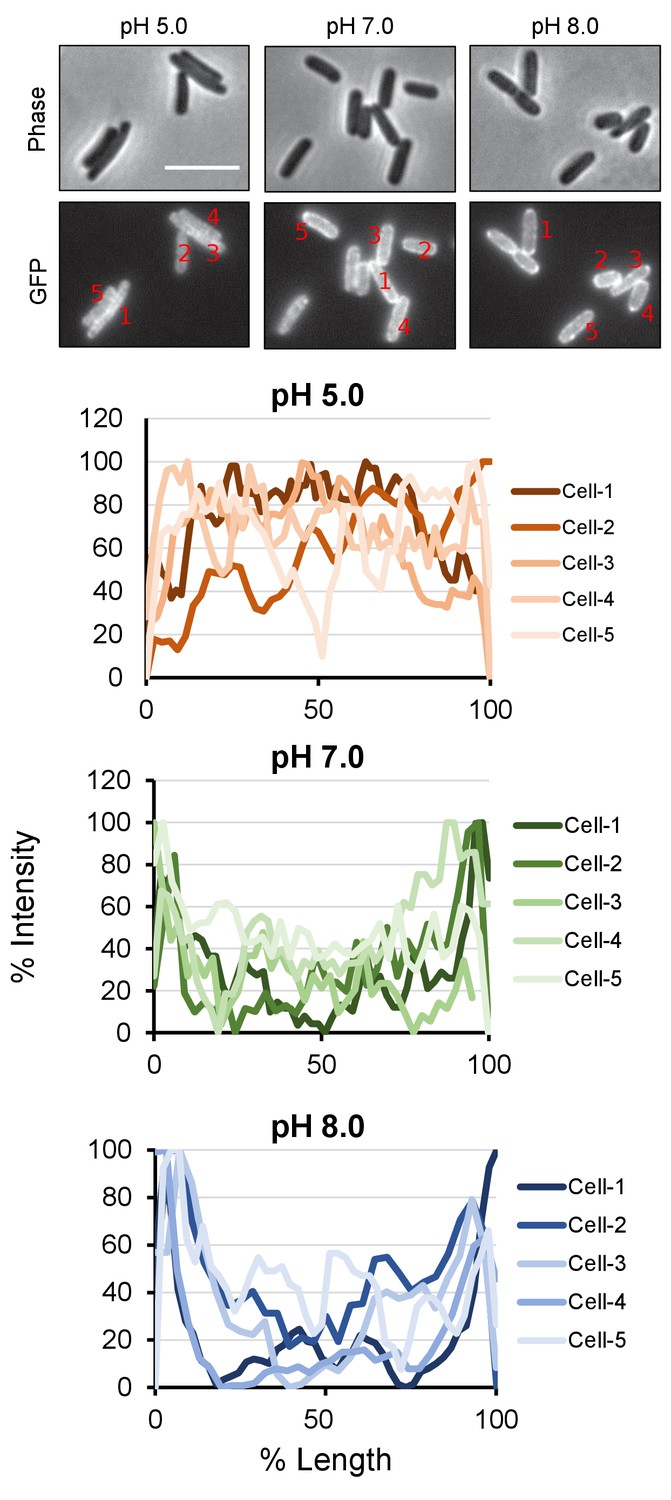
PBP1a peripheral localization across pH conditions.
Quantification of class A PBP localization at the cell periphery at pH 5.0, 7.0, and 8.0. For indicated representative cells, a line was drawn across the mid-cell from pole to pole and an intensity profile was generated in FIJI. Cell length and maximum fluorescence intensity were normalized to 100% for each cell.
Figure 5—figure supplement 3
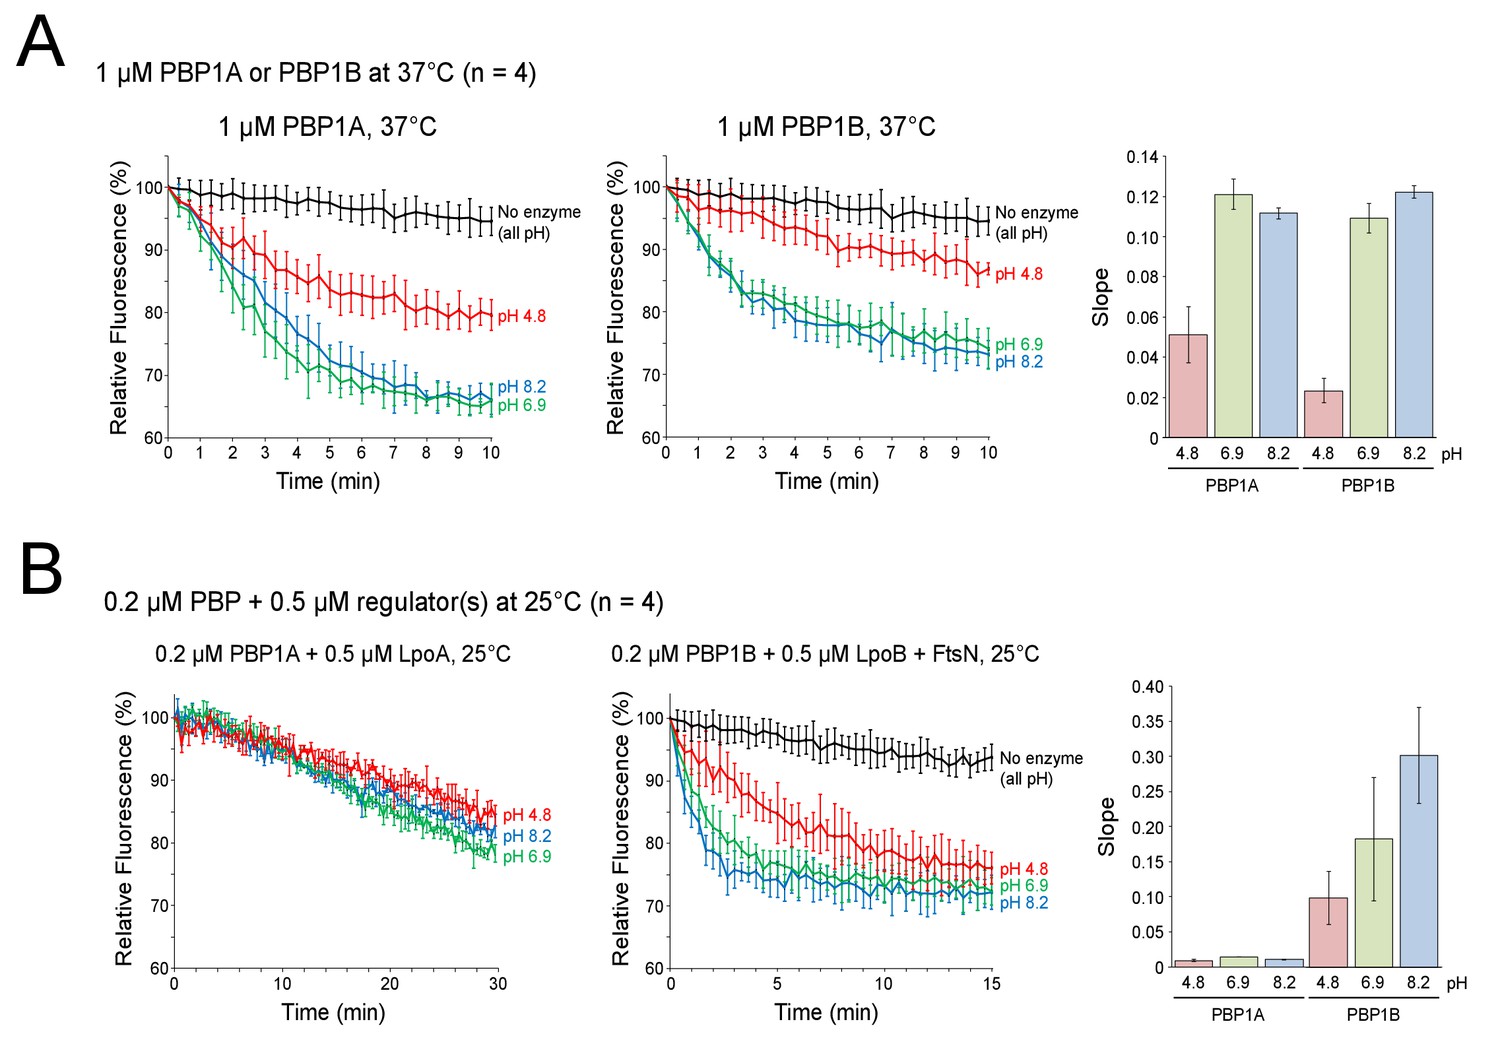
Influence of pH on class A PBP polymerization rate in continuous fluorescence glycosyltransferase assay.
Mean relative fluorescence (%), using the start-point as 100%, is plotted against time in minutes (min). The pH of each reaction is shown next to the corresponding curve in the same color, the control sample with no enzyme is shown in black. Polymerization of the fluorescently labelled lipid II causes a decrease in fluorescence signal. Thus, the slope of these plots (shown to the right) gives a relative measure of the GTase rate (n = 4). Data for enzyme alone (A) or in combination with indicated activators (B) is depicted as mean ± SD for both fluorescence time-point and slope measurements.
Figure 5—figure supplement 4
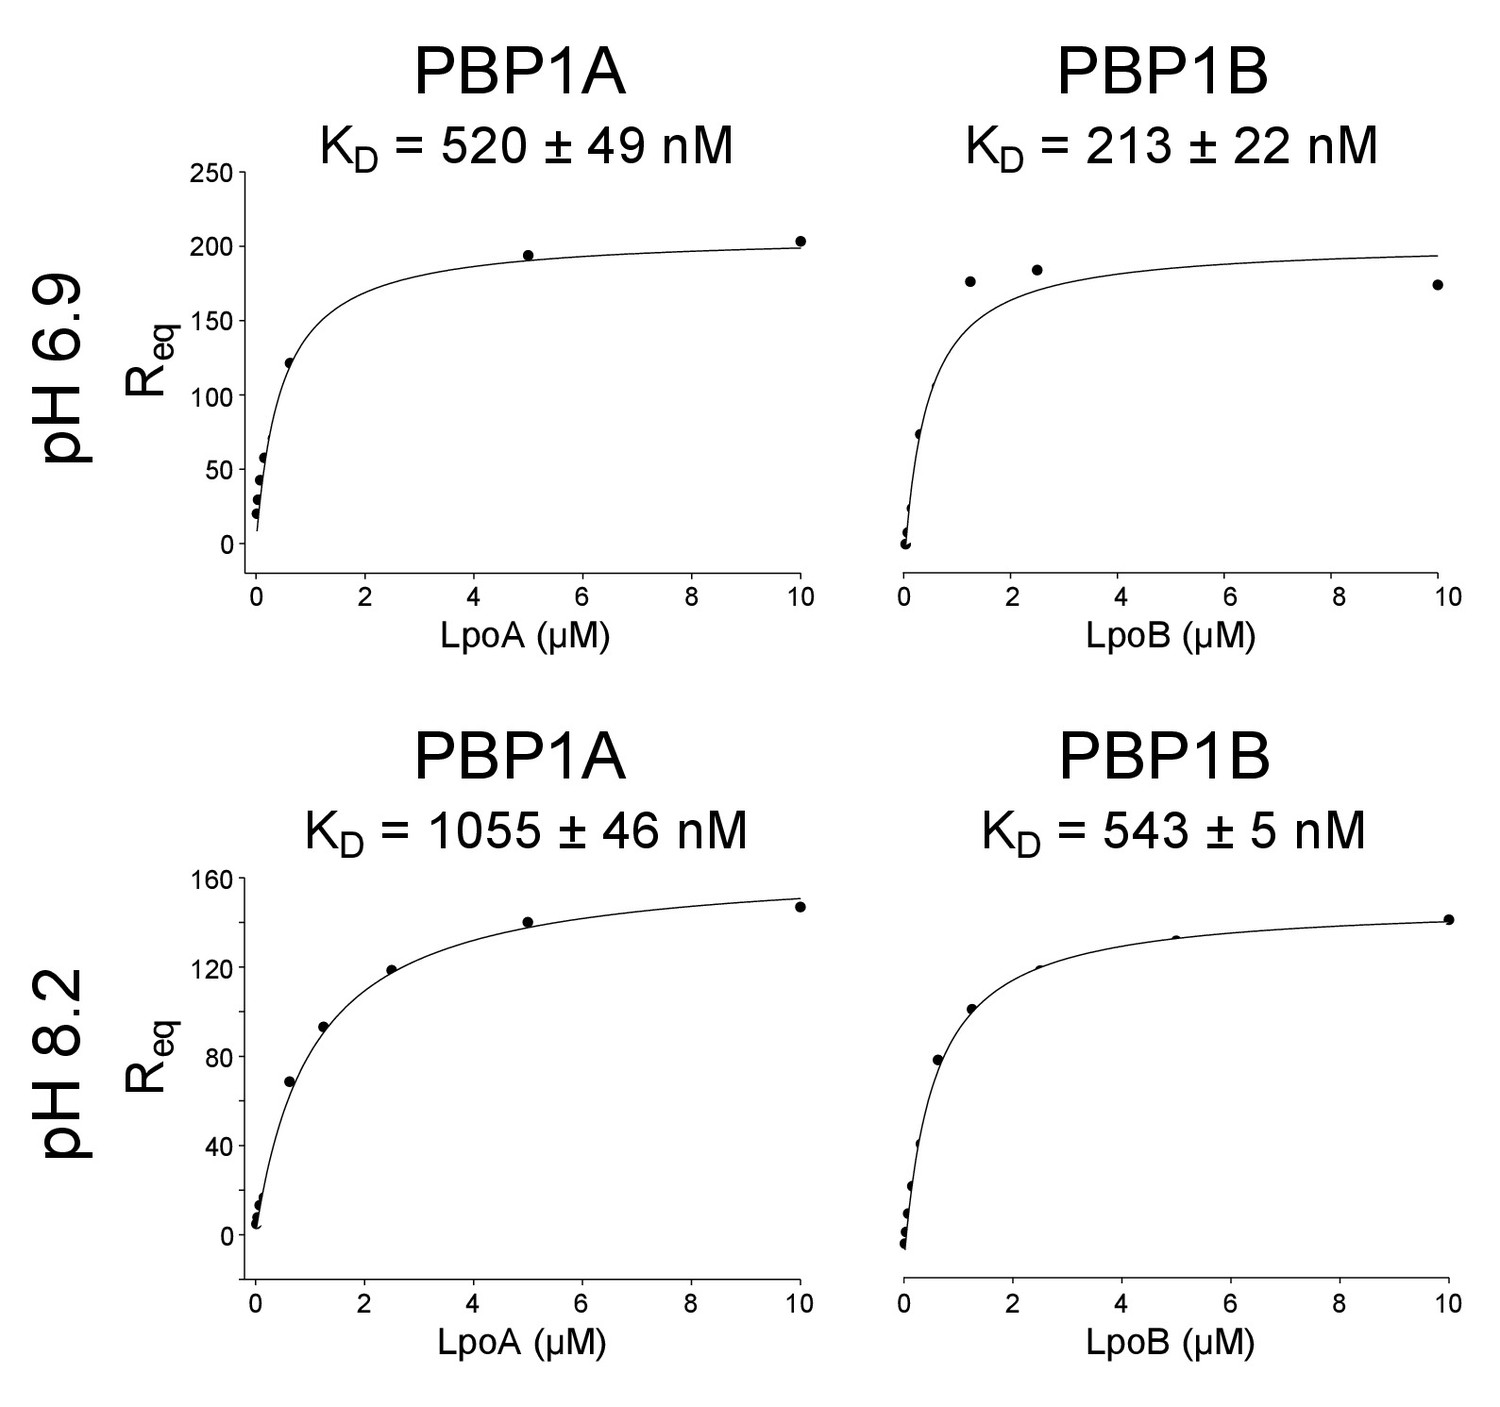
Influence of pH on PBP-lpo binding affinity.
Representative binding curves of PBP – Lpo interaction assays at pH 6.9 and 8.2 (indicated to the left). The concentration of Lpo protein injected is plotted against the response its specific binding elicited at equilibrium (Req). Non-linear regression assuming one-site saturation was used to calculate the dissociation constant, KD. The KD is the mean ± SD of three replicates.
Figure 6 with 4 supplements
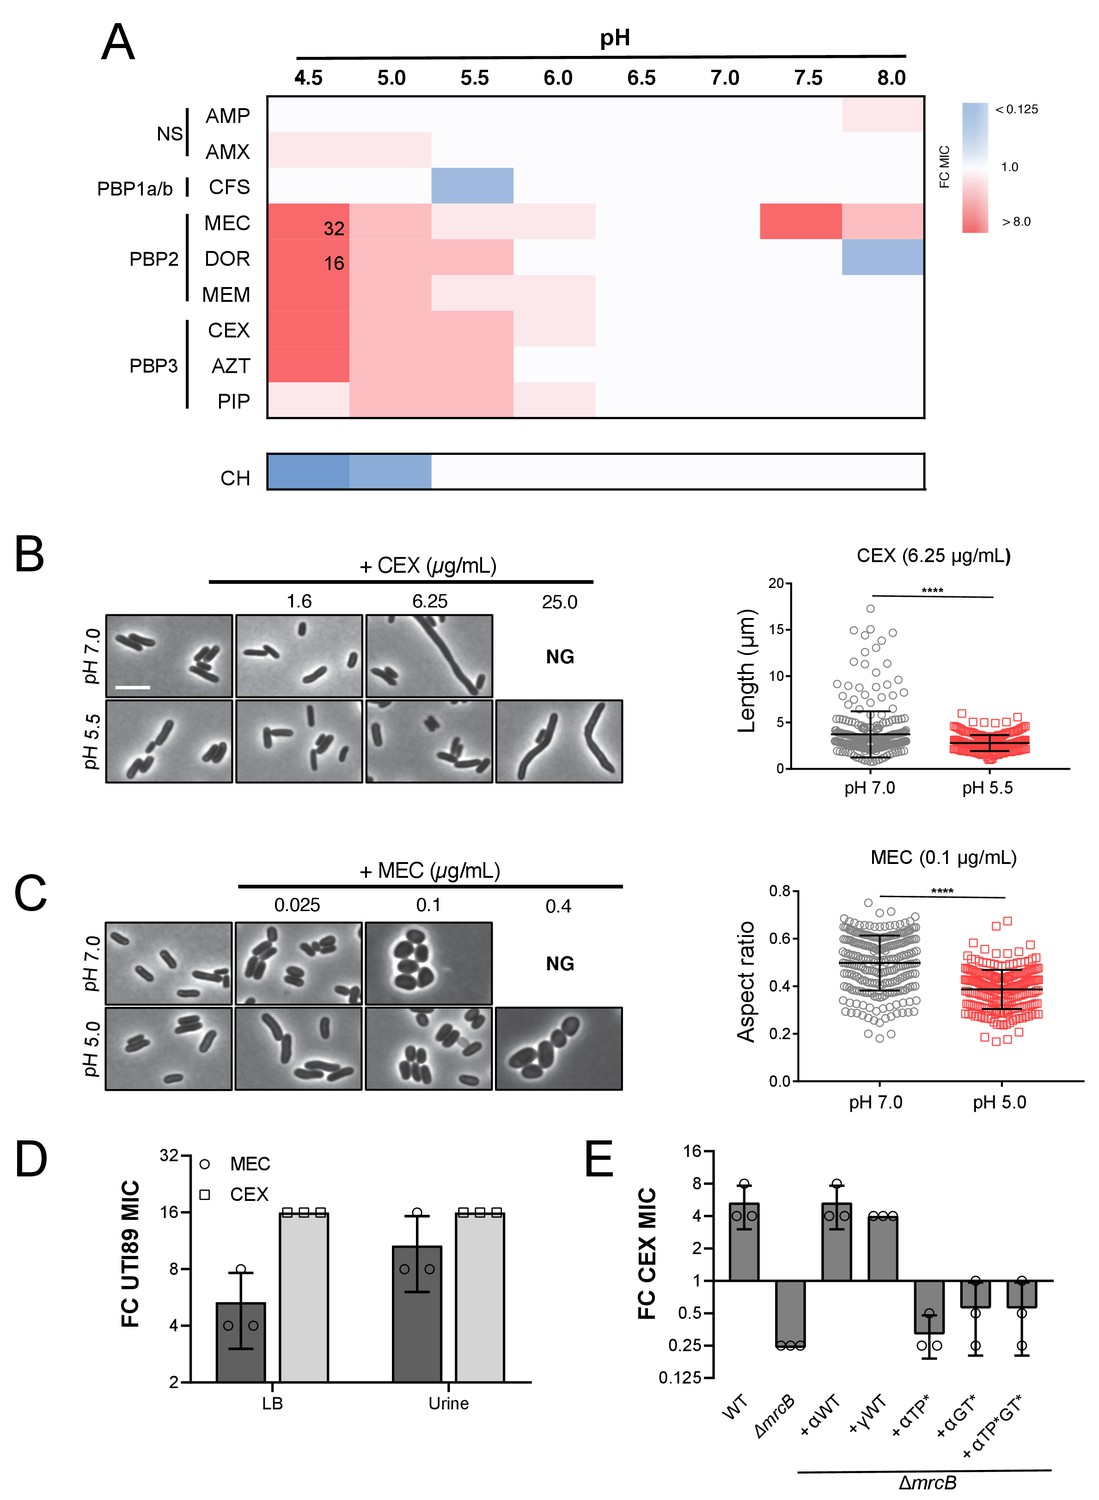
Intrinsic resistance to PBP2 and PBP3-targeting β-lactams at low pH.
(A) Heat map summarizing fold change in minimum inhibitory concentrations (MIC) of antibiotics for strain MG1655 cultured in LB (pH 4.5–8.0) after 20 hr. Cells in heat map are colored based on median fold change (FC) in MIC at indicated pH compared to pH 7.0 from at least three biological replicates. Fold change values of >8 are indicated in black inside relevant cell. Untransformed median MIC values can be viewed in Supplementary file 4. Abbreviations for antibiotic names are as follows: AMP, ampicillin; AMX, amoxicillin; CFS, cefsulodin; MEC, mecillinam; DOR, doripenem; MEM, meropenem; CEX, cephalexin; AZT, aztreonam; PIP, piperacillin; CH, chloramphenicol. Predominant cellular PBP target is indicated to the left. (B) Representative micrographs of cells treated with PBP3 inhibitor cephalexin (CEX) at pH 7.0 and pH 5.5. Distribution of cell lengths at sub-MIC concentration at pH 7.0 and 5.5 (n = 303 and 250) are shown to the right. (B) Representative micrographs of cells treated with PBP2 inhibitor mecillinam (MEC) cultured at pH 7.0 or pH 5.0. Distribution of cell aspect ratios (width/length) at sub-MIC concentration at pH 7.0 and 5.0 (n = 250 and 250) are shown to the right. For both panels A and B, scale bar indicates 3 μm, and NG denotes ‘no growth’ observed at the indicated concentration of antibiotic. Error bars represent SD. Significance was assessed by a Kruskal-Wallis test with asterisks denoting significance as follows: ****, p<0.0001. (D) Fold change in minimum inhibitory concentration of E. coli strain UTI89 to cephalexin (CEX) and mecillinam (MEC) grown at pH 5.0 compared to pH 7.0 in broth culture and in urine. Untransformed MIC values can be viewed in Supplementary file 4. (E) Fold change in minimum inhibitory concentration to cephalexin (CEX) for indicated strains grown at pH 5.5 compared to pH 7.0. EAM696 (ΔmrcB) derivatives producing PBP1b variants were grown in the presence of 10 μM IPTG. Untransformed MIC values can be viewed in Supplementary file 5. Bars represent mean fold change in minimum inhibitory concentration ± SD across at least three biological replicates.
Figure 6—figure supplement 1
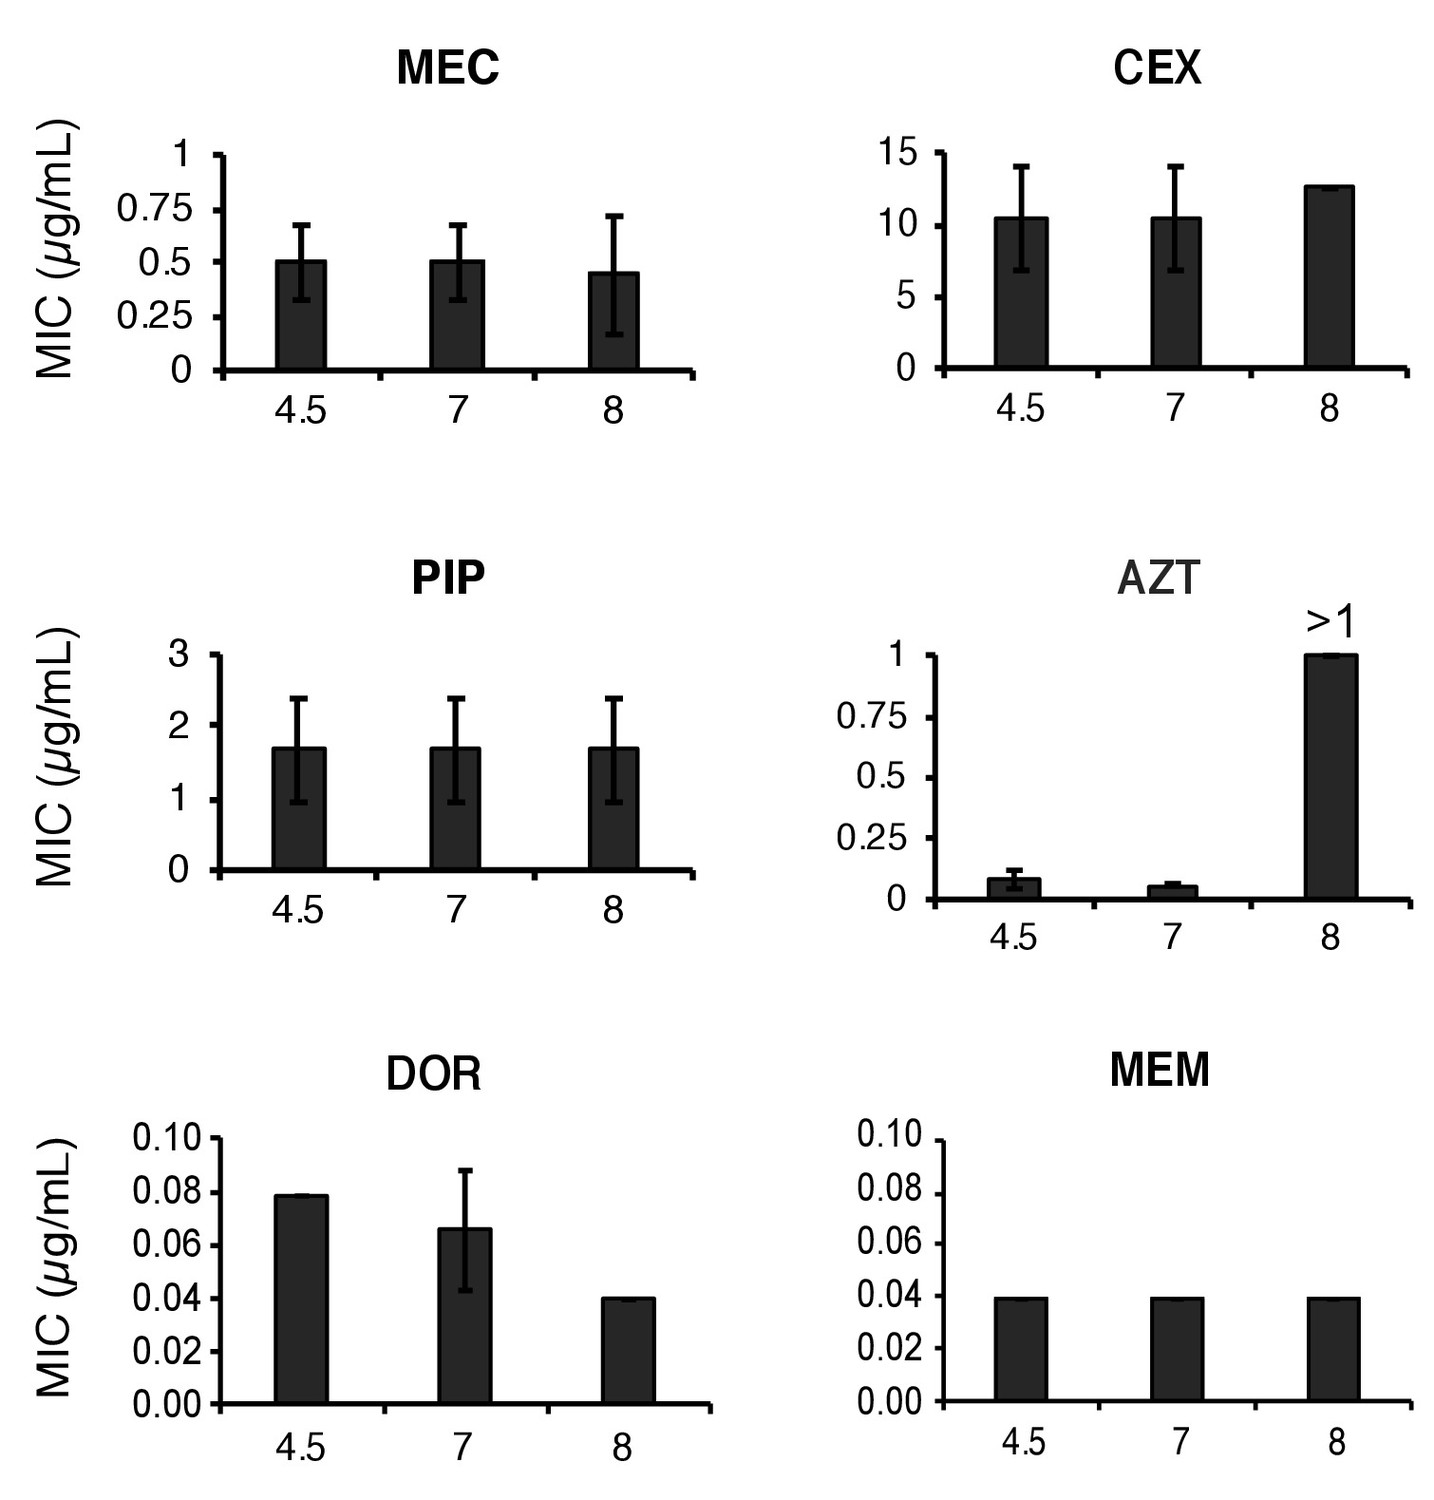
Stability of β-lactam antibiotics across pH values.
Mecillinam (MEC), cephalexin (CEX), piperacillin (PIP), aztreonam (AZT), doripenem (DOR) and meropenem (MEM) were incubated in LB media at pH 4.5, 7.0, or 8.0 for 20 hr then inoculated into microtiter dishes with MG1655 for determination of the minimum inhibitory concentration as previously described. Bars represent mean minimum inhibitory concentration ± SD from at least three independent biological replicates. AZT was the only antibiotic to exhibit instability and only at pH 8.0.
Figure 6—figure supplement 2
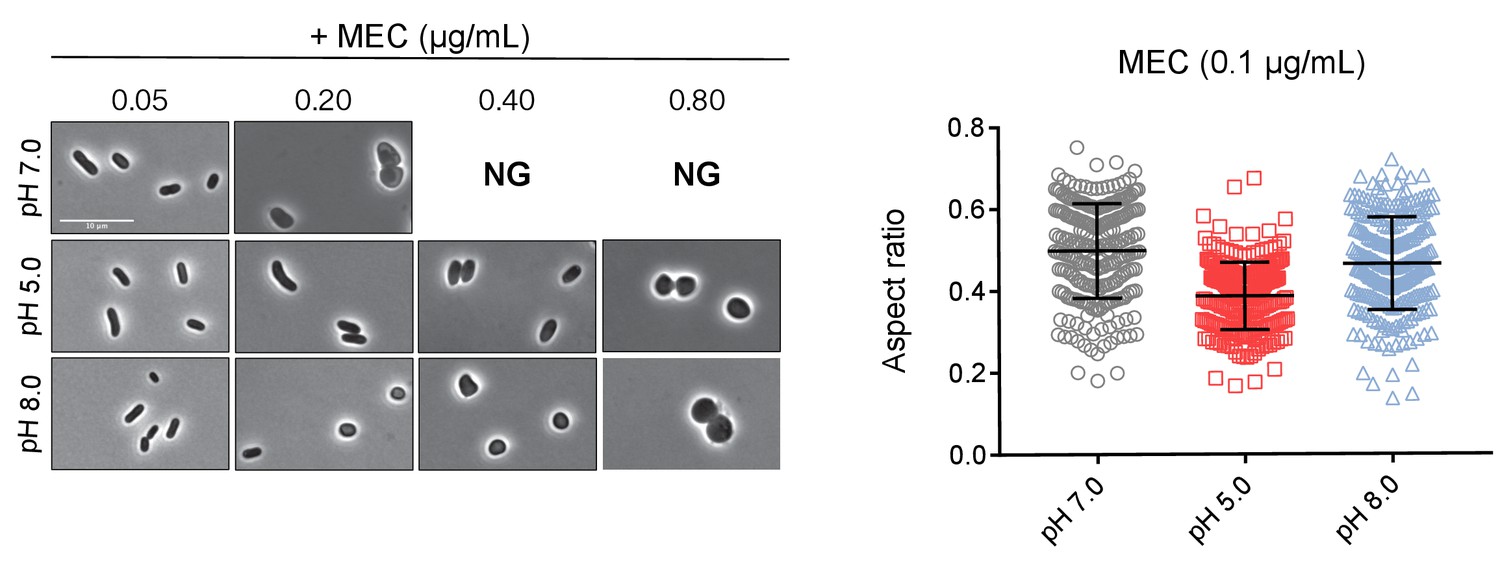
Mecillinam resistant cells at pH 8.0 remain rounded.
Representative micrographs and aspect ratio (width/length) quantification of cells treated with PBP2 inhibitor mecillinam for twenty hours at pH 5.0, 7.0, and 8.0 (n = 250 for each group). Error bars indicate SD, and scale bar represents 10 μm.
Figure 6—figure supplement 3
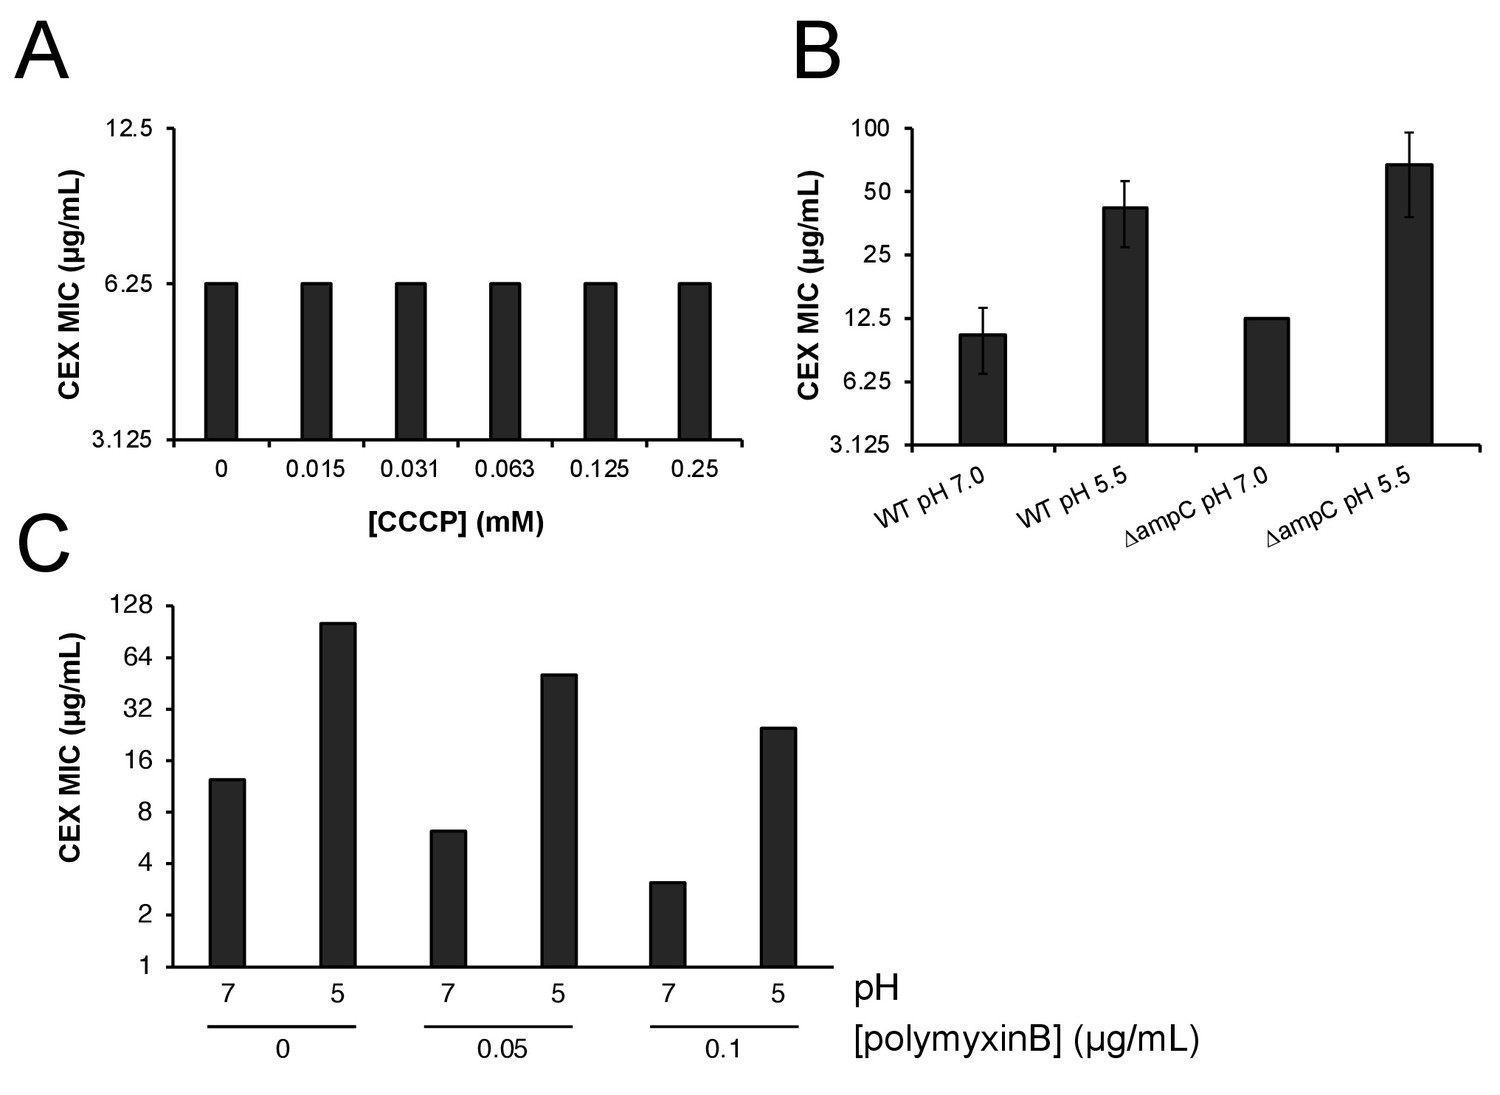
Proton motive force, AmpC β-lactamase, and outer membrane permeability do not confer pH-dependent resistance to cephalexin.
(A) Minimum inhibitory concentration of cephalexin at pH 7.0 in the presence of various concentrations of proton motive force inhibitor carbonyl cyanide-m-chlorophenylhydrazone (CCCP). (B) Comparison of the minimum inhibitory concentration of cephalexin at pH 7.0 and pH 5.5 between wild type (MG1655) and ΔampC (EAM749) cells. Markers denote mean minimum inhibitory concentration ± SD deviation from three biological replicates. (C) Comparison of the minimum inhibitory concentration of cephalexin at pH 7.0 and pH 5.0 in wild type (MG1655) in the presence or absence of sub-growth inhibitory concentrations of pore-forming antibiotic polymyxin B.
Figure 6—figure supplement 4
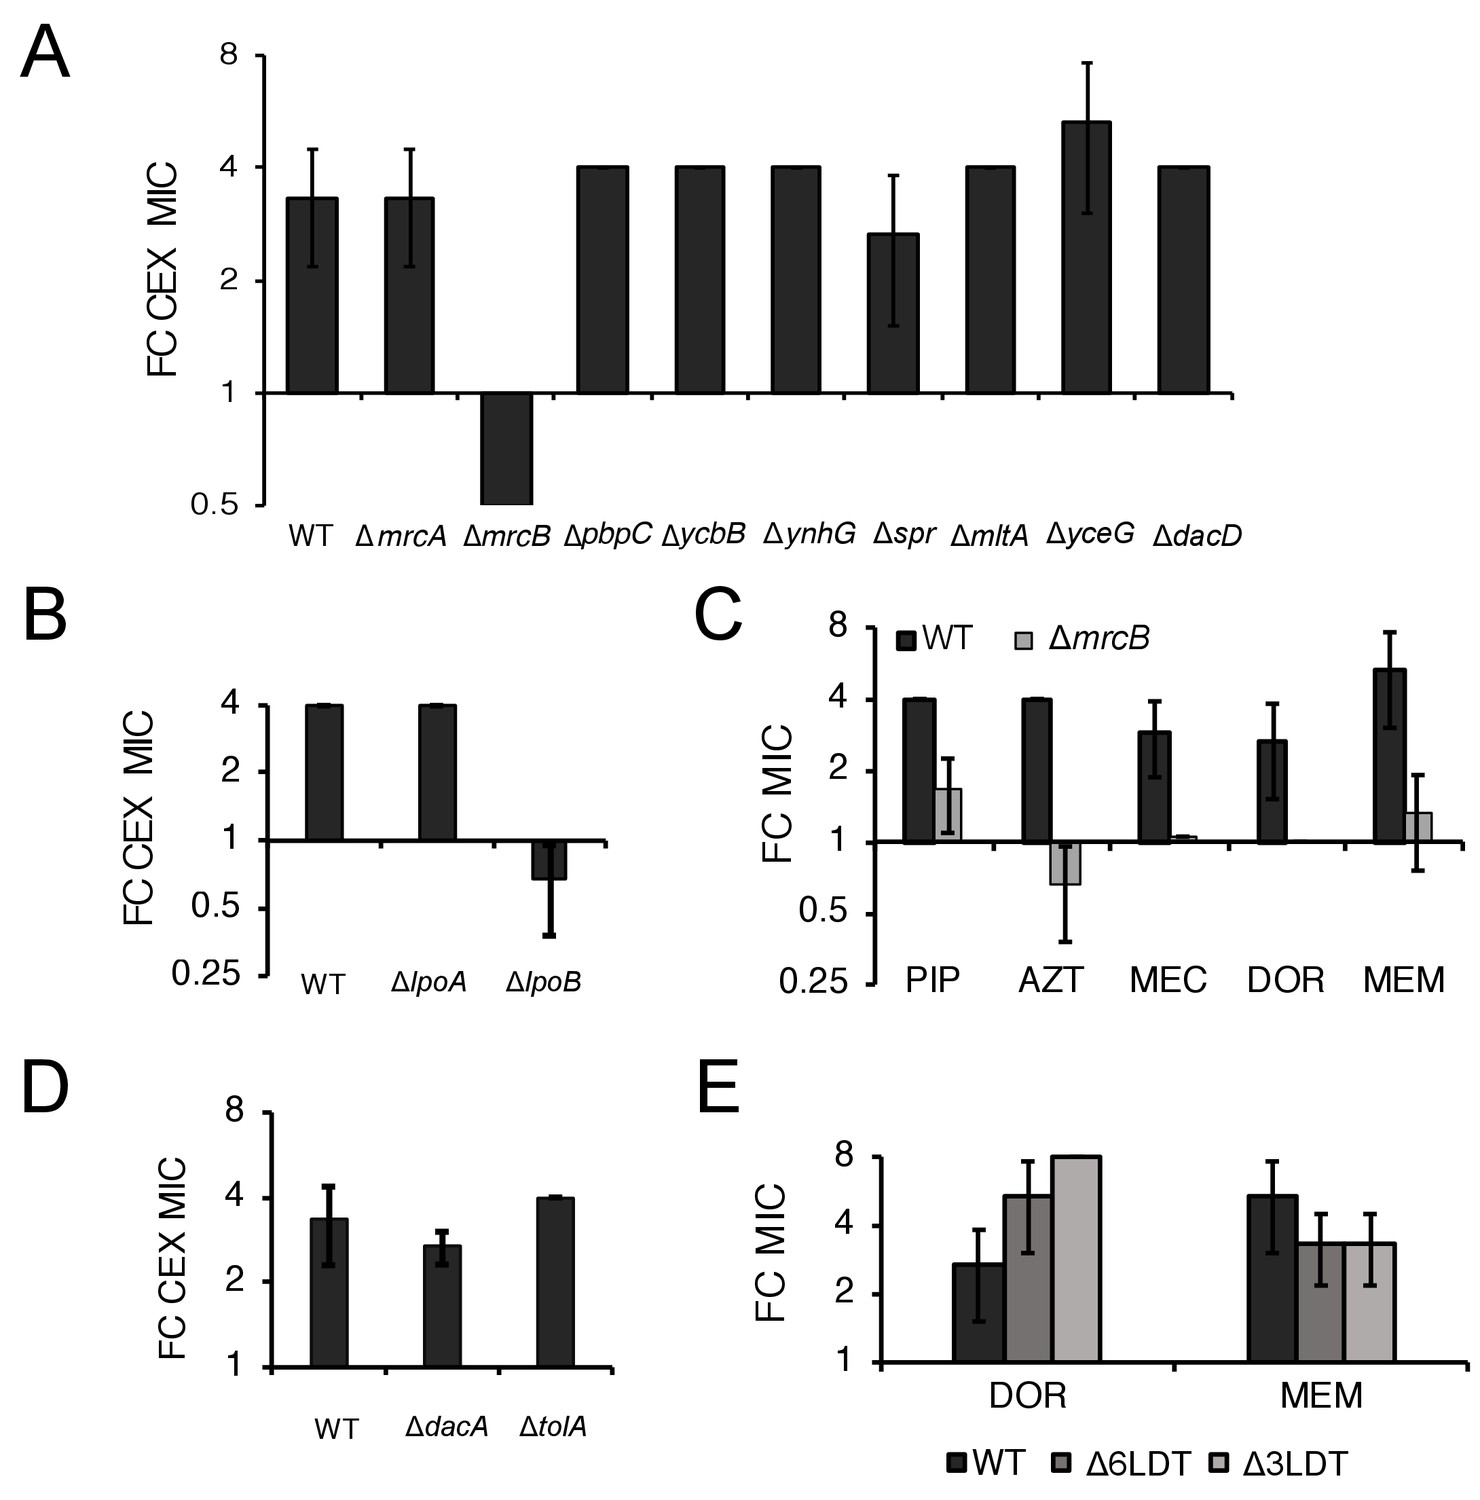
ΔmrcB abolishes low pH-dependent resistance independent of growth rate and β-lactam sensitivity.
Comparison in the fold change in cephalexin (CEX) minimum inhibitory concentration of mutants in genes encoding nonessential transpeptidases and pH specialist autolysins (A) or lipoprotein activators (B) at pH 5.5 compared to pH 7.0. (C) Comparison of the fold change in minimum inhibitory concentration of piperacillin (PIP), aztreonam (AZT), mecillinam (MEC), doripenem (DOR), and meropenem (MEM) for wild type and ΔmrcB mutant cells at pH 5.0 compared to pH 7.0. (D) Comparison of the fold change in minimum inhibitory concentration of cephalexin (CEX) across wild type, ΔdacA, and ΔtolA cells at pH 5.5 compared to pH 7.0. (E) Comparison of the fold change in minimum inhibitory concentration of doripenem (DOR) and meropenem (MEM) in cells lacking three (EAM1152) or six LD-transpeptidases (BW25113∆6LDT) at pH 5.0 compared to pH 7.0. In all panels, bars represent mean minimum inhibitory concentration ± SD across three independent biological replicates.
Author response image 1
Tables
Key resources table
| Reagent type (species) or resource | Designation | Source or reference | Identifiers | Additional information |
|---|---|---|---|---|
| Gene (Escherichia coli) | mrcB | NA | EcoCyc:EG10605 | |
| Gene (E. coli) | mrcA | NA | EcoCyc:EG10748 | |
| Gene (E. coli) | lpoA | NA | EcoCyc:G7642 | |
| Gene (E. coli) | lpoB | NA | EcoCyc:G6565 | |
| Strain, strain background (E. coli) | MG1655; wild-type | PMID:6271456 | ||
| Strain, strain background (E. coli) | UTI89 | PMID:11402001 | ||
| Antibody | anti-PBP1a | Gift of Waldemar Vollmer | (1:5000) | |
| Antibody | anti-PBP1b | Gift of Waldemar Vollmer | (1:1000) | |
| Antibody | anti-FtsZ | Gift of David Weiss | (1:5000) | |
| Recombinant DNA reagent | mrcB::kan; ∆mrcB | PMID:16738554; Coli Genetic Stock Center | CGSC:JW0145-1 | |
| Recombinant DNA reagent | mrcA::kan; ∆mrcA | PMID:16738554; Coli Genetic Stock Center | CGSC:JW3359-1 | |
| Recombinant DNA reagent | lpoA::kan; ∆lpoA | PMID:16738554; Coli Genetic Stock Center | CGSC:JW3116-1 | |
| Recombinant DNA reagent | lpoB::kan; ∆lpoB | PMID:16738554; Coli Genetic Stock Center | CGSC:JW5157-1 | |
| Recombinant DNA reagent | pCP20 | PMID:10829079 | ||
| Recombinant DNA reagent | pUM1Bα | PMID:12949085 | ||
| Recombinant DNA reagent | pUM1Bγ | PMID:12949085 | ||
| Recombinant DNA reagent | pUM1Bα* | PMID:12949085 | ||
| Recombinant DNA reagent | pUM1BTG*α | PMID:12949085 | ||
| Recombinant DNA reagent | pUM1BTG*α* | PMID:12949085 | ||
| Chemical compound, drug | Ampicillin Sodium Salt | Sigma Aldrich | Catalog:A9518 | |
| Chemical compound, drug | Amoxicillin | Sigma Aldrich | Catalog:A8523 | |
| Chemical compound, drug | Cefsulodin Sodium Salt Hydrate | Sigma Aldrich | Catalog:C8145 | |
| Chemical compound, drug | Mecillinam | Sigma Aldrich | Catalog:33447 | |
| Chemical compound, drug | Doripenem Hydrate | Sigma Aldrich | Catalog:SML1220 | |
| Chemical compound, drug | Meropenem Hydrate | Sigma Aldrich | Catalog:M2574 | |
| Chemical compound, drug | Cephalexin | Sigma Aldrich | Catalog:33989 | |
| Chemical compound, drug | Aztreonam | Sigma Aldrich | Catalog:A6848 | |
| Chemical compound, drug | Piperacillin Sodium Salt | Sigma Aldrich | Catalog:P8396 | |
| Software, algorithm | SuperSegger | PMID:27569113 | ||
| Software, algorithm | FIJI | PMID:22743772 | ||
| Other | Propidium iodide | Sigma Aldrich | Catalog:81845 |
Additional files
-
Supplementary file 1
Bacterial strains used in this study.
- https://doi.org/10.7554/eLife.40754.027
-
Supplementary file 2
Plasmids used in this study.
- https://doi.org/10.7554/eLife.40754.028
-
Supplementary file 3
Summary of growth rate screen.
Supports Figure 1. Presents mean mass doubling time ± standard deviation of each cell wall mutant at pH 4.8, 6.9, and 8.2 during preliminary screen (n = 3).
- https://doi.org/10.7554/eLife.40754.029
-
Supplementary file 4
β-lactam sensitivity of MG1655 across pH conditions.
Supports Figure 6A. Presents median minimum inhibitory concentrations of indicated β-lactam antibiotics to MG1655 across pH conditions of at least three biological replicates. Values are represented as μg/mL.
- https://doi.org/10.7554/eLife.40754.030
-
Supplementary file 5
β-lactam sensitivity of UTI89 across pH conditions.
Supports Figure 6D. Presents median minimum inhibitory concentrations of cephalexin (CEX) and mecillinam (MEC) to UTI89 across pH conditions in LB and in urine (n = 3). Values are represented as μg/mL.
- https://doi.org/10.7554/eLife.40754.031
-
Supplementary file 6
Susceptibility of strains producing PBP1b variants to cephalexin across pH conditions.
Supports Figure 6E. Presents median minimum inhibitory concentrations of cephalexin to MG1655 and PBP1b derivatives across pH conditions (n = 3). Values are represented as μg/mL.
- https://doi.org/10.7554/eLife.40754.032
-
Supplementary file 7
Representative script used to analyze bacterial growth rate datasets.
Supports Figure 1 and Figure 1—figure supplement 1. This sample script uses source data from Figure 1—source data 2.
- https://doi.org/10.7554/eLife.40754.033
-
Transparent reporting form
- https://doi.org/10.7554/eLife.40754.034
Download links
A two-part list of links to download the article, or parts of the article, in various formats.
Downloads (link to download the article as PDF)
Open citations (links to open the citations from this article in various online reference manager services)
Cite this article (links to download the citations from this article in formats compatible with various reference manager tools)
Plasticity of Escherichia coli cell wall metabolism promotes fitness and antibiotic resistance across environmental conditions
eLife 8:e40754.
https://doi.org/10.7554/eLife.40754


