Region-specific myelin differences define behavioral consequences of chronic social defeat stress in mice
- City University, United States
- Icahn School of Medicine, United States
- Virginia Commonwealth University, United States
Figures
Figure 1
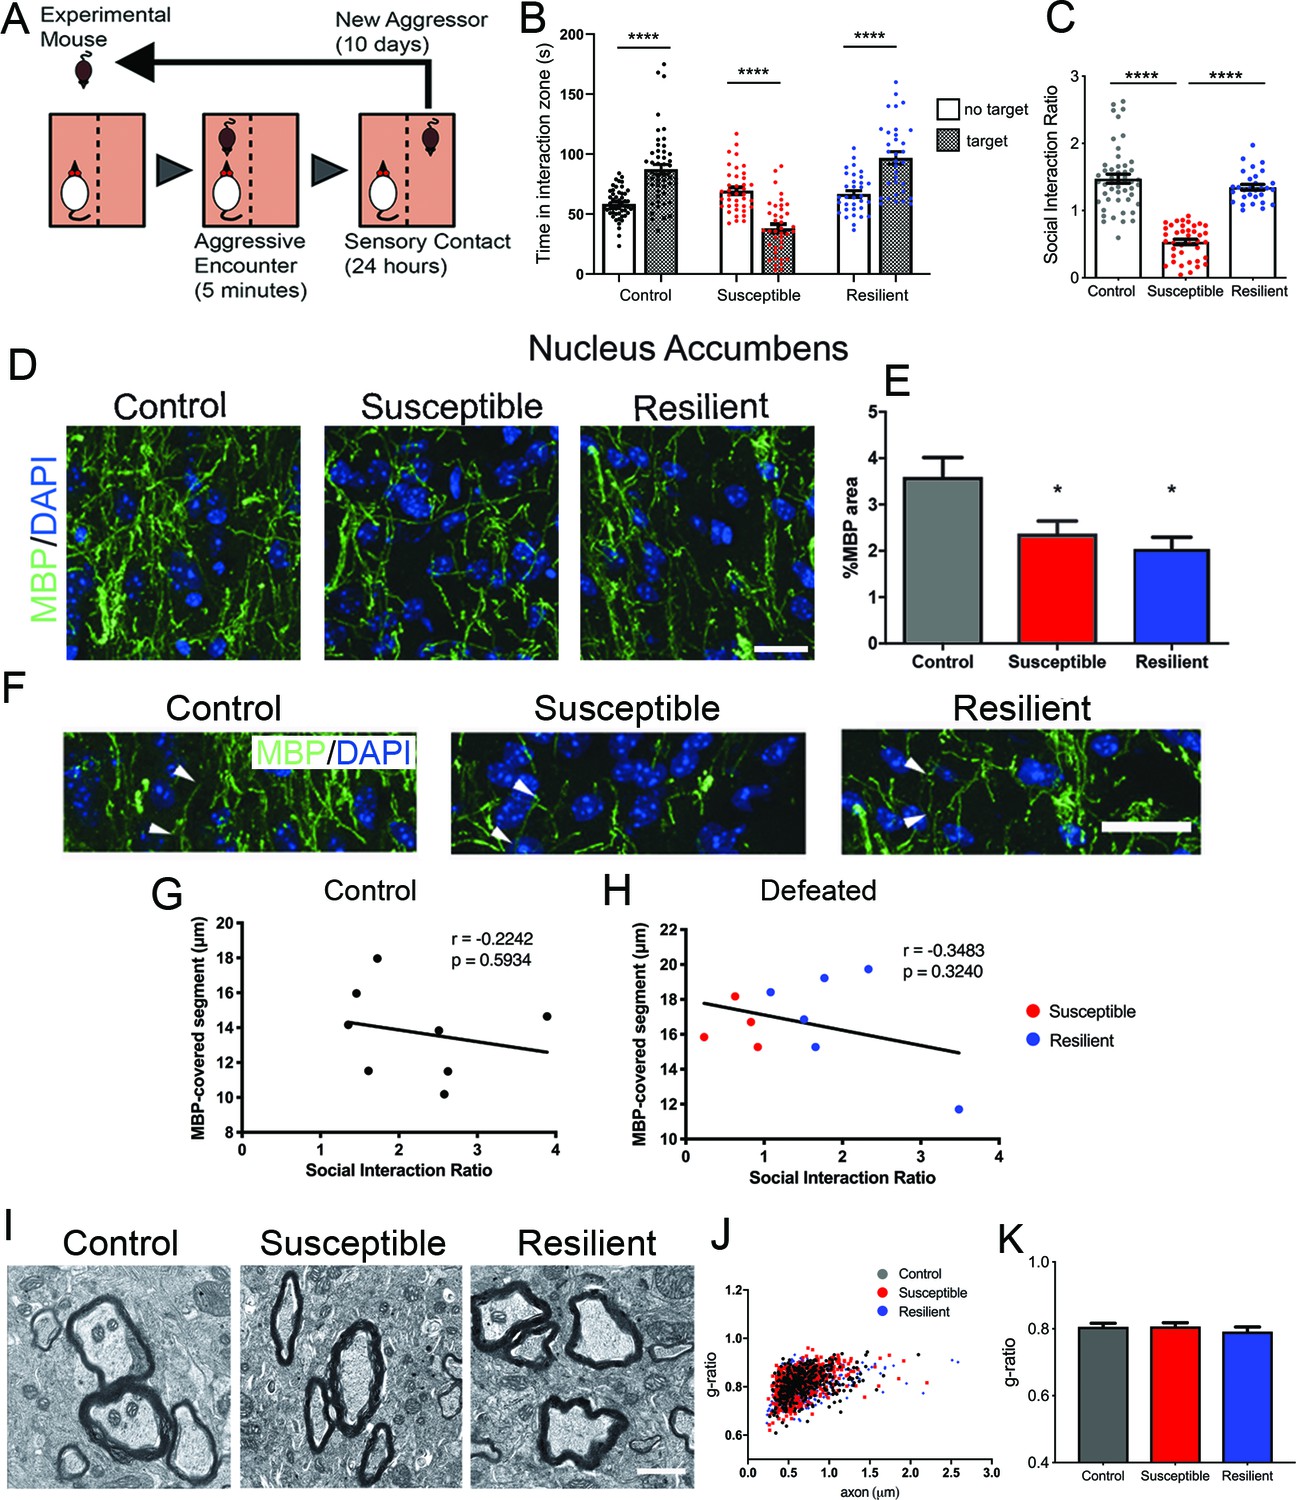
Effect of aggressive social encounters on myelination in the nucleus accumbens (NAc) of mice which showed two behaviorally distinct phenotypes following chronic social defeat stress (CSDS).
(A) The experimental paradigm for CSDS. (B–C) Mice susceptible to CSDS spent less time interacting with a conspecific mouse than the control group or resilient mice, as shown in (B) total time spent in the interaction zone when there is a conspecific mouse present and in (C) social interaction ratio defined by time spent in the interaction zone when a conspecific mouse present divided by a conspecific mouse absent. Control, n = 52; susceptible, n = 39; resilient, n = 33; ****, p<0.0001 by one-way ANOVA followed by Tukey’s post hoc test. (D–E) Representative confocal images and quantifications showing immunohistochemistry of myelin basic protein (MBP) counterstained with DAPI. Scale bar = 28 μm. n = 3 mice per group, two 20x images per animal; susceptible vs. control, p=0.0447; resilient vs. control, p=0.0109 by one-way ANOVA followed by Tukey’s post hoc test. (F) Representative confocal images showing MBP-covered myelinated segments. Arrowheads point to one MBP-covered myelinated segment. Scale car = 19 μm. (G–H) Pearson correlation coefficients showed non-significant correlation of MBP-covered segment length and social interaction ratio in control (G) or defeated (H) mice, control, 8 x-y pairs. r = −0.2242, p=0.5932. defeated, 10 x-y pairs, r = −0.3483, p=0.3240. control, n = 8 mice, susceptible, n = 4 mice, resilient, n = 6 mice, 1–2 20x images per mouse; (I) Representative electron microscopy images (scale bar = 1 μm) and (J–K) scatter plot and quantification of g-ratio; control, n = 5 mice; susceptible, n = 7 mice; resilient, n = 5 mice.
-
Figure 1—source data 1
Source data for social interaction behavior following chronic social defeat stress and myelin content in the nucleus accumbens.
- https://doi.org/10.7554/eLife.40855.004
Figure 2
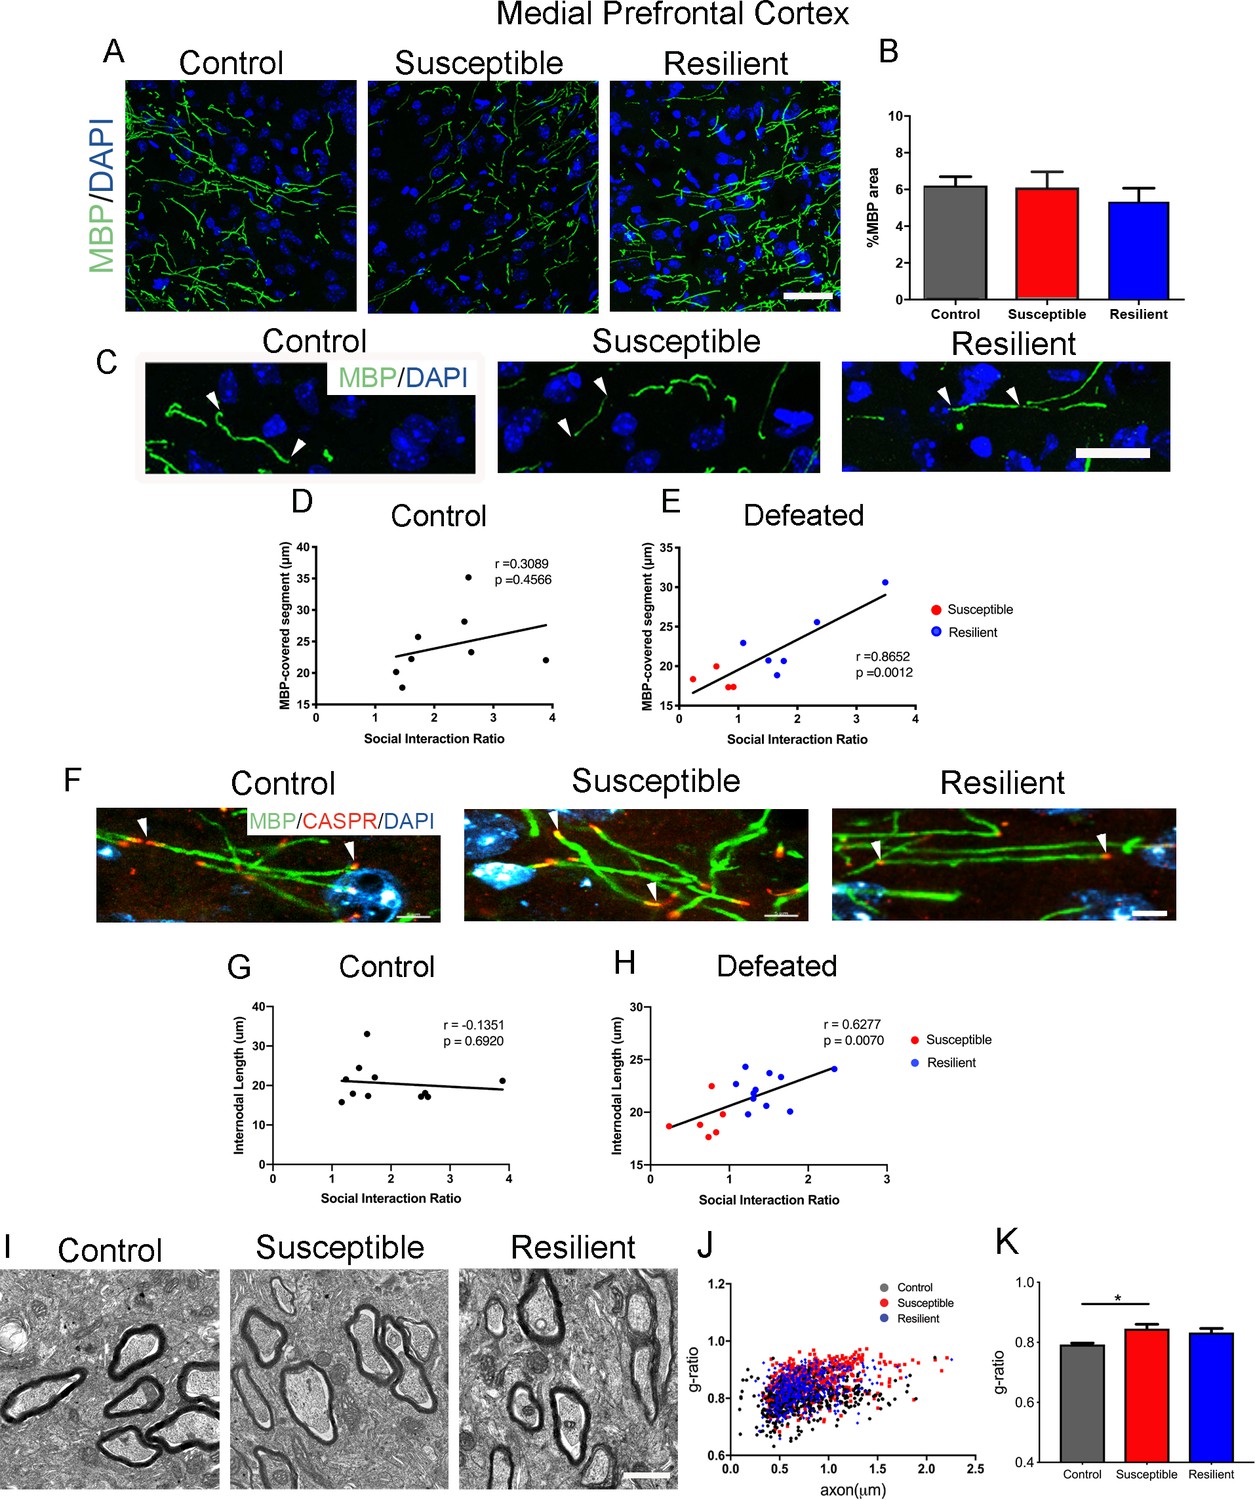
Myelination in the medial prefrontal cortex (mPFC) distinguished resilient from susceptible mice following stress.
(A–B) Representative confocal images and quantifications of myelin basic protein (MBP) counterstained with DAPI. Scale bar = 30 μm. n = 3 mice per group. Four 20x images taken per mouse (C) Representative confocal images showing MBP-covered myelinated segments. Arrowheads point to one continuous MBP-covered myelinated segment. Scale bar = 17 μm. (D–E) Pearson correlation coefficients showed significant correlation of MBP-covered segment length with social interaction ratio only in defeated (E) mice, but not in control (D), control, 8 x-y pairs, n = 8 mice, defeated 10 x-y pairs, susceptible, n = 4 mice, resilient, n = 6 mice, four 20x images were taken per mouse (F) Representative confocal images showing internodal segment marked by CASPR (Red) and MBP (Green). Arrowheads point to one internode. Scale bar = 5 μm. (G–H) Pearson correlation coefficients showed significant correlation of internodal length with social interaction ratio only in defeated (H) mice, but not in control (G), control, 11 x-y pairs, n = 11 mice, defeated 17 x-y pairs, susceptible, n = 6 mice, resilient, n = 11 mice, four-six 63x images taken per mouse. (I) Representative electron microscopy images, scale bar = 1 μm. (J–K) Scatter plot and quantification of g-ratio in the mPFC; control, n = 5 mice; susceptible, n = 7 mice; resilient, n = 5 mice; susceptible vs. control, p=0.0264 by one-way ANOVA followed by Tukey’s post hoc test.
-
Figure 2—source data 1
Source Data for myelin content in the medial prefrontal cortex in social defeat mice.
- https://doi.org/10.7554/eLife.40855.006
Figure 3
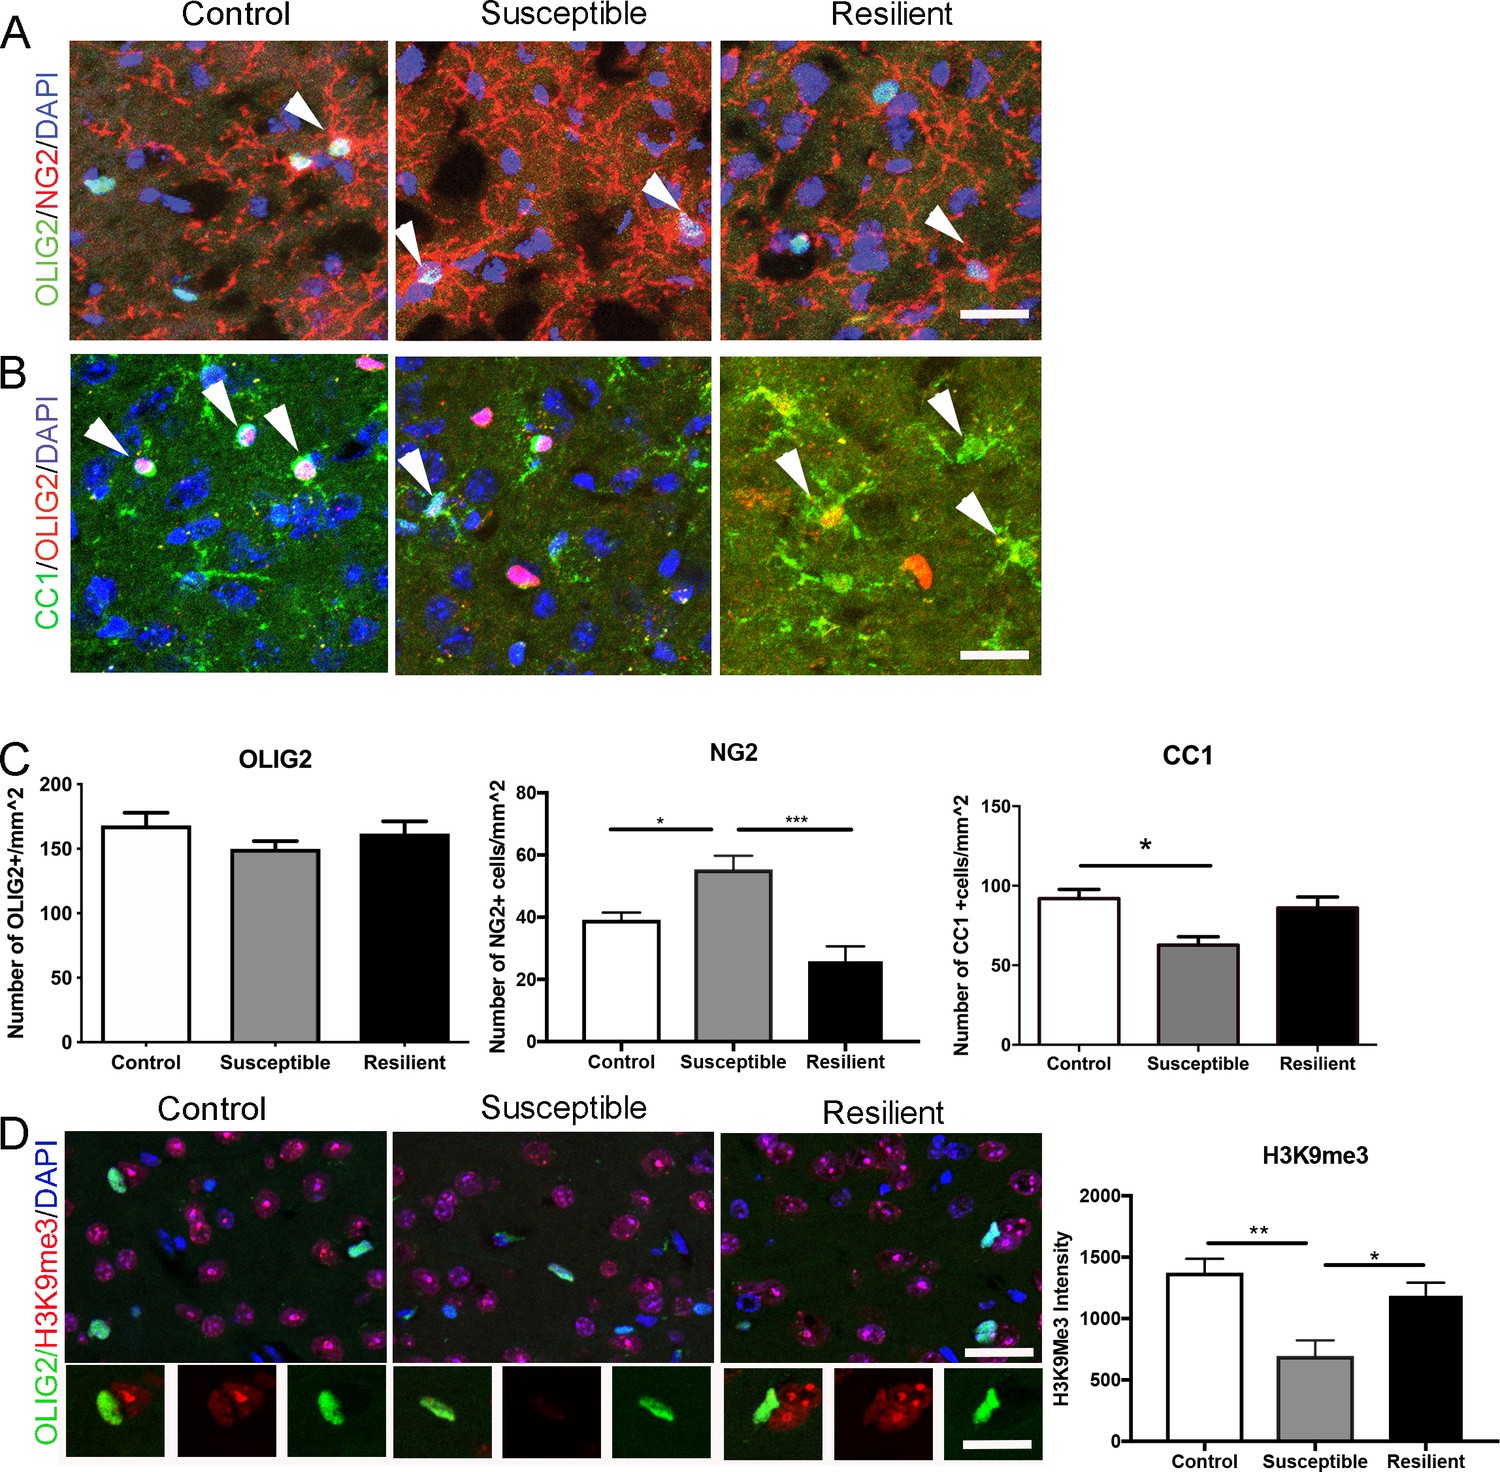
Impaired oligodendrocyte differentiation was associated with reduced repressive histone methylation marks in the mPFC of susceptible mice.
(A–B) Representative confocal images of cells positive for OLIG2, NG2, and CC1 in the mPFC. DAPI was used as counterstain of nuclei. Scale bar = 25 μm. (C) quantification of OLIG2+ (n = 3 mice per group and 3–4 20x images taken per mouse), NG2+ cells (n = 3 mice per group and four images taken per mouse, *p=0.019, ***p<0.0001 by one-way ANOVA followed by Tukey’s post hoc test) and CC1+ cells (control, n = 8 mice, susceptible, n = 3 mice, resilient n = 7 mice, 3–4 20x images taken per mouse; *p=0.0195 by one-way ANOVA followed by Tukey’s post hoc test). (D) Representative confocal images and quantifications (E) of mean intensity of repressive histone mark H3K9me3 (Red) in OLIG2+ (Green) cells. control, n = 3 mice, susceptible, n = 2 mice, resilient, n = 5 mice, 4 20x images taken per mouse, 50–100 OLIG2+ cells were counted per image **p=0.0038, *p=0.0234 by one-way ANOVA followed by Tukey’s post hoc test. Data are mean ± S.E.M. Scale bar = 20 μm.
-
Figure 3—source data 1
Source data for the number of oligodendrocyte lineage cells and intensity of a repressive histone mark, H3K9me3, in the medial prefrontal cortex.
- https://doi.org/10.7554/eLife.40855.008
Figure 4

Focal demyelination in the mPFC reduced social preference behavior.
(A) The experimental paradigm for lysolecithin (LPC) injection and behavioral testing. (B) Representative confocal images showing reduced MBP immunointensity at seven dpi followed by a spontaneous restoration at 21 dpi. (C) Mice received LPC displayed reduced social preference behavior at seven dpi as quantified by social interaction ratio. (D) Restoration of normal social interaction behavior at 21 dpi as quantified by social interaction ratio. Saline, n = 11 mice; LPC, n = 10 mice *, p<0.05 by unpaired t-test. Data are mean ± S.E.M. (E) Representative confocal images of immunohistochemistry of MBP (Green) and CASPR (Red) and scatter plots of internodal length at 21dpi. Counterstained with DAPI. Saline n = 3 mice, LPC, n = 5 mice. 2–4 63x images taken per mouse.
-
Figure 4—source data 1
Source data for social interaction behavior and internodal length following lysolecithin-induced focal demyelination.
- https://doi.org/10.7554/eLife.40855.010
Tables
Key resources table
| Reagent type (species) or resource | Designation | Source or reference | Identifiers | Additional information |
|---|---|---|---|---|
| M. musculus (C57Bl/6J) | mouse | Jackson Laboratory | RRID:IMSR_JAX:000664 | |
| M. musculus (CD-1) | mouse | Charles River | RRID:IMSR_CRL:22 | Retired breeder |
| Antibody | Mouse monoclonal anti-MBP | Covance | Cat # SMI99 RRID:AB_2564741 | IHC (1:500) |
| Antibody | Rabbit polyclonal anti-Caspr | Abcam | Cat# ab34151, RRID:AB_869934 | IHC (1:100) |
| Antibody | Mouse monoclonal anti-OLIG2 | Millipore | Cat# MABN50, RRID:AB_10807410 | IHC (1:200) |
| Antibody | Rabbit polyclonal anti-OLIG2 | Abcam | Cat# ab81093, RRID:AB_1640746 | IHC (1:200) |
| Antibody | Rabbit anti-H3K9me3 | Abcam | Cat# ab8898, RRID:AB_306848 | IHC (1:100) |
| Antibody | Rabbit polyclonal anti-NG2 | Millipore | Cat# AB5320, RRID:AB_91789 | IHC (1:200) |
| Antibody | Mouse monoclonal anti-APC | EMDMillipore | Cat# OP80, RRID:AB_2057371 | IHC (1:100) |
| chemical compound, drug | DAPI | Thermofisher | Cat# D1306, RRID:AB_2629482 | IHC (1:10000) |
| chemical compound, drug | l-α-lysophosphatidylcholine | Sigma-Aldrich | Cat# L4129 | |
| software, algorithm | ImageJ | RRID:SCR_003070 | ||
| software, algorithm | Ethovision XT | Noldus | RRID:SCR_000441 | |
| software, algorithm | Graphpad Prism 8 | RRID:SCR_002798 |
Additional files
-
Transparent reporting form
- https://doi.org/10.7554/eLife.40855.011
Download links
A two-part list of links to download the article, or parts of the article, in various formats.
Downloads (link to download the article as PDF)
Open citations (links to open the citations from this article in various online reference manager services)
Cite this article (links to download the citations from this article in formats compatible with various reference manager tools)
Region-specific myelin differences define behavioral consequences of chronic social defeat stress in mice
eLife 8:e40855.
https://doi.org/10.7554/eLife.40855


