Bid maintains mitochondrial cristae structure and function and protects against cardiac disease in an integrative genomics study
- Clinton C Bertram

- Aurelia Vergeade
- Daniel S Lark
- Qiong Shi
- Marlene L Heberling
- Niki L Fortune
- G Donald Okoye
- Quinn S Wells
- Josh Fessel
- Heidi Chen
- Olivier Boutaud
- Eric R Gamazon
- Sandra S Zinkel
- Vanderbilt University, United States
- Vanderbilt University Medical Center, United States
- University of Cambridge, United Kingdom
Figures
Figure 1
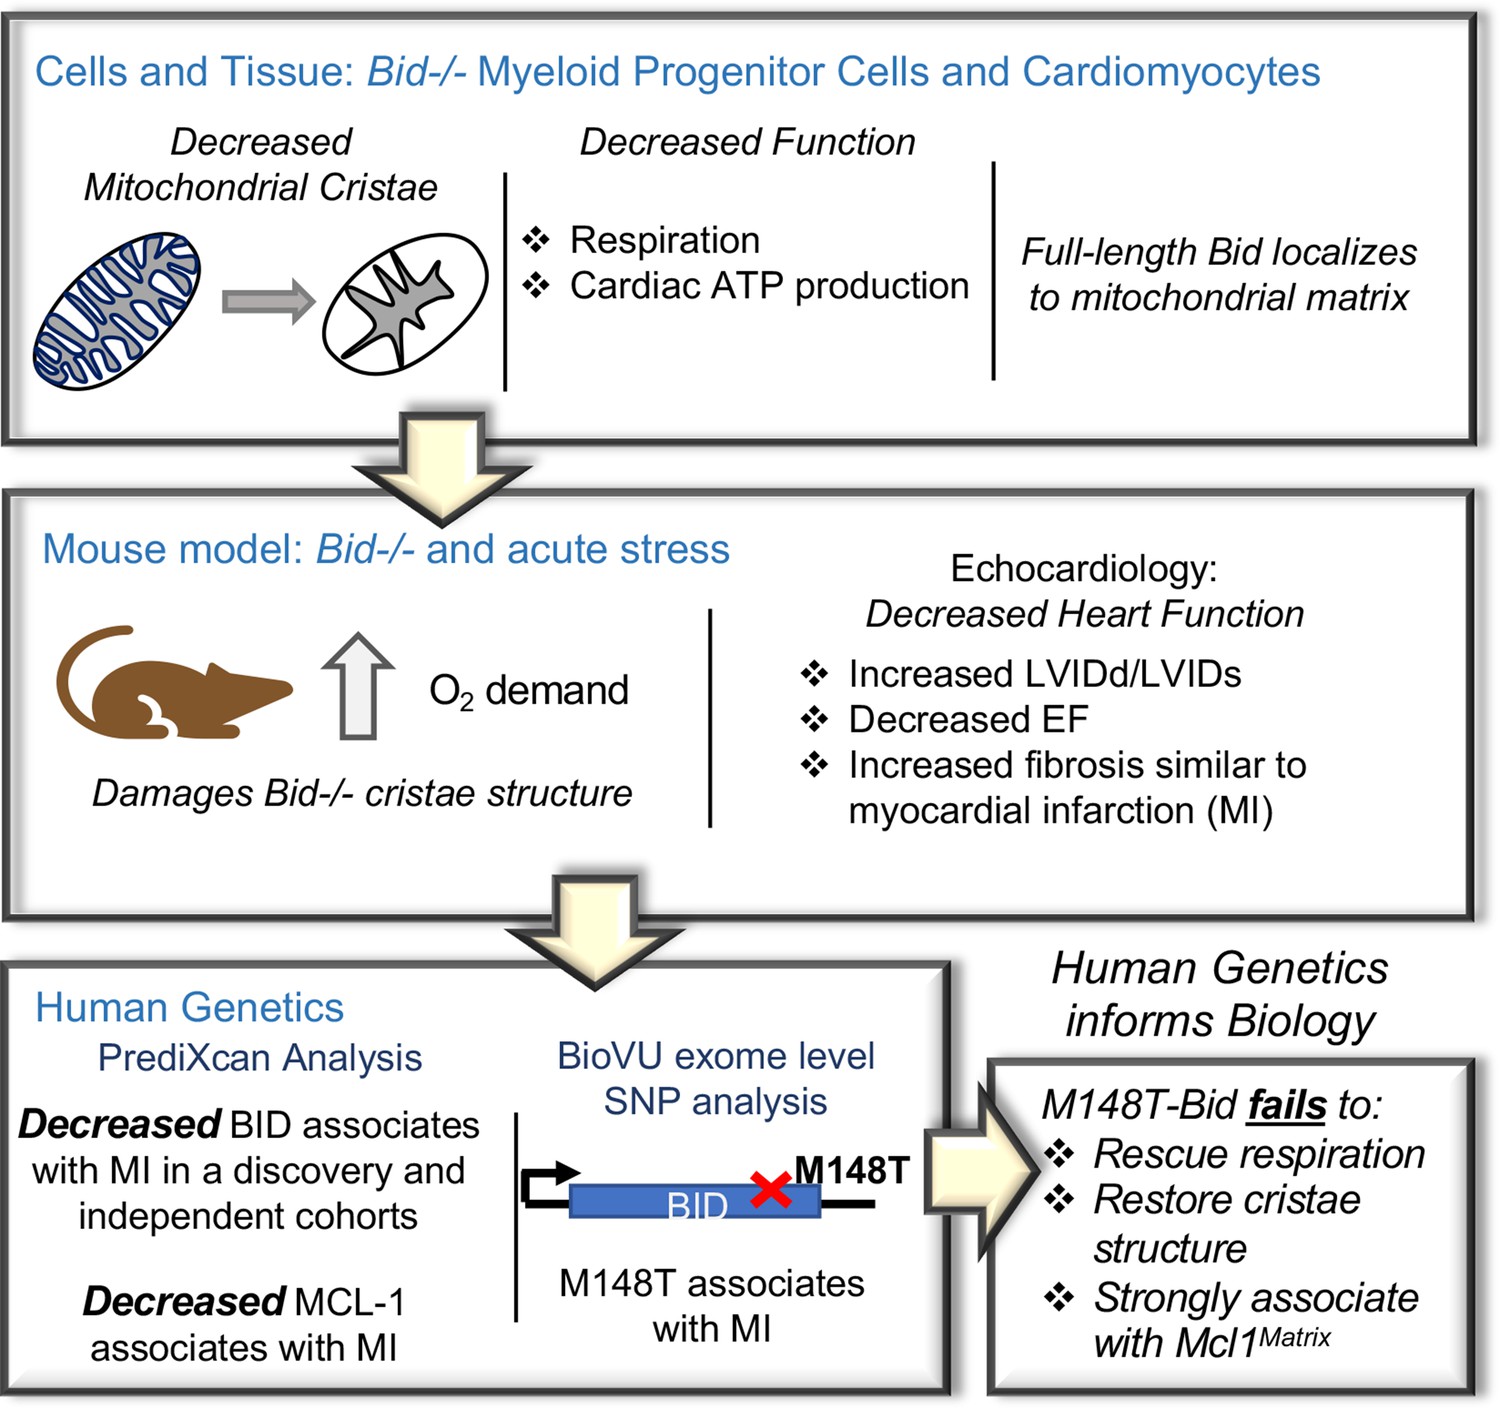
An integrated approach combining cells and mice with human genetics uncovers a novel role for Bid in the regulation of mitochondrial cristae.
Diagram of the approach used to uncover Bid’s novel function in regulating mitochondrial cristae structure. Bid-/- myeloid progenitor cell (MPCs) and left ventricular (LV) heart mitochondria have cristae structure abnormalities that result in functional defects. These defects are enhanced under conditions of stress in a Bid-/- mouse model. Human genetics analysis using PrediXcan reveals decreased BID gene expression associated with MI and BID exome level variation identifies coding SNP M148T, which is directly linked to Bid’s mitochondrial function. This SNP fails to restore cristae structure, respiration, and association with Mcl-1Matrix.
Figure 2 with 2 supplements
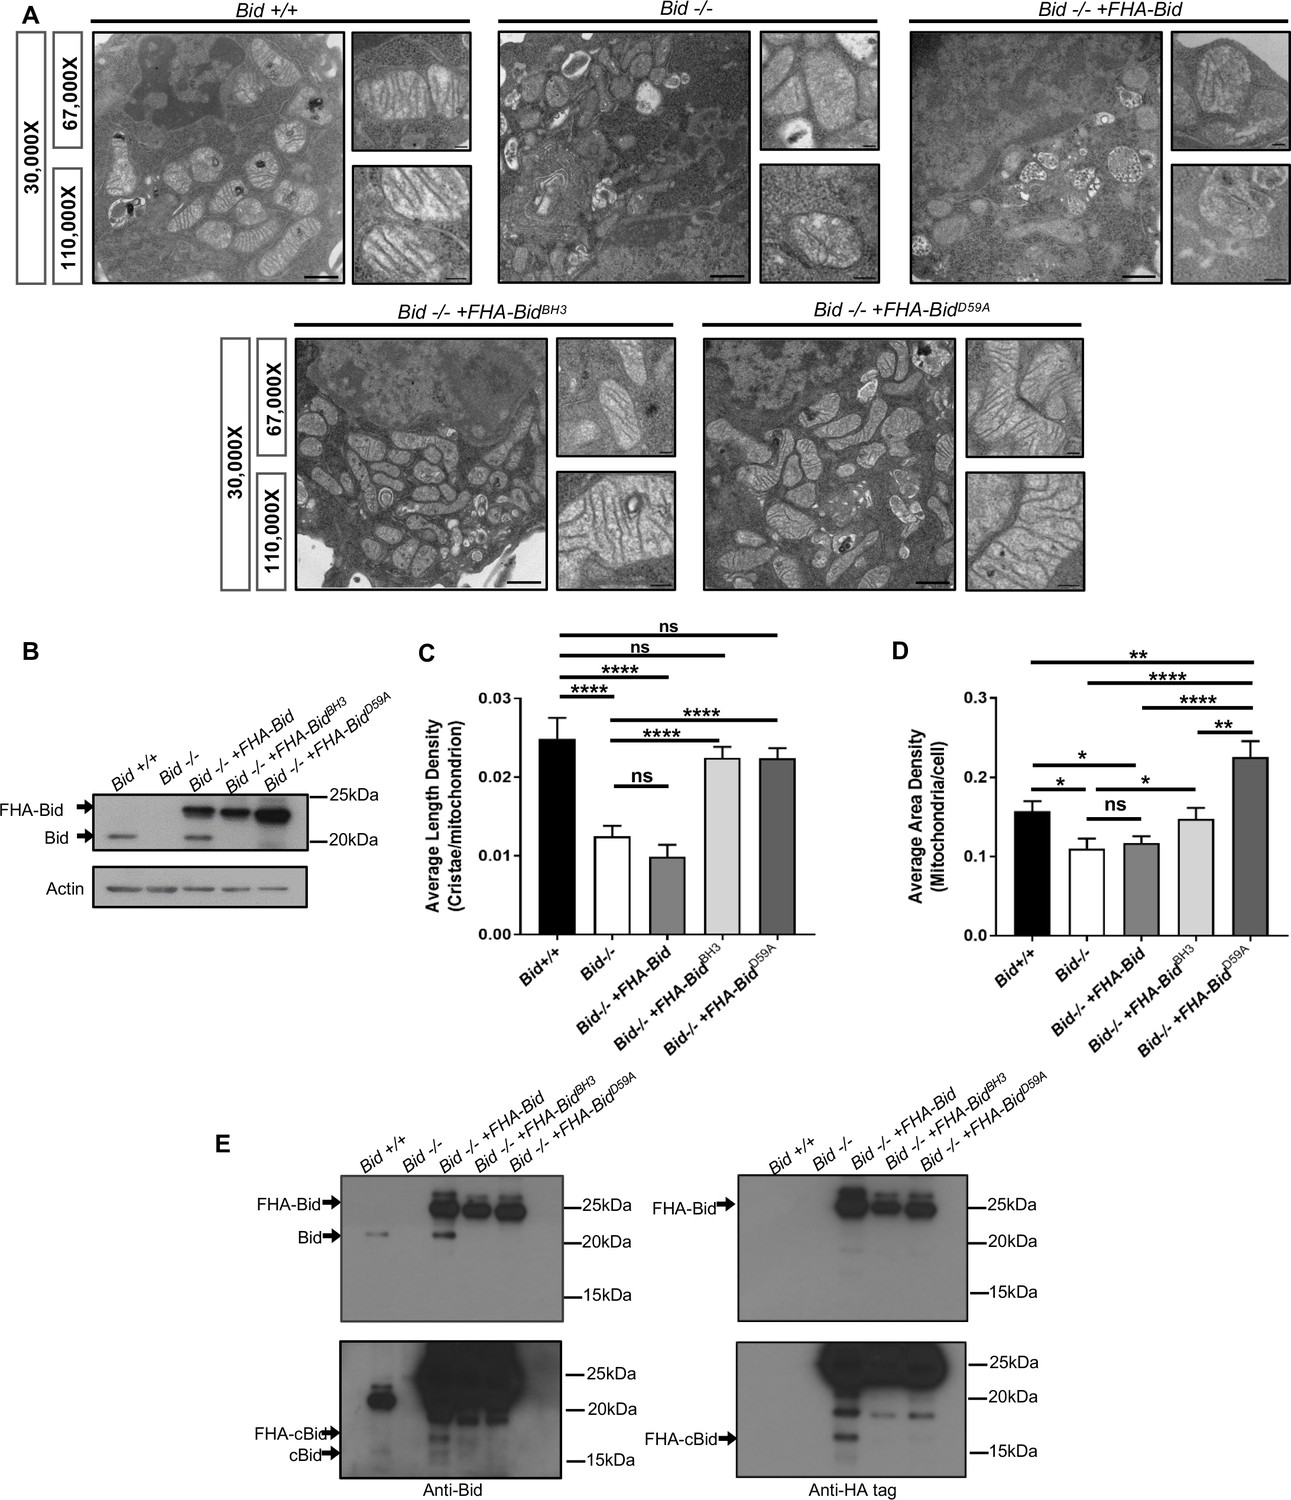
The Bcl-2 family protein Bid is required for normal mitochondrial cristae formation, independent from its apoptotic function.
(A) Transmission electron microscopy (TEM) of mitochondria from MPC cell lines including: Bid +/+ (WT), Bid-/-, Bid-/- + FHA Bid, Bid-/- + FHA-BidBH3 and Bid-/- + FHA-BidD59A. Representative images at 30,000X (scale bar = 500 nm), 67,000X and 100,000X magnification (scale bar = 100 nm). Also see Figure 2—figure supplement 2. (B) Western blot of expression levels of Bid for the indicated genotypes. Note that full-length Bid is observed in Bid-/- + FHA Bid cells due to cleavage of the FlagHA-epitope tag. (C) Quantitation of the number of cristae per mitochondria (represented by the average length density) and (D) the mitochondrial density per cell (represented by the average area density) of the MPC lines shown in (A). A total of 40 images were quantified at 30,000X for each cell line. (E) Western blot of Bid (left) and HA-tag (right) indicating increased presence of cleaved Bid (cBid) in Bid-/- + FHA Bid cells (lower blots are darker exposure). FlagHA-tagged expressing cells were loaded for equal Bid expression. P-values were determined by one-way ANOVA (p<0.0001) with unpaired Student’s t-test (C, D). Error bars indicate ±SEM for all data. ns = not significant, *p<0.05, **p<0.01, ***p<0.001, and ****p<0.0001.
-
Figure 2—source data 1
Data for Figure 2 and Figure 2—figure supplement 1.
- https://doi.org/10.7554/eLife.40907.007
Figure 2—figure supplement 1

Loss of Bid results in increased cell death in the absence of an apoptotic stimulus.
(A) Bid-/- MPCs display decreased growth rates (n = 4) but not proliferation rates (B) in complete media (n = 3). (C) Viability assay of Bid +/+ and Bid-/- cells in complete media (n = 7). Data were normalized to no treatment. P-values were determined by unpaired Student’s t-test for (A–C). Error bars indicate ±SEM for all data. ns = not significant, *p<0.05, **p<0.01, and ***p<0.001.
Figure 2—figure supplement 2
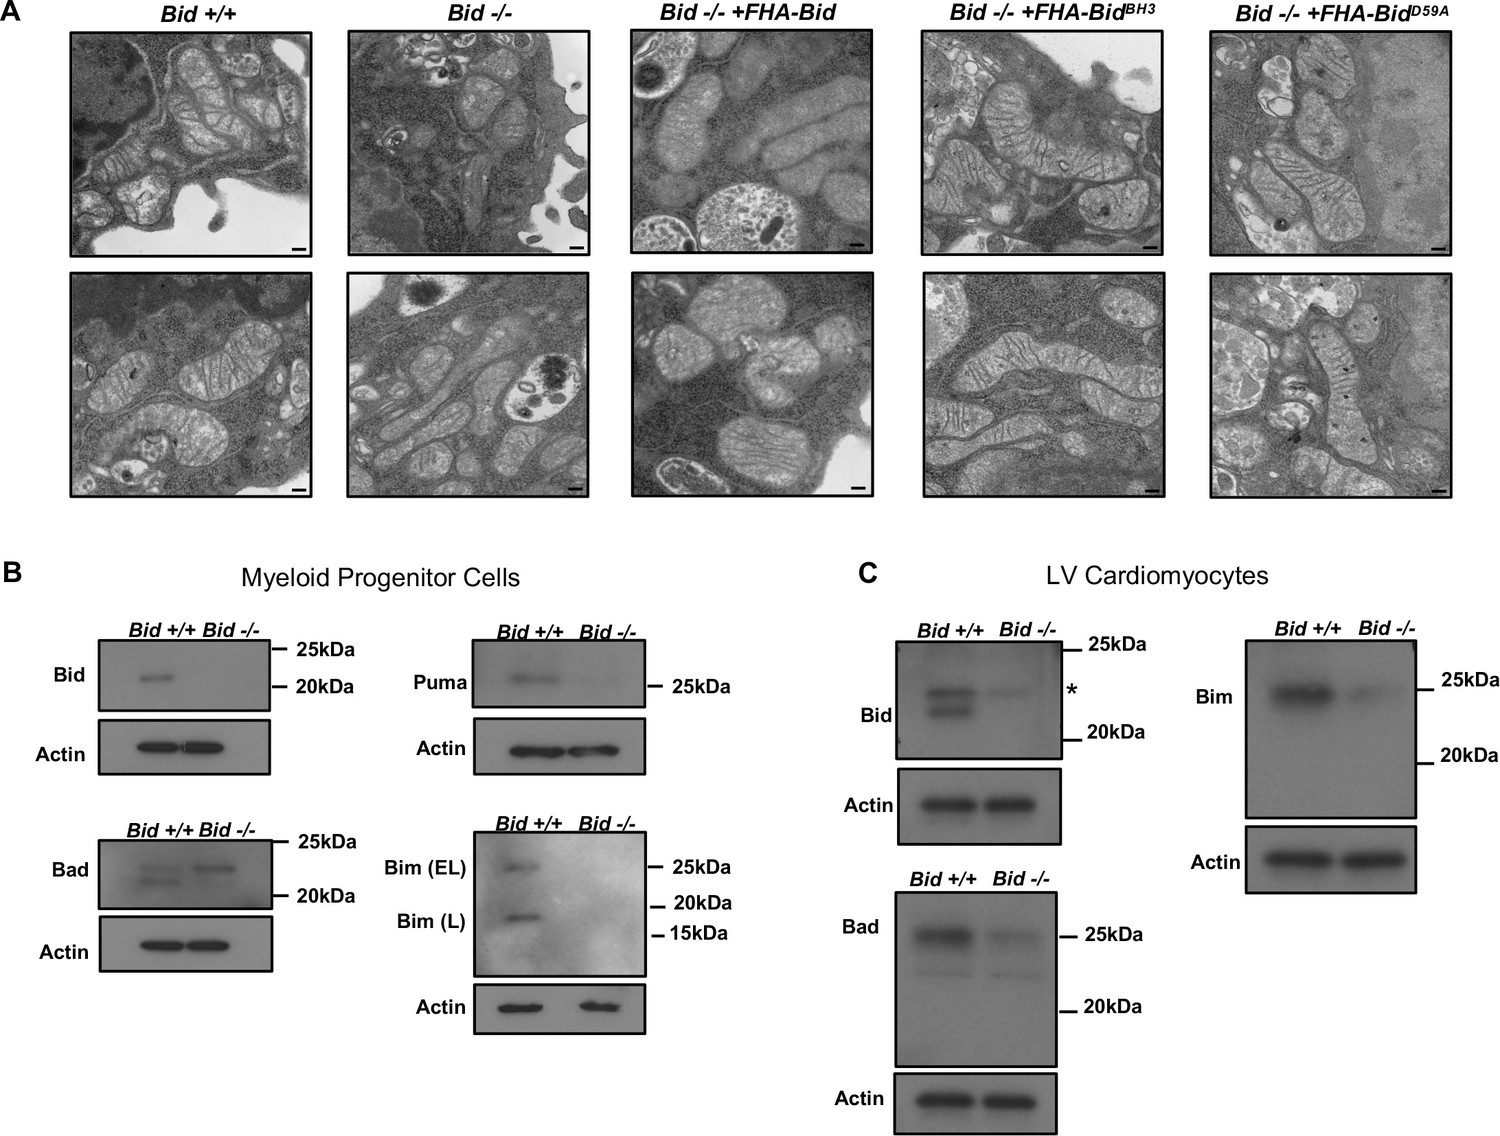
Loss of Bid results in a mitochondrial structural defect not compensated for by upregulation of Bad, Puma, or Bim.
(A) Transmission electron microscopy images of the indicated MPC cell lines. Images were taken at 67,000X, scale bar = 100 nm. (B) Western analysis of BH3-only proteins including Bad, Puma, and Bim from Bid +/+ and Bid-/- MPCs or (C) LV Cardiomyocytes. Loss of Bid does not lead to a compensatory increase in expression of these apoptotic proteins. * indicates cross-reacting band.
Figure 3
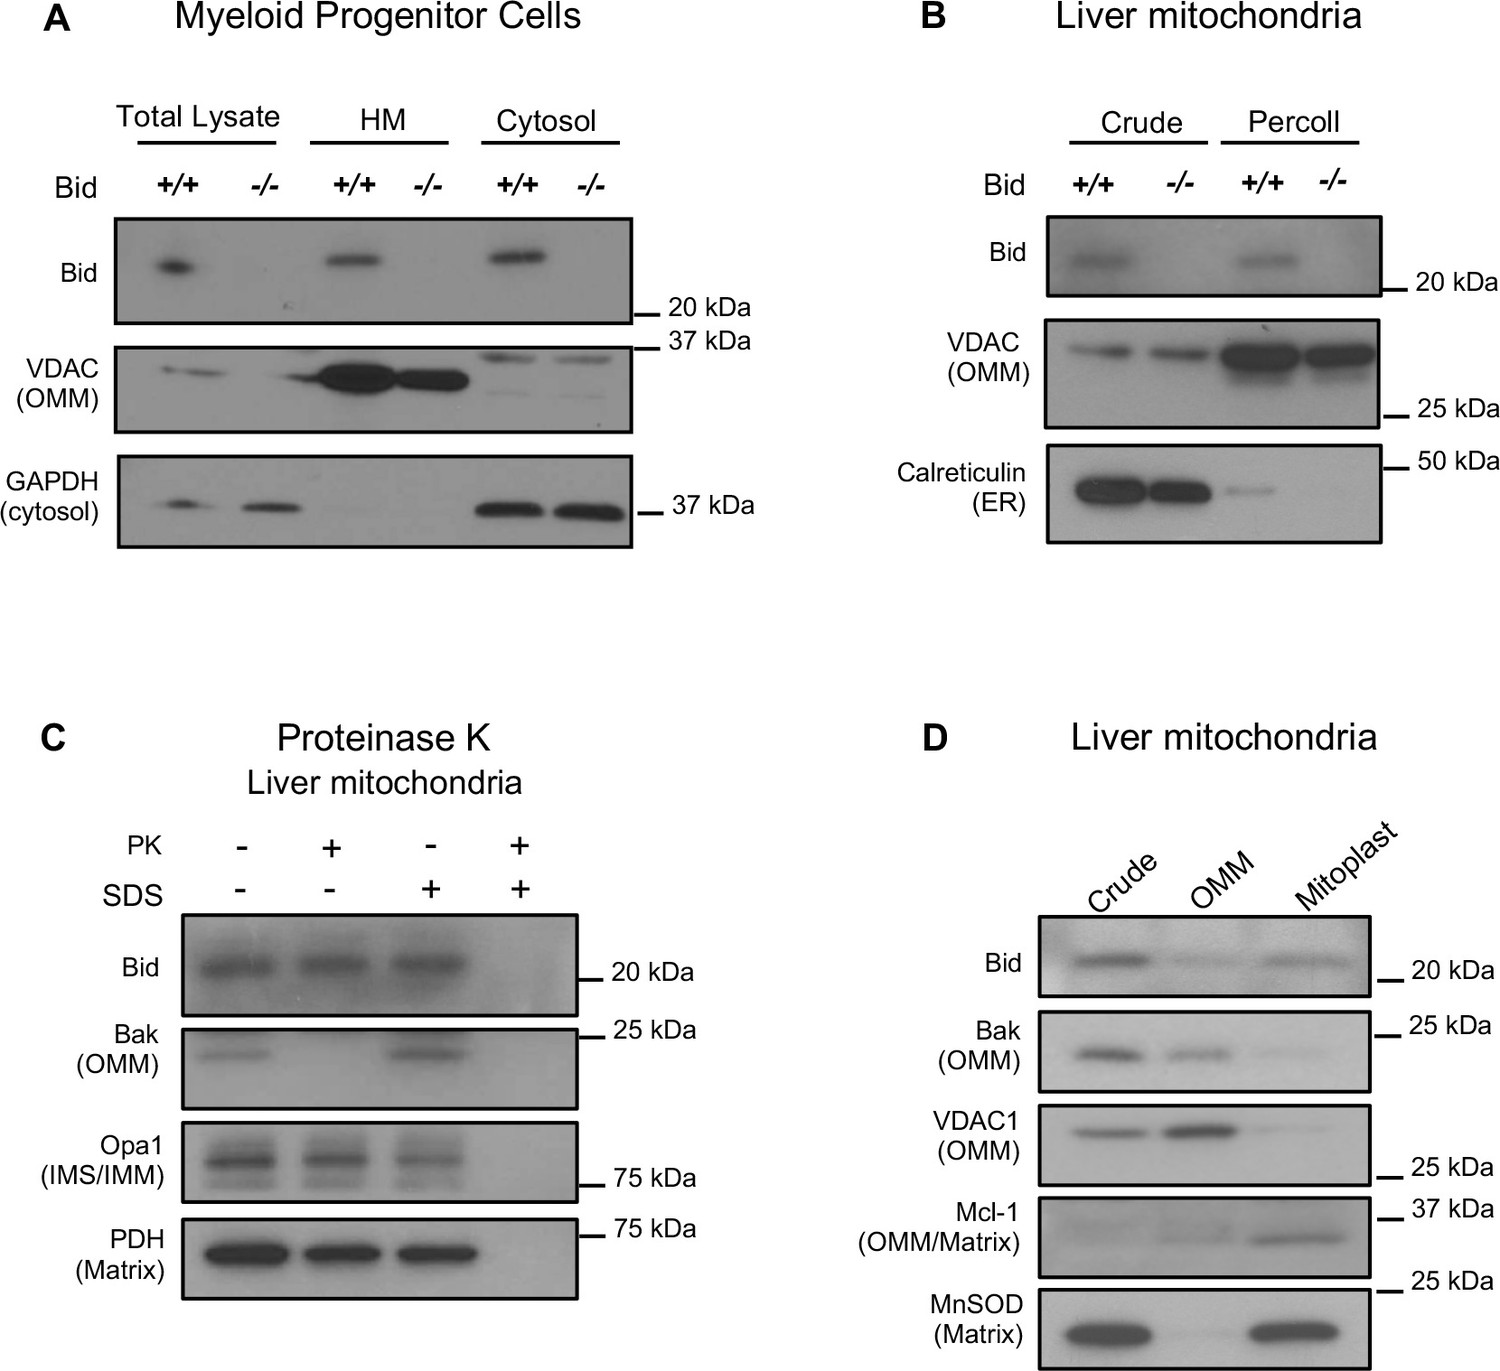
Full-length Bid localizes to the mitochondria in the absence of apoptosis and is found within a mitoplast fraction.
(A) Subcellular fractionation of WT and Bid-/- MPCs showing whole cell lysate (WCL), a mitochondrial-containing heavy membrane (HM) (VDAC) and cytosolic fraction (GAPDH). (B) Crude and Percoll purified liver mitochondria from WT and Bid-/- mice shows the presence of full-length Bid in the purified fraction in the absence of light membrane contamination. (C) Proteinase K (PK) treatment of isolated liver mitochondria reveals Bid in a PK resistant fraction. (D) Crude liver mitochondria from WT mice were fractionated into OMM and mitoplast (IMM/matrix) containing fractions and probed for OMM and matrix markers. Full-length Bid can be observed in the mitoplast rich fraction. OMM = outer mitochondrial membrane, IMS = inner membrane space, IMM = inner mitochondrial membrane.
Figure 4 with 1 supplement
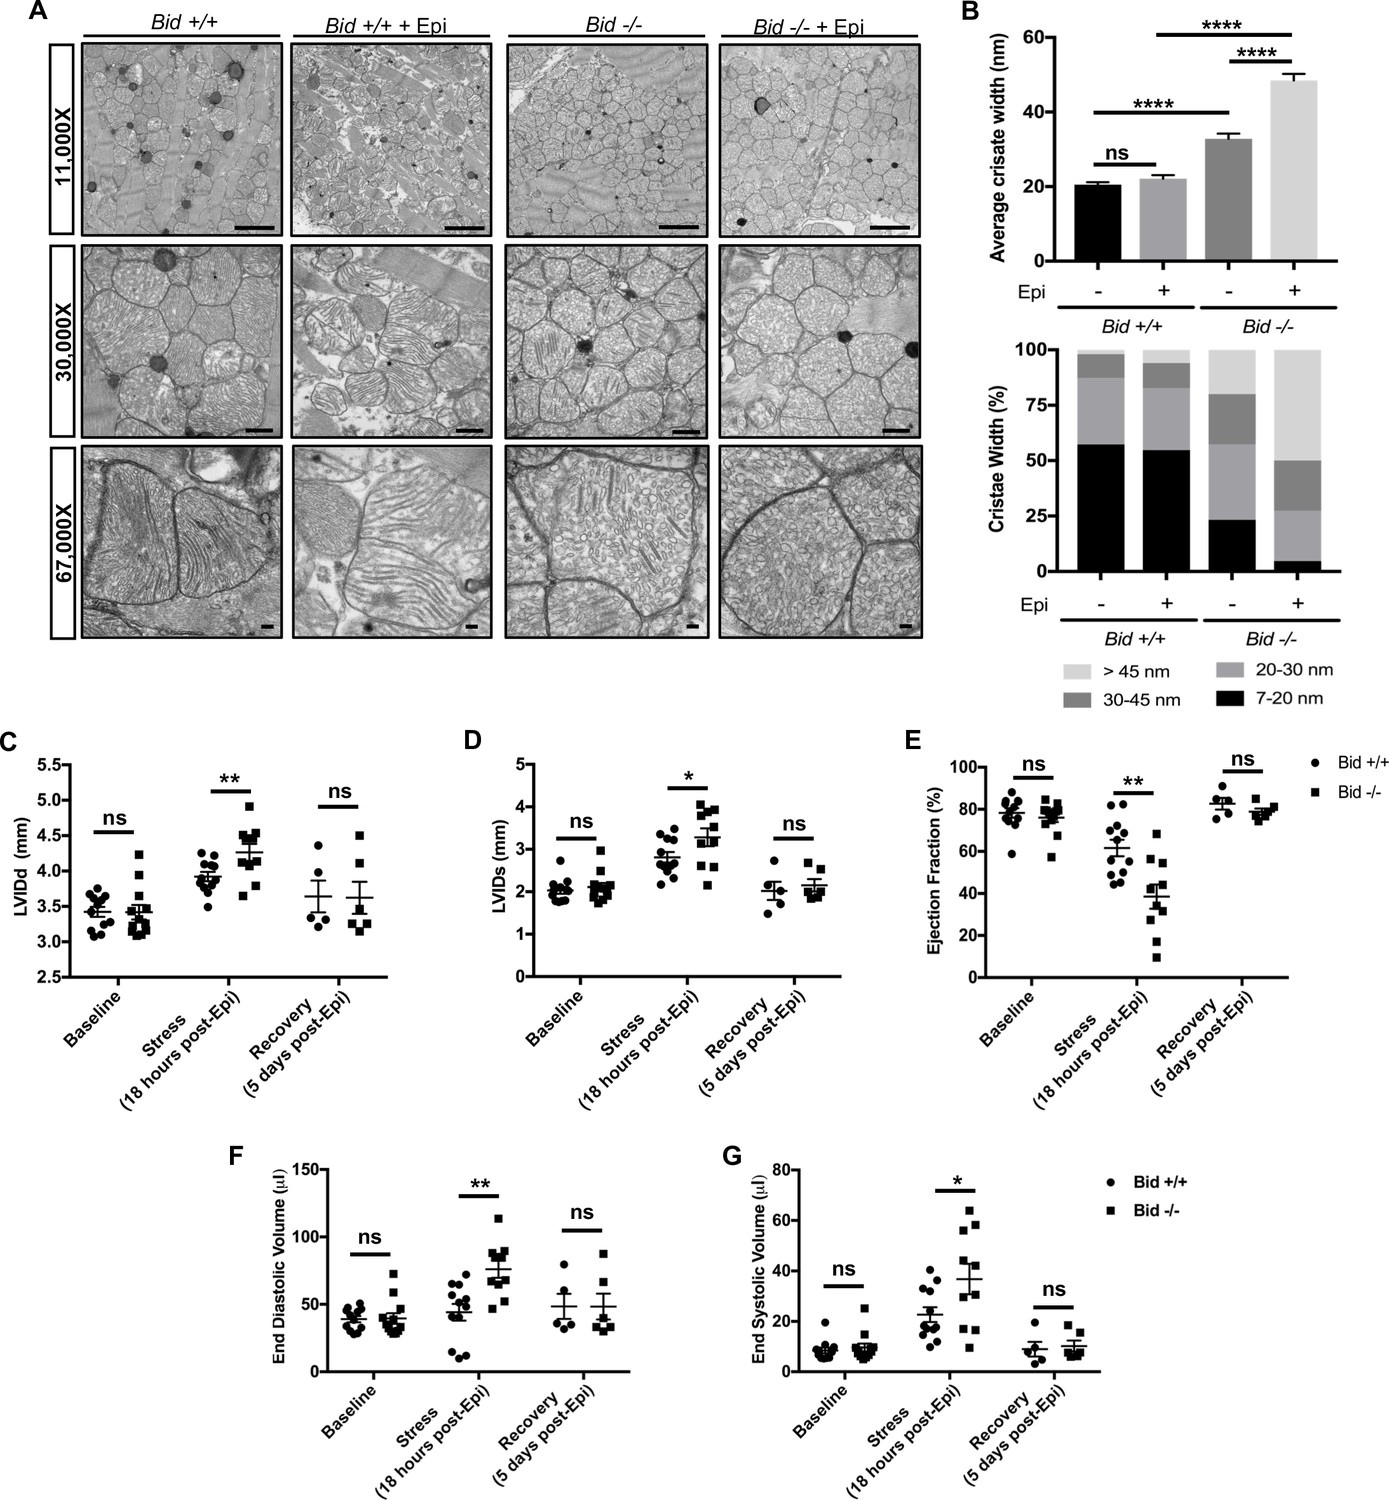
Left ventricular cardiomyocytes from Bid-/- mice have abnormal cristae, which are structurally and functionally exacerbated with acute Epinephrine stress.
(A) Transmission electron microscopy (TEM) of left ventricle cardiomyocyte mitochondria from Bid +/+ and Bid-/- 18 hr with or without 0.5 mg/kg Epinephrine treatment. Representative images at 11,000X (scale bar = 2 μm), 30,000X (scale bar = 500 nm), and 67,000X (scale bar = 100 nm). (B) (Top) Quantitation of average cristae width (nanometers) corresponding to (A). n = 150 cristae per genotype, measured at 67,000X. (Bottom) Percent of cristae corresponding to the indicated widths (nm). (C) Echocardiogram analysis of left-ventricular internal diameter diastole (LVIDd, mm) and (D) LVID systole (LVIDs, mm) of Bid +/+ and Bid-/- mice at the indicated time points. (E) Ejection fraction (%) from Bid +/+ and Bid-/- mice without treatment (Baseline), 18 hr after 0.5 mg/kg Epinephrine, and 120 hr post Epinephrine (recovery). (F) End diastolic volume (μl) and (G) End systolic volume (μl) at the indicated time points. n = 12, 12, 5 Bid +/+ mice and n = 12, 10, 6 for Bid-/- mice for baseline, 18 hr, and 120 hr time points, respectively for (C–G). P-values were determined by one-way ANOVA with unpaired Student’s t-test (B), and unpaired Student’s t-test (C–G). Error bars indicate ± SEM for all data. ns = not significant, *p<0.05, **p<0.01 and ****p<0.0001.
-
Figure 4—source data 1
Data for Figure 4 and Figure 4—figure supplement 1.
- https://doi.org/10.7554/eLife.40907.011
Figure 4—figure supplement 1
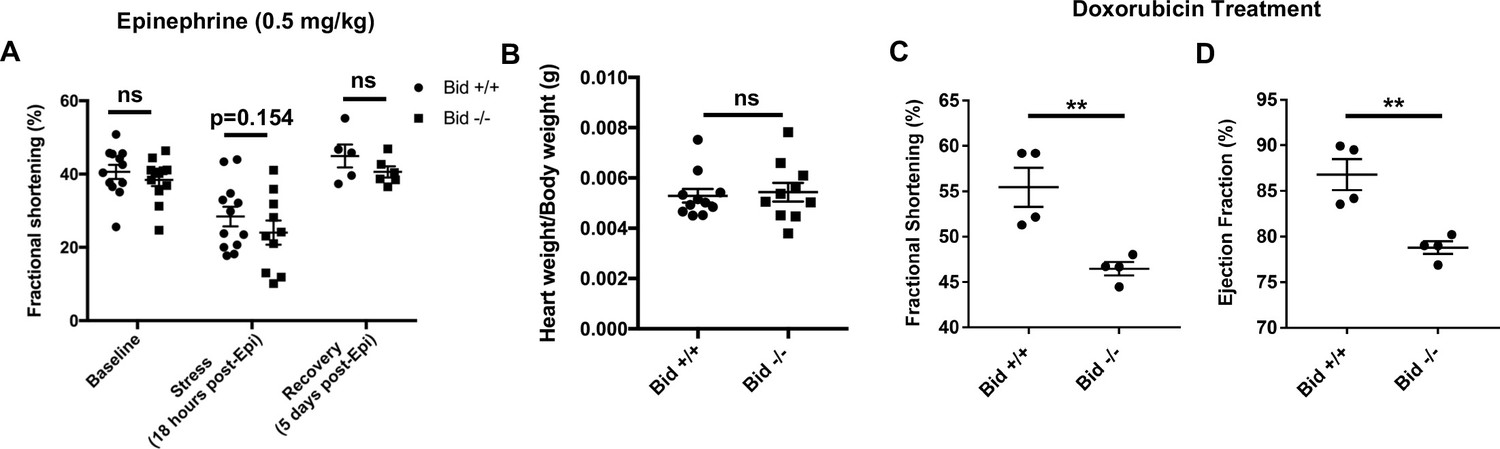
Bid-/- mice have decreased FS and EF with chronic Doxorubicin.
(A) Fractional shortening (%) from mice corresponding to Figure 4. (B) Heart weight to body weight ratio from mice in Figure 4. (C) Fractional shortening (%) from Bid +/+ and Bid-/- mice after 3 doses of 7.5 mg/kg of Doxorubicin every 5 days (n = 4 mice per group). (D) Ejection fraction (%) of Doxorubicin treated mice as in (C). Measurements for FS and EF were made in at least duplicate using the LV trace function using the Visual Sonics Software ver2.2. P-values were determined by two-way ANOVA with unpaired student’s t-test (A) and unpaired Student’s t-test for (B–D). Error bars indicate ± SEM for all data. ns = not significant, *p<0.05, **p<0.01.
Figure 5
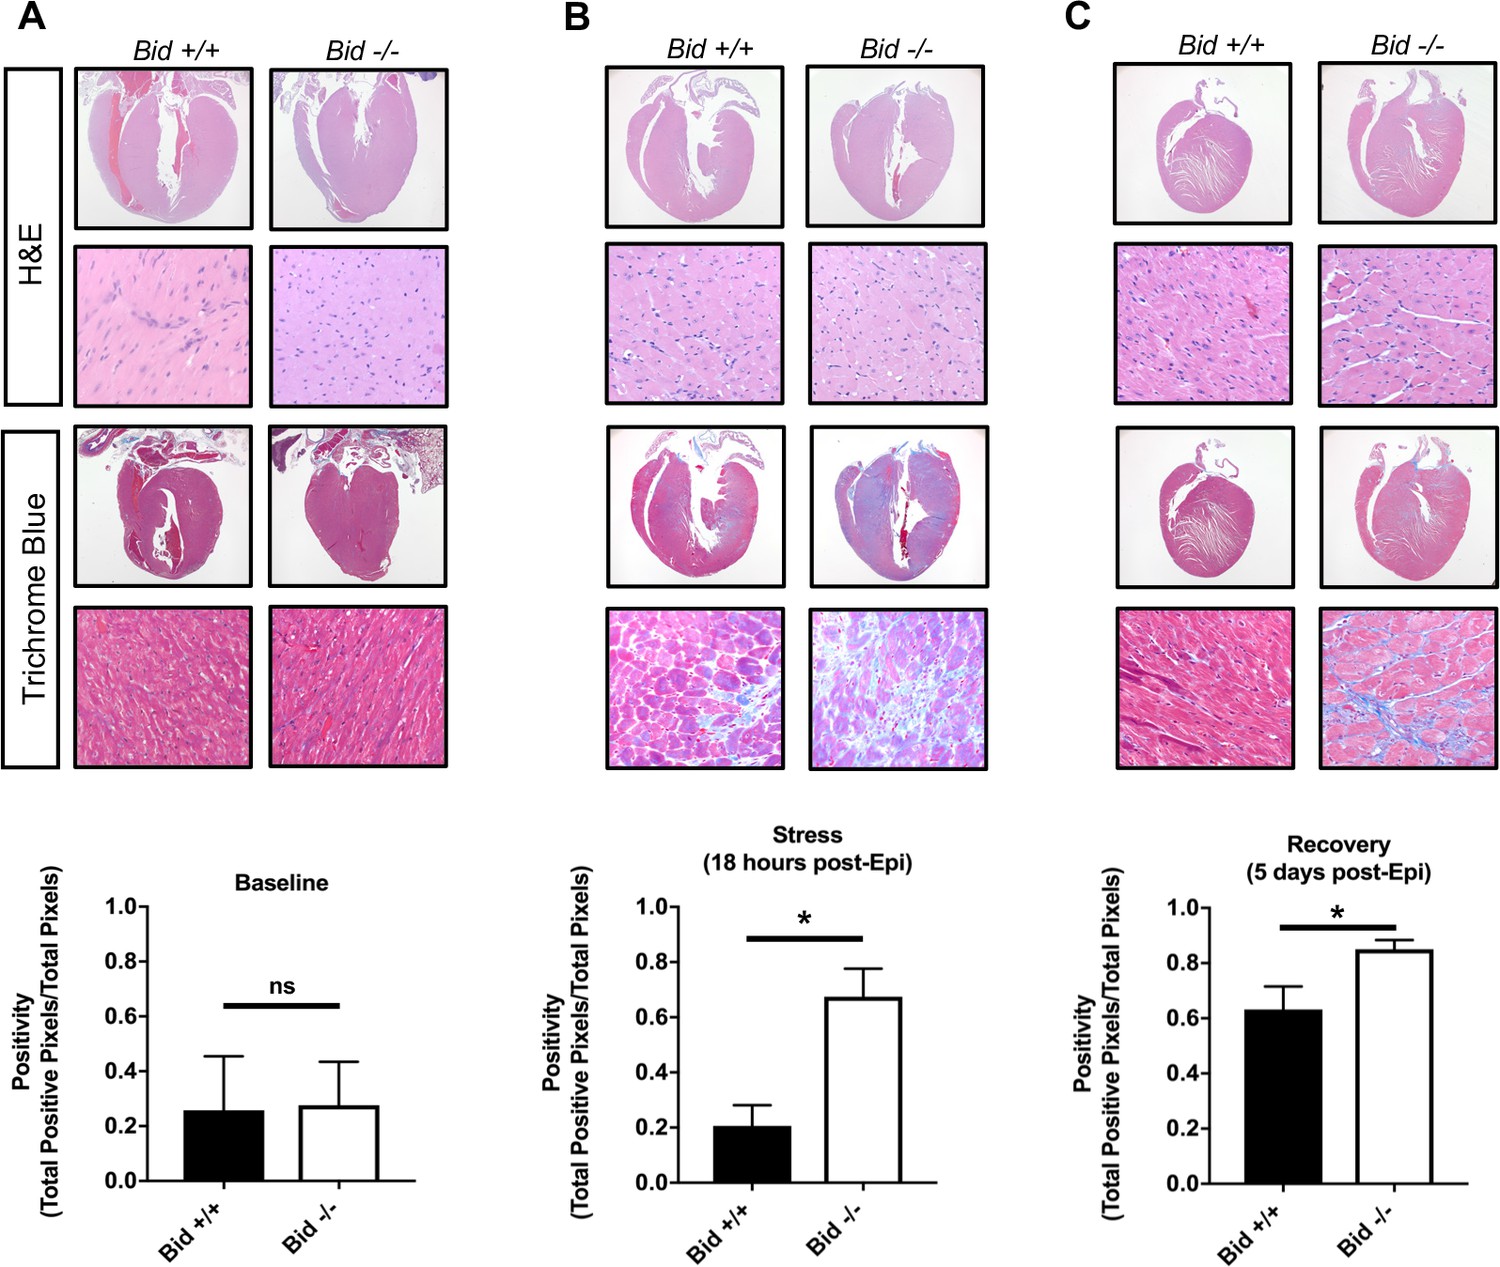
Epinephrine stress results in increased fibrotic damage in Bid-/- hearts.
(A) Representative images of H and E staining of Bid+/+ and Bid-/- hearts (top) and Masson’s Trichrome staining (bottom) without treatment. Quantitation of the Trichrome positivity (Total positive pixels/Total pixels), n = 3,3 respectively. (B) H and E and Masson’s Trichrome 18 hr after Epinephrine (0.5 mg/kg) with quantitation as in (A), n = 4, 3. (C) H and E and Masson’s Trichrome 5 days after Epinephrine (0.5 mg/kg) with quantitation, n = 6,6. P-values were determined by unpaired Student’s t-test. Error bars indicate ± SEM for all data. ns = not significant, *p<0.05.
-
Figure 5—source data 1
Data for Figure 5.
- https://doi.org/10.7554/eLife.40907.013
Figure 6 with 2 supplements
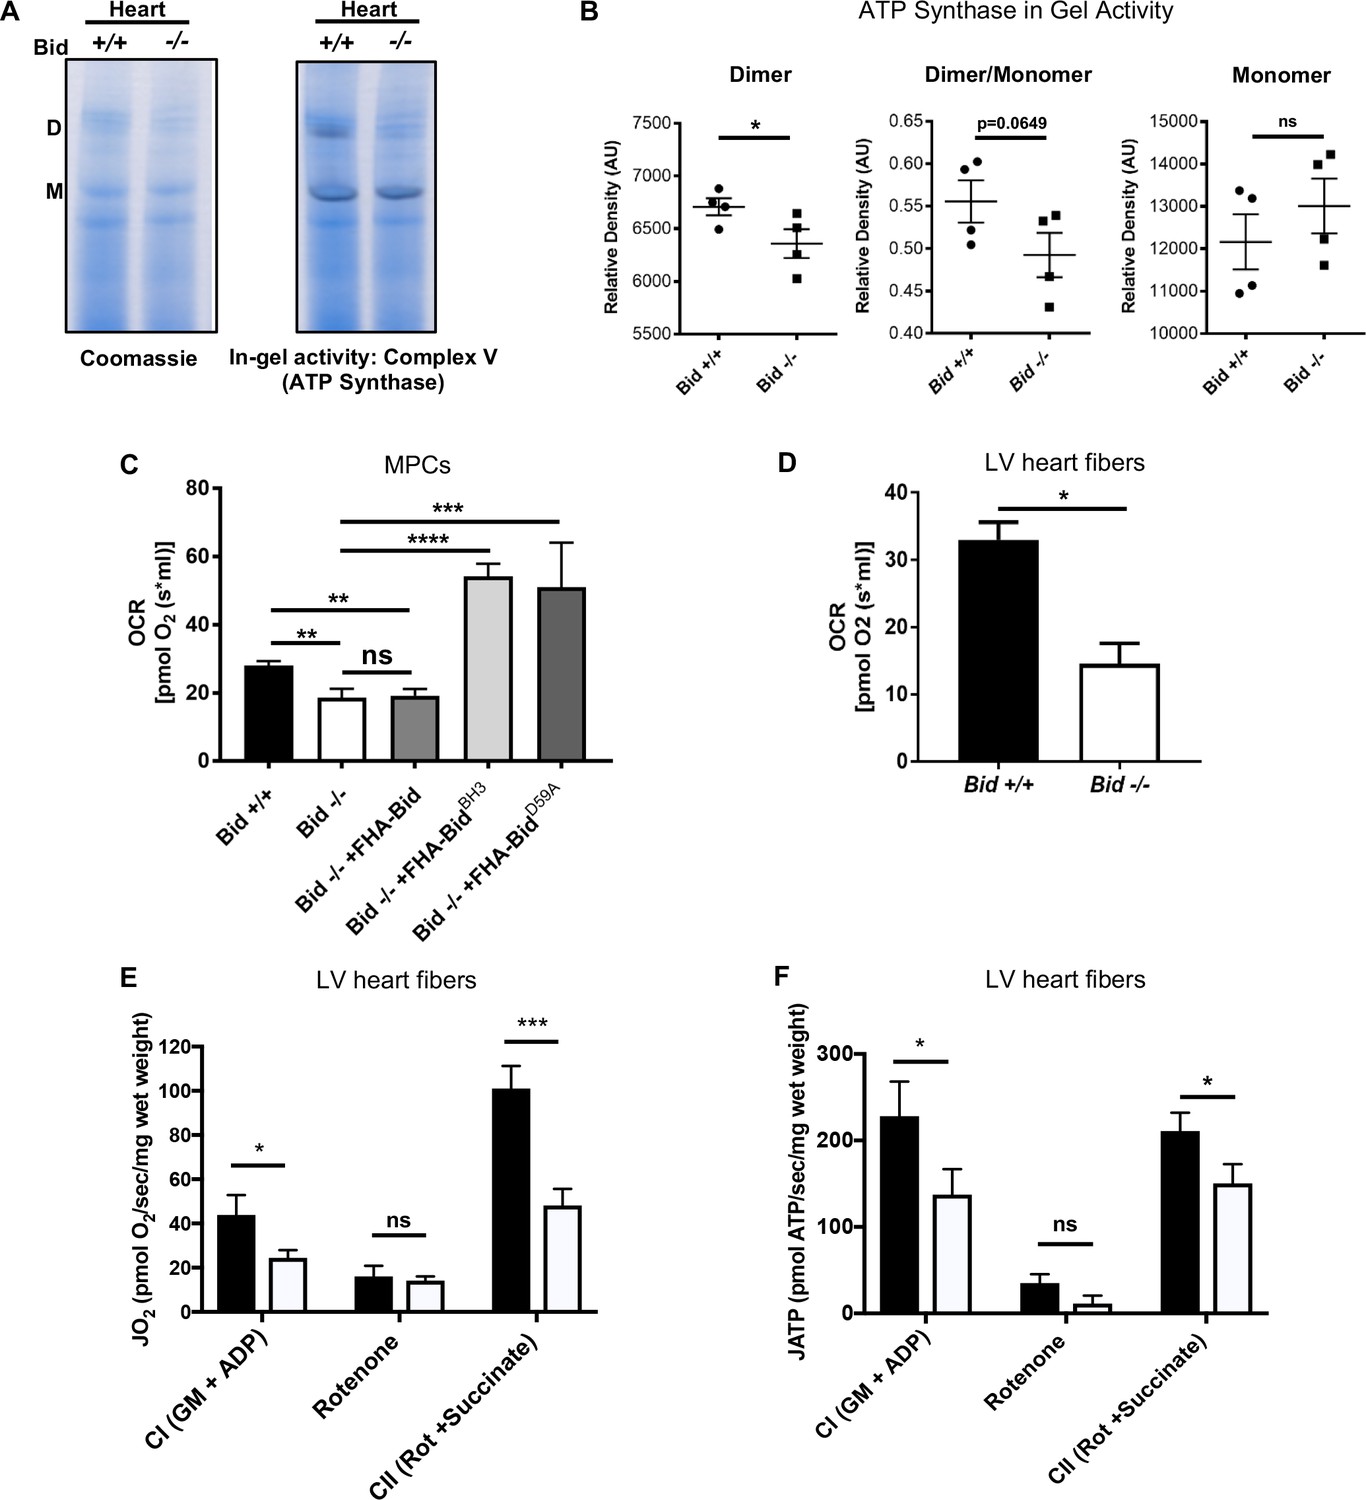
Loss of Bid results in decreased ATP-synthase activity and respiration.
(A) Representative native gel (left) and in-gel activity (IGA) assay (right) for Complex V (ATP synthase) from isolated Bid +/+ and Bid-/- heart mitochondria, D = dimer and M = monomer of ATP synthase. (B) Quantitation of IGA assay for heart CV activity as measured by the relative density of indicated dimer and monomer bands (arbitrary units), (n = 4). Also see Figure 6—figure supplement 1D–F for additional respiratory complex activity analysis. (C) Oxygen consumption rate (OCR) was measured in an Oroboros Oxygraph in complete IMDM media on equivalent numbers of indicated cells (2 × 10⁶) (n = 7,7,4,3,3 respectively). (D) State 3 respiration of saponin permeabilized left ventricle cardiac fibers from Bid +/+ and Bid-/- mouse hearts in MiRO5 respiration medium supplemented with glutamate, malate, and ADP (n = 3). (E) Oxygen consumption (JO2) of permeabilized left ventricular cardiac fibers from Bid+/+ and Bid-/- mice in the presence of indicated metabolic substrates. G = glutamate, M = malate, CI = Complex I, CII = Complex II, Rot = Rotenone (n = 6,6 respectively). (F) Simultaneous ATP synthesis in presence of metabolic substrates as in (E). P-values determined by unpaired Student’s t-test (B), (D), one-way ANOVA (p<0.0001) with unpaired Student’s t-test (two-way) for (C), and two-way ANOVA (p<0.01) with unpaired Student’s t-test for (E) and (F). Error bars indicate ±SEM for all data. ns = not significant, *p<0.05, **p<0.01,***p<0.001, and ****p<0.0001.
-
Figure 6—source data 1
Data for Figure 6, Figure 6—figure supplement 1, and Figure 6—figure supplement 2.
- https://doi.org/10.7554/eLife.40907.017
Figure 6—figure supplement 1
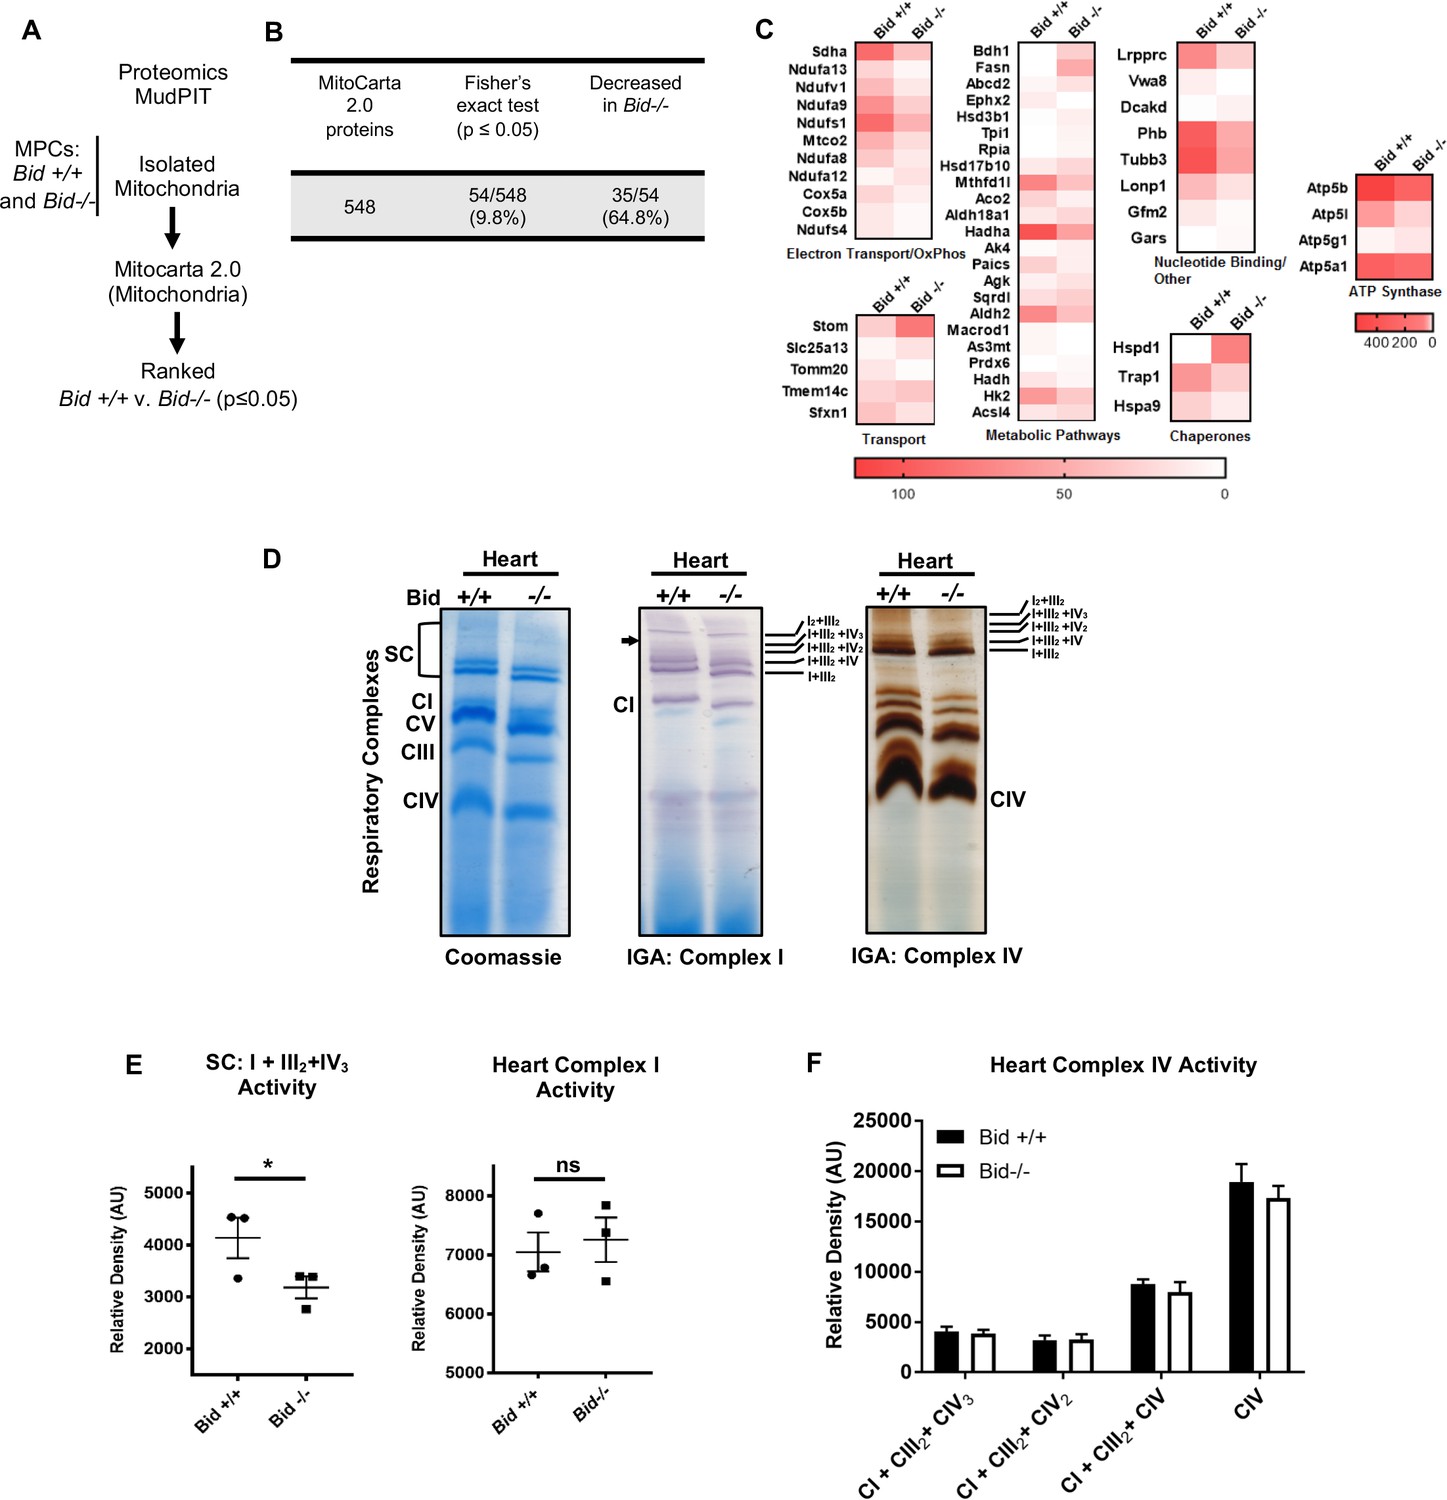
Bid-/- MPC mitochondria have a decreased CI proteins and decreased activity, but no difference in CIV activity.
(A) MudPIT analysis workflow on isolated MPC mitochondria. (B) Summary of results revealing 54 significantly different mitochondrial proteins different by Fisher’s exact test (p<0.05). (C) Heat map highlights spectral count differences between identified cristae-related proteins. Scale indicates no spectral counts (white) to high spectral counts (red). (D) Representative Coomassie stained gradient native gel of equivalent amounts of Bid +/+ and Bid-/- heart mitochondria protein (left), in-gel activity (IGA) assay for Complex I (middle, arrow denotes significantly different complex activity), and in-gel activity for Complex IV (right). CI = Complex I, CIII = Complex III, CIV = Complex IV, CV = Complex V, and SC = supercomplexes. (E) Quantitation of in-gel activity assay for CI respiratory complexes In Bid+/+ and Bid-/- hearts, arbitrary units, n = 3 per gel (representative of 4 runs). (F) Quantitation of in-gel activity assay for all CIV respiratory complexes In Bid+/+ and Bid-/- hearts, arbitrary units, n = 3 per gel (representative of X runs). P-values were determined by unpaired Student’s t-test for (E). Error bars indicate ± SEM for all data. ns = not significant, *p<0.05.
Figure 6—figure supplement 2
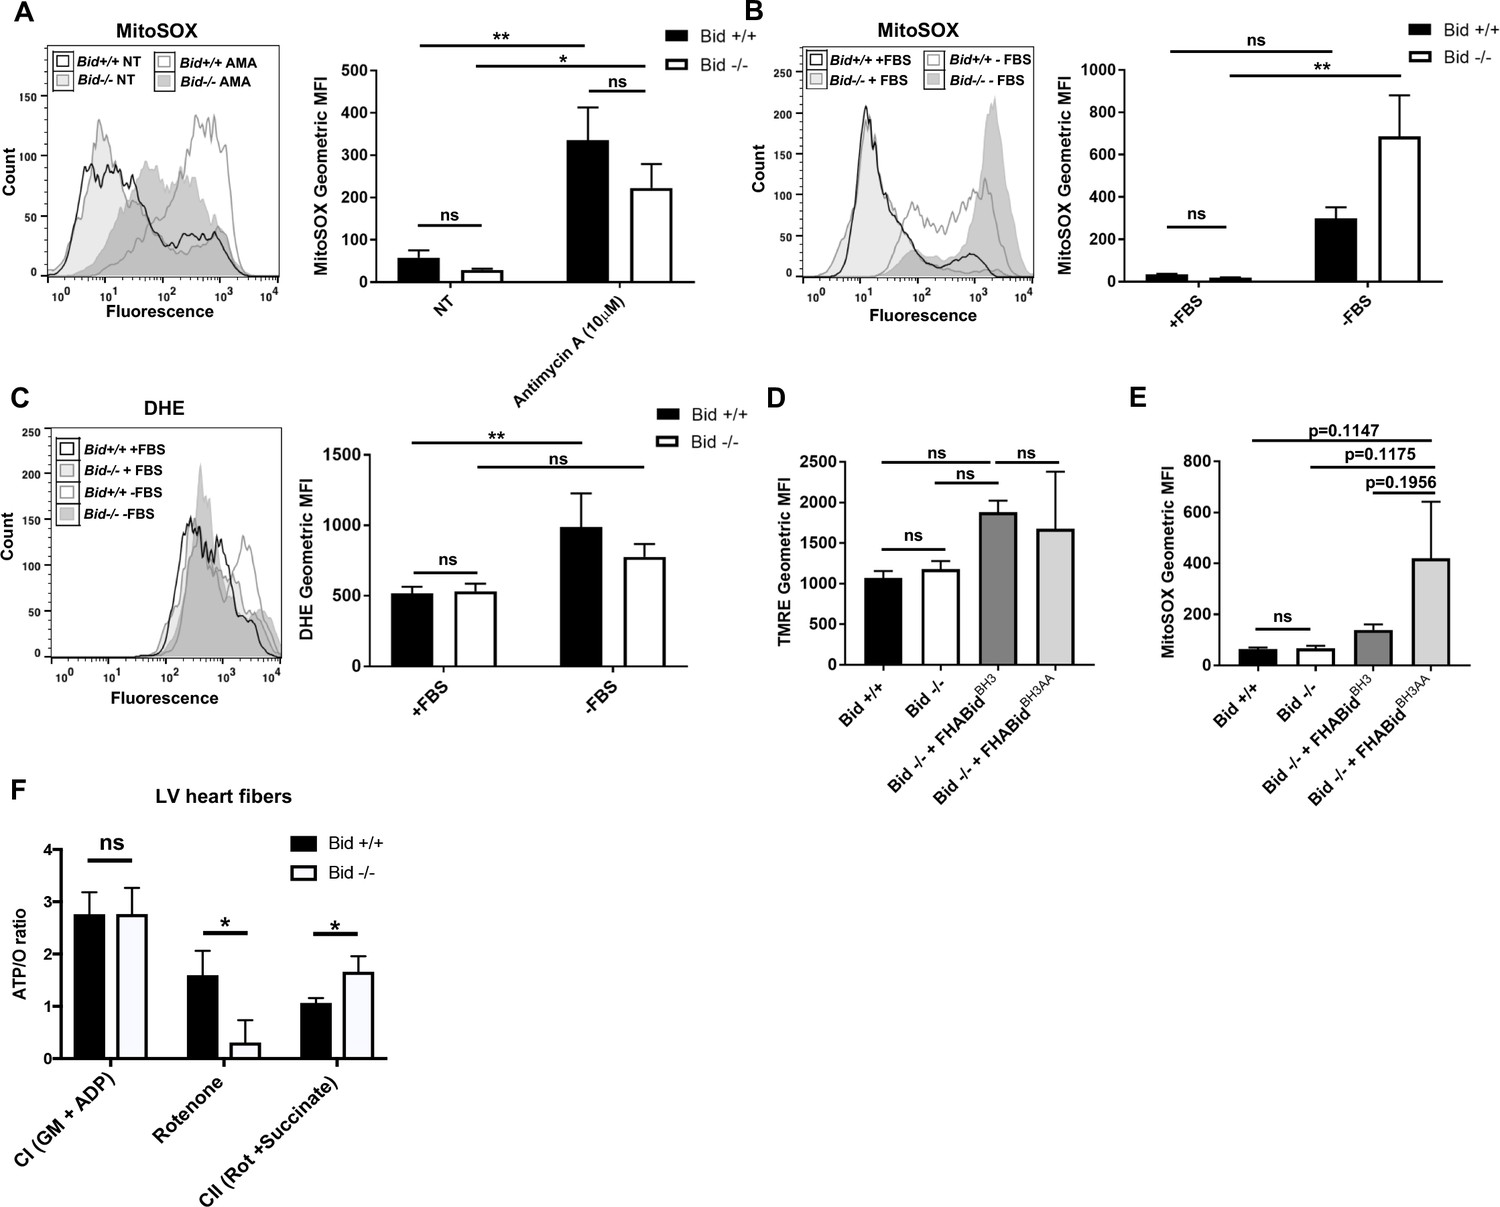
Bid-/- MPCs maintain their membrane potential and do not increased ROS.
(A) Bid+/+ and Bid-/- MPCs were cultured for 24 hr in complete media (no treatment = NT) or treated with10 µM Antimycin A (AMA) as a positive control for the last two hours followed by staining with 2 µM MitoSOX for mitochondrial ROS. Data are represented as geometric mean fluorescence intensity (MFI) (NT n = 7,6 and AMA n = 6,6 for Bid+/+ and Bid-/-, respectively). (B) Bid +/+ and Bid-/- MPCs were subjected to serum withdrawal for 24 hr and stained with MitoSOX (n = 4,4 for Bid+/+ and Bid-/- with and without FBS). (C) Treatment as in (B) followed by staining with 5 µM of DHE for cellular ROS (n = 11,10 with FBS and n = 4,4 without FBS for Bid+/+ and Bid-/-, respectively). (D) Mitochondrial membrane potential assessed with 50 nM TMRE in Bid +/+, Bid-/-, Bid-/- + FHA-BidBH3 and Bid-/- + FHA-BidBH3AA MPCs (n = 4,4,4,3 respectively). Cells overexpressing BH3- or BH3AA-mutanted Bid were gated on CD25 high expressing cells (i.e. only cells containing FHA-Bid). (E) Mitochondrial ROS of the indicated cell lines measured with MitoSOX as in (D) (n = 4,4,4,3 respectively). (F) ATP/O ratio determined from data shown in Figure 6E and F. P-values were determined by two-way ANOVA (p<0.001) with Tukey’s post test for (A–C), one-way ANOVA (not significant) with Student’s t-test (two-tailed) (D), (E), and two-way ANOVA with unpaired Student’s t-test for (F). Error bars indicate ± SEM for all data. ns = not significant, *p<0.05, **p<0.01.
Figure 7 with 3 supplements

PrediXcan analysis of BID expression reveals a novel role in cardiac diseases.
(A) Diagram of PrediXcan analysis workflow. PrediXcan estimates the genetically regulated component of gene expression (germline), excluding the impact of the disease itself and the environment on expression. (B) PrediXcan in a BioVU replication cohort of 29, 366 patients (in heart tissue). Patients were also binned by BID gene expression, with the lowest 5% analyzed for incidence of the cardiac traits discovered by PrediXcan. A total of 1447 patients encompassed the lowest 5% in BID expression. Myocardial infarction had the highest increased incidence, represented by graph for fold change in these patients compared to all Vanderbilt Synthetic Derivative (SD) patients (1,593,350 records). P-values were determined by logistic regression with disease status as response variable and imputed gene expression as predictor.
Figure 7—figure supplement 1
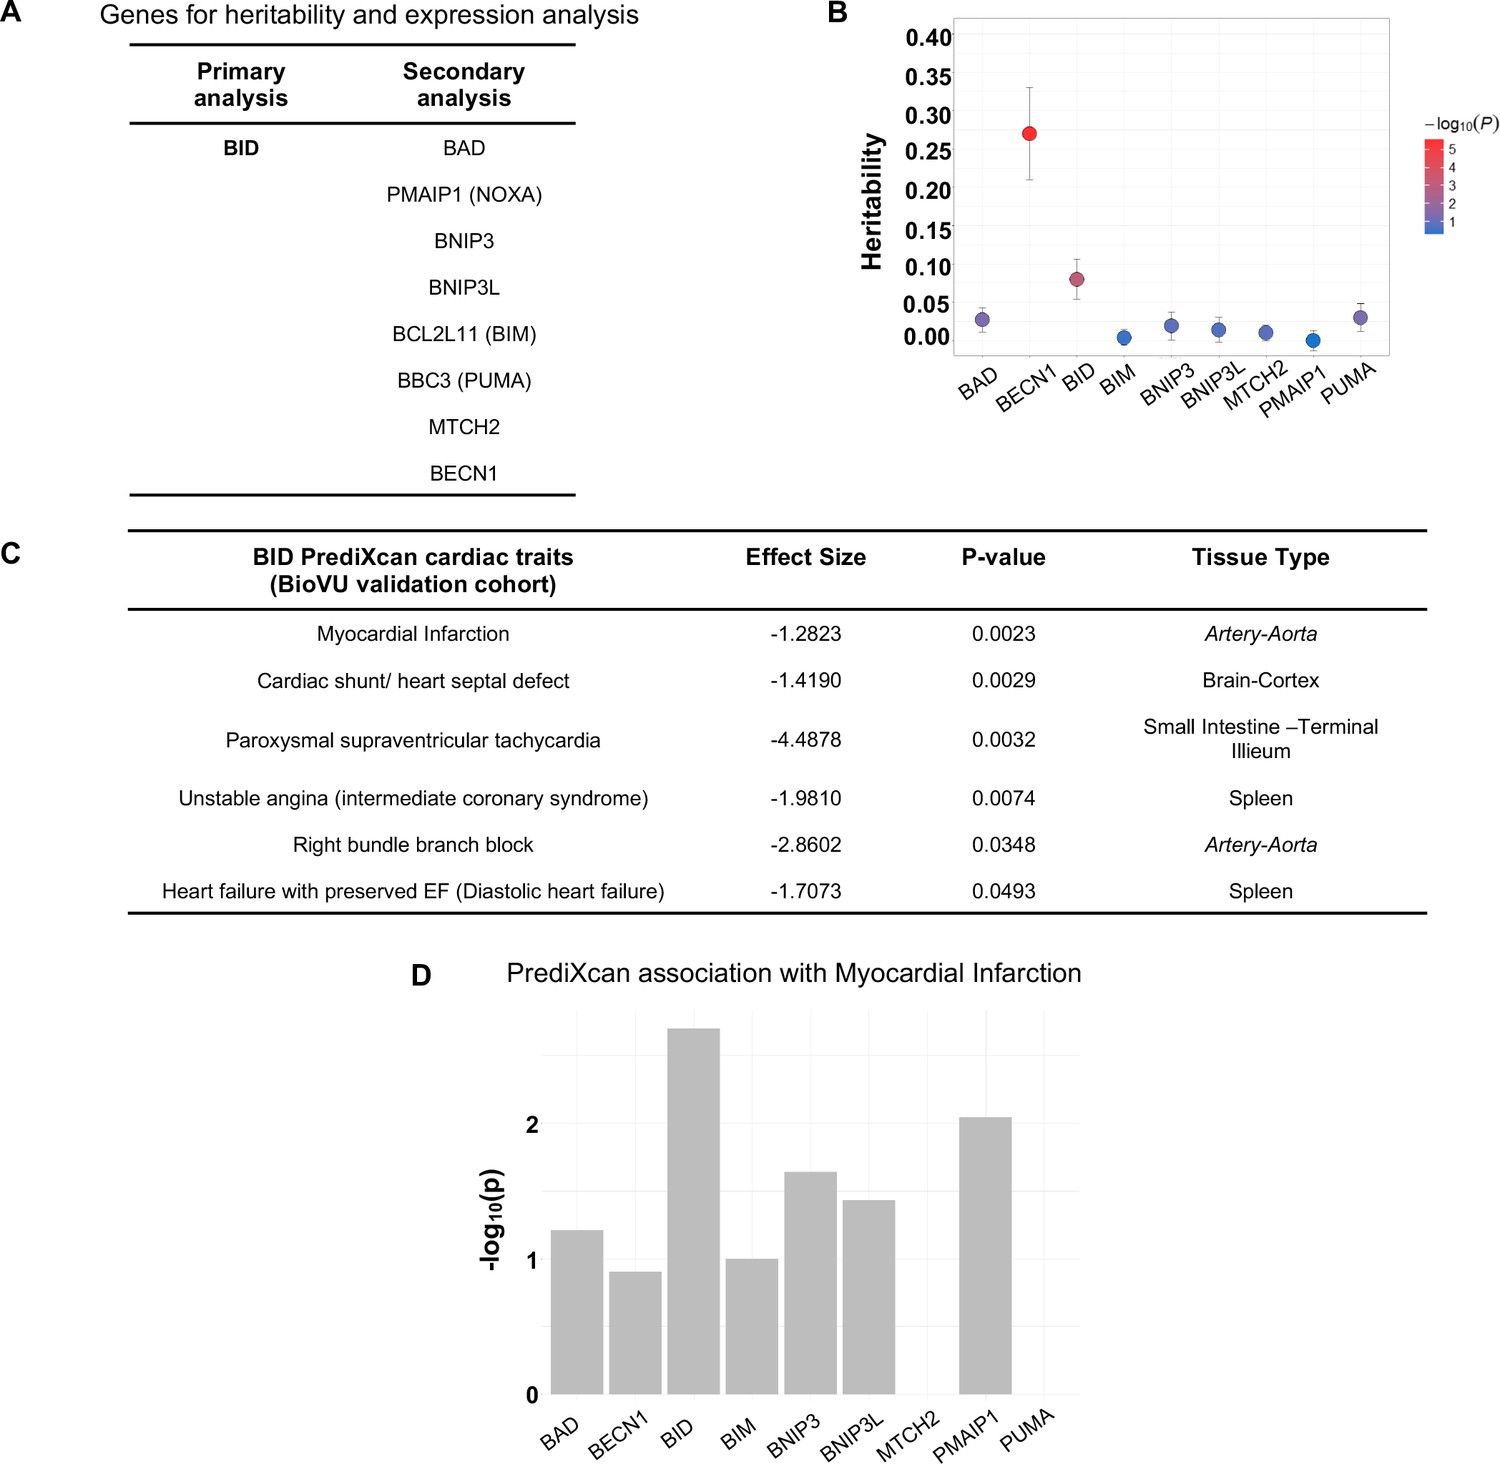
BID and BECN1 are significantly heritable and PrediXcan reveals significantly decreased BID expression for cardiac traits.
(A) Table of genes used for heritability and expression analysis. BID was analyzed in a primary analysis while all other genes encompassed a secondary analysis. (B) Heritability analysis for all indicated genes. Only BECN1 and BID were found to be significantly heritable. (C) Table of BID traits with associated p-values, effect size, and tissue type for all significant traits. (D) PrediXcan analysis results for gene expression and association with MI in BID and secondary analysis of all other genes.
Figure 7—figure supplement 2
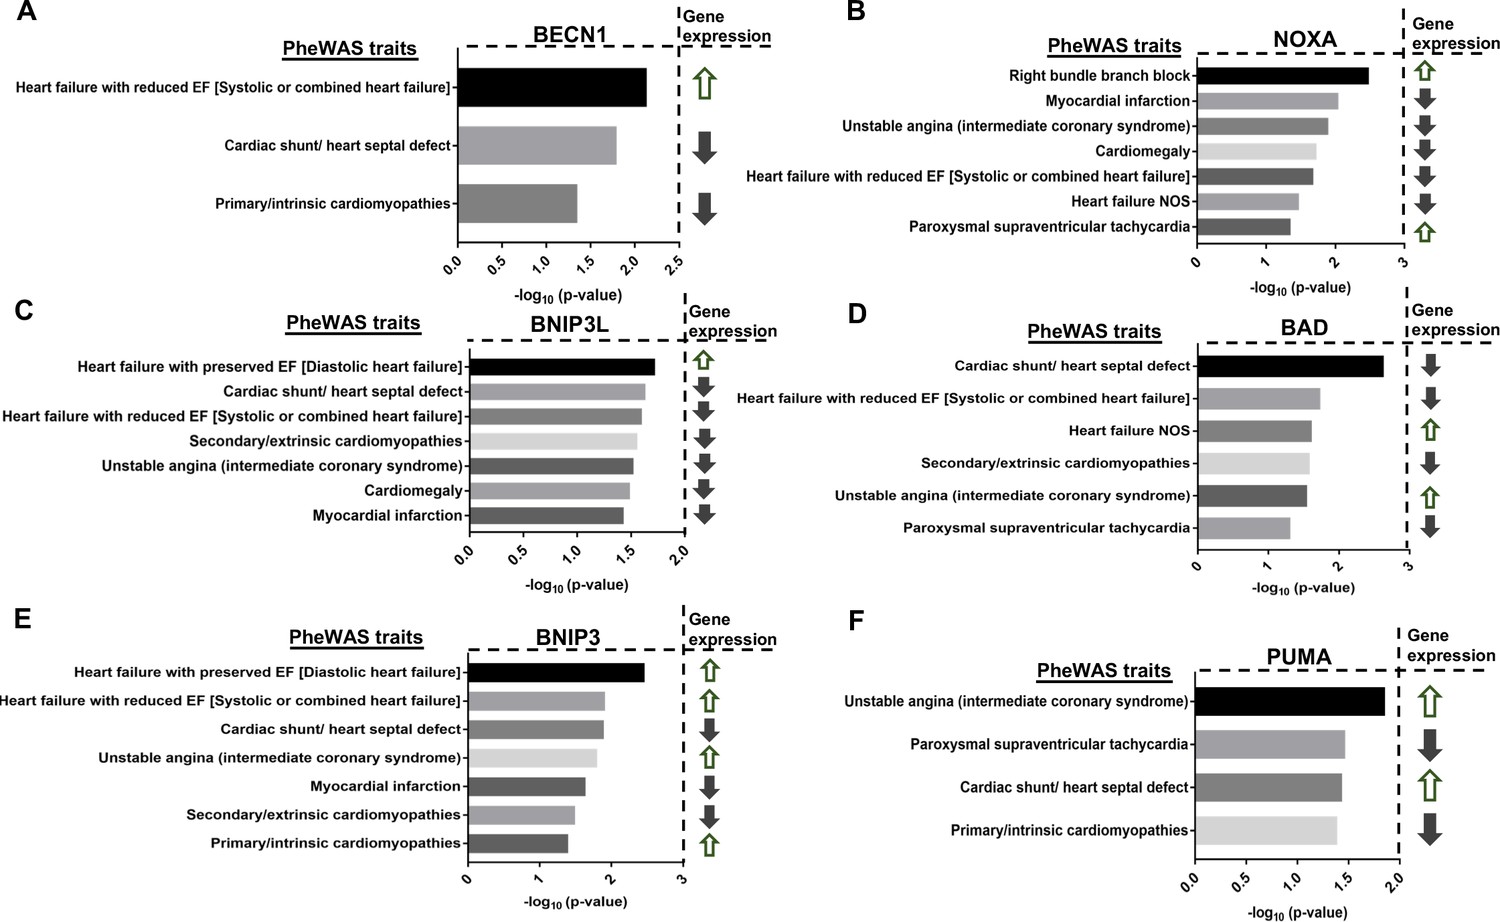
Secondary PrediXcan analysis of BH3-only Bcl-2 family genes shows discordant direction of effect with heart conditions.
(A–F) Graphs of significant cardiac traits in the BioVU validation cohort ranked by p-values (-log10) for BECN1, NOXA, BNIP3L, BAD, BNIP3, and PUMA and the corresponding direction of gene expression. For all genes, cardiac traits that appeared more than once were represented in the graph by the most significant p-value. P-values were determined by logistic regression with disease status as response variable and imputed gene expression as predictor.
Figure 7—figure supplement 3
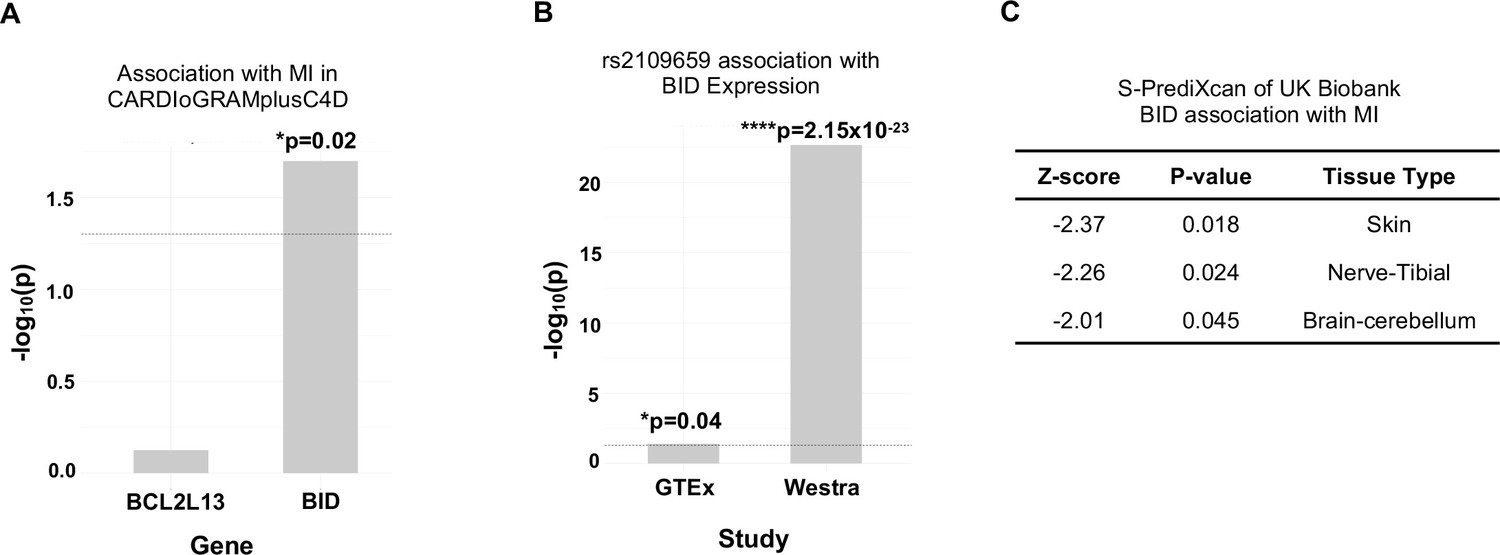
Decreased BID expression is associated with MI in two additional independent cohorts.
(A) PrediXcan analysis in CARDIoGRAMplus C4D for association of BCL2L13 and BID with MI in. (p=0.02, effect size = −0.06, SE = 0.026). (B) Association of SNP rs2109659 with BID gene expression in GTEx (n = 114 lymphoblastoid cells, p=0.04, z-score = −2.05, effect allele = C) and Westra data sets (n = 5311 peripheral blood samples, p=2.15×10⁻²³, z-score = −9.97, effect allele = C).
Figure 8 with 1 supplement
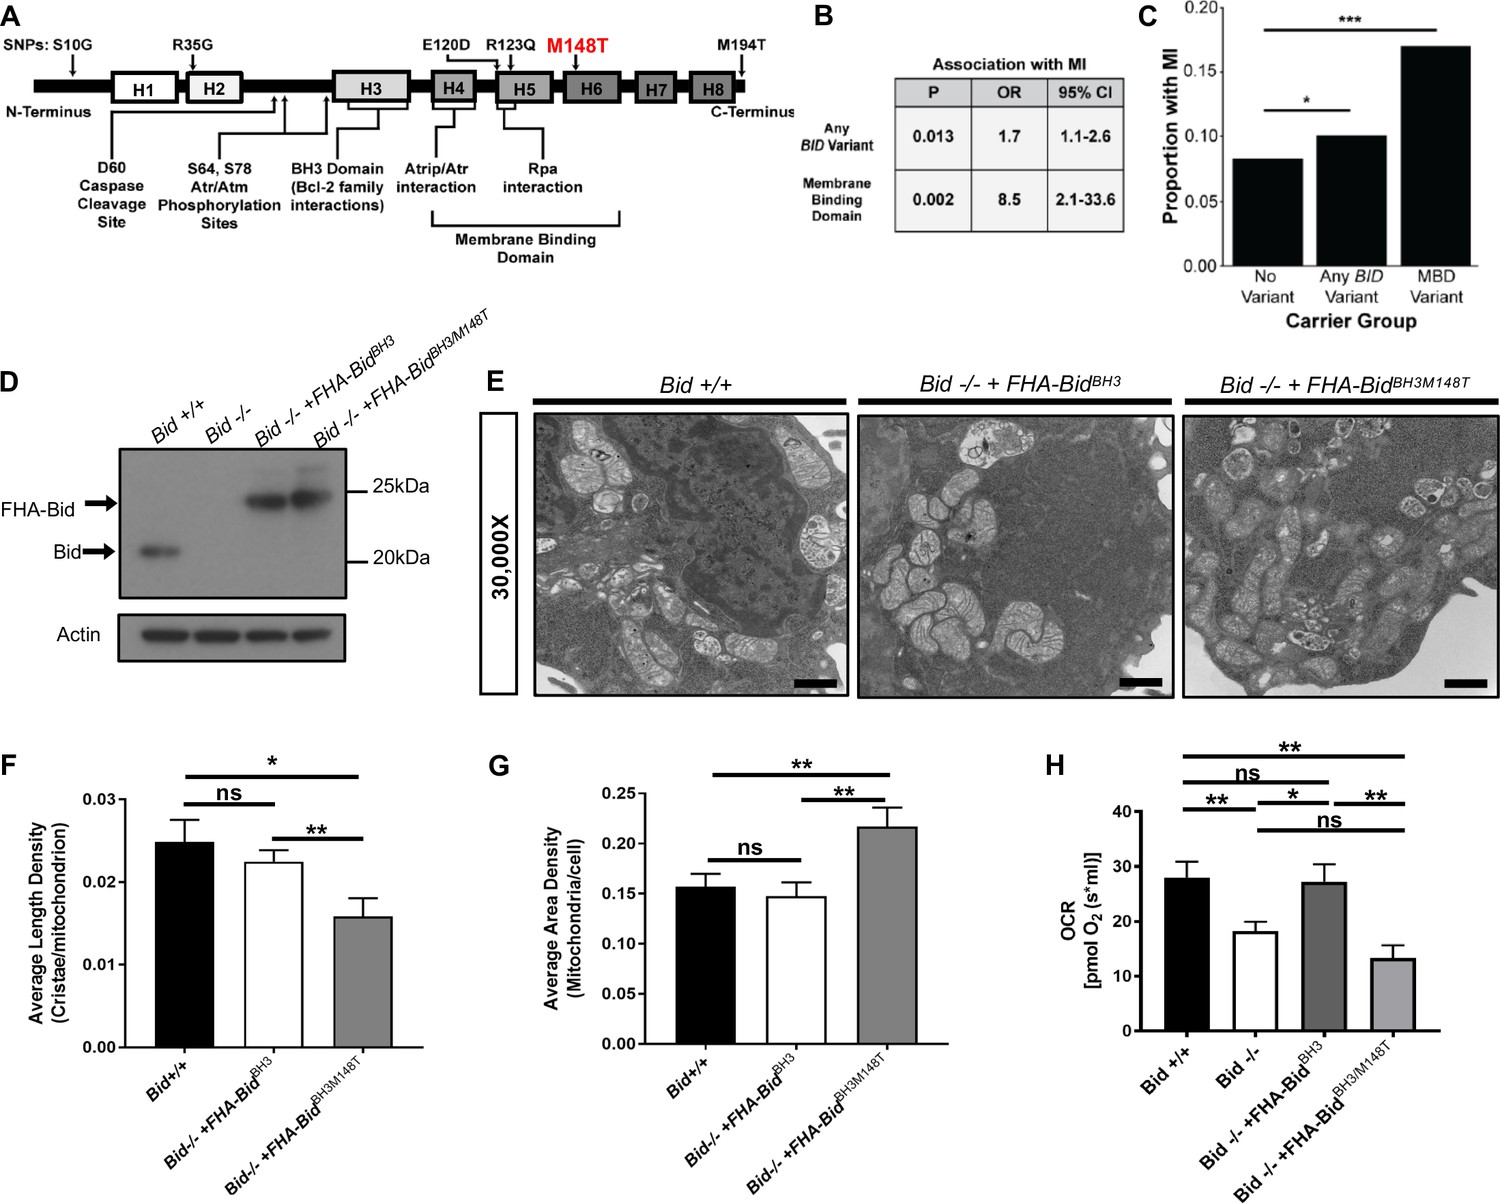
BID coding SNPs associate with myocardial Infarction (MI) in humans and reveal helix-6 SNP M148T is critical for Bid’s regulation of mitochondrial function.
(A) Linear representation of Bid protein structure and approximate SNP locations. Human BID SNPs and several key domains and regions of Bid are indicated. (B) Statistical values including p-value, odds ratio (OR), and 95% confidence interval (95% CI) for Bid SNP association with MI for overall carrier status of BID variants or with variants in the membrane binding domain. (C) Graphical representation of the proportion of patients with MI in carrier groups with no SNPs in BID (no variant), any BID variant, or MBD variant. (D) Western blot of expression levels of Bid for the indicated cell lines. (E) TEM of Bid +/+, Bid-/- + FHABidBHBH3, and Bid-/- + FHABidBHBH3/M148T MPCs. Representative images at 30,000X (scale bar = 500 nm). (F) Quantitation of the number of cristae per mitochondria (average length density) and (G) the mitochondrial density per cell (average area density) of the MPC lines shown in (E). (n = 40,40,15 images per cell line respectively). (H) OCR of Bid +/+, Bid-/-, Bid-/- + FHABidBHBH3, and Bid-/- + FHABidBHBH3/M148T MPCs for all cell lines (n = 6,12,6,5 respectively). P-values were determined by multivariable logistic regression with Bonferroni correction as described in methods for (B) and (C), one-way ANOVA with Student’s t-test for (F) and G), and one-way ANOVA (p<0.05) with Student’s t-test for (H). Error bars indicate ±SEM for all data. ns = not significant, *p<0.05, **p<0.01, and ***p<0.001.
-
Figure 8—source data 1
Data for Figure 8 and Figure 8—figure supplement 1.
- https://doi.org/10.7554/eLife.40907.024
Figure 8—figure supplement 1
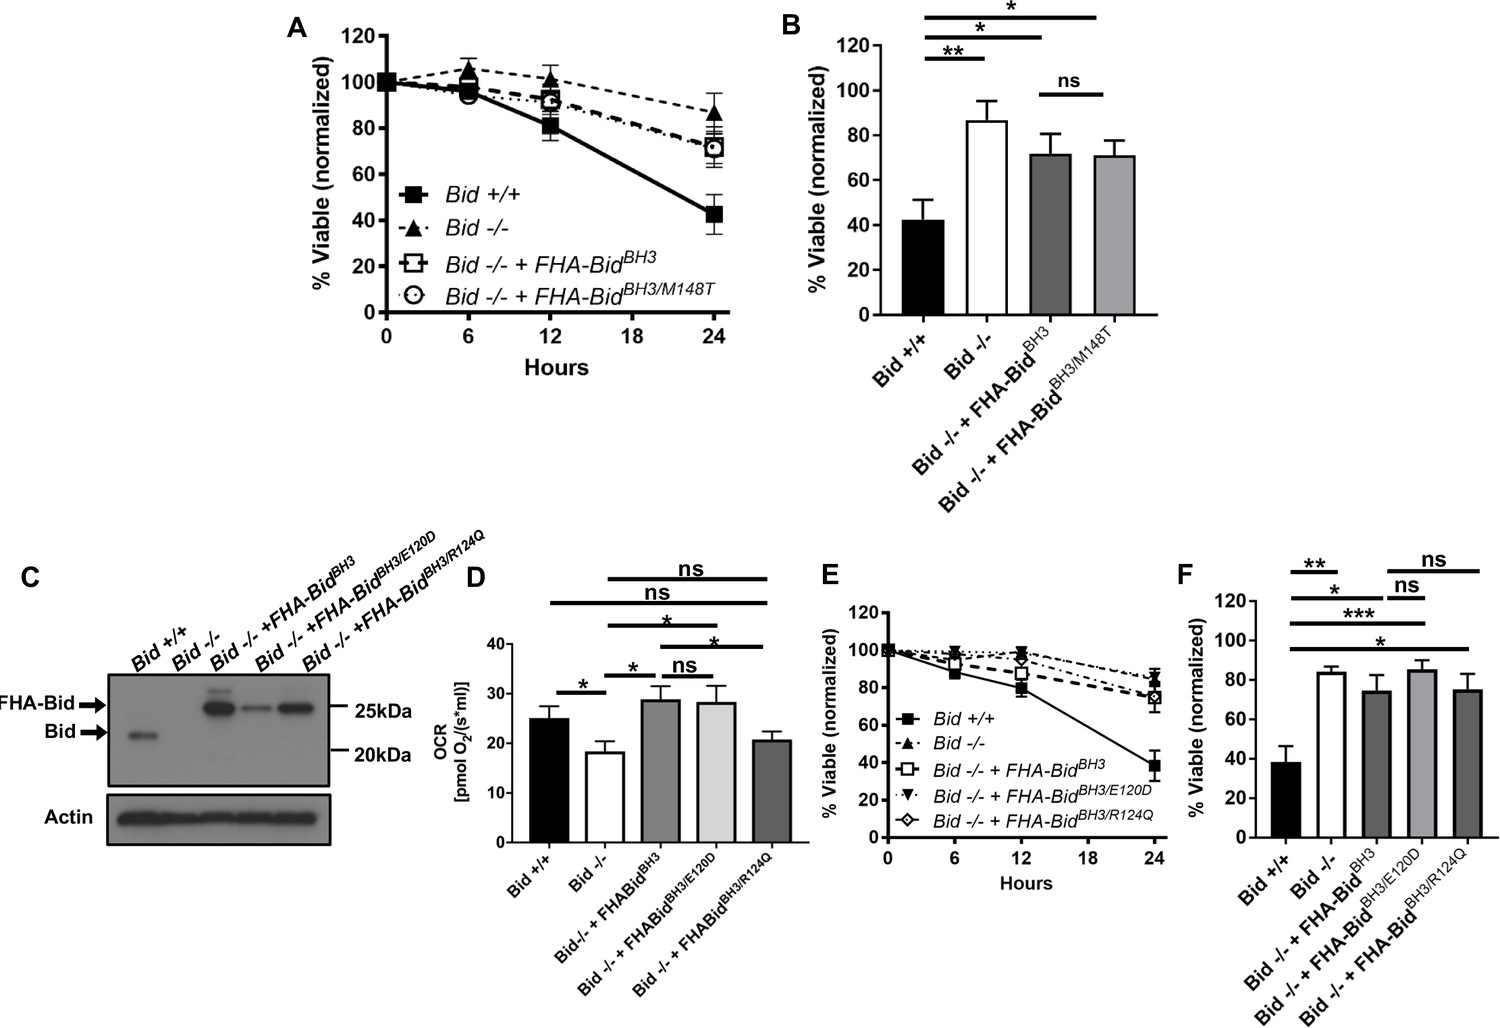
Mutations in Bid corresponding to Helix-5 SNPs show less impact on respiration than Helix-6 mutation M148T.
(A) Viability assay (AV/PI) for indicated cell lines corresponding to Figure 8 and (B) the 24 hr time-point (n = 5). (C) Western blot of expression levels of Bid for the indicated genotypes. (D) OCR of Bid-/-, Bid-/- + FHABidBHBH3, Bid-/- + FHABidBHBH3/E120D, and Bid-/- + FHABidBHBH3/R124Q MPCs for all cell lines (n = 4,4,6,6 respectively). (E) Viability assay (AV/PI) of MPCs for indicated times following TNF-α/Actinomycin D treatment and (F) 24 hr timepoint (n = 3,3,3,6,6 respectively). The percent of viable cells was normalized to no treatment. P-values were determined by one-way ANOVA (p<0.05) with Student’s t-test for (B, D) and (F). Error bars indicate ±SEM for all data. ns = not significant, *p<0.05, **p<0.01, ***p<0.001.
Figure 9 with 1 supplement
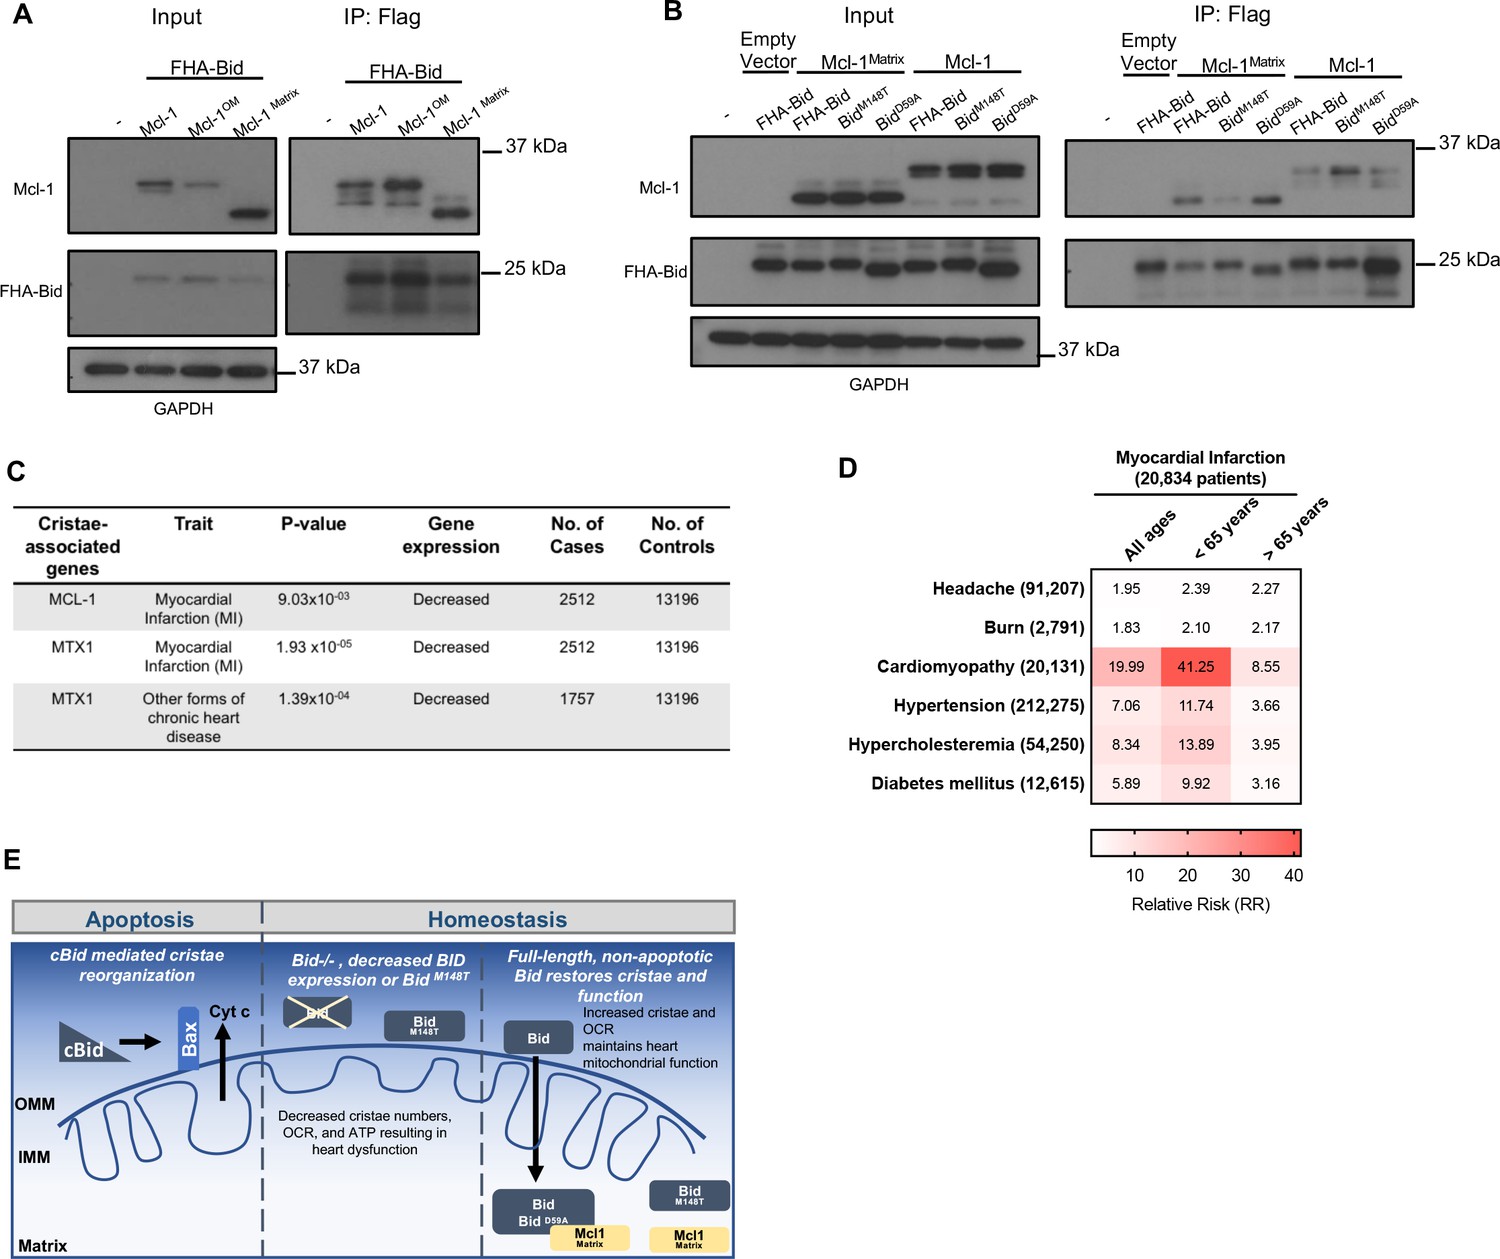
Full-length Bid interacts with Mcl-1Matrix, which is diminished by M148T-mutated Bid.
(A) Immunoprecipitation of FlagHA-Bid with anti-Flag M2 agarose beads from 293T whole cell lysate overexpressing FHA-Bid and one of the indicated Mcl-1 constructs: Mcl-1 (WT), Mcl-1OM (outer membrane), or Mcl-1Matrix. (B) Immunoprecipitation as in A with the indicated Bid constructs overexpressed with either empty vector (MSCV), Mcl-1 (WT) or Mcl-1Matrix in 293 T cells. Input represents approximately 1/70th of total protein used for immunoprecipitation. (C) PrediXcan analysis of proteins previously found to be involved in cristae stability. MTX1 = Metaxin1. (D) Contingency table of patients queried in the BioVU Synthetic Derivative for MI and the indicated diseases (left) identified by ICD9 code. Patient numbers are indicated in parenthesis and values in the heat map indicate the raw relative risk (RR) values. p=3.944×10⁻¹⁶ for MI v burn or headache (control diseases) and p<2.2×10⁻¹⁶ for MI v all other diseases. (E) Proposed model for a full-length Bid’s homeostatic role in regulating mitochondrial cristae structure. Bid can localize to the matrix where its association with Mcl-1 (directly or indirectly) facilitates the stabilization of respiratory complexes and cristae structure. This interaction is diminished by M148T-mutated Bid.
Figure 9—figure supplement 1
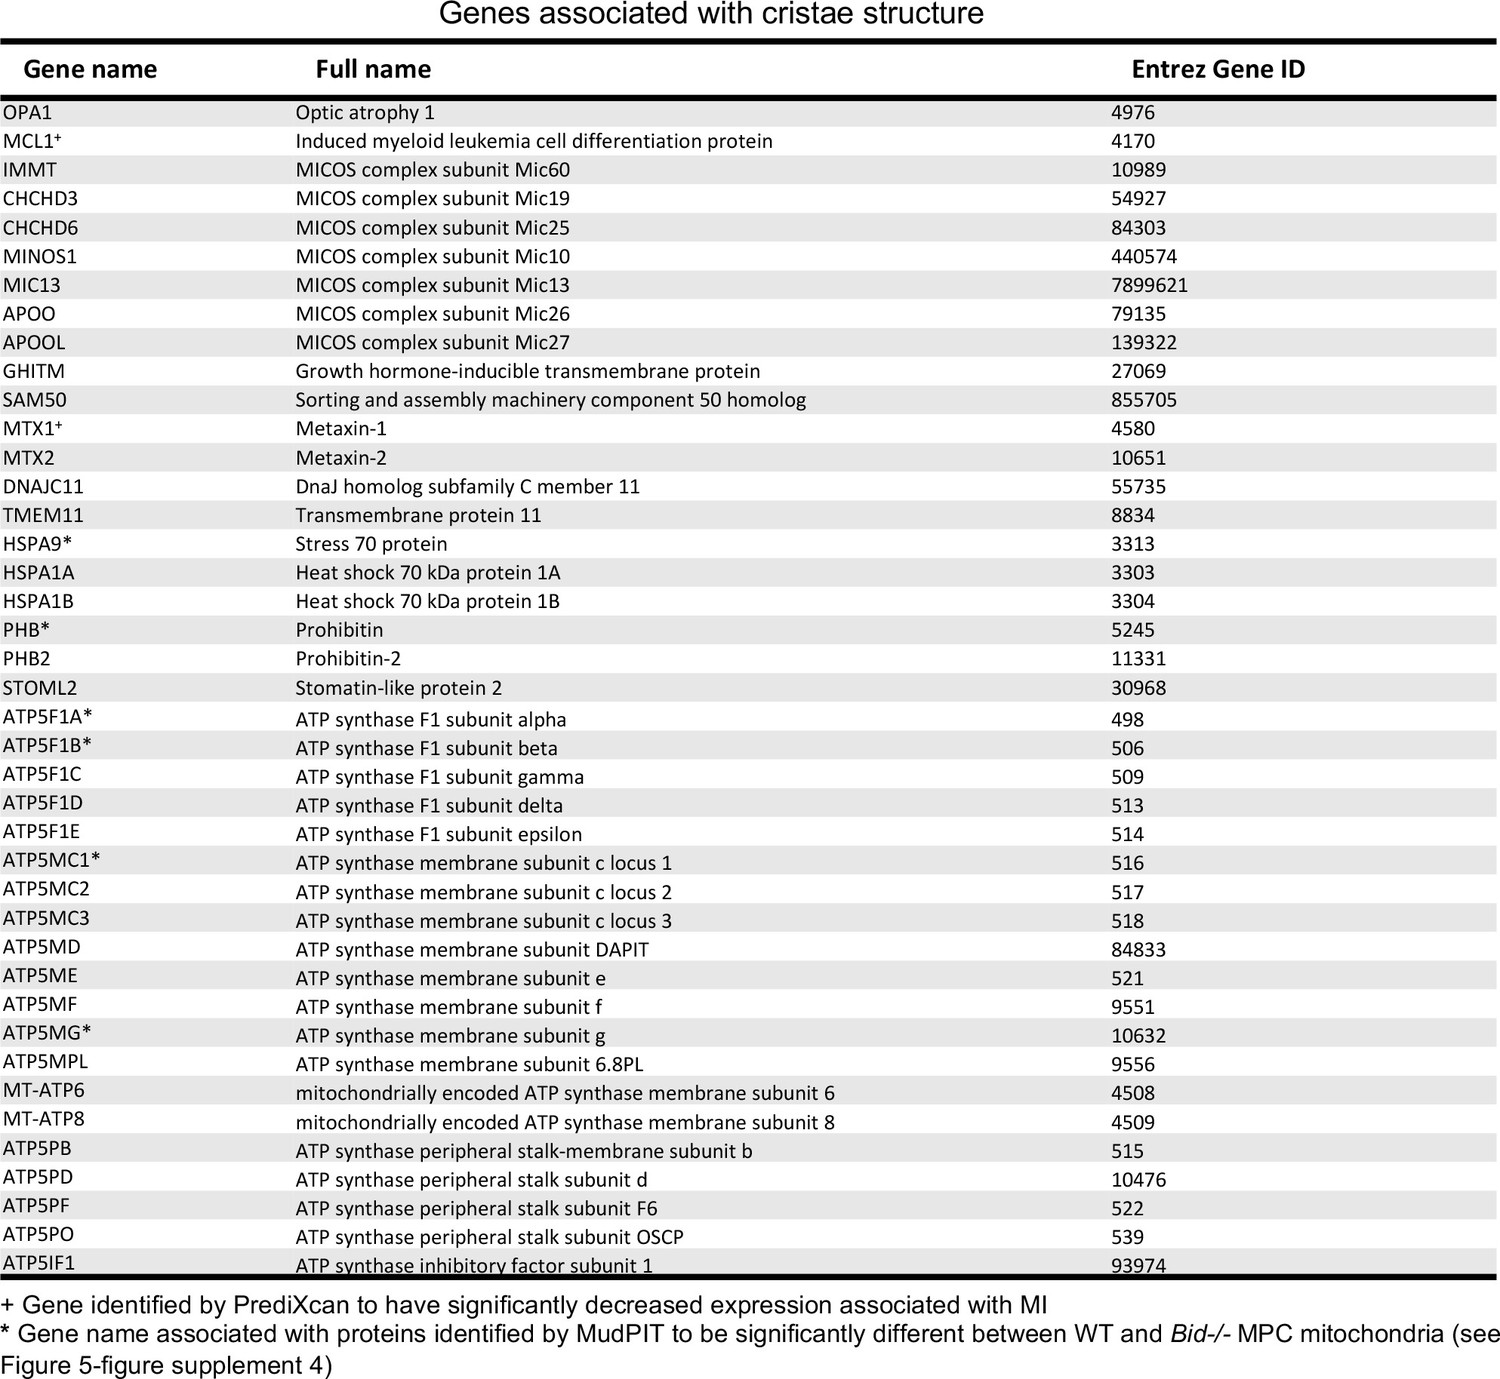
Table of cristae structure associated genes analyzed by PrediXcan.
A total of 41 genes with known associations to cristae structure. Genes are identified by their names and unique Entrez Gene ID.
Tables
Key resources table
| Reagent type (species) or resource | Designation | Source or reference | Identifiers | Additional information |
|---|---|---|---|---|
| Strain, strain background (mus musculus, C57BL/6J) | The Jackson Laboratory | Stock No: 000664 (Black 6) RRID:IMSR_JAX:000664 | ||
| Strain, strain background (mus musculus, C57BL/SJ) | Bid-/- | PMID: 10476969 | ||
| Cell line (mouse) | Myeloid Progenitor Cells (MPCs) | PMID: 16122425 | ||
| Gene (mouse) | BID (BH3 interacting death domain agonist) | PMID: 8918887 NCBI Reference | MGI:108093 NM_007544.4 | |
| Transfected construct | pOZ-FH-C-hCD25 | PMID: 14712665 | Available from Addgene (plasmid #32516) | |
| Transfected construct (pOZ-FH-C-hCD25 vector) | FHA-Bid | PMID: 8918887 | ||
| Transfected construct (pOZ-FH-C-hCD25 vector) | FHA-BidBH3 | PMID: 8918887 | ||
| Transfected construct (pOZ-FH-C-hCD25 vector) | FHA-BidD59A | PMID: 12519725 | ||
| Transfected construct (pOZ-FH-C-hCD25 vector) | FHA-BidBH3AA | This paper | Mutant made with site directed mutagenesis of FHA-BidBH3 construct; Zinkel Laboratory; See Table 1 for primer sequences | |
| Transfected construct (pOZ-FH-C-hCD25 vector) | FHA-BidBH3/M148T | This paper | Mutant made with site directed mutagenesis of FHA-BidBH3 construct; Zinkel Laboratory; See Table 1 for primer sequences | |
| Transfected construct (pOZ-FH-C-hCD25 vector) | FHA-BidM148T | This paper | Mutant made with site directed mutagenesis of FHA-Bid construct; Zinkel Laboratory; SeeTable 1 for primer sequences | |
| Transfected construct (pOZ-FH-C-hCD25 vector) | FHA-BidBH3/E120D | This paper | Mutant made with site directed mutagenesis of FHA-BidBH3 construct; Zinkel Laboratory; See Table 1 for primer sequences | |
| Transfected construct (pOZ-FH-C-hCD25 vector) | FHA-BidBH3/R124Q | This paper | Mutant made with site directed mutagenesis of FHA-BidBH3 construct; Zinkel Laboratory; See Table 1 for primer sequences | |
| Antibody | Bid (goat polyclonal) | R and D systems | AF860 RRID: AB_2065622 | 1:1000 (5% milk, Western Blot (WB)) |
| Antibody | Bid (rabbit polyclonal) | PMID: 8918887 | Antibody generated by S. Korsmeyer Lab | 1:1000 (5% milk, WB) |
| Antibody | Bim (H-5, mouse monoclonal) | Santa Cruz Biotech-nology | sc-3743589 RRID: AB_10987853 | 1:100 (5% milk, WB) |
| Antibody | Bad (Clone 48, mouse) | BD Biosciences | 610391 RRID: AB_397774 | 1:500 ((5% milk, WB) |
| Antibody | Puma/bbc3, N-terminal (rabbit) | Sigma-Aldrich | P4743 RRID: AB_477351 | 1:1000 (5% milk, WB) |
| Antibody | Anti-HA (rabbit polyclonal) | Sigma-Aldrich | H6908 RRID: AB_260070 | 1:1000 (5% milk, WB) |
| Antibody | VDAC1 (rabbit polyclonal) | Abcam | ab15895 RRID: AB_2214787 | 1:1000 (5% milk, WB) |
| Antibody | β-Actin (AC-15, mouse monoclonal) | Sigma-Aldrich | A5441 RRID: AB_476744 | 1:200,000 (5% milk, WB) |
| Antibody | Anti-GAPDH (FL-335, rabbit polyclonal) | Santa Cruz Biotech-nology | sc-25778 RRID: AB_10167668 | 1:1000 (5% milk, WB) |
| Antibody | Bak, NT (rabbit polyclonal) | EMD Millipore | Cat #06–536 RRID: AB_310159 | 1:1000 (5% milk, WB) |
| Antibody | MnSOD (rabbit polyclonal) | Stressgen | ADI-SOD-111 RRID: AB_10631750 | 1:1000 (5% milk, WB) |
| Antibody | Mcl-1 (rabbit polyclonal) | Rockland Immunochemi-cals Inc | 600-401-394S RRID: AB_2266446 | 1:1000 (5% milk, WB) |
| Antibody | Opa-1 (Clone 18, mouse) | BD Biosciences | 612606 RRID: AB_399888 | 1:1000 (5% milk, WB) |
| Antibody | Calreticulin (D3E6, XP, rabbit monoclonal) | Cell Signaling Technology | 12238 RRID: AB_2688013 | 1:1000 (5% milk, WB) |
| Antibody | Anti-pyruvate dehydrogenase E2/E3 (mouse monoclonal) | Abcam | ab110333 RRID: AB_10862029 | 1:1000 (5% milk, WB) |
| Antibody | Amersham ECL anti-rabbit IgG, HRP- linked (from donkey) | GE Healthcare | NA934 RRID: AB_772206 | 1:10,000 (5% milk, WB) |
| Antibody | Goat anti-mouse IgG, HRP-conjugate | Novex | A16072 RRID:AB_2534745 | 1:10,000 (5% milk, WB) |
| Antibody | Donkey anti-goat IgG HRP | Santa Cruz Biotech-nology | sc-2020 RRID:AB_631728 | 1:10,000 (5% milk, WB) |
| Chemical compound, drug | Doxorubicin HCl (Dox) | APP Fresenius Kabi USA, LCC | NDC 63323-883-05 | |
| Chemical compound, drug | Epinephrine (Epi) | BPI Labs, LLC | NDC 54288-103-10 | |
| Chemical compound, drug | Fugene 6 Transfection Reagent | Promega | E2691 | |
| Chemical compound, drug | Lipofectamine 2000 Transfection Reagent | ThermoFisher Scientific | 11668027 | |
| Commercial assay or kit | QuikChange XL Site -Directed Mutagenesis Kit, 10 rxn | Agilent Technologies | 200521 | |
| Commercial assay or kit | GeneJET Plasmid Miniprep Kit | Thermo-Fisher Scientific (Thermo Scientific) | K0503 | |
| Commercial assay or kit | GenElute HP Plasmid Maxiprep Kit | Sigma-Aldrich | NA0310-1KT | |
| Commercial assay or kit | PureLink HiPure Plasmid Maxiprep Kit | Thermo-Fisher Scientific (Invitrogen) | K210006 | |
| Software, algorithm | PrediXcan | PMID: 26258848 and other | https://github.com/hakyimlab/PrediXcan | |
| Software, algorithm | S-PrediXcan | Other | https://github.com/hakyimlab/MetaXcan | |
| Other | CARDIoGRAMplusC4D | Other | www.CARDIOGRAMPLUSC4D.ORG | |
| Other | GTEx Consortium (v6p) | PMID: 29022597 and other | http://www.gtexportal.org |
Table 1
Site-directed mutagenesis primer sequences for Bid
https://doi.org/10.7554/eLife.40907.027| Primer (Bid mutant) | Sequence |
|---|---|
| M148T | Fwd: 5’ GGAGAACGACAAGGCCATGCTGATAATGACAATGC 3' |
| Rev: 5' GCATTGTCATTATCAGCATGGCCTTGTCGTTCTCC 3' | |
| E120D | Fwd: 5’ GAATGGCAGCCTGTCGGATGAAGACAAAAGGAAC 3’ |
| Rev: 5’ GTTCCTTTTGTCTTCATCCGACAGGCTGCCATTC 3’ | |
| R123Q | Fwd: 5’ GTCGGAGGAAGACAAAAGGAACTGCC GGCCAAAG 3’ |
| Rev: 5’ CTTTGGCCAGGCAGTTCCTTTTGTCTTCCTCCGAC 3’ | |
| S78A | Fwd: 5’CCAGATTCTGAAGCTCAGGAA GAAATCATCCACAACATTGCC3’ |
| Rev: 5’GGCAATGTTGTGGATGATTTCTTCCTGAGCTTCAGAATCTGG3’ | |
| S61A | Fwd: 5’CAGACAGACGGCGCCCAGGCCAGCCGC3’ |
| Rev: 5’GCGGCTGGCCTGGGCGCCGTCTGTCTG3’ |
Additional files
-
Transparent reporting form
- https://doi.org/10.7554/eLife.40907.028
Download links
A two-part list of links to download the article, or parts of the article, in various formats.
Downloads (link to download the article as PDF)
Open citations (links to open the citations from this article in various online reference manager services)
Cite this article (links to download the citations from this article in formats compatible with various reference manager tools)
Bid maintains mitochondrial cristae structure and function and protects against cardiac disease in an integrative genomics study
eLife 7:e40907.
https://doi.org/10.7554/eLife.40907


