Long-term consequences of the absence of leptin signaling in early life
- University of São Paulo, Brazil
- Federal University of Rio de Janeiro, Brazil
- Queen's University, Canada
Figures
Figure 1
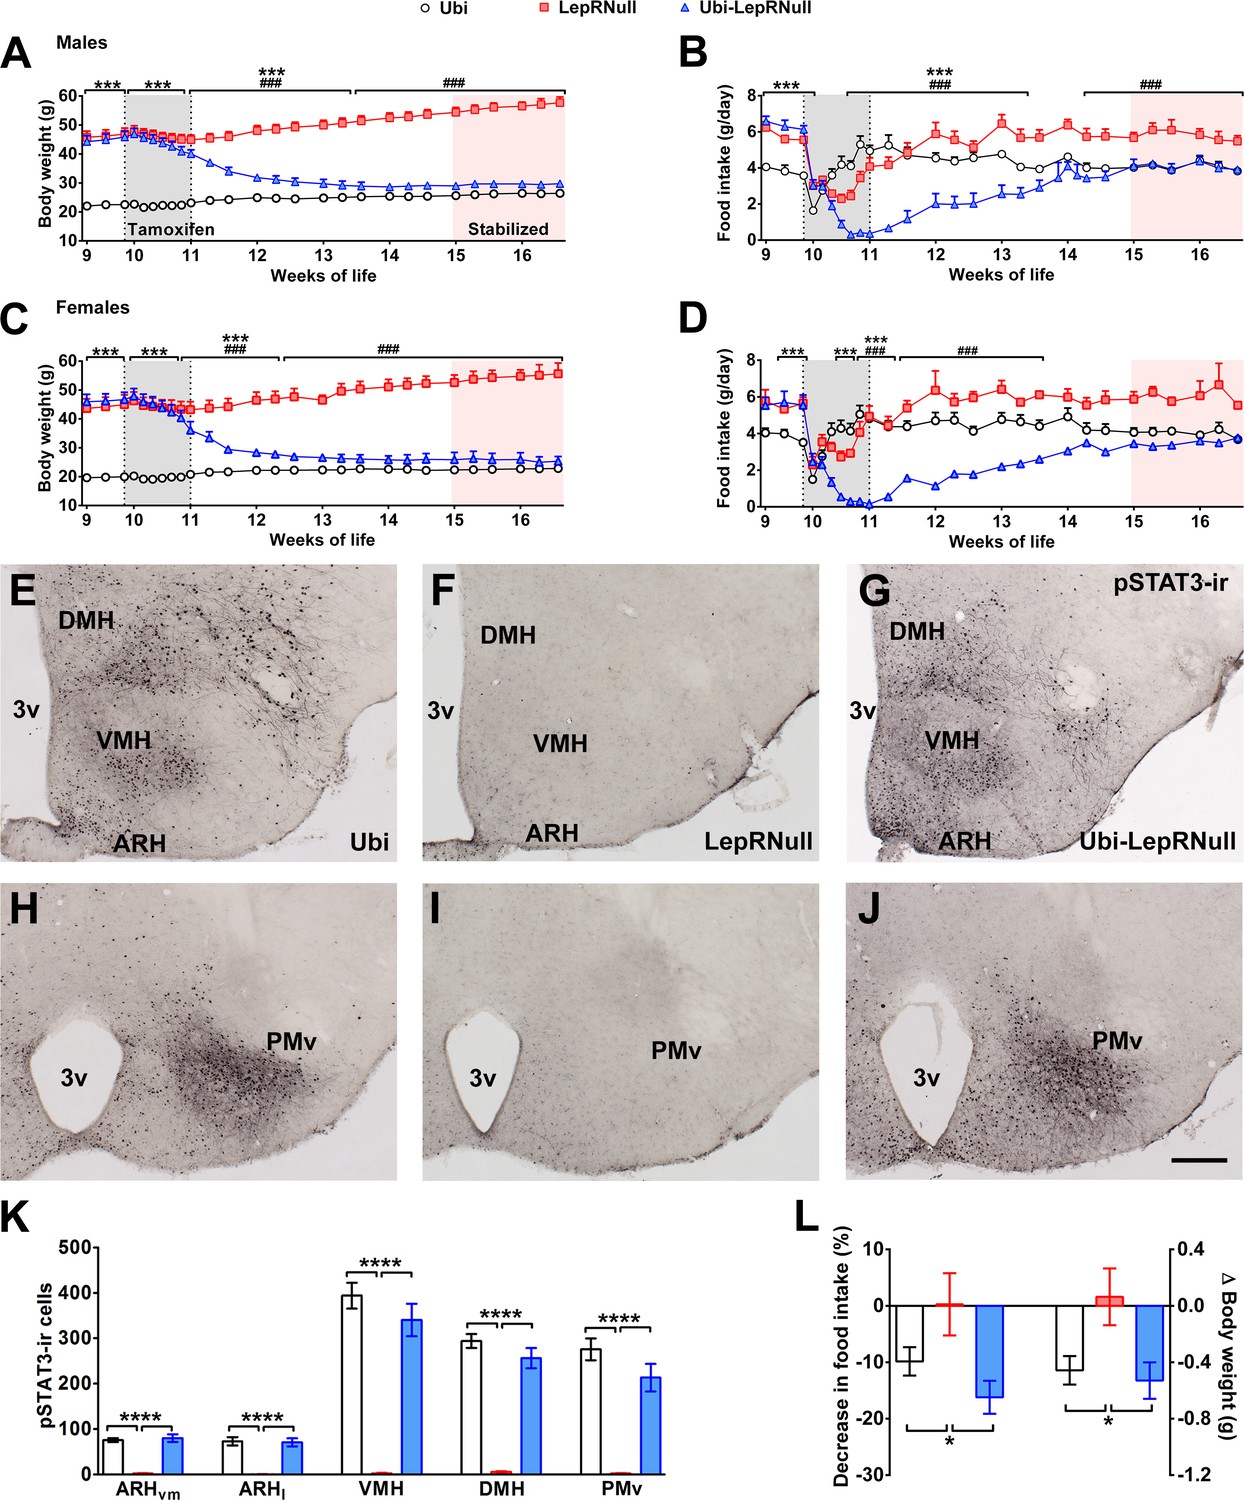
Validation of LepR reactivation in 10-week-old mice.
(A) Body weight of male mice (main effect of Genotype [F(2, 23)=153.7, p<0.0001], main effect of Time [F(24, 552)=22.37, p<0.0001] and interaction [F(48, 552)=105.5, p<0.0001]; n = 6–12) before, during and after tamoxifen treatment at 10 weeks of age. (B) Food intake of male mice (main effect of Genotype [F(2, 23)=14.13, p<0.0001], main effect of Time [F(23, 529)=29.30, p<0.0001] and interaction [F(46, 529)=18.58, p<0.0001]; n = 5–12). (C) Body weight of female mice (main effect of Genotype [F(2, 19)=154.1, p<0.0001], main effect of Time [F(24, 456)=23.75, p<0.0001] and interaction [F(48, 456)=114.5, p<0.0001]; n = 2–16). (D) Food intake of female mice (main effect of Genotype [F(2, 15)=3.779, p=0.0469], main effect of Time [F(23, 345)=8.386, p<0.0001] and interaction [F(46, 345)=5.435, p<0.0001]; n = 1–13). ### p<0.0001 Ubi-LepRNull vs LepRNull mice. ***p<0.0001 Ubi-LepRNull vs Ubi mice. (E–J) Brightfield photomicrographs of pSTAT3 immunoreactive neurons in Ubi (E, H), LepRNull (F, I) and Ubi-LepRNull mice (G, J) after an acute leptin injection (5 µg/g b.w.). 3 v, third ventricle. Scale Bar = 200 µm. (K) Number of pSTAT3 cells after an i.p. leptin injection (n = 5–6). ***p<0.001. (L) Acute changes in food intake (left panel) (F(2, 28)=5.927, *p=0.0071, n = 8–13) and body weight (right panel) (F(2, 33)=4.524, *p=0.0184, n = 8–18) after an i.p. leptin injection (2.5 µg/g b.w.) in comparison to PBS injection (Figure 1—source data 1).
-
Figure 1—source data 1
Data regarding leptin responsiveness.
- https://doi.org/10.7554/eLife.40970.004
Figure 2 with 1 supplement
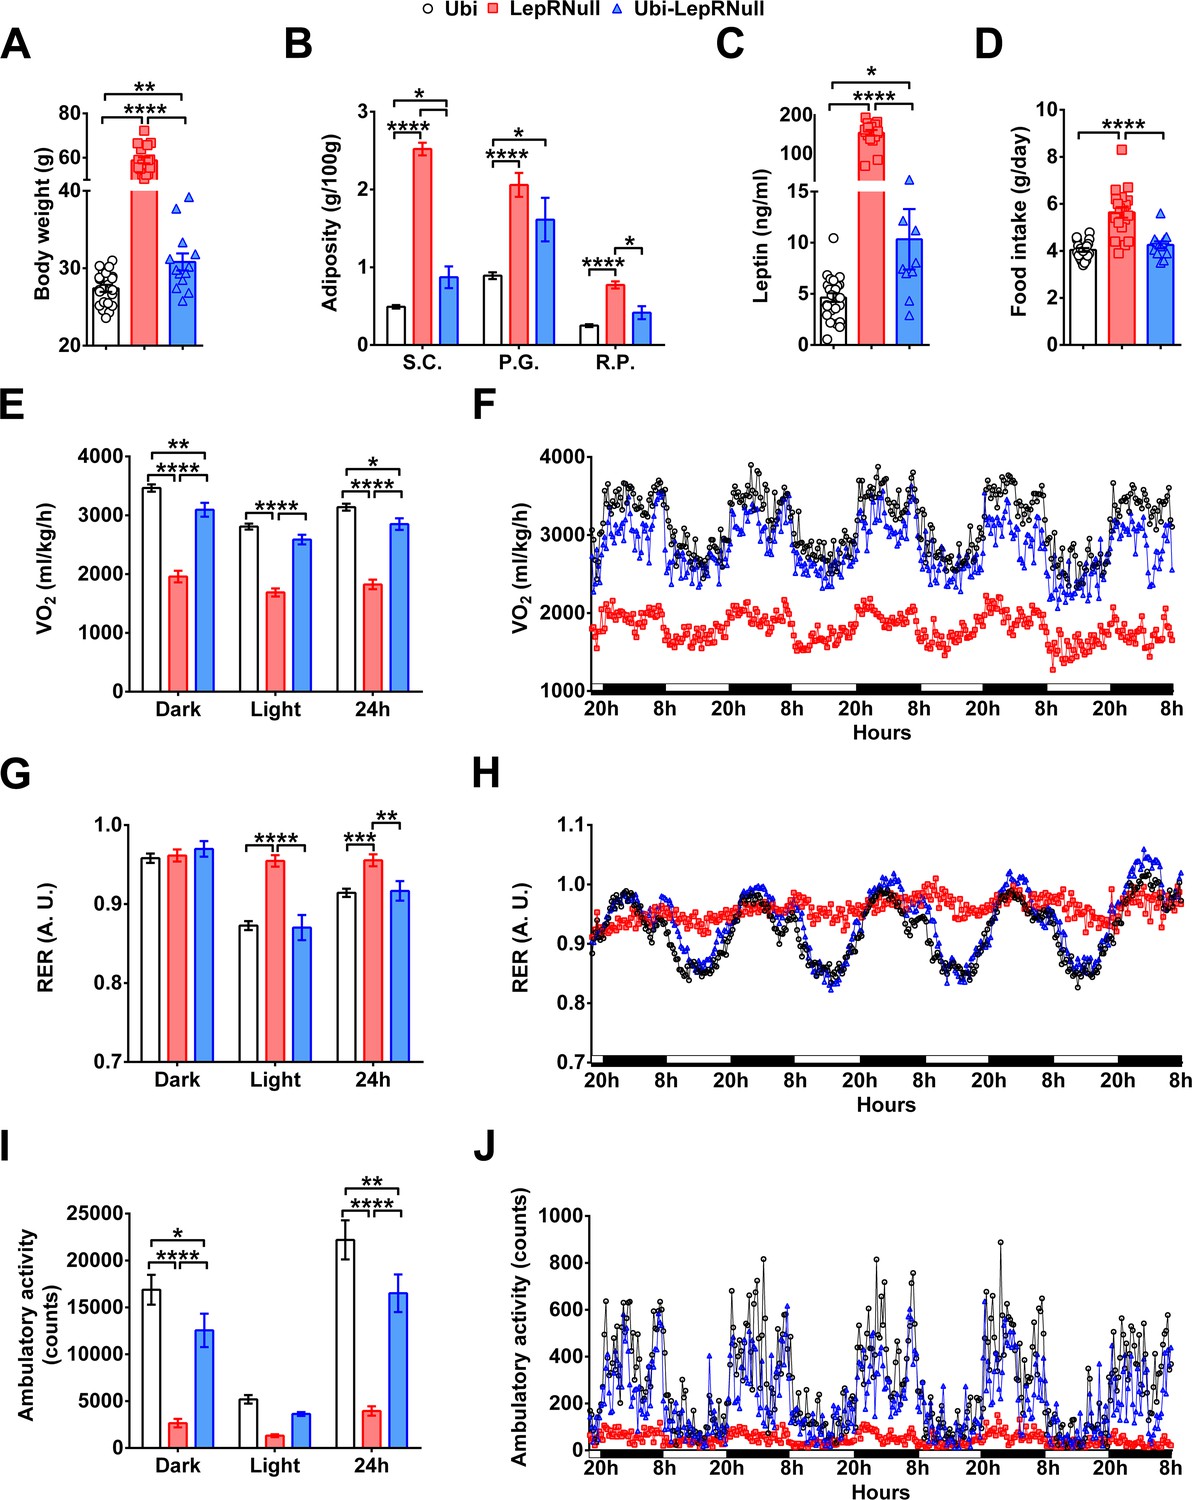
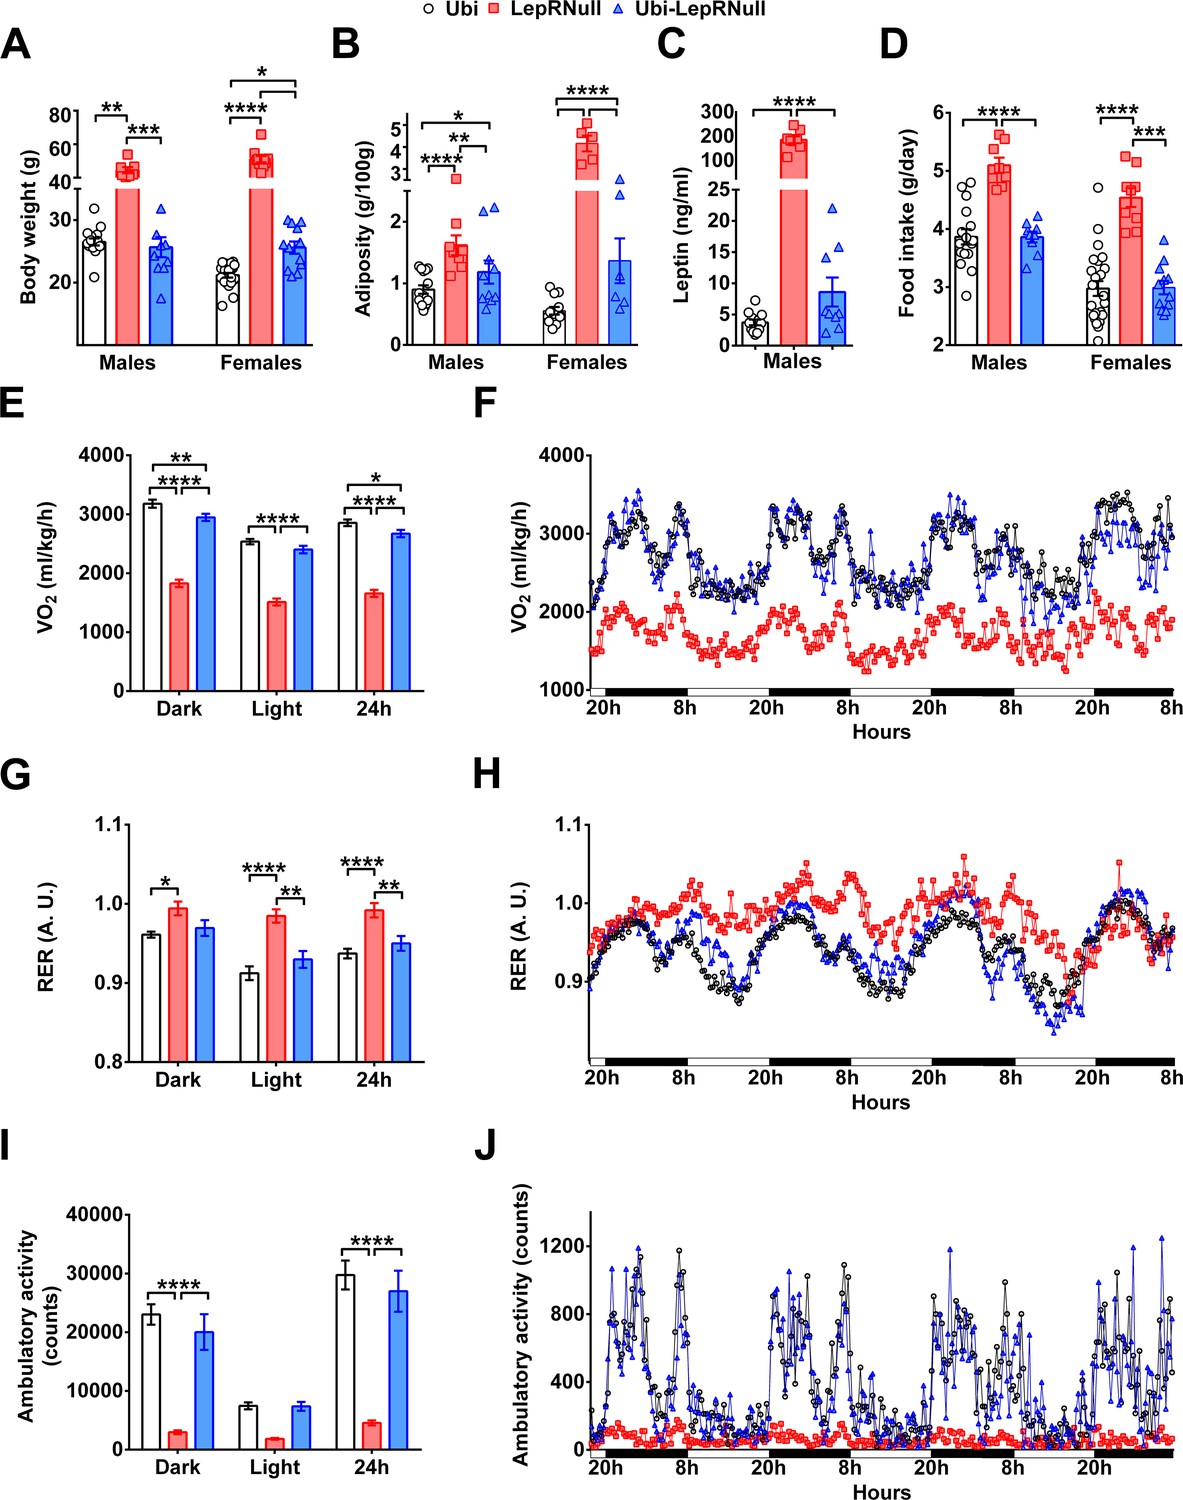
Absence of leptin signaling in early life alters the energy balance and predisposes the animals to obesity.
(A–D) Body weight (n = 13–22), body adiposity (S.C., subcutaneous; P.G., perigonadal; R.P., retroperitoneal fat pads; n = 10–25), serum leptin concentration (n = 9–25) and food intake (n = 13–22) in male mice treated with tamoxifen at 10 weeks of age. (E–F) Energy expenditure (VO2) during dark phase, light phase and 24 hr in male mice (n = 9–15). (G–H) Respiratory exchange ratio (RER) in male mice (n = 9–15). (I–J) Voluntary ambulatory activity in male mice (n = 9–15). *p<0.05; **p<0.01; ***p<0.001; ****p<0.0001 (Figure 2—source data 1).
-
Figure 2—source data 1
Data regarding changes in energy balance in male mice.
- https://doi.org/10.7554/eLife.40970.008
Figure 2—figure supplement 1
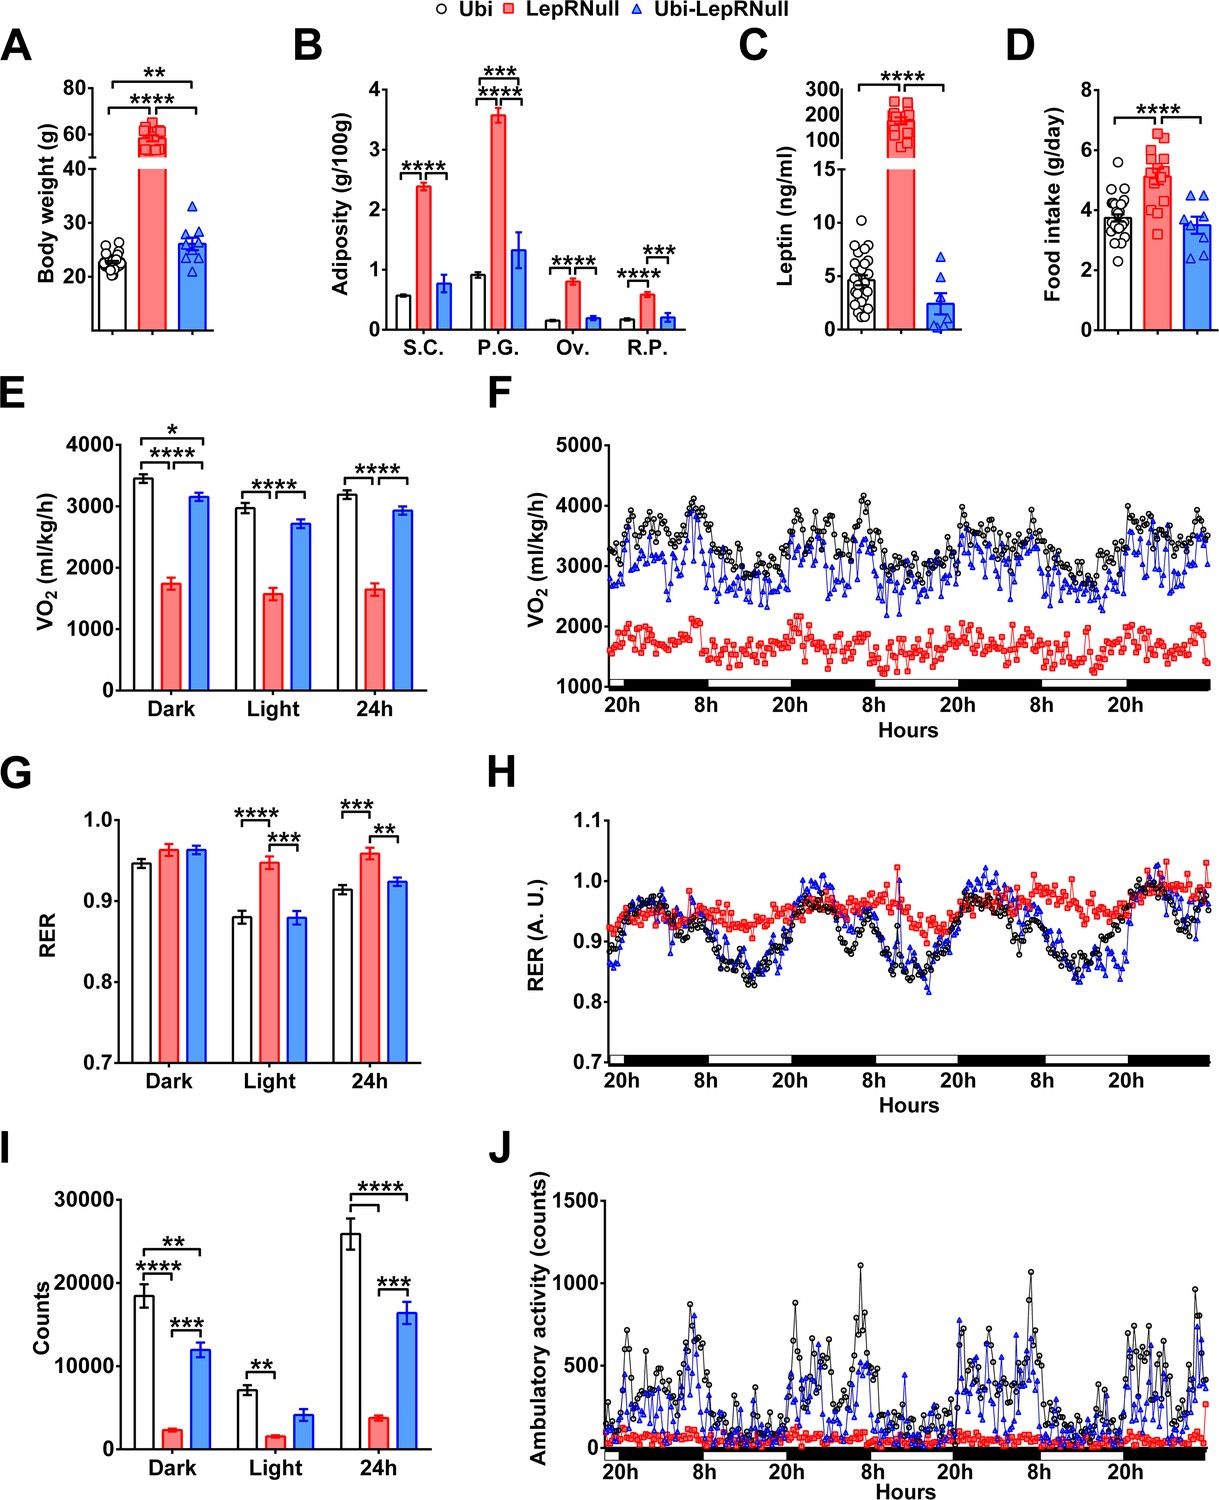
LepR reactivation in adult females does not restore completely the energy homeostasis.
(A–D) Body weight (n = 9–33), body adiposity (S.C., subcutaneous; P.G., perigonadal; Ov., ovarian; R.P., retroperitoneal fat pads; n = 8–45), serum leptin concentration (n = 8–26) and food intake (n = 8–30) in female mice treated with tamoxifen at 10 weeks of age. (E–F) Energy expenditure (VO2) during dark phase, light phase and 24 hr in female mice (n = 5–10). (G–H) Respiratory exchange ratio (RER) in female mice (n = 5–10). (I–J) Voluntary ambulatory activity in female mice (n = 4–12). *p<0.05; **p<0.01; ***p<0.001; ****p<0.0001. Mean ±S.E.M (Figure 2—figure supplement 1—source data 1).
-
Figure 2—figure supplement 1—source data 1
Data regarding energy balance in female mice.
- https://doi.org/10.7554/eLife.40970.007
Figure 3 with 2 supplements
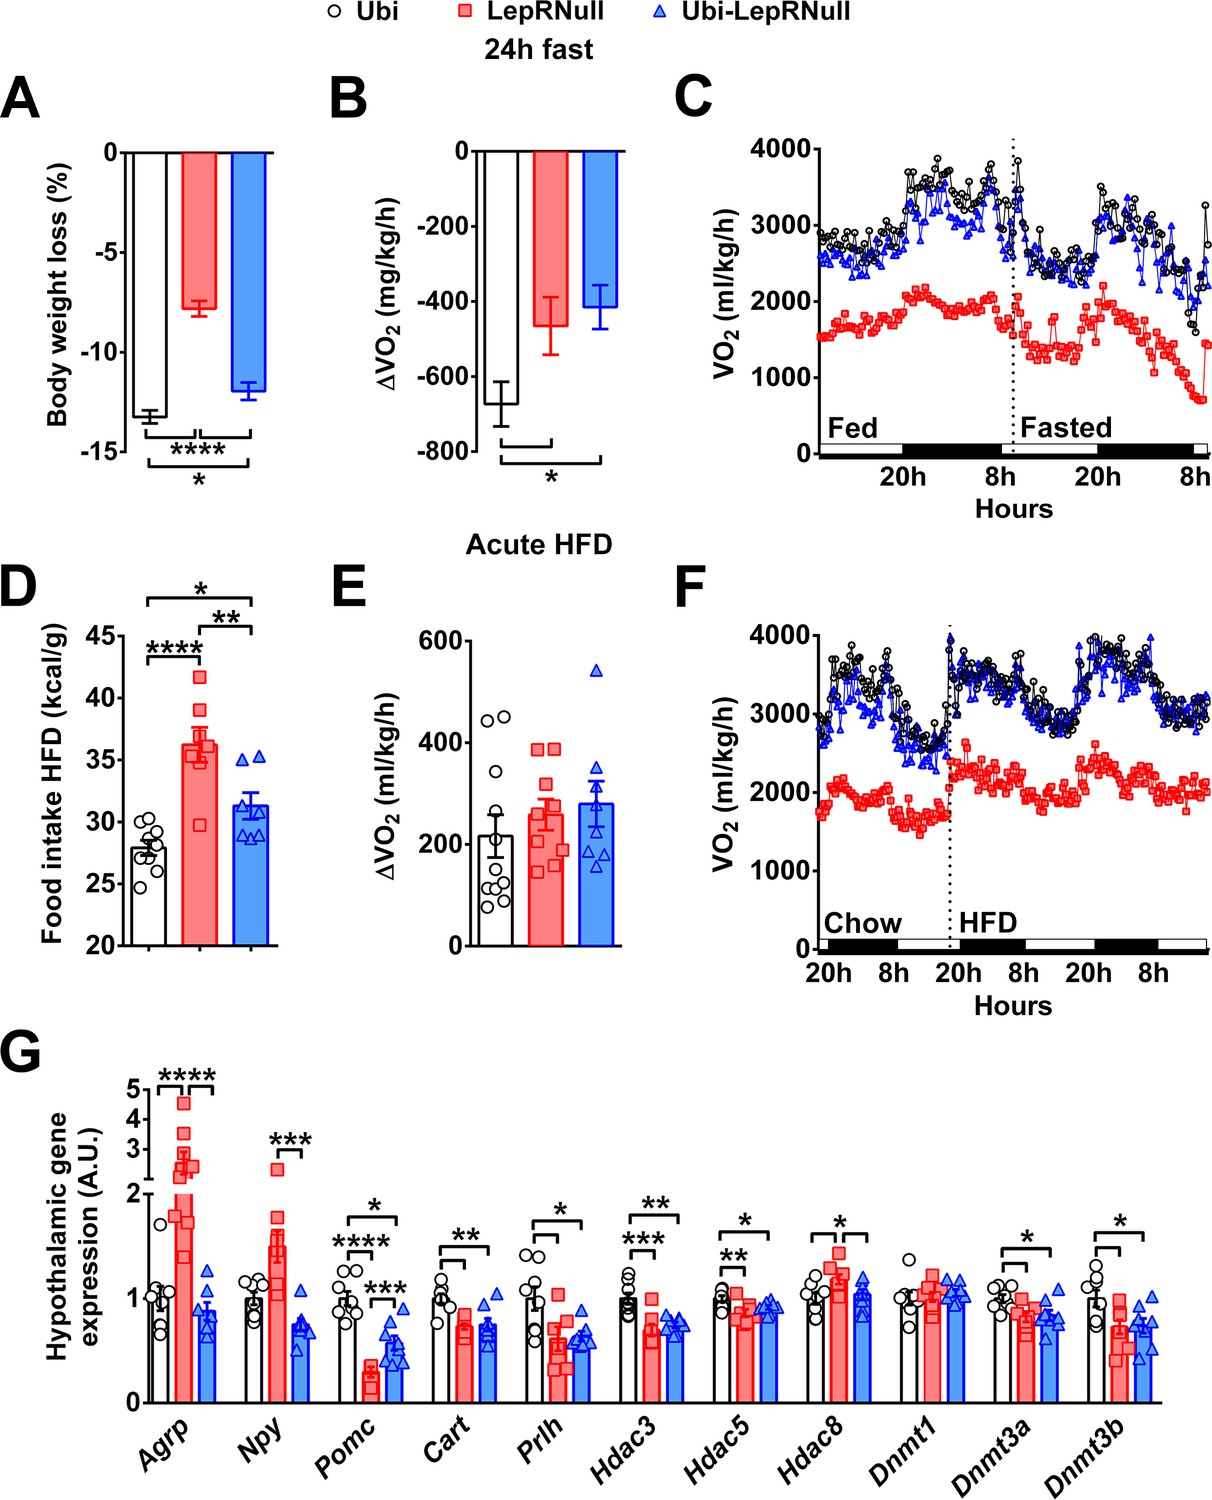
Absence of leptin signaling in early life affects the response to negative and positive energy balance, the central melanocortin system and the expression of enzymes related to epigenetic changes.
(A–C) Variations in % body weight and energy expenditure (VO2) caused by 24 hr fasting compared to ad libitum feeding (n = 9–21). (D–F) Calorie intake and changes in VO2 caused by the intake of HFD for 48 hr, compared to a regular low-fat diet (n = 7–12). HFD was provided 2 hr before dark phase. (G) Hypothalamic mRNA expression in Ubi, LepRNull and Ubi-LepRNull mice (n = 6–8). *p<0.05; **p<0.01; ***p<0.001; ****p<0.0001 (Figure 3—source data 1 and Figure 3—source data 2).
-
Figure 3—source data 1
Data regarding situations of negative and positive energy balance.
- https://doi.org/10.7554/eLife.40970.014
-
Figure 3—source data 2
Primer list.
- https://doi.org/10.7554/eLife.40970.015
Figure 3—figure supplement 1
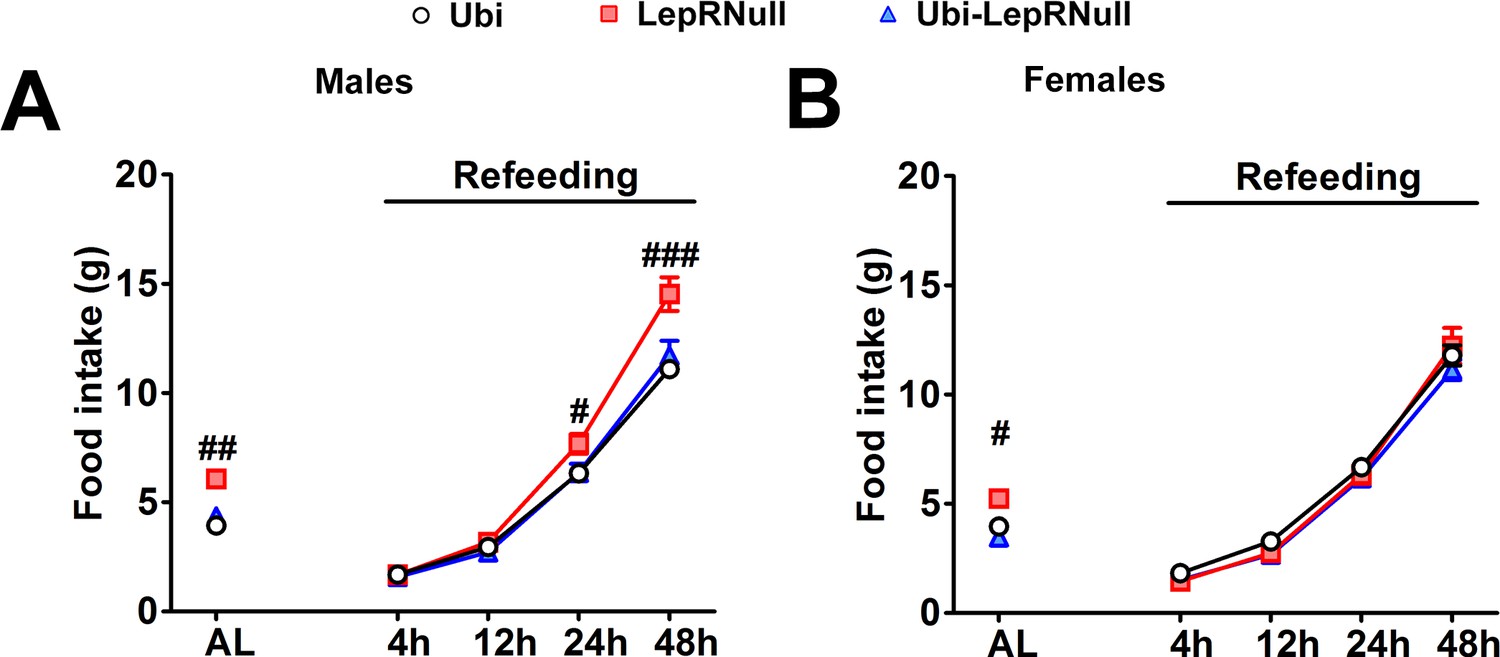
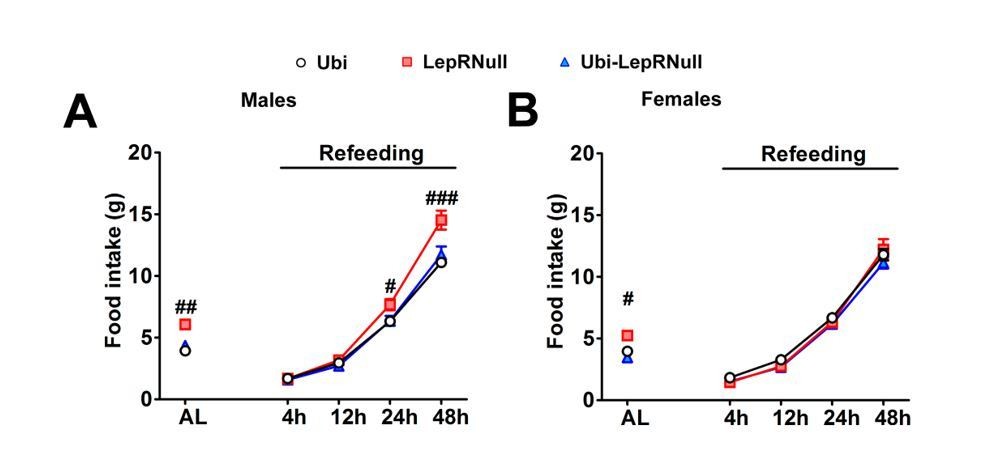
Refeeding after fasting.
(A–B) Food intake in male (n = 9–15) and female (n = 8–28) mice 4, 12, 24 and 48 hr after a 24 hr fasting period. # p<0.05; ## p<0.01; ### p<0.001 vs LepRNull group. AL means ad libitum food intake. Mean ±S.E.M (Figure 3—figure supplement 2—source data 1).
-
Figure 3—figure supplement 1—source data 1
Data regarding food intake during refeeding.
- https://doi.org/10.7554/eLife.40970.011
Figure 3—figure supplement 2
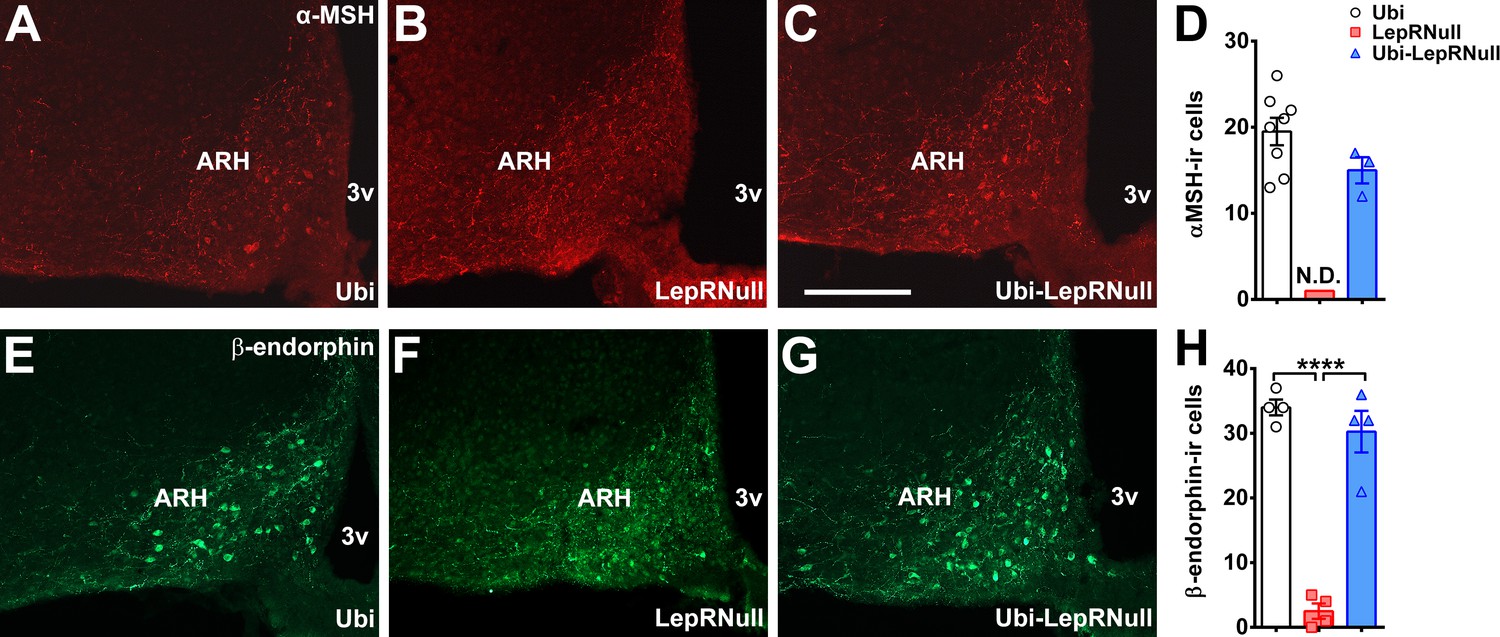
Alterations in metabolism following LepR reactivation in adult mice are not caused by decreased number of POMC cells.
(A–C) Epifluorescence photomicrographs of α-MSH immunoreactive cells in the ARH of adult Ubi (A), LepRNull (B) and Ubi-LepRNull (C) mice. Abbreviations: 3 v, third ventricle; ARH, arcuate nucleus. Scale Bar = 100 µm. (D) Quantification of α-MSH immunoreactive cells in the ARH of adult mice (n = 3–8). N.D., not determined since α-MSH immunoreactive cells were not visible in the ARH of LepRNull mice. (E–G) Epifluorescence photomicrographs of β-endorphin immunoreactive cells in the ARH of adult Ubi (E), LepRNull (F) and Ubi-LepRNull (G) mice. (H) Quantification of β-endorphin immunoreactive cells in the ARH of adult mice (n = 4). ****p<0.0001. Mean ±S.E.M (Figure 3—figure supplement 2—source data 1).
-
Figure 3—figure supplement 2—source data 1
Data regarding the number of POMC neurons in the hypothalamus.
- https://doi.org/10.7554/eLife.40970.013
Figure 4
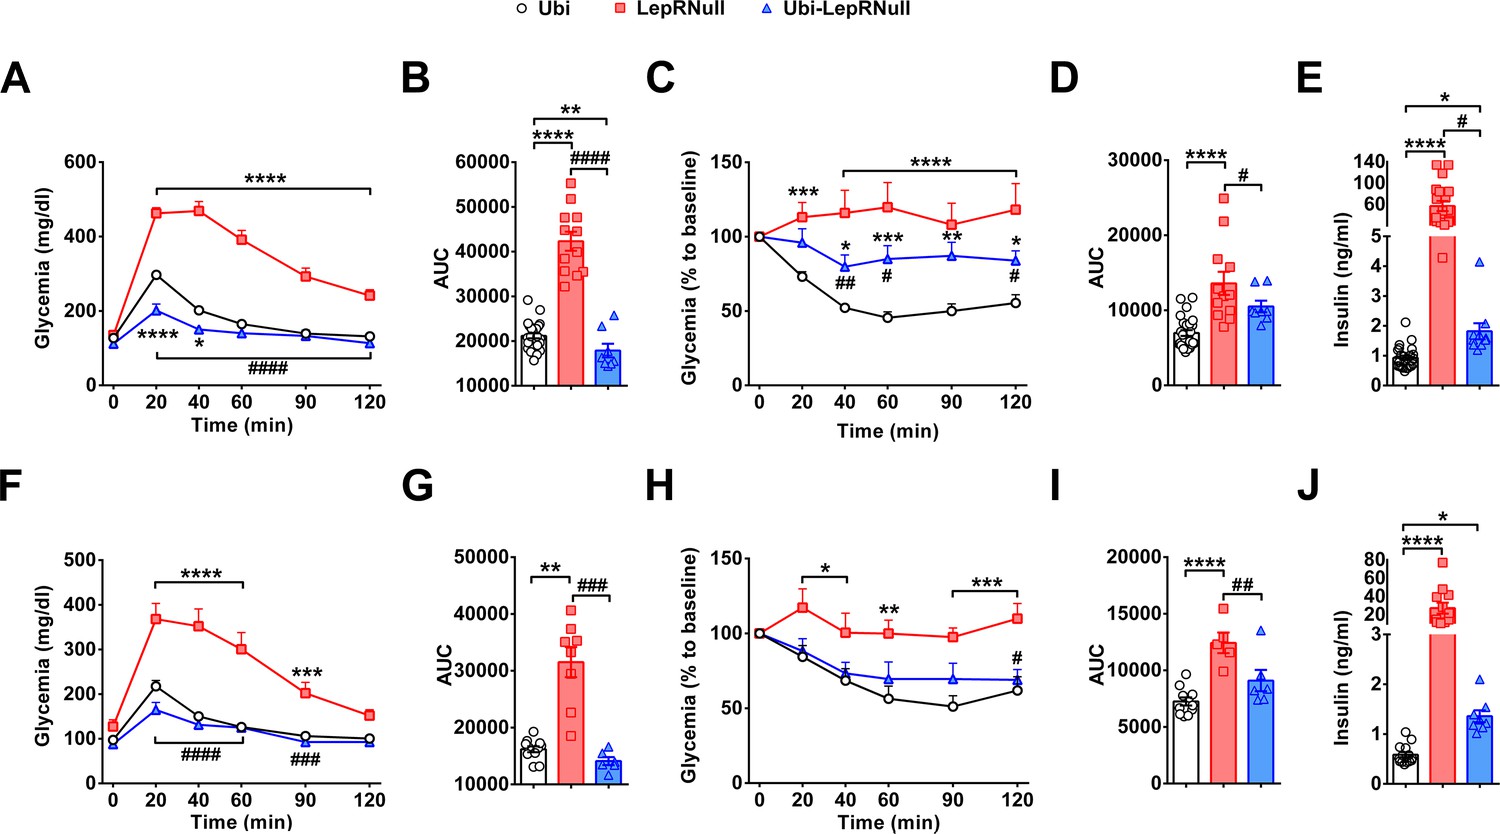
Absence of leptin signaling in early life causes insulin resistance.
(A–B) Glucose tolerance test (GTT; 2 g glucose/kg b.w.; i.p.) and the area under the curve (AUC) of the GTT in male mice (n = 10–32). (C–D) Insulin tolerance test (ITT; 1 IU/kg b.w.; i.p.) and the AUC of the ITT in male mice (n = 7–27). (E) Serum insulin concentration in male mice (n = 10–25). (F–G) GTT and the AUC of the GTT in female mice (n = 6–13). (H–I) ITT and the AUC of the ITT in female mice (n = 6–12). (J) Serum insulin concentration in female mice (n = 8–14). *p<0.05 vs Ubi group; **p<0.01 vs Ubi group; ***p<0.001 vs Ubi group; ****p<0.0001 vs Ubi group. # p<0.05 vs LepRNull group; ## p<0.01 vs LepRNull group; ### p<0.001 vs LepRNull group; #### p<0.0001 vs LepRNull group (Figure 4—source data 1).
-
Figure 4—source data 1
Data regarding glucose homeostasis.
- https://doi.org/10.7554/eLife.40970.017
Figure 5 with 2 supplements
LepR reactivation before the onset of obesity confirmed the energy imbalance of Ubi-LepRNull mice.
(A–D) Body weight (males, n = 7–16; females, n = 10–24), perigonal fat pad (males, n = 8–16; females, n = 5–12), serum leptin concentration (males, n = 8–12) and food intake (males, n = 8–16; females, n = 5–12) in mice treated with tamoxifen at 4 weeks of age. (E–F) Energy expenditure (VO2) during dark phase, light phase and 24 hr in male mice (n = 8–16). (G–H) Respiratory exchange ratio (RER) in male mice (n = 8–16). (I–J) Voluntary ambulatory activity in male mice (n = 8–16). *p<0.05; **p<0.01; ***p<0.001; ****p<0.0001 (Figure 5—source data 1).
-
Figure 5—source data 1
Data regarding energy balance in young mice.
- https://doi.org/10.7554/eLife.40970.023
Figure 5—figure supplement 1
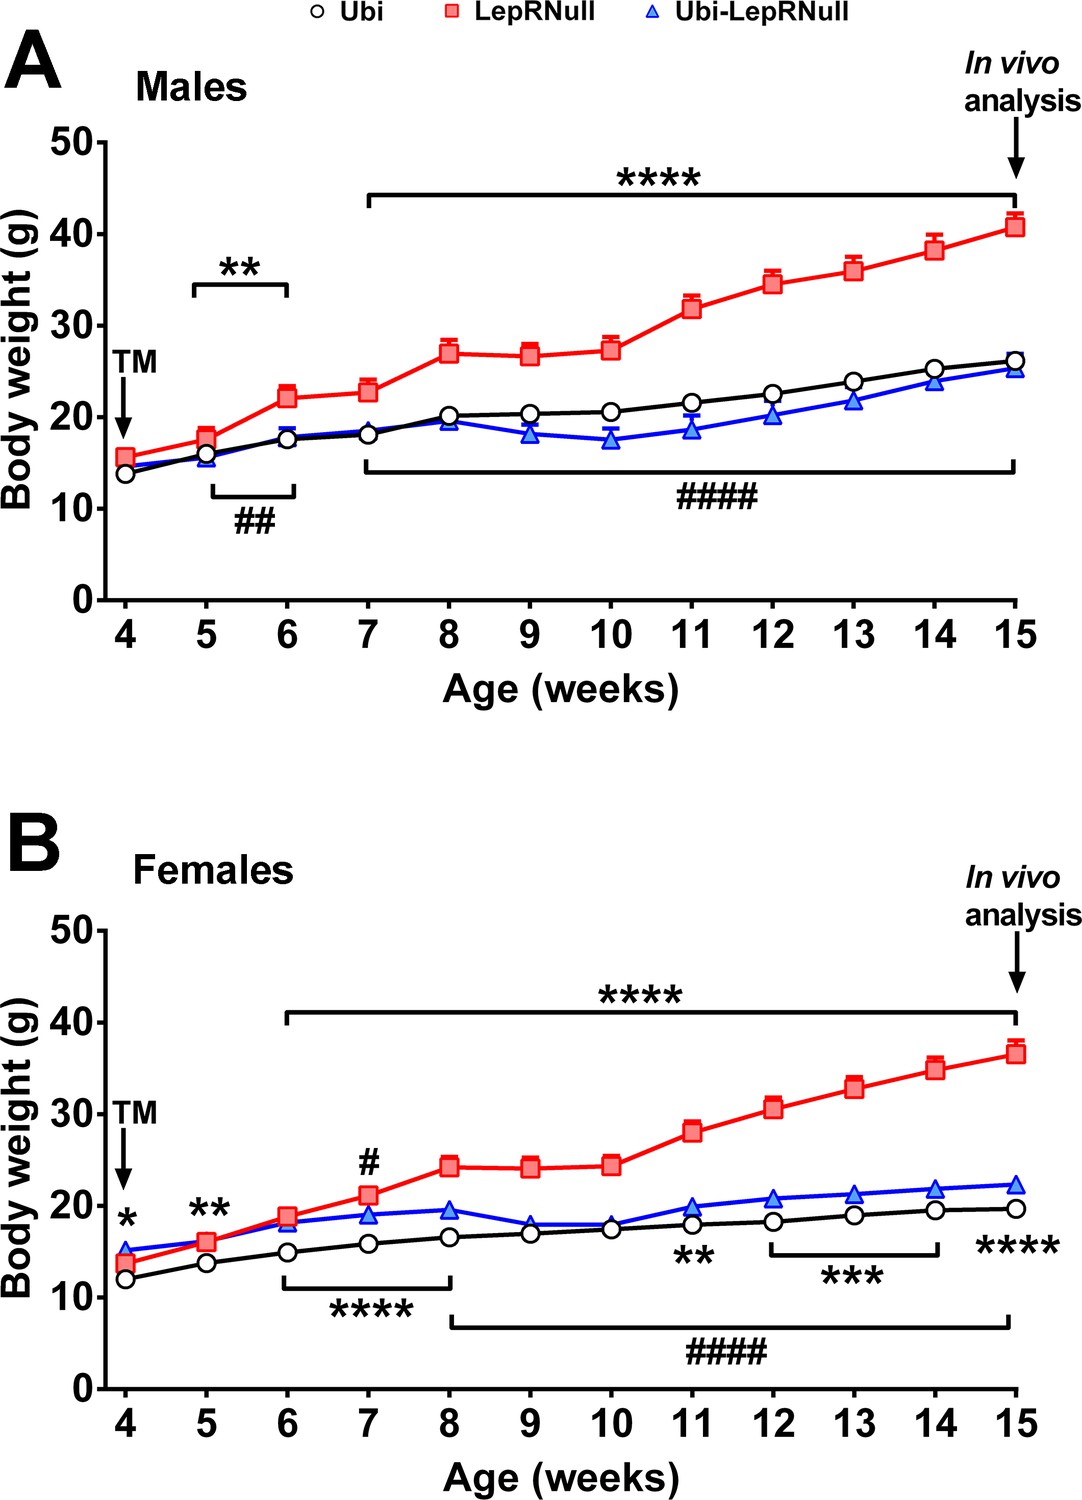
LepR reactivation before the onset of obesity in male and female mice.
(A) Body weight changes in male mice treated with tamoxifen at 4 weeks of age (main effect of Genotype [F(2, 29)=24.34, p<0.0001], main effect of Time [F(11, 319)=367.4, p<0.0001] and interaction [F(22, 319)=33.06, p<0.0001]; n = 6–16). TM, indicates the beginning of tamoxifen treatment. Note that the in vivo analyses were performed only when mice completed 15 weeks of life. (B) Body weight changes in female mice treated with tamoxifen at 4 weeks of age (main effect of Genotype [F(2, 42)=92.37, p<0.0001], main effect of Time [F(11, 462)=534.1, p<0.0001] and interaction [F(22, 462)=88.29, p<0.0001]; n = 9–24). *p<0.05 vs Ubi group; **p<0.01 vs Ubi group; ***p<0.001 vs Ubi group; ****p<0.0001 vs Ubi group. # p<0.05 vs LepRNull group; ## p<0.01 vs LepRNull group; #### p<0.0001 vs LepRNull group (Figure 5—figure supplement 1—source data 1).
-
Figure 5—figure supplement 1—source data 1
Data regarding leptin receptor reactivation in young mice.
- https://doi.org/10.7554/eLife.40970.020
Figure 5—figure supplement 2
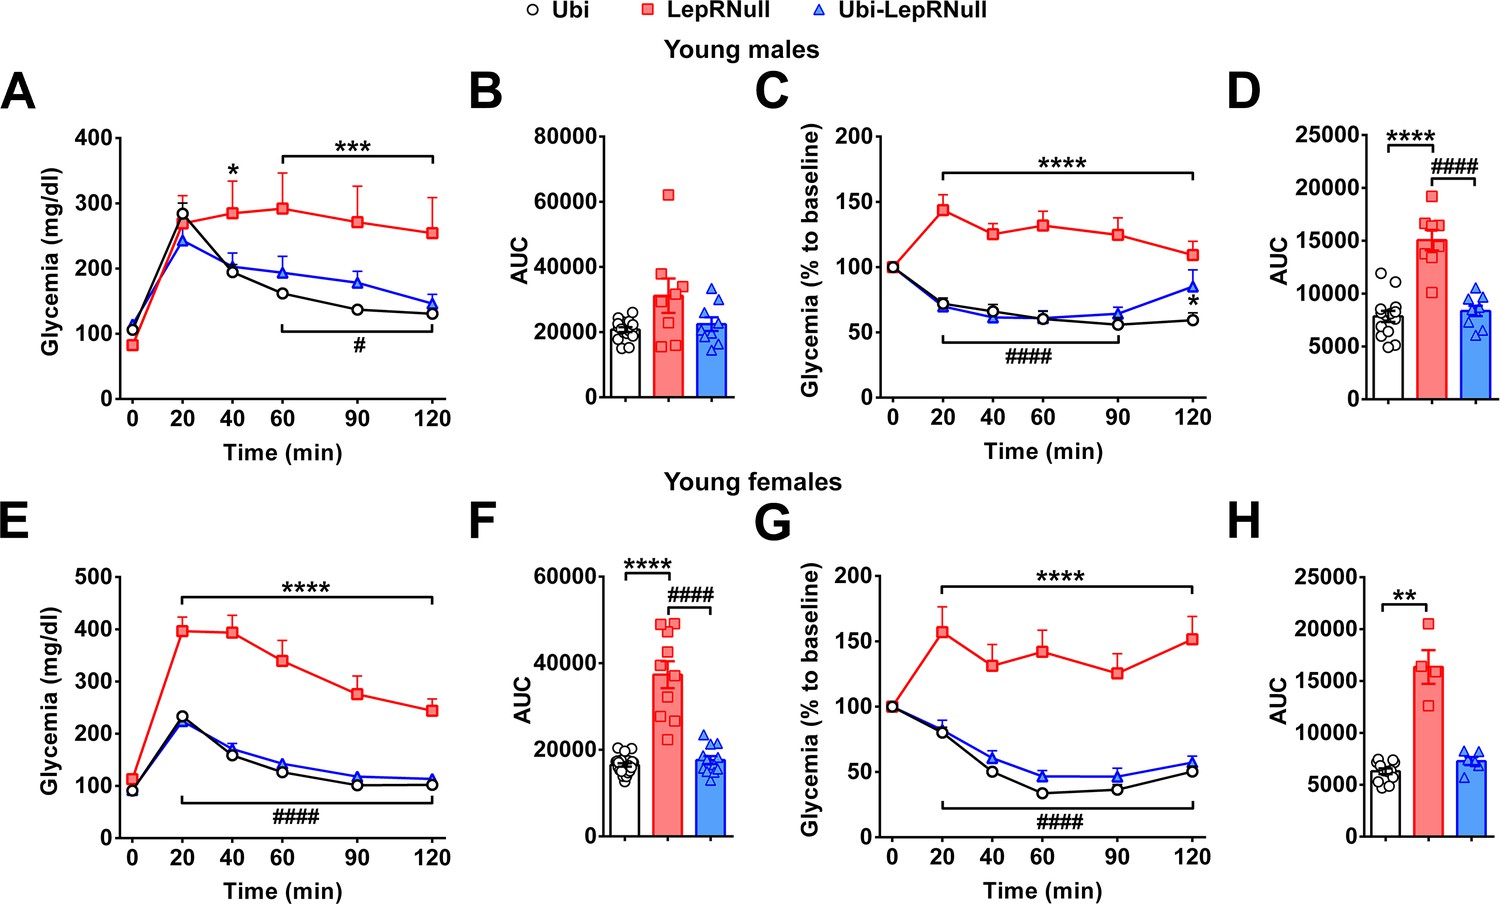
LepR reactivation before the onset of obesity completely normalized the glucose tolerance and insulin sensitivity.
(A–B) Glucose tolerance test (GTT; 2 g glucose/kg b.w.; i.p.) and the area under the curve (AUC) of the GTT in male mice treated with tamoxifen at 4 weeks of age (n = 8–16). (C–D) Insulin tolerance test (ITT; 1 IU/kg b.w.; i.p.) and the AUC of the ITT in male mice treated with tamoxifen at 4 weeks of age (n = 8–16). (E–F) GTT and the AUC of the GTT in female mice (n = 10–24). (G–H) ITT and the AUC of the ITT in female mice (n = 10–24). *p<0.05 vs Ubi group; **p<0.01 vs Ubi group; ***p<0.001 vs Ubi group; ****p<0.0001 vs Ubi group. # p<0.05 vs LepRNull group; #### p<0.0001 vs LepRNull group (Figure 5—figure supplement 2—source data 1).
-
Figure 5—figure supplement 2—source data 1
Data regarding glucose homeostasis in young mice.
- https://doi.org/10.7554/eLife.40970.022
Figure 6

LepR reactivation does not completely restore the reproductive axis of adult mice.
(A–C) Serum concentration of T4 (n = 10–25), corticosterone (n = 8–10) and testosterone (n = 8–14) in mice treated with tamoxifen at 10 weeks of age. (D) Testicle weight between the groups of adult mice (n = 7–15). (E–G) Epifluorescence photomicrographs of immunoreactive GnRH fibers in the mediobasal hypothalamus of Ubi (E), LepRNull (F) and Ubi-LepRNull (G) adult males. Scale Bar = 100 µm. (H) Integrated optical density of GnRH immunoreactive fibers of adult males (n = 3–7). (I) Hypothalamic mRNA expression of Kiss1 and Nos1 in adult males (n = 8). (J) Testicle weight in mice treated with tamoxifen at 4 weeks of age (n = 8–14). (K) Representation of the estrous cycle during 25 days determined by the daily inspection of the vaginal smear in Ubi (left column, white circles), LepRNull (central column, red squares) and Ubi-LepRNull (blue triangles) adult females. Abbreviations: C, prevalence of cornified/epithelial cells (proestrus or estrus); L, prevalence of leucocytes (diestrus); M, mix of leucocytes and cornified/epithelial cells (metestrus). *p<0.05; **p<0.01; ***p<0.001; ****p<0.0001 (Figure 6—source data 1).
-
Figure 6—source data 1
Data regarding endocrine and reproductive changes.
- https://doi.org/10.7554/eLife.40970.025
Figure 7 with 2 supplements
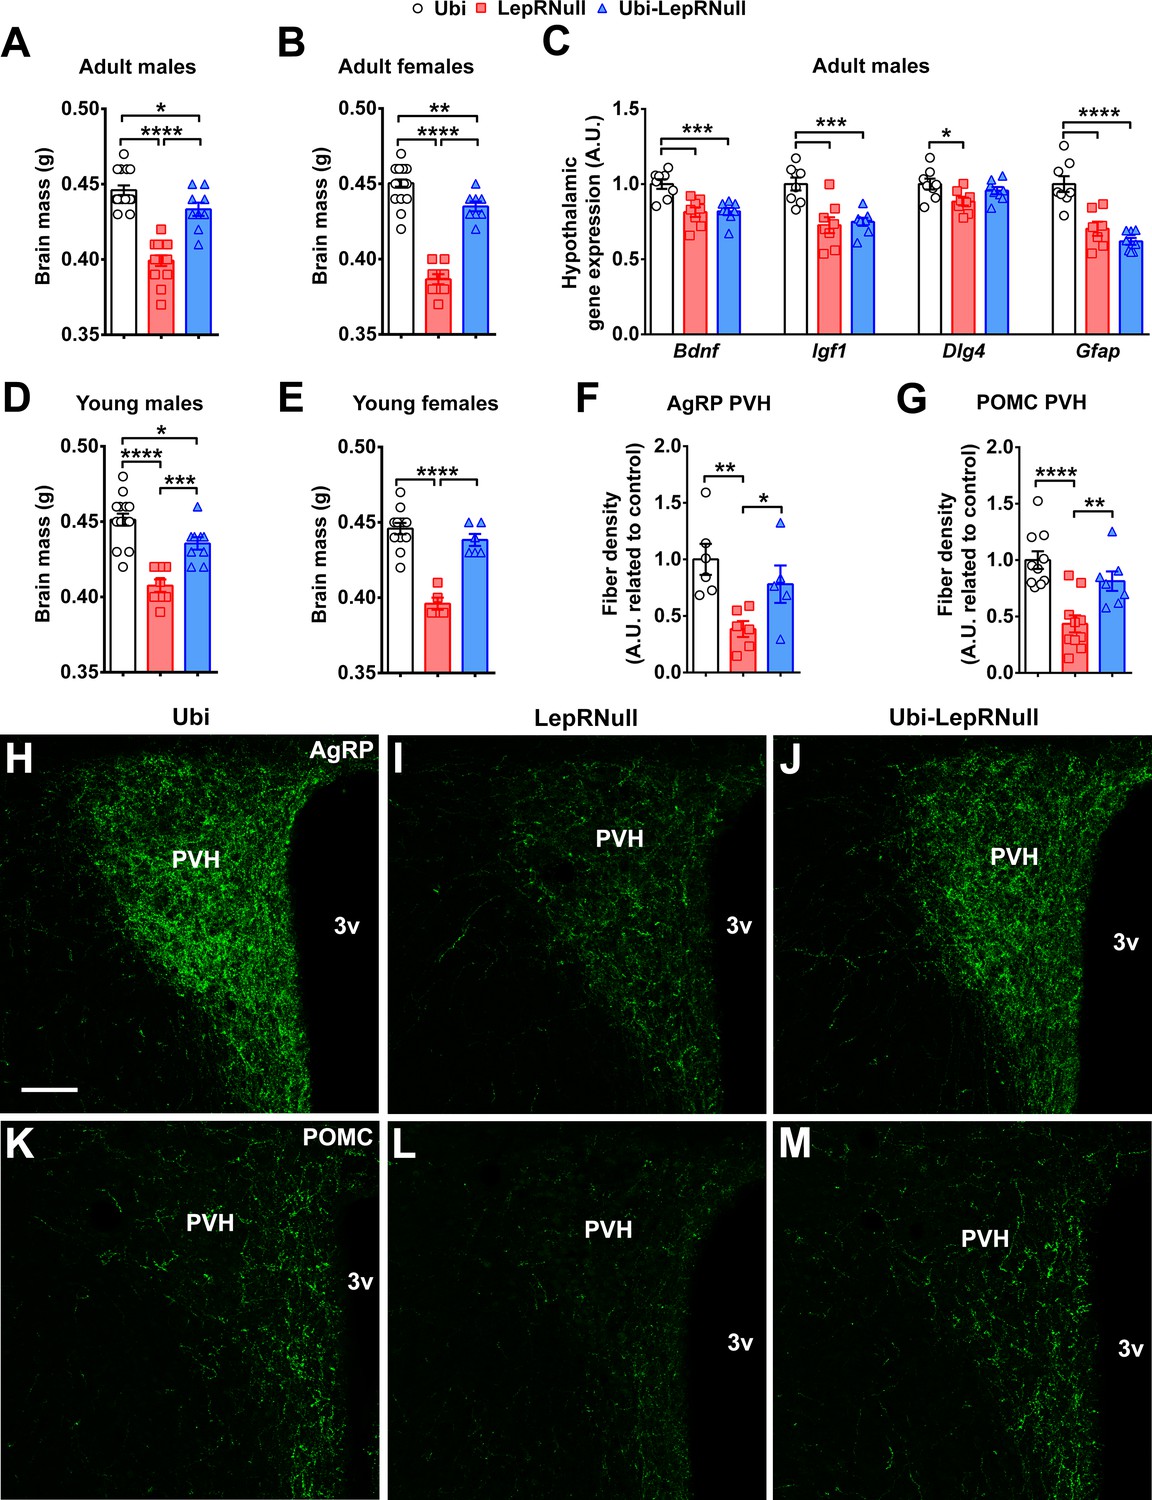
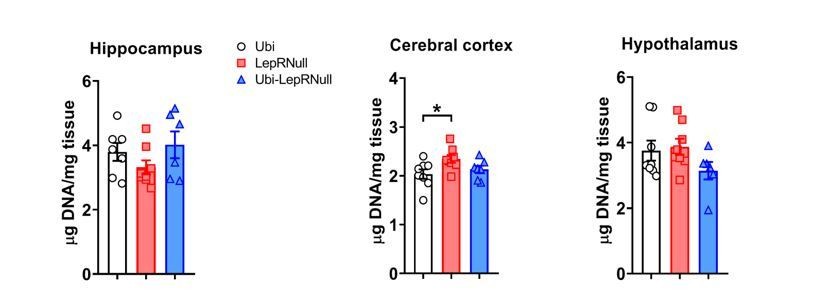
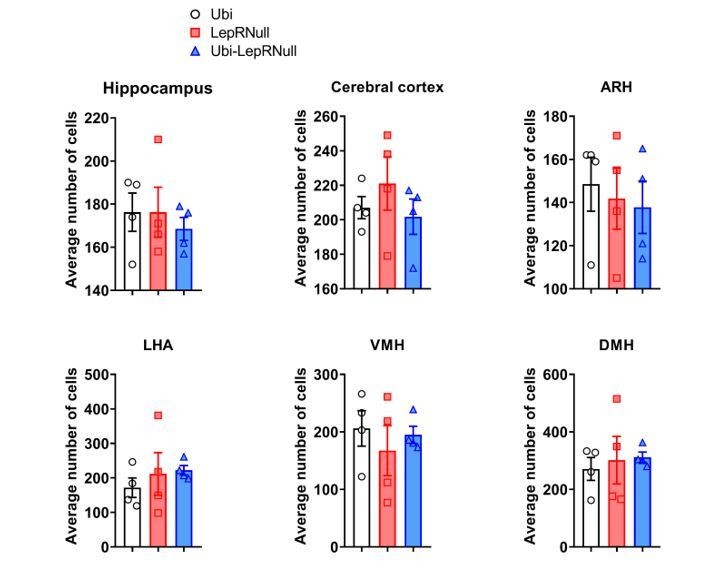
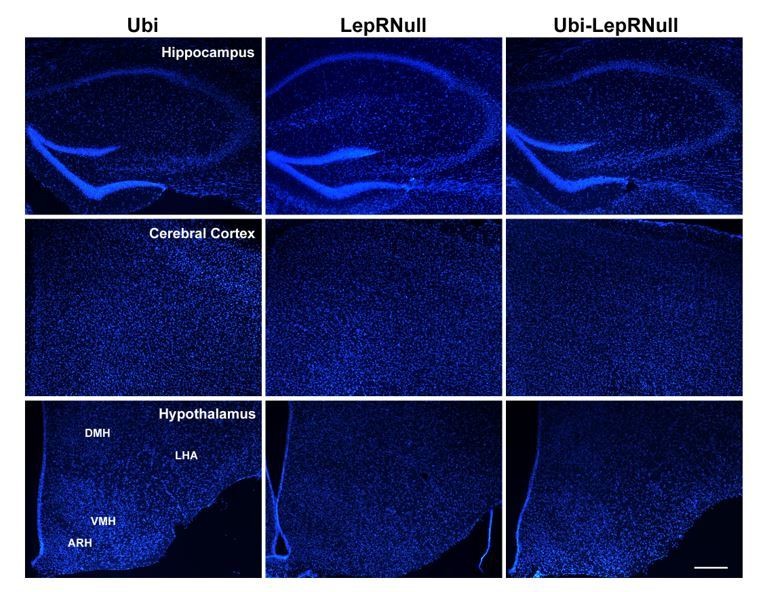
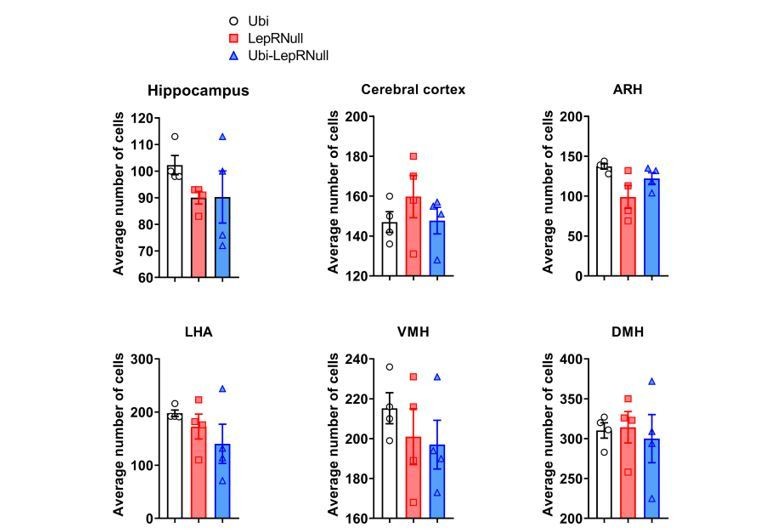
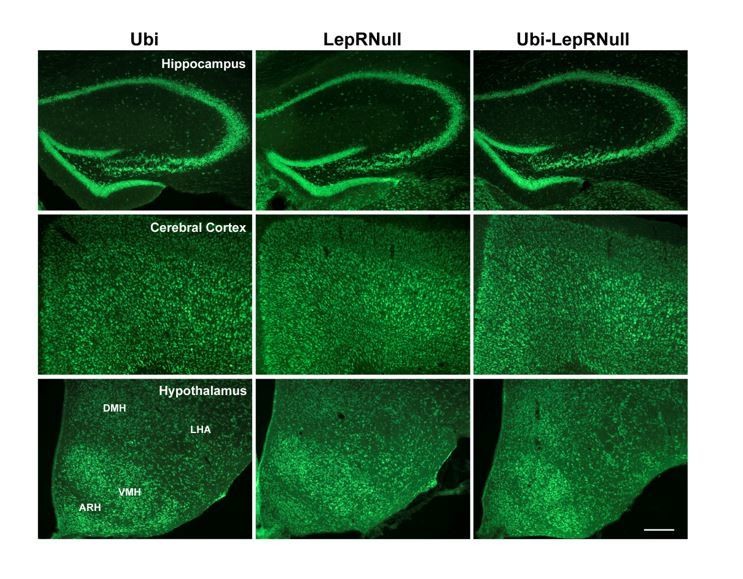
Brain development is affected by the absence of leptin signaling in early life, although ARH projections are normalized in Ubi-LepRNull mice.
(A–B) Wet brain mass of male mice (n = 8–15) and female mice (n = 8–22) treated with tamoxifen at 10 weeks of age. (C) Hypothalamic mRNA expression of neurotrophic factors and proteins involved in synaptic plasticity in adult males (n = 7–8). (D, E) Wet brain mass of male mice (n = 8–15) and female mice (n = 5–12) treated with tamoxifen at 4 weeks of age. (F, G) Quantification of AgRP (n = 5–6) and POMC (n = 7–10) immunoreactive fibers in the PVH of adult mice. 3 v, third ventricle. Scale Bar = 50 µm. (H–J) Confocal photomicrographs of AgRP immunoreactive fibers in the PVH of Ubi (H), LepRNull (I) and Ubi-LepRNull (J) adult mice. (K–M) Confocal photomicrographs of POMC immunoreactive fibers in the PVH of Ubi (K), LepRNull (L) and Ubi-LepRNull (M) adult mice. *p<0.05; **p<0.01; ***p<0.001; ****p<0.0001 (Figure 7—source data 1).
-
Figure 7—source data 1
Data regarding neurotrophic effects of leptin.
- https://doi.org/10.7554/eLife.40970.031
Figure 7—figure supplement 1
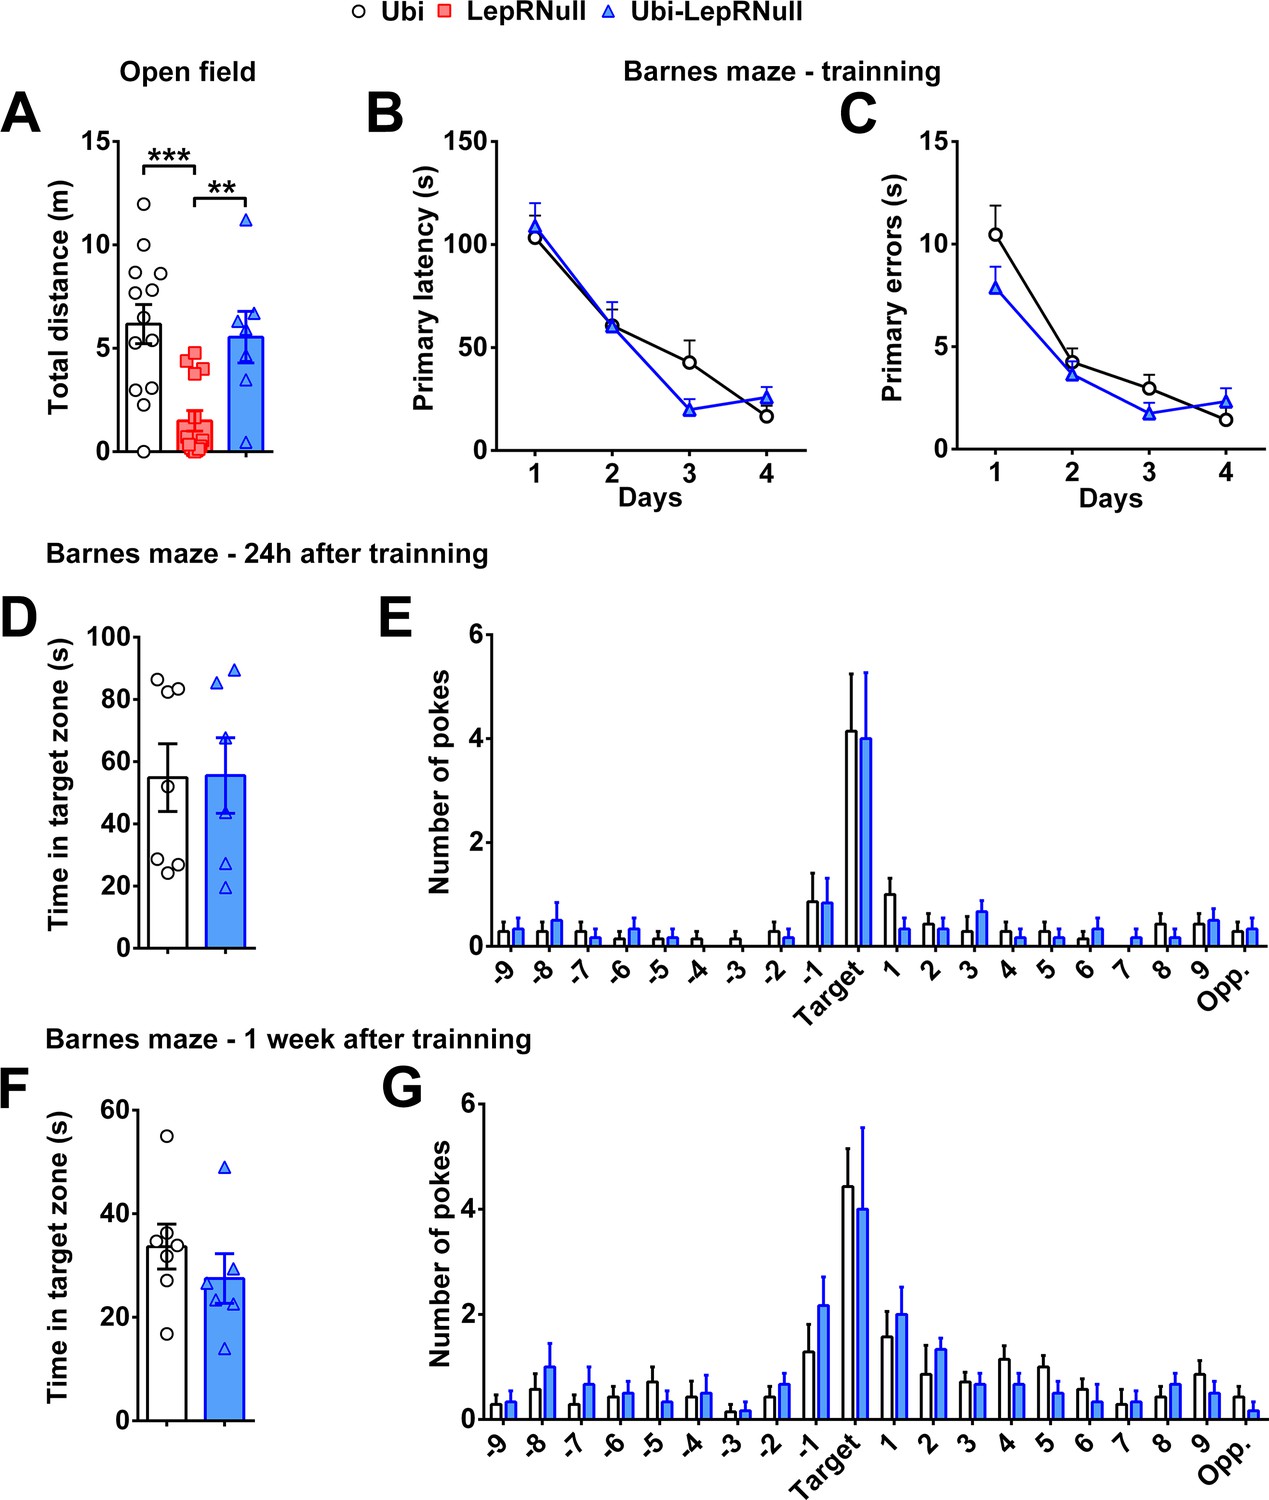
No behavioral or memory deficits were found in mice that grew without leptin signaling until adulthood.
(A) Total distance travelled by adult males (n = 7–14/group) in the open-field test. **p<0.01; ***p<0.001. (B–C) Primary latency and primary errors during the 4 days of training in the Barnes maze (n = 6–7/group). Note that LepRNull mice were not tested since they exhibit decreased ambulatory activity. During training, learning ability was tested by evaluating the decrease in latency (B) and the reduction in the number of errors to find the escape hole (C). (D–G) Time in the target zone and number of pokes on different holes (n = 6–7/group) in the Barnes maze 24 hr after training (D–E) or 1 week after training (F–G). Mean ±S.E.M (Figure 7—figure supplement 1—source data 1).
-
Figure 7—figure supplement 1—source data 1
Data regarding behavioral experiments.
- https://doi.org/10.7554/eLife.40970.028
Figure 7—figure supplement 2
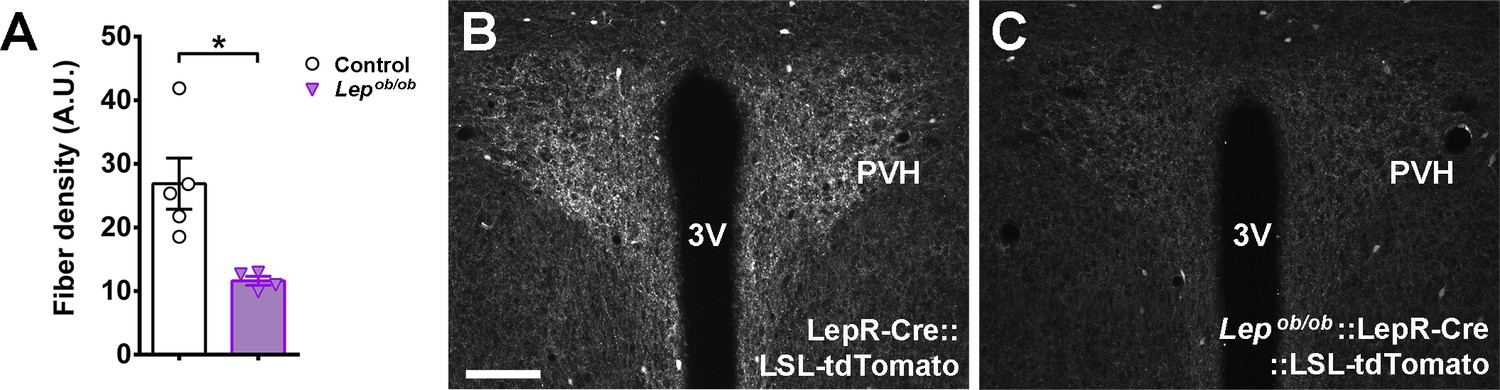
Lepob/ob mice have a significant reduction in the amount of axons from LepR-expressing neurons in the paraventricular nucleus of the hypothalamus (PVH).
(A) Analysis of the integrated optical density in the PVH of control (LepR-Cre::LSL-tdTomato; n = 5) and Lepob/ob::LepR-Cre::LSL-tdTomato mice (n = 4). (B–C) Epifluorescence photomicrographs showing the distribution of axons expressing the tdTomato fluorescent protein in the PVH. Scale Bar = 100 µm. 3 v, third ventricle. Mean ±S.E.M. *p<0.05 vs control group (Figure 7—figure supplement 2—source data 1).
-
Figure 7—figure supplement 2—source data 1
Data regarding distribution of leptin receptor-expressing axons in the paraventricular nucleus.
- https://doi.org/10.7554/eLife.40970.030
Author response image 1
Author response image 2

Author response image 3
Author response image 4
Author response image 5
Author response image 6
Author response image 7
Author response image 8
Tables
Key resources table
| Reagent type (species) or resource | Designation | Source or reference | Identifiers | Additional information |
|---|---|---|---|---|
| Genetic reagent (M. musculus) | STOCK Leprtm1Jke/J | The Jackson Laboratory | JAX:018989 | |
| Genetic reagent (M. musculus) | B6.Cg-Ndor1Tg(UBC-cre/ERT2)1Ejb/2J | The Jackson Laboratory | JAX:008085 | |
| Genetic reagent (M. musculus) | B6.Cg-Lepob/J | The Jackson Laboratory | JAX:000632 | |
| Genetic reagent (M. musculus) | B6.129-Leprtm2(cre)Rck/J | The Jackson Laboratory | JAX:008320 | |
| Genetic reagent (M. musculus) | B6;129S6-Gt(ROSA) 26Sortm9(CAG-tdTomato)Hze/J | The Jackson Laboratory | JAX:007909 | |
| Antibody | Rabbit anti-GnRH (LHRH) antibody | Immunostar | RRID:AB_572248 | IF (1:2000) |
| Antibody | Rabbit anti-pSTAT3Tyr705 antibody | Cell Signaling | Cat. #: 9131 | IHC (1:1000) |
| Antibody | Mouse anti-αMSH antibody | Chemicon | Cat. #: AB5087 | IF (1:2000) |
| Antibody | Rabbit anti-βendorphin antibody | Phoenix Pharmaceuticals | Cat. #: H-022–33 | IF (1:2000) |
| Antibody | Rabbit anti-AgRP antibody | Phoenix Pharmaceuticals | Cat. #: H-003–53 | IF (1:2000) |
| Antibody | Biotin-SP-conjugated AffiniPure Donkey anti-Rabbit IgG | Jackson ImmunoResearch | Cat. #: 711-065-152 | IHC (1:1000) |
| Antibody | Alexa Fluor488-conjugated Donkey anti-Rabbit IgG | Jackson ImmunoResearch | Cat. #: 711-545-152 | IF (1:500) |
| Antibody | Alexa Fluor594-conjugated Donkey anti-Mouse IgG | Jackson ImmunoResearch | Cat. #: 715-585-150 | IF (1:500) |
| Sequence- based reagent | RT-qPCR primers | This paper | ||
| Peptide, recombinant protein | Human recombinant insulin | Novo Nordisk | ||
| Peptide, recombinant protein | Mouse recombinat leptin | National Hormone and Peptide Program | ||
| Commercial assay or kit | Mouse Leptin ELISA KIT | Crystal Chem | 90030 | |
| Commercial assay or kit | Total Rat/Mouse T4 ELISA KIT | Calbiotech | T4044T-100 | |
| Commercial assay or kit | Rat/Mouse Testosterone ELISA KIT | Calbiotech | TE187S-100 | |
| Commercial assay or kit | Mouse Insulin ELISA KIT | Crystal Chem | 90080 | |
| Commercial assay or kit | Corticosterone EIA KIT | Arbor Assays | K014-H1 | |
| Chemical compound, drug | Tamoxifen | Sigma-Aldrich | T5648 | |
| Chemical compound, drug | Sesame oil | Sigma-Aldrich | S3547 | |
| Software, algorithm | ImageJ | National Institutes of Health (NIH) | http://rsb.info.nih.gov/ij/ | |
| Software, algorithm | Prism | GraphPad | https://www.graphpad.com/scientific-software/prism/ | Version 6 |
| Software, algorithm | ANY-maze | ANY-maze | http://anymaze.co.uk/ | |
| Other | High-fat diet (HFD) 5.31 kcal/g, 58% calories from fat | Pragsoluções |
Additional files
-
Transparent reporting form
- https://doi.org/10.7554/eLife.40970.032
Download links
A two-part list of links to download the article, or parts of the article, in various formats.
Downloads (link to download the article as PDF)
Open citations (links to open the citations from this article in various online reference manager services)
Cite this article (links to download the citations from this article in formats compatible with various reference manager tools)
Long-term consequences of the absence of leptin signaling in early life
eLife 8:e40970.
https://doi.org/10.7554/eLife.40970


