Affinity capture of polyribosomes followed by RNAseq (ACAPseq), a discovery platform for protein-protein interactions
- Johns Hopkins University School of Medicine, Maryland, United States
- West China Hospital, Sichuan University, China
- Howard Hughes Medical Institute, Johns Hopkins University School of Medicine, Maryland, United States
Figures
Figure 1

Principle of ACAPseq.
(A) Workflow for the ACAPseq protocol. In step 3, the polyribosome synthesizing the green polypeptide is captured by magnetic beads displaying the bait-Fc fusion protein, and the polyribosome synthesizing the red polypeptide is not captured. In step 4, the genome browser image shows, at the bottom, introns (thin back lines) and exons (filled black rectangles) for genes A and B. The Y-Fc bait has captured polyribosomes synthesizing protein A, resulting in a large number of RNAseq reads (short horizontal blue lines) that align to the exons of gene A. (B) Histogram of mapped ACAPseq reads using EFNA1-Fc and FLRT3-Fc baits to capture neonatal mouse brain polyribosomes. The bottom track shows the unselected polyribosome sample. The upper panel spans the entirety of mouse chromosome 5 (151 Mb), and the lower panel spans a 10 Mb region encompassing the Adgrl3 and Epha5 genes. Red arrows highlight reads mapping to Adgrl3 and Epha5. In this and all other genome browser images, the number range at the right side of each panel indicates the number of reads corresponding to the vertical height of the panel. U.P., unselected polyribosomes.
Figure 2 with 1 supplement

Genome browser images from ACAPseq of neonatal mouse brain polyribosomes captured with Fc fusion proteins.
Genome browser images are presented as in Figure 1B. (A) Dilution of polyribosomes (in ug of RNA) and EFNA1-Fc bait (in ml of serum-free conditioned medium) showing the efficiency of Epha8 mRNA capture. (B–D) Fc-VEGF captured Flt1, Kdr, and Nrp1 mRNAs (red arrows). (E–H) CNTN3-Fc captured App mRNA and APP-Fc captured Cntn3 mRNA (red arrows). A subset of the panels in (e) are enlarged vertically in (F). (G) and (H) show the Cntn3 gene with different horizontal and vertical scales. The CNTN4 bait used here, CNTN4.2, is an isoform that lacks the three carboxy-terminal Fn domains. (I–K) LYPD6-Fc captured Celsr1 and Celsr2 mRNA (red arrows), but not Celsr3 mRNA. The several localized peaks of RNAseq reads in the Celsr3 region do not match the pattern of reads in the unselected polyribosome sample, and likely reflect artifacts of library amplification. (L) PCDH9-Fc captured Pcdh9 mRNA. The Pcdh9 gene spans ~1 Mb.
Figure 2—figure supplement 1
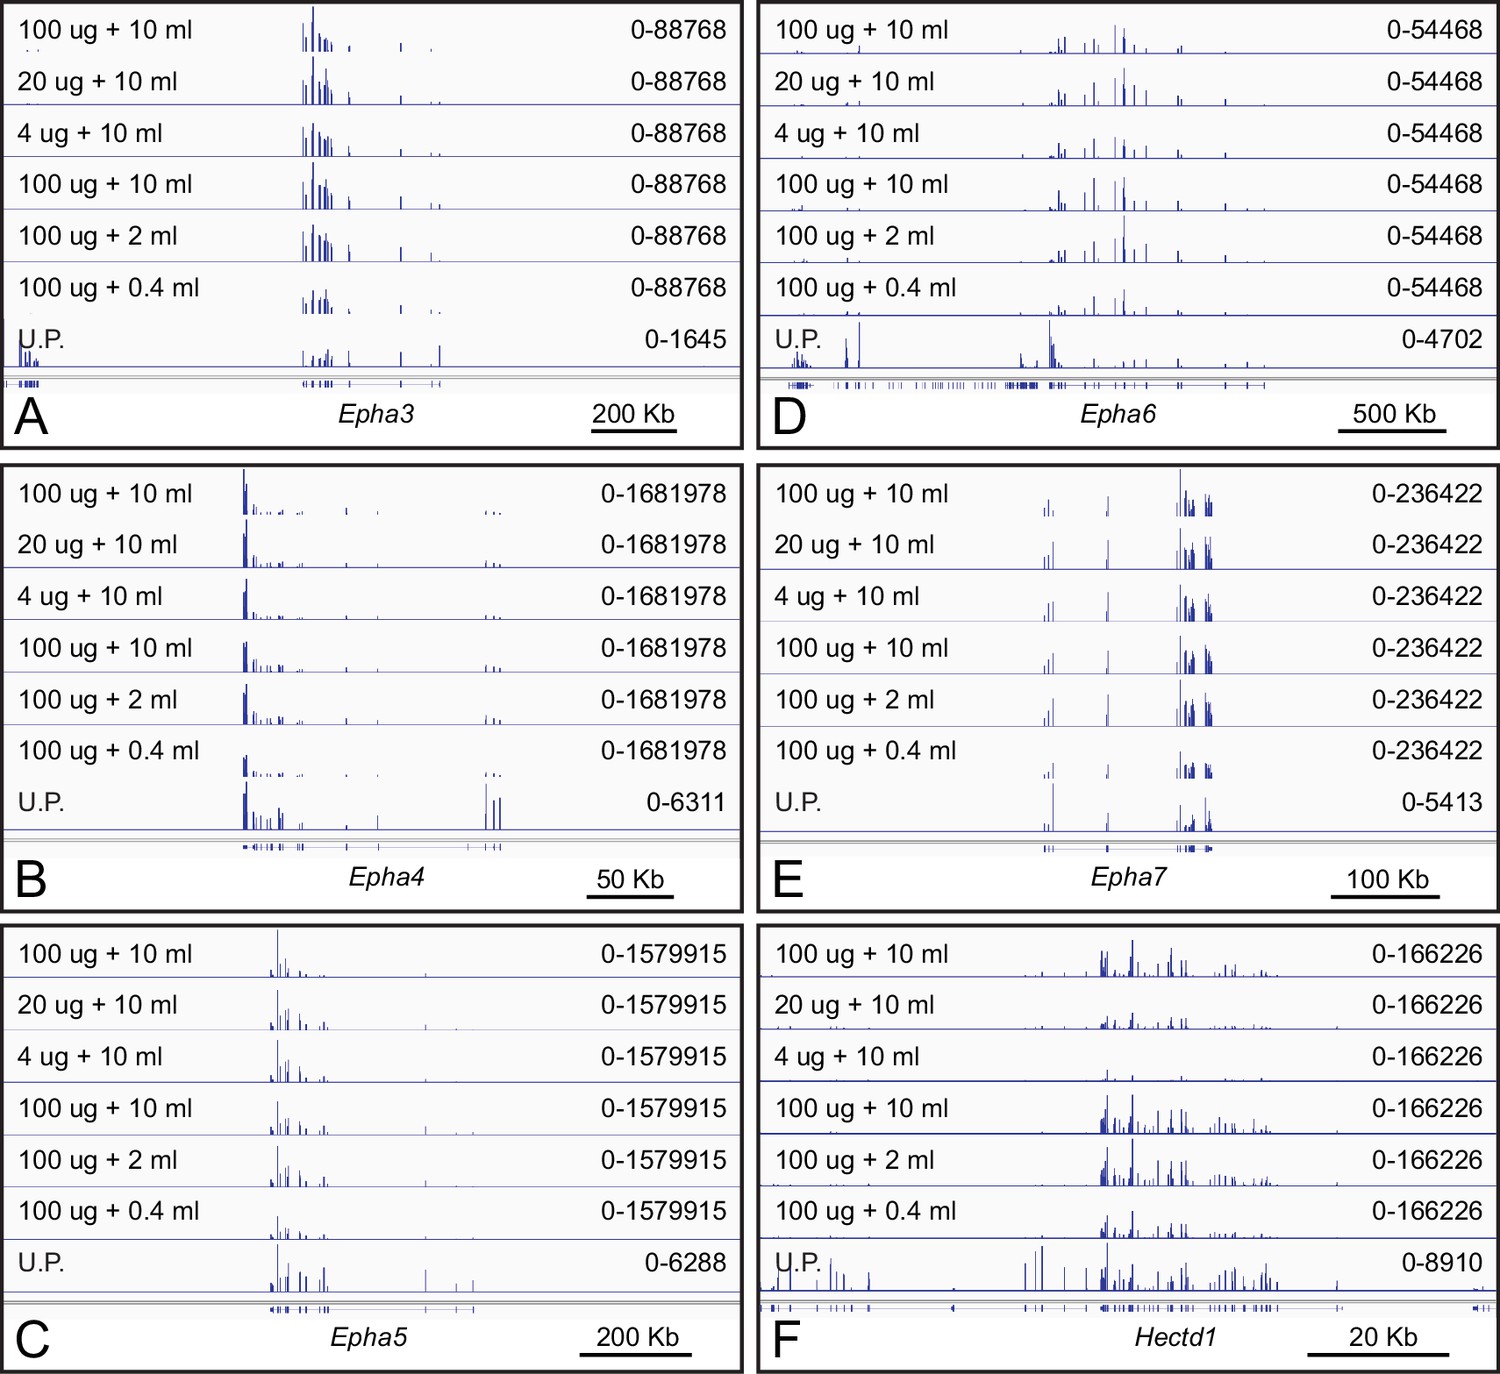
The capture of polyribosomes displaying nascent EPHA receptors by EFNA1-Fc bait is robust to variations in ACAPseq conditions.
(A–F) Genome browser images from ACAPseq using neonatal mouse brain polyribosomes with EFNA1-Fc bait, as shown in Figure 1B. The volume of serum-free conditioned medium (in mls) used for coating Protein-G magnetic beads and the RNA weight of neonatal mouse brain polyribosome (in ug) is listed for each ACAPseq sample. (A–E) The efficiency of Epha3, Epha4, Epha5, Epha6, and Epha7 capture shows little change under these experimental variations. A similar pattern for Epha8 is shown in Figure 2A. (F) Hectd1ph7, which likely represents an artifactual interaction with the EFNA1-Fc bait, shows decreasing capture efficiency with decreasing polyribosome input (top three tracks).
Figure 3 with 1 supplement
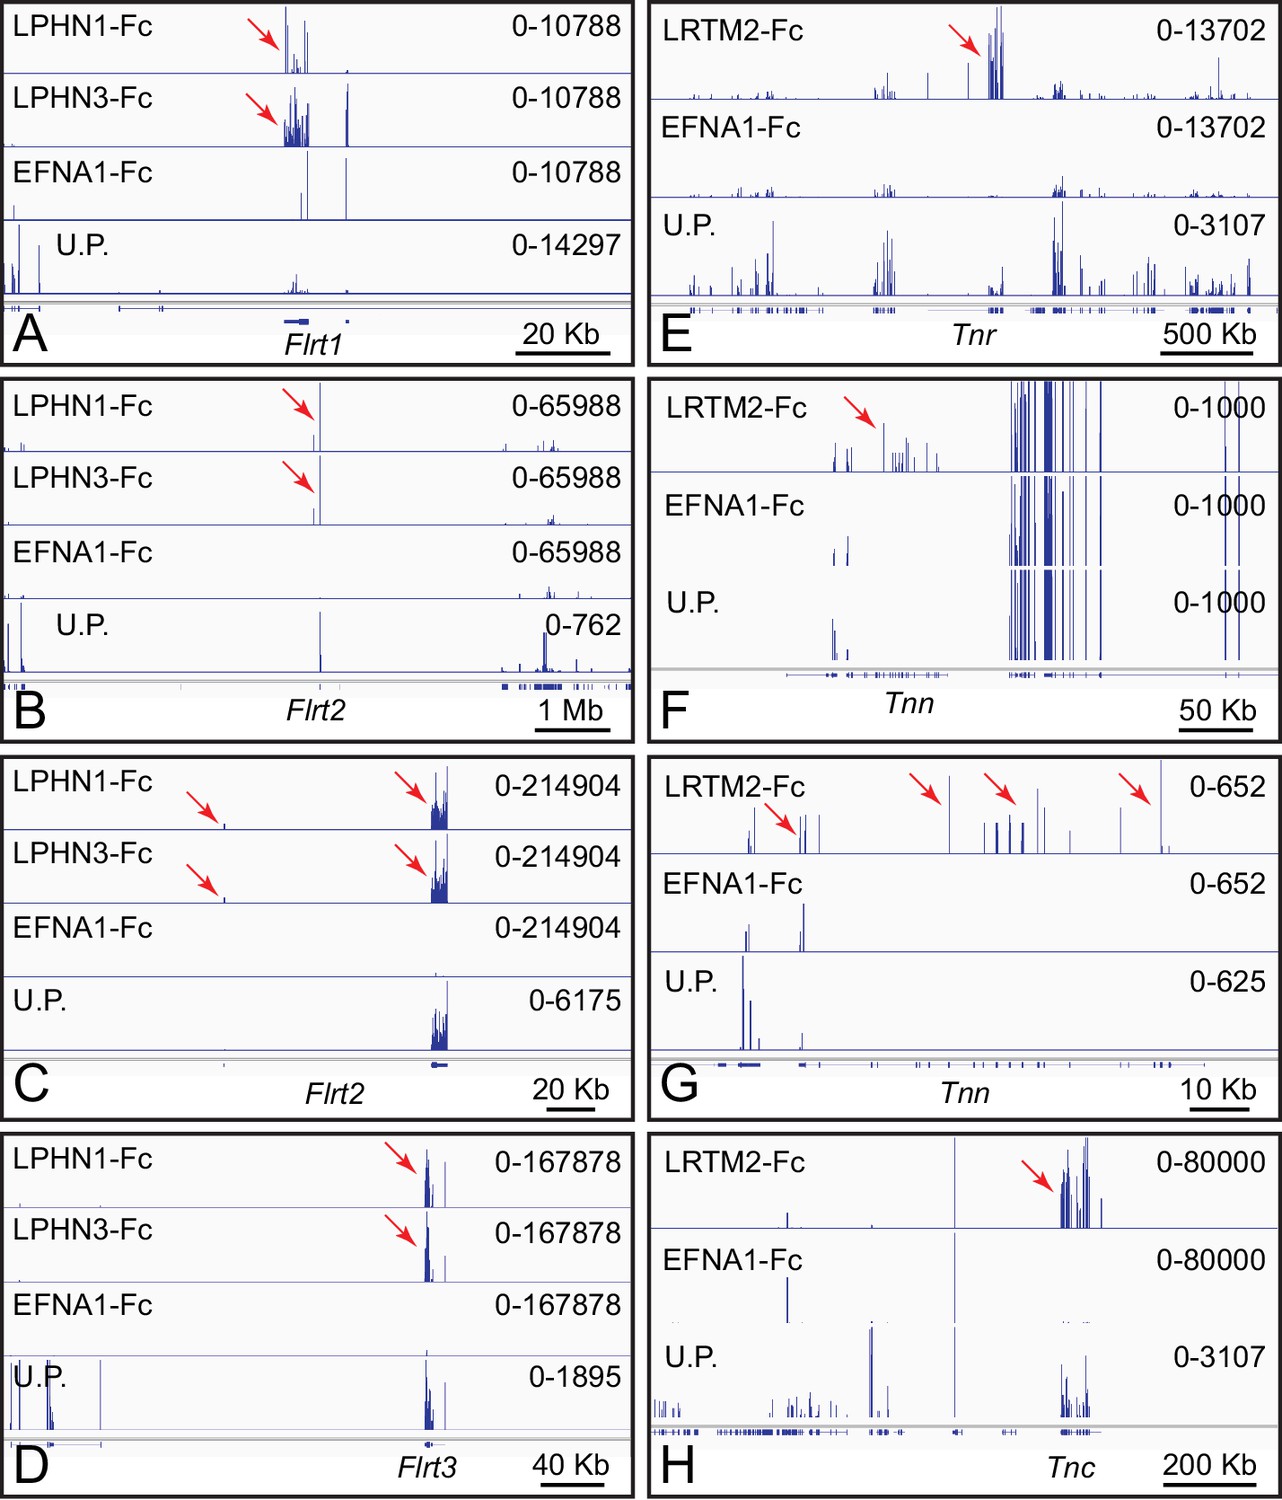
ACAPseq with LPHN1-Fc, LPHN3-Fc, and LRTM2-Fc baits.
(A–D) Flrt1, Flrt2, and Flrt3 mRNAs captured with LPHN1 and LPHN3 baits (red arrows). (B) and (C) are centered on the Flrt2 gene but have different horizontal and vertical scales. (E–H) Tnr, Tnn, and Tnc mRNAs captured with the LRTM2 bait (red arrows). (F) and (G) show the Tnn gene with different horizontal and vertical scales. In (H), the pile up of many reads at a single location in the LRTM2, EFNA1, and total polyribosome tracks is presumed to be a sequencing and/or alignment artifact. Genome browser images from ACAPseq of neonatal mouse brain polyribosomes, as shown in Figure 1B.
Figure 3—figure supplement 1
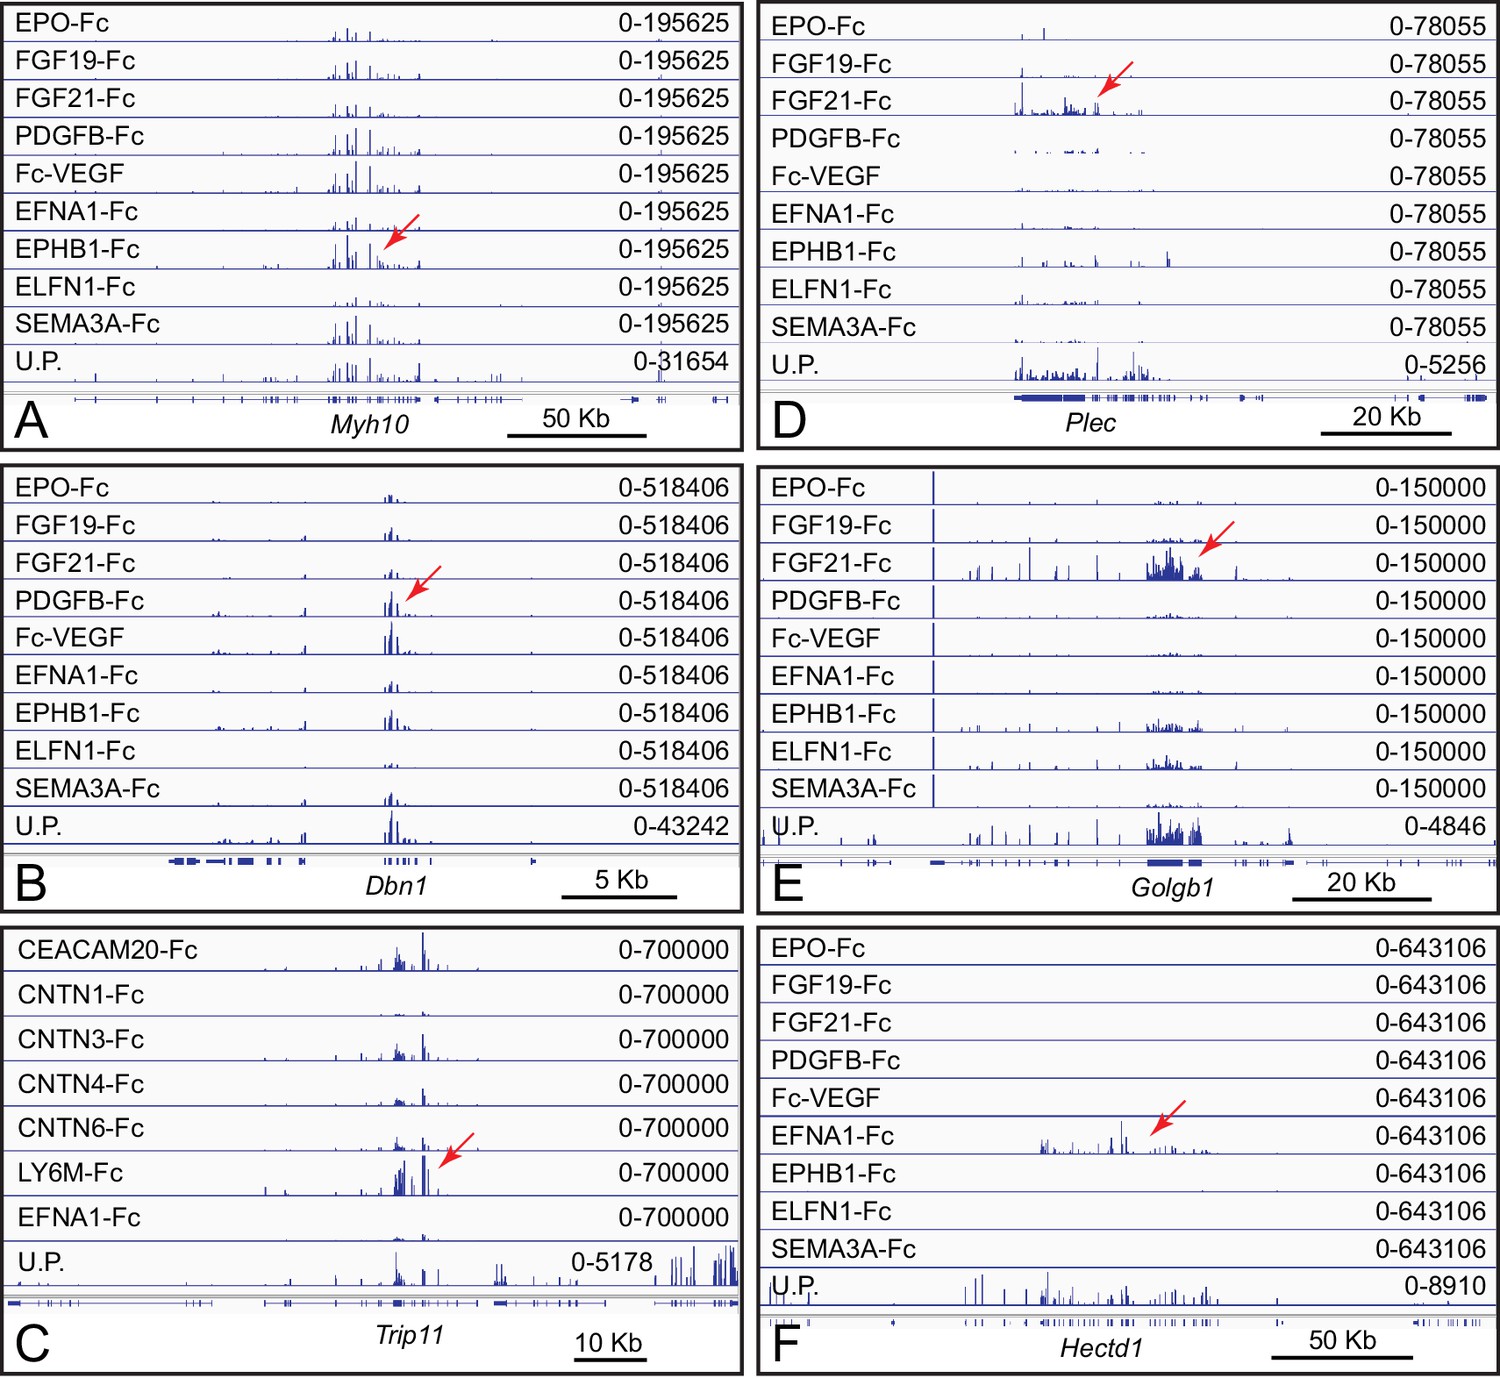
Presumptive artifactual and non-specific bait-target interactions in ACAPseq.
(A–E) Multiple and diverse baits capture Plec, Golgb1, Myh10, Dbn1, and Trip11 mRNAs, suggesting non-specific interactions. For this set of baits, FGF21-Fc gave the highest capture efficiencies for Plec and Golgb1 mRNAs. (F) Relatively selective capture of Hectd1 polyribosomes by EFNA1-Fc. HECTD1 is a cytoplasmic E3 ubiquitin ligase, and, therefore, this interaction is unlikely to be of biological significance. Genome browser images from ACAPseq of neonatal mouse brain polyribosomes are displayed as in Figure 1B. Red arrows indicate the reads from captured polyribosomes.
Figure 4
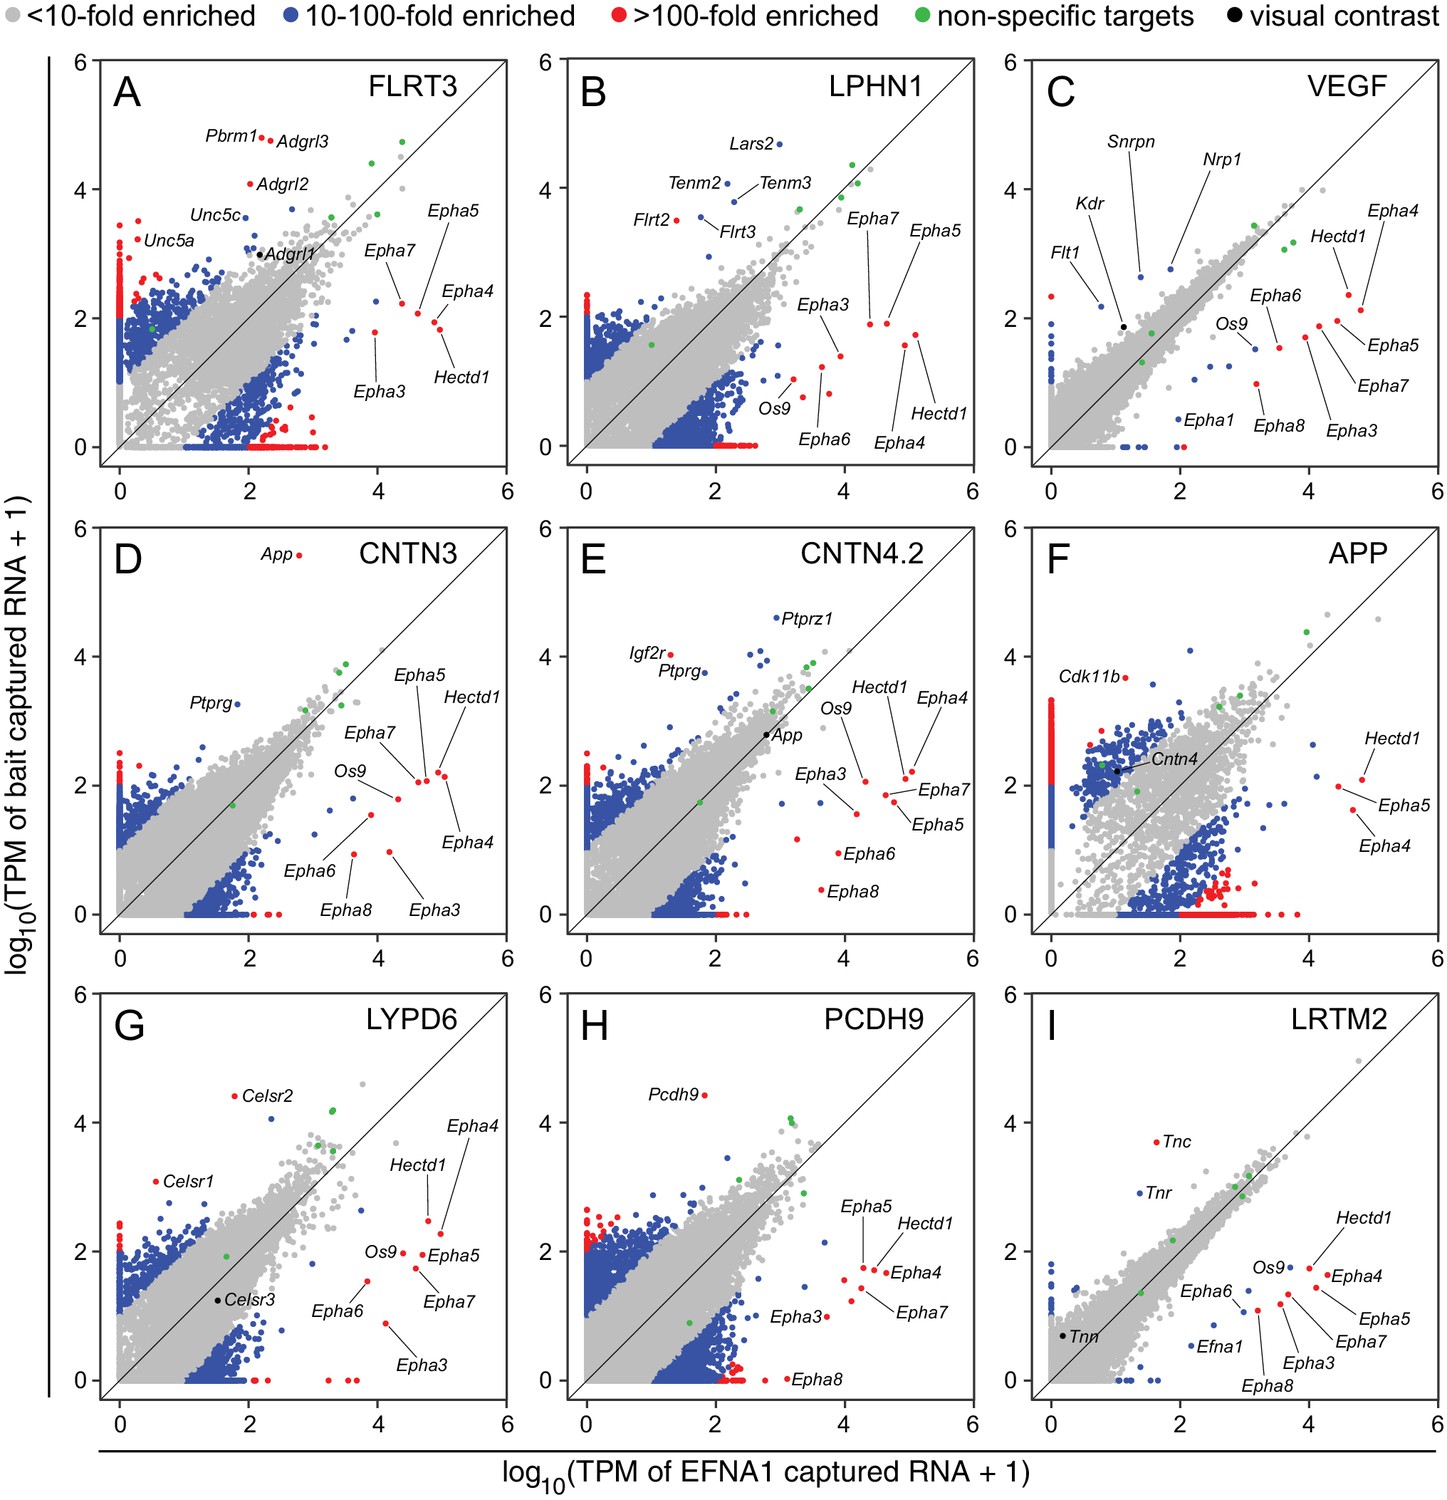
Two-dimensional scatterplots for genome-wide visualization and quantification of ACAPseq.
Log10 TPM counts are plotted for each of nine baits (indicated in each panel) vs. EFNA1 from the same experiment. Multiple Epha receptor mRNAs, known EFNA1 targets, are captured by the EFNA1 bait. Data points representing mRNAs with different fold enrichments are indicated by grey, blue, and red dots. Five polyribosome targets – Dbn1, Golgb1, Myo10, Plec, Trip11 – with promiscuous binding (presumably derived from ‘sticky’ nascent polypeptides; Figure 3—figure supplement 1) are represented by green dots.
Figure 5 with 2 supplements
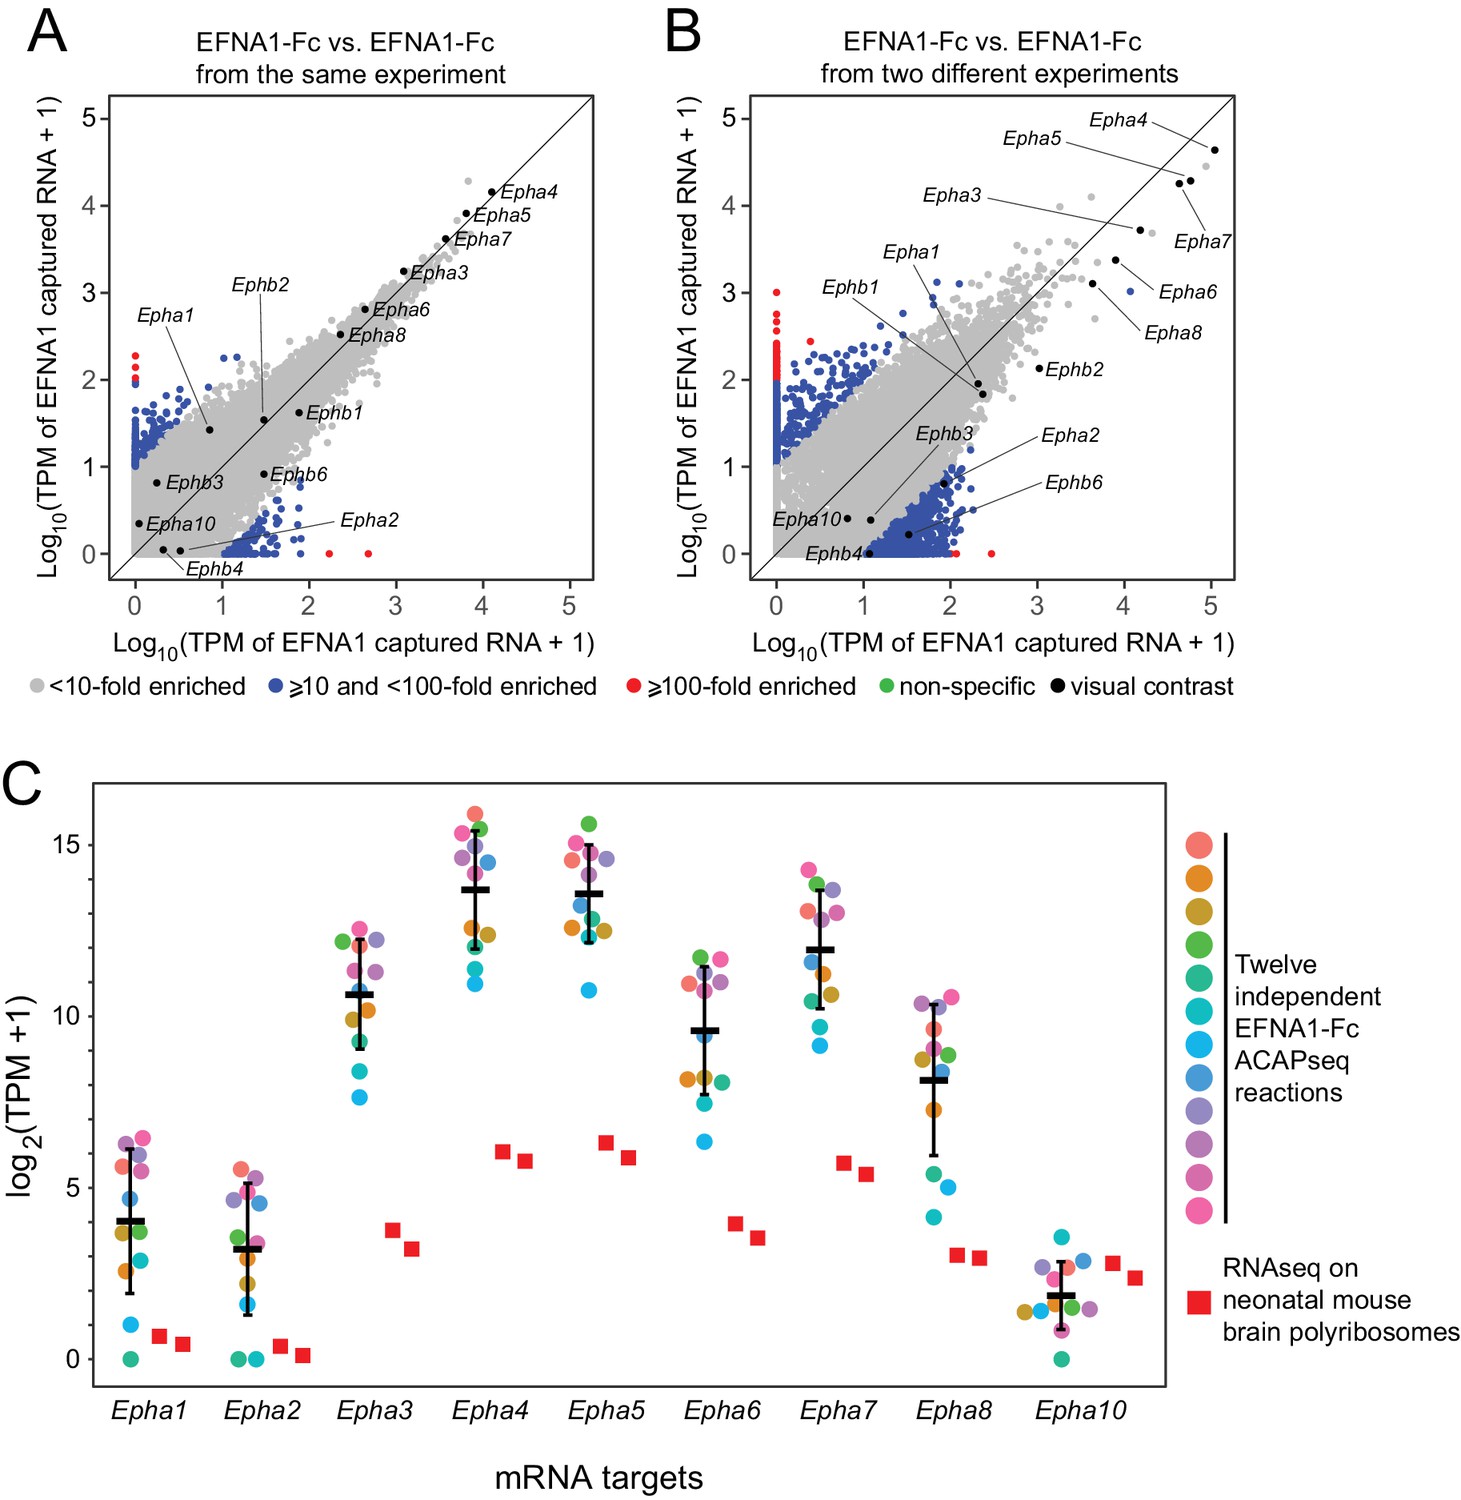
Reproducibility of ACAPseq assessed with EFNA1 capture of multiple EPHA receptor mRNAs.
(A,B) ASPs of two EFNA1 ACAPseq reactions from (A) the same experiment and (B) two independent experiments. (C) TPMs for two independent starting neonatal mouse brain polyribosome samples (r = 0.984 for all protein-coding genes) and 12 independent EFNA1 ACAPseq reactions for each of nine Epha mRNAs. The vertical axis spans a 32,000-fold range. Error bars, mean ±S.D. of the log2 (TPM +1) values.
Figure 5—figure supplement 1
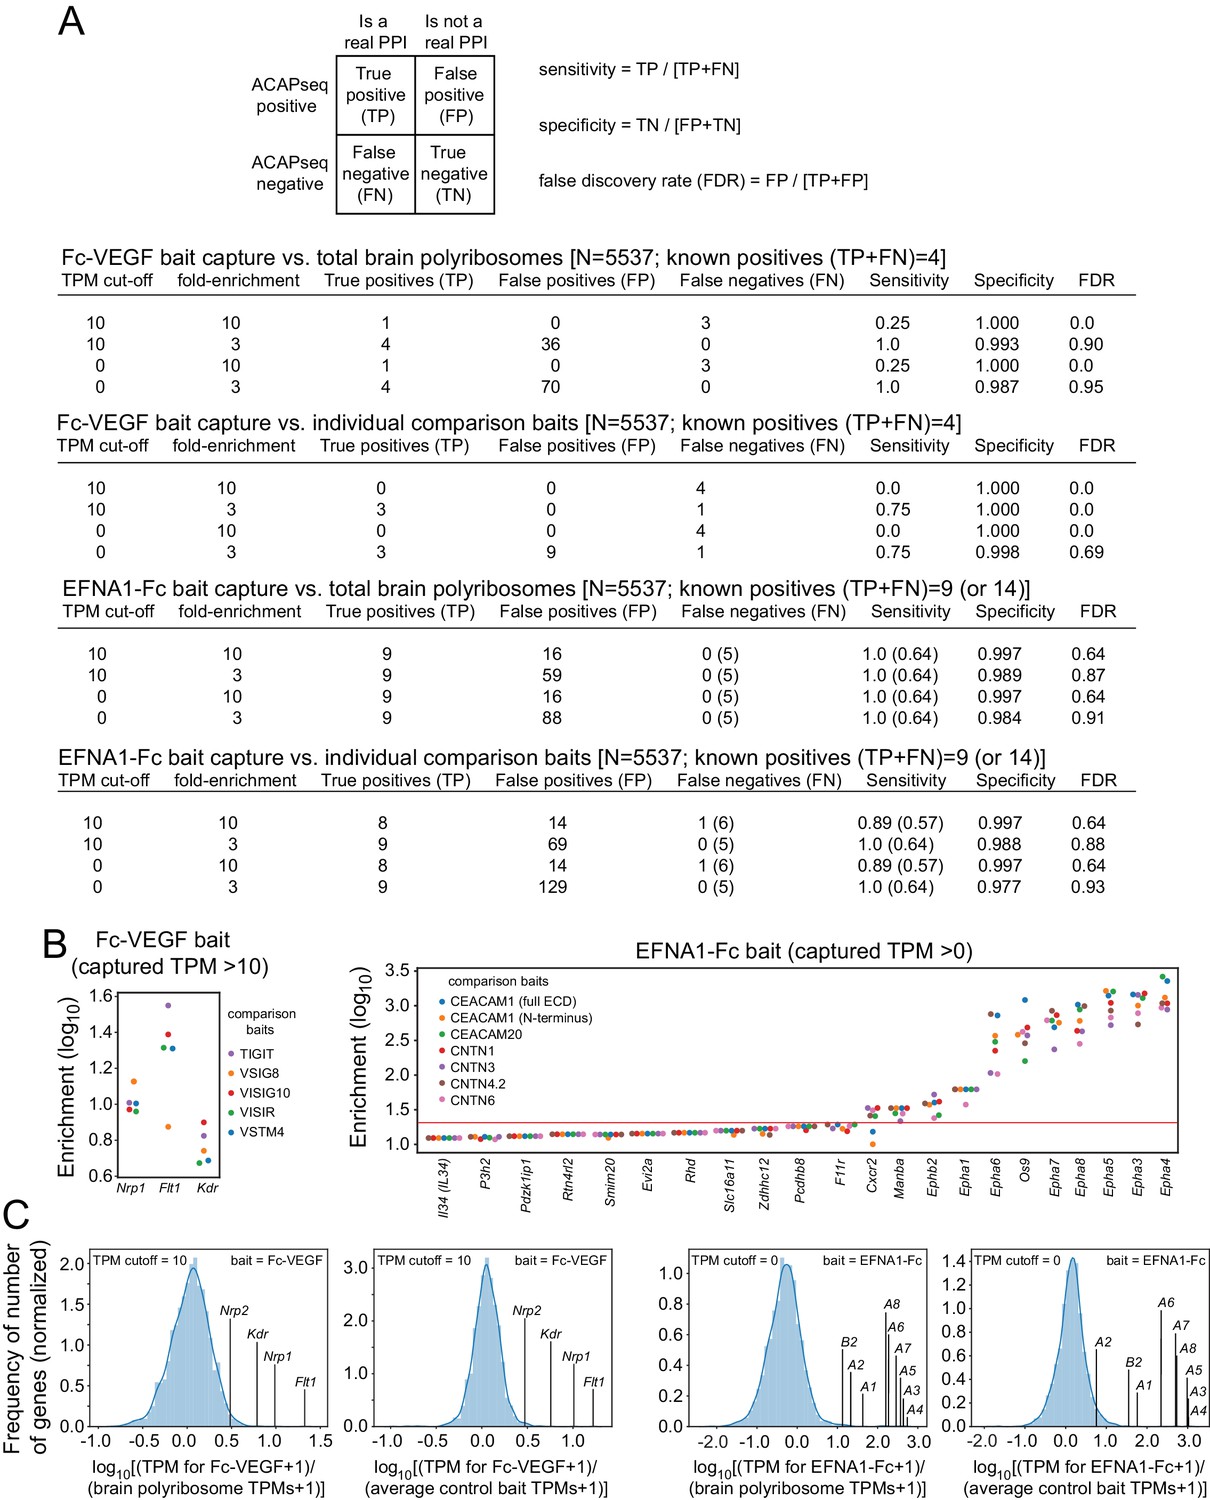
Sensitivity, specificity, and FDR for ACAPseq with Fc-VEGF and EFNA1-Fc baits.
(A) Dependence of sensitivity, specificity, and FDR on different combinations of (1) bait-captured TPM cut-offs and (2) fold-enrichment relative to either total brain polyribosomes or capture by unrelated baits. The target space was computationally restricted to mRNAs with TPM >0 in mouse brain polyribosomes and coding for secreted or trans-membrane proteins (N = 5537). (B) Enrichment of individual Fc-VEGF-captured mRNAs (left) and EFNA1-Fc-captured mRNAs (right) that had the highest enrichment ratios relative to each of the comparison baits run in the same experiment. The red line in the EFNA1-Fc plot indicates a cut-off that separates eight EPH receptor mRNAs and OS9 mRNA from all other targets, with a cut-off requirement that all enrichment ratios for the given target must exceed the threshold. (C) mRNA enrichment ratios for individual VEGF and EFNA1 targets plotted together with the enrichment ratios of the entire population of mRNAs with capture TPMs exceeding the indicated cut-offs. For each bait, the left plot shows the ratio of mRNAs from bait-captured vs. total brain polyribosomes, and the right plot shows the ratio of mRNAs captured for the specific bait vs. the mean for the comparison baits.
Figure 5—figure supplement 2
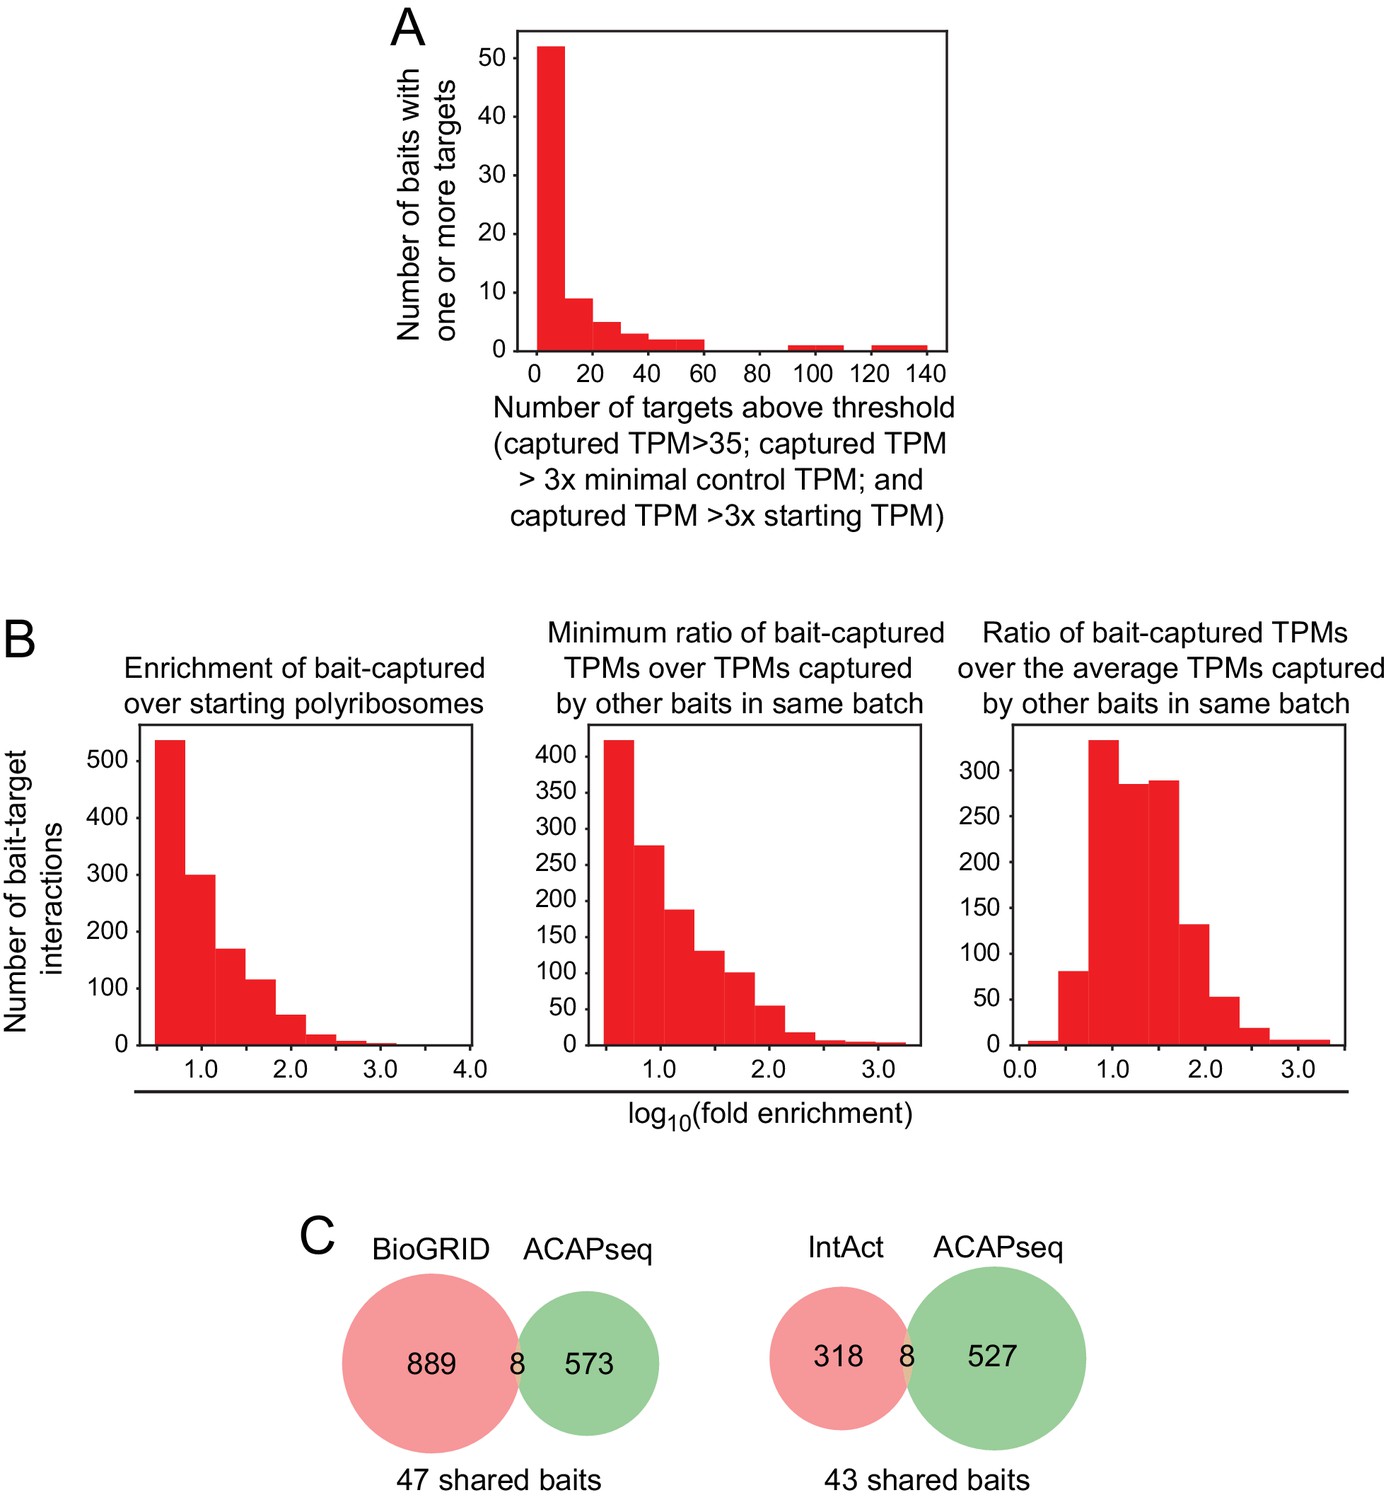
Quantifying ACAPseq bait-target pairs with a defined threshold.
(A) Histogram showing the number of targets obtained per bait for ACAPseq with neonatal mouse brain polyribosomes for the 77/92 baits that had one or more targets. The bins represent 1 – 10, 11 – 20, 21 – 30, etc. targets. The 16 baits with zero targets are not shown. The target threshold was set at (1)>35 captured TPMs, (2) captured TPMs > 3 x the maximal number of TPMs captured with any of the other baits used in the same experimental cohort, and (3) captured TPMs > 3 x the starting TPMs in unselected polyribosomes. (B) Histograms showing the number of bait-target pairs with the corresponding values for (1) the fold enrichment of the bait-captured TPMs compared to the starting polysomes, (2) the minimum ratio of the captured TPMs for the bait of interest compared to the captured TPMs for each of the other baits in the same batch, and (3) the ratio of the captured TPMs for the bait of interest compared to the average captured TPMs for each of the other baits in the same batch. (C) Venn diagrams showing shared and unshared targets for ACAPseq [with targets that meet the threshold as defined in (A) above] and the PPIs listed in the BioGRID and IntAct databases. For BioGRID, the shared interactions are: JAM3-JAM2, EPHA4-EFNA1, EPHA3-EFNA1, PTPRZ1-CNTN1, CELSR1-LYPD6, CELSR2-LYPD6, NOTCH1-CNTN1, FLRT1-LPHN3. For IntAct, the shared interactions are: JAM3-JAM2, EPHA4-EFNA1, EPHA7-EFNA1, APP-CNTN3, PTPRZ1-CNTN1, ADGRL3-FLRT2, ADGRL3-FLRT3, UNC5B-FLRT3.
Figure 6 with 1 supplement
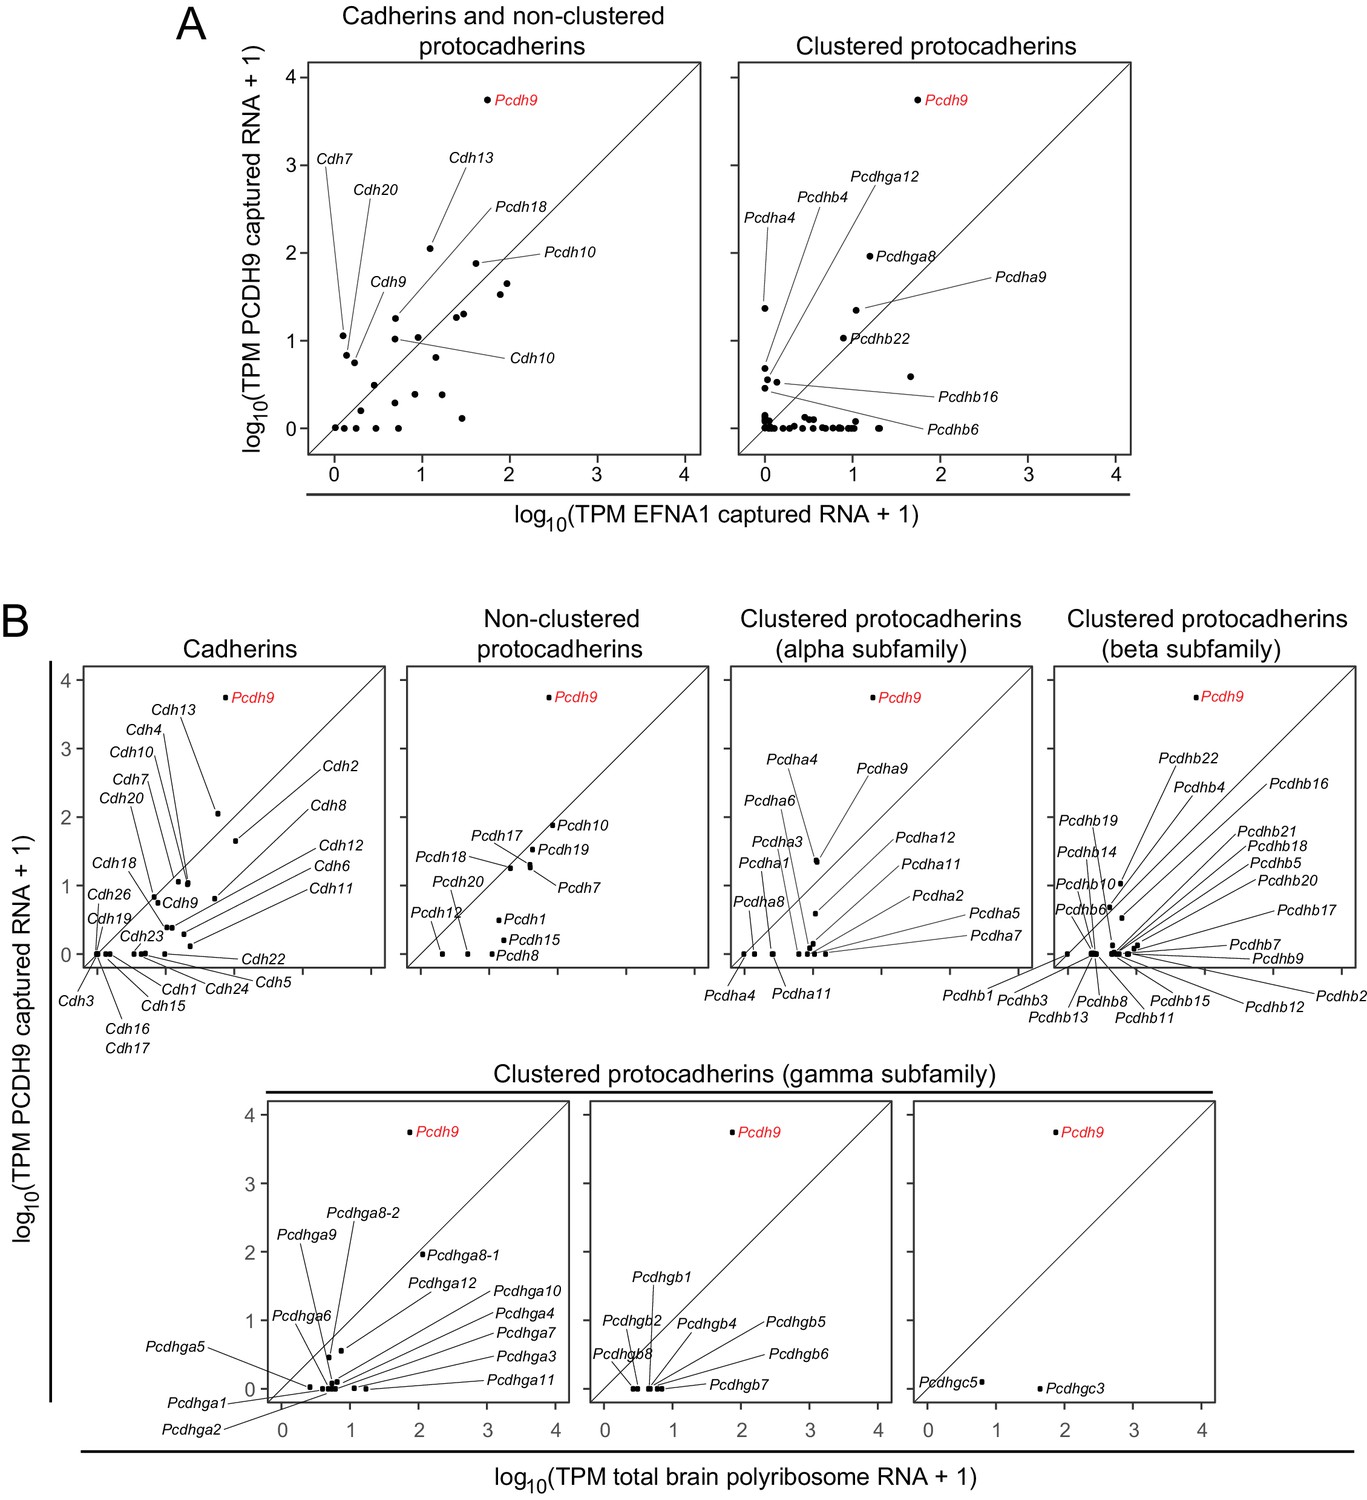
ACAPseq with PCDH9-Fc is highly selective for Pcdh9 polyribosomes relative to polyribosomes from other cadherin and protocadherin family members.
(A) ASPs showing PCDH9 vs. EFNA1 capture of mRNA coding for cadherin and non-clustered protocadherin family members (left) and clustered protocadherin family members (right). Only those mRNAs that were captured more efficiently by PCDH9-Fc compared to EFNA1-Fc are labeled. (B) ASPs showing TPMs for PCDH9 captured mRNA vs. total neonatal mouse brain polyribosome mRNA coding for cadherins, non-clustered protocadherins, and subfamilies of clustered protocadherins. Pcdh9 mRNA is captured far more efficiently than any other cadherin/protocadherin family member (red label).
Figure 6—figure supplement 1
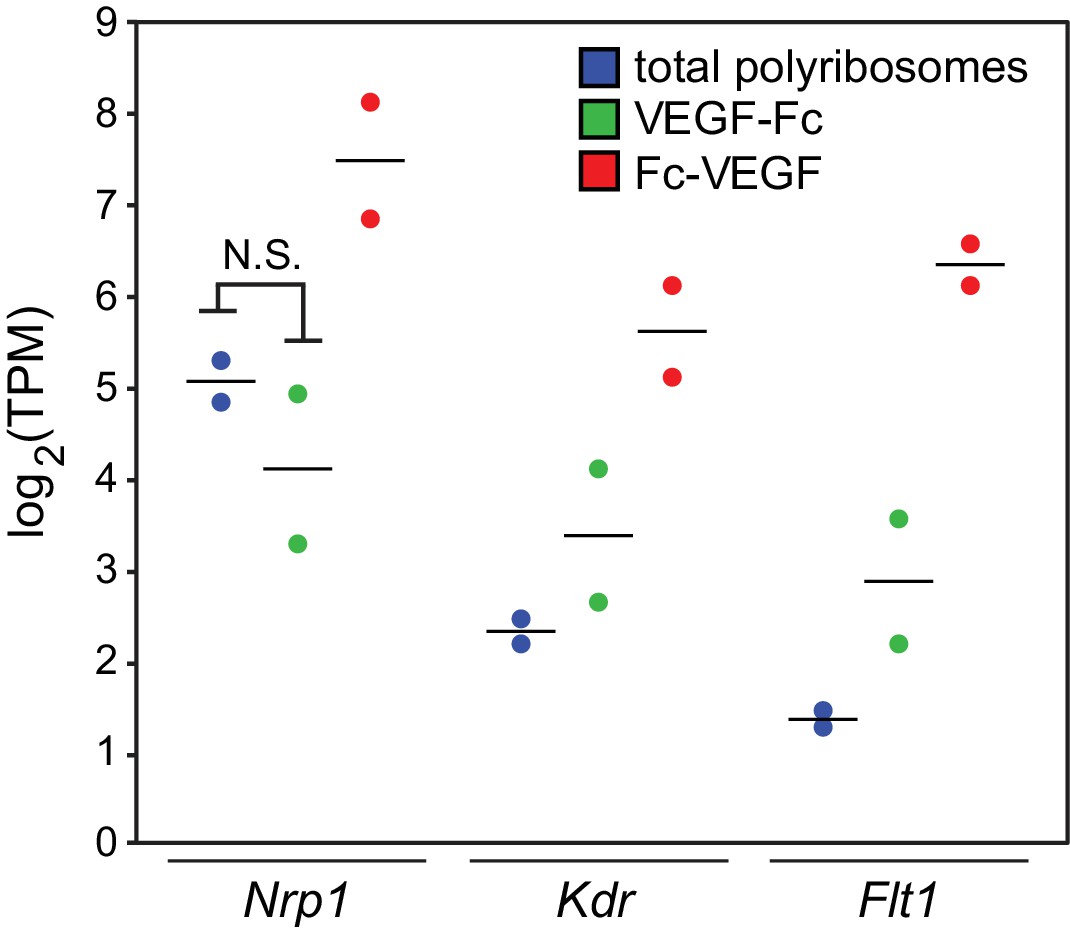
Fc-VEGF is a more effective bait than VEGF-Fc.
Comparison of two independent experiments for each bait, showing Flt1, Kdr, and Nrp1 TPMs for neonatal mouse brain polyribosome mRNA (‘total polyribosomes’), VEGF-Fc captured mRNA, and Fc-VEGF captured mRNA. Bars, mean of the log2 values. N.S., not significant, that is the false discovery rate (=1 PPDE) was larger than 0.05 (as determined using RSEM and EBseq; PPDE, posterior probability, differentially expressed).
Figure 7
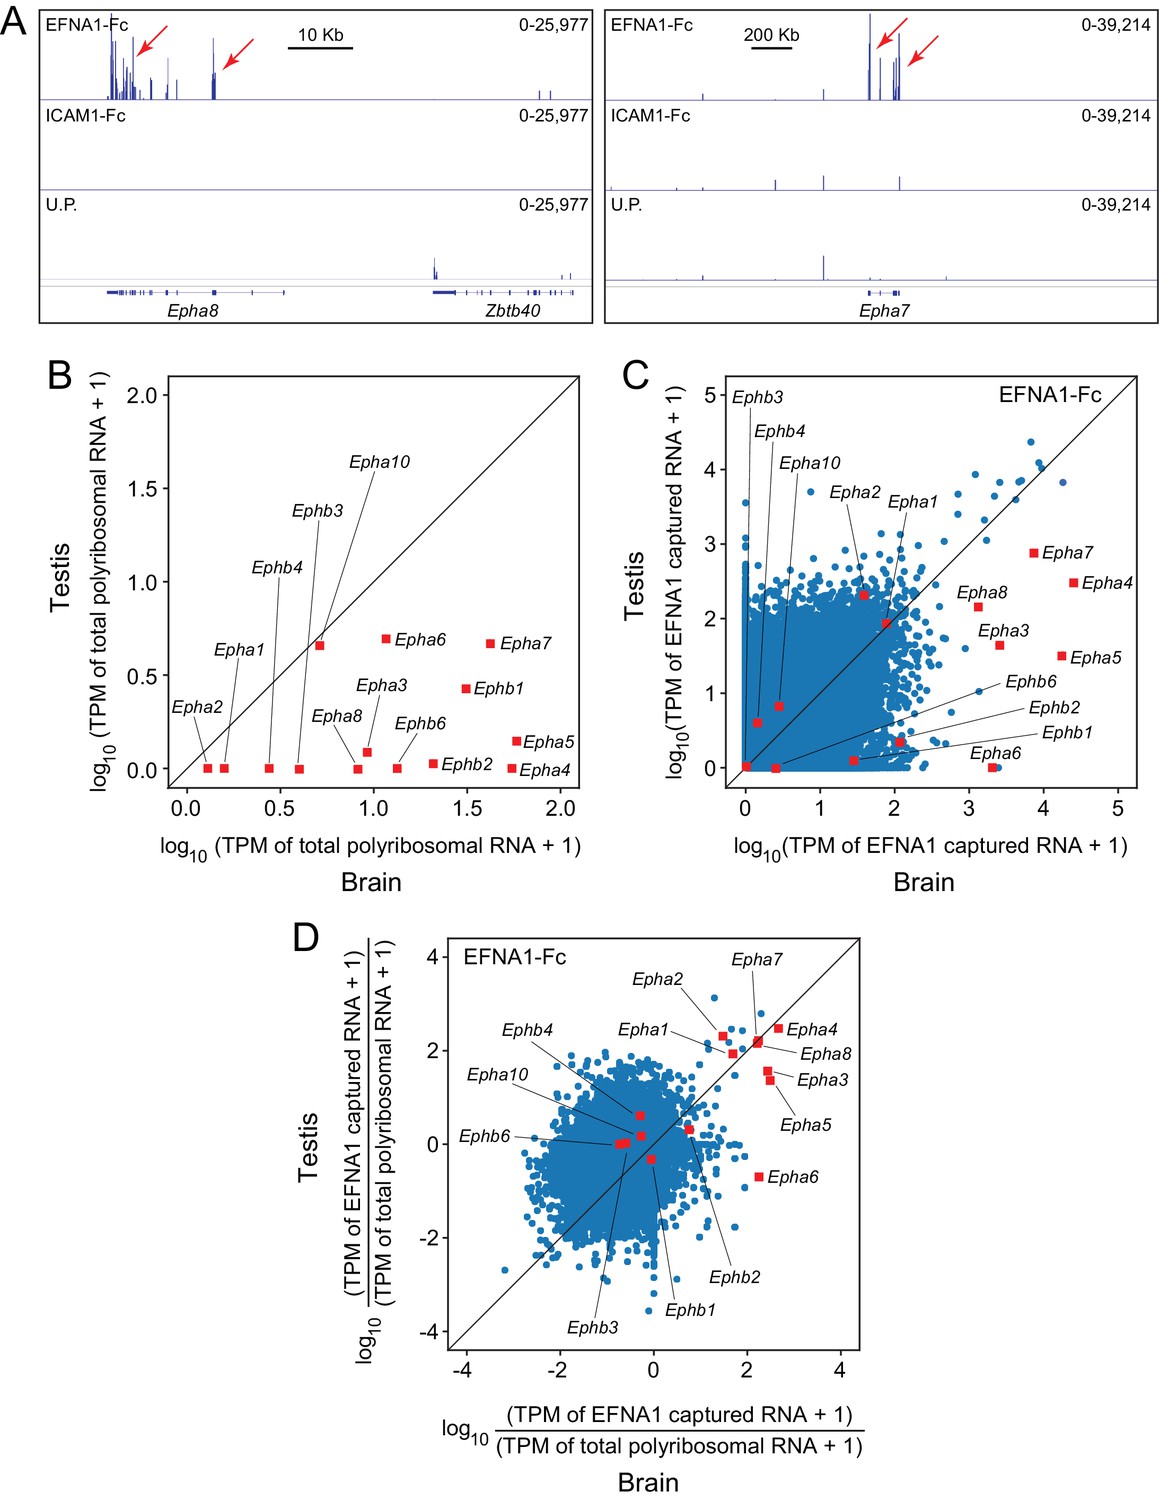
ACAPseq using polyribosomes from mouse testis.
(A) Epha8 and Epha7 mRNAs captured with EFNA1-Fc baits (red arrows). Genome browser images, as shown in Figure 1B. (B) Abundances of transcripts coding for EPHA and EPHB family members in testis vs. brain total polyribosomes. (C) ASP of EFNA1-Fc captured from testis vs. brain polyribosomes. (D) Comparison of testis vs. brain EFNA1-Fc ACAPseq, with read counts from each captured transcript normalized to the starting abundance of that transcript.
Figure 8 with 2 supplements

ACAPseq capture of alternately spliced isoform transcripts of Cntn4 and Epha7.
(A) Cntn4 gene structure showing the location of an alternate exon 3’ of coding exon 15. The alternate exon has a short open reading frame followed by a 3’ untranslated region. The short CNTN4 isoform is encoded by transcripts that end with the alternate exon and the long CNTN4 isoform is encoded by transcripts that skip the alternate exon. (B) Diagrams of the long and short CNTN4 isoforms showing the location of the PTPRG binding site in the second and third Ig domains (Nikolaienko et al., 2016). The short isoform is missing Fn domains 2 – 4. Both isoforms are GPI-anchored plasma membrane proteins. (C) Epha7 gene structure showing the location of an alternate exon 3’ of coding exon 9. The alternate exon has a short open reading frame followed by a 3’ untranslated region. The short EPHA7 isoform is encoded by transcripts that end with the alternate exon and the long EPHA7 isoform is encoded by transcripts that skip the alternate exon. (D) Diagrams of the long and short EPHA7 isoforms showing the location of the EFNA1 binding site in the Eph domain (Himanen et al., 2009). The short isoform has a small intracellular tail in place of the receptor tyrosine kinase domain. (E,F) Genome browser images from ACAPseq of neonatal mouse brain polyribosomes, as shown in Figure 1B, with PTPRG-Fc (E) and EFNA1-Fc (F) as baits. PTPRG-Fc captured Cntn4, and EFNA1-Fc captured Epha7. The regions shown correspond to the diagrams in (A) and (C).
Figure 8—figure supplement 1
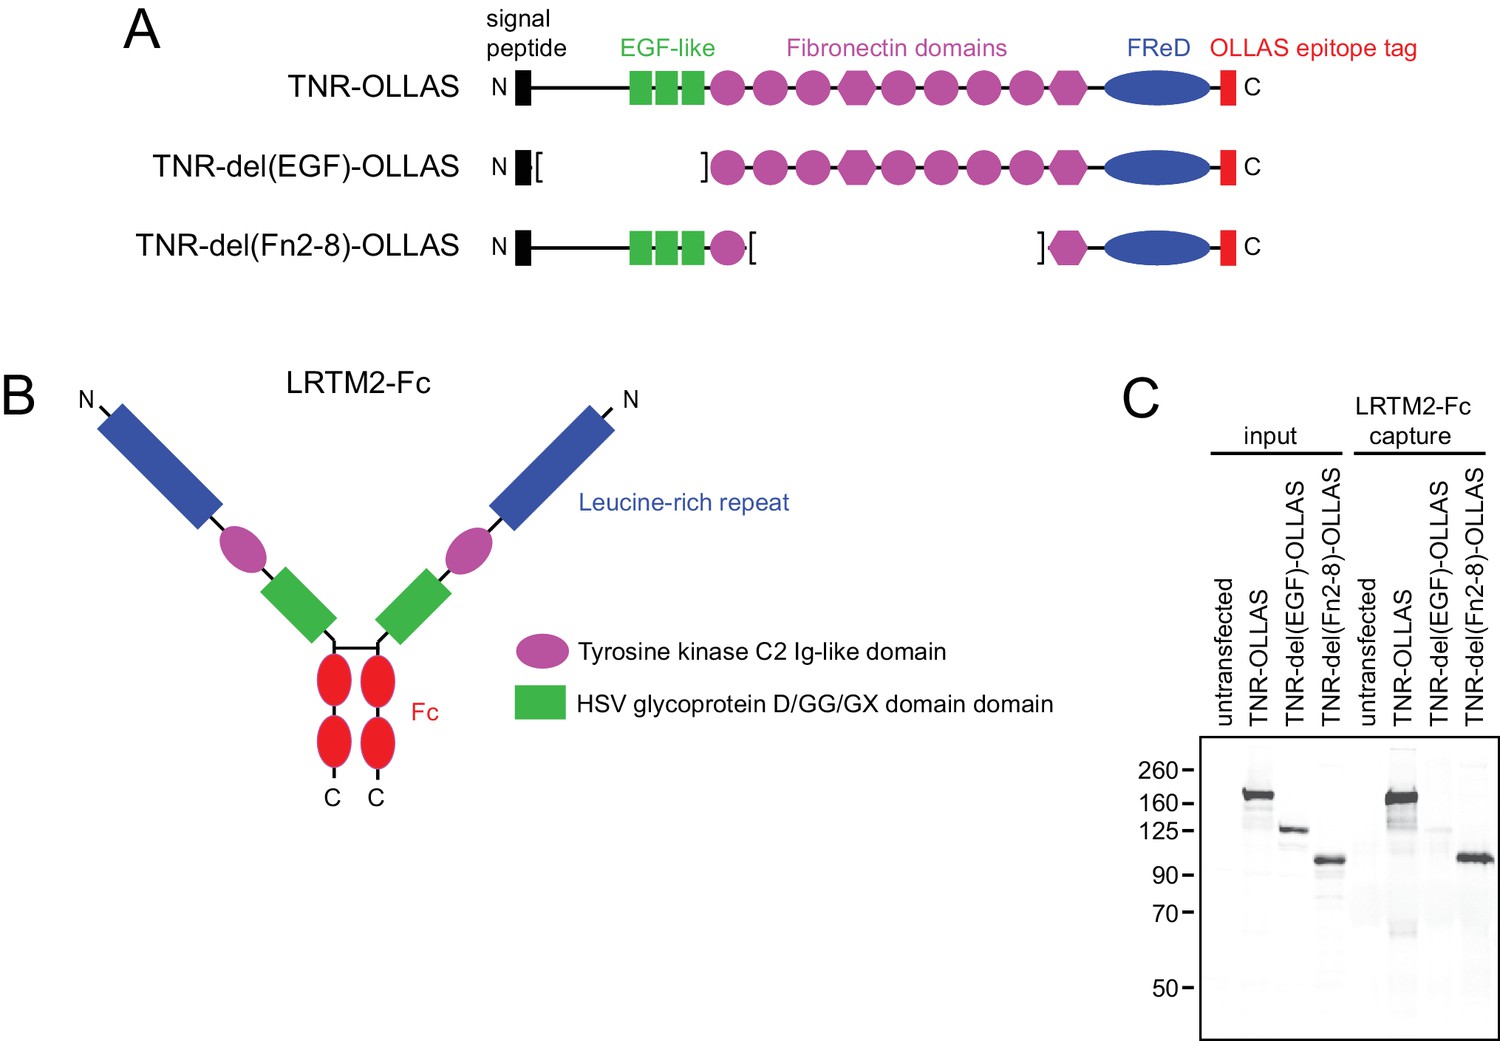
The amino-terminal domain(s) of TNR bind LRTM2-Fc.
(A) Domain structure of TNR showing the locations of the principle domains, the carboxy-terminal OLLAS tag (Park et al., 2008) that was appended to the open-reading frame, and the two TNR deletion derivatives. The trimerization domain is located between the signal peptide and the EGF-like domains. (B) Schematic of LRTM2-Fc. (C) Immunoblot using the OLLAS mAb to detect input and LTRM2-Fc-bound TNR-OLLAS and its derivatives from transiently transfected HEK293T cells.
Figure 8—figure supplement 2

LYPD6-AP binds to CELSR1 and CELSR2 but not to CELSR3 on the surface of living cells.
(A) Schematic of CELSR1 (CELSR2 and CELSR3 have nearly identical domain arrangements), glycosylphosphotidylinositol (GPI)-anchored LYPD6 (Özhan et al., 2013), and the LYPD6-AP dimer (Du et al., 2000. Horizontal double lines represent the plasma membrane. (B) AP histochemistry following LYPD6-AP or AP alone binding to live HEK293T cells grown on gelatin-coated coverslips and transfected with the indicated full-length CELSR1, CELSR2, or CELSR3 expression plasmids. The panel on the right shows a positive control, processed in parallel, in which HEK293T cells expressing Frizzled4 are bound by Norrin-AP (Smallwood et al., 2007). Scale bar, 500 um.
Figure 9 with 1 supplement
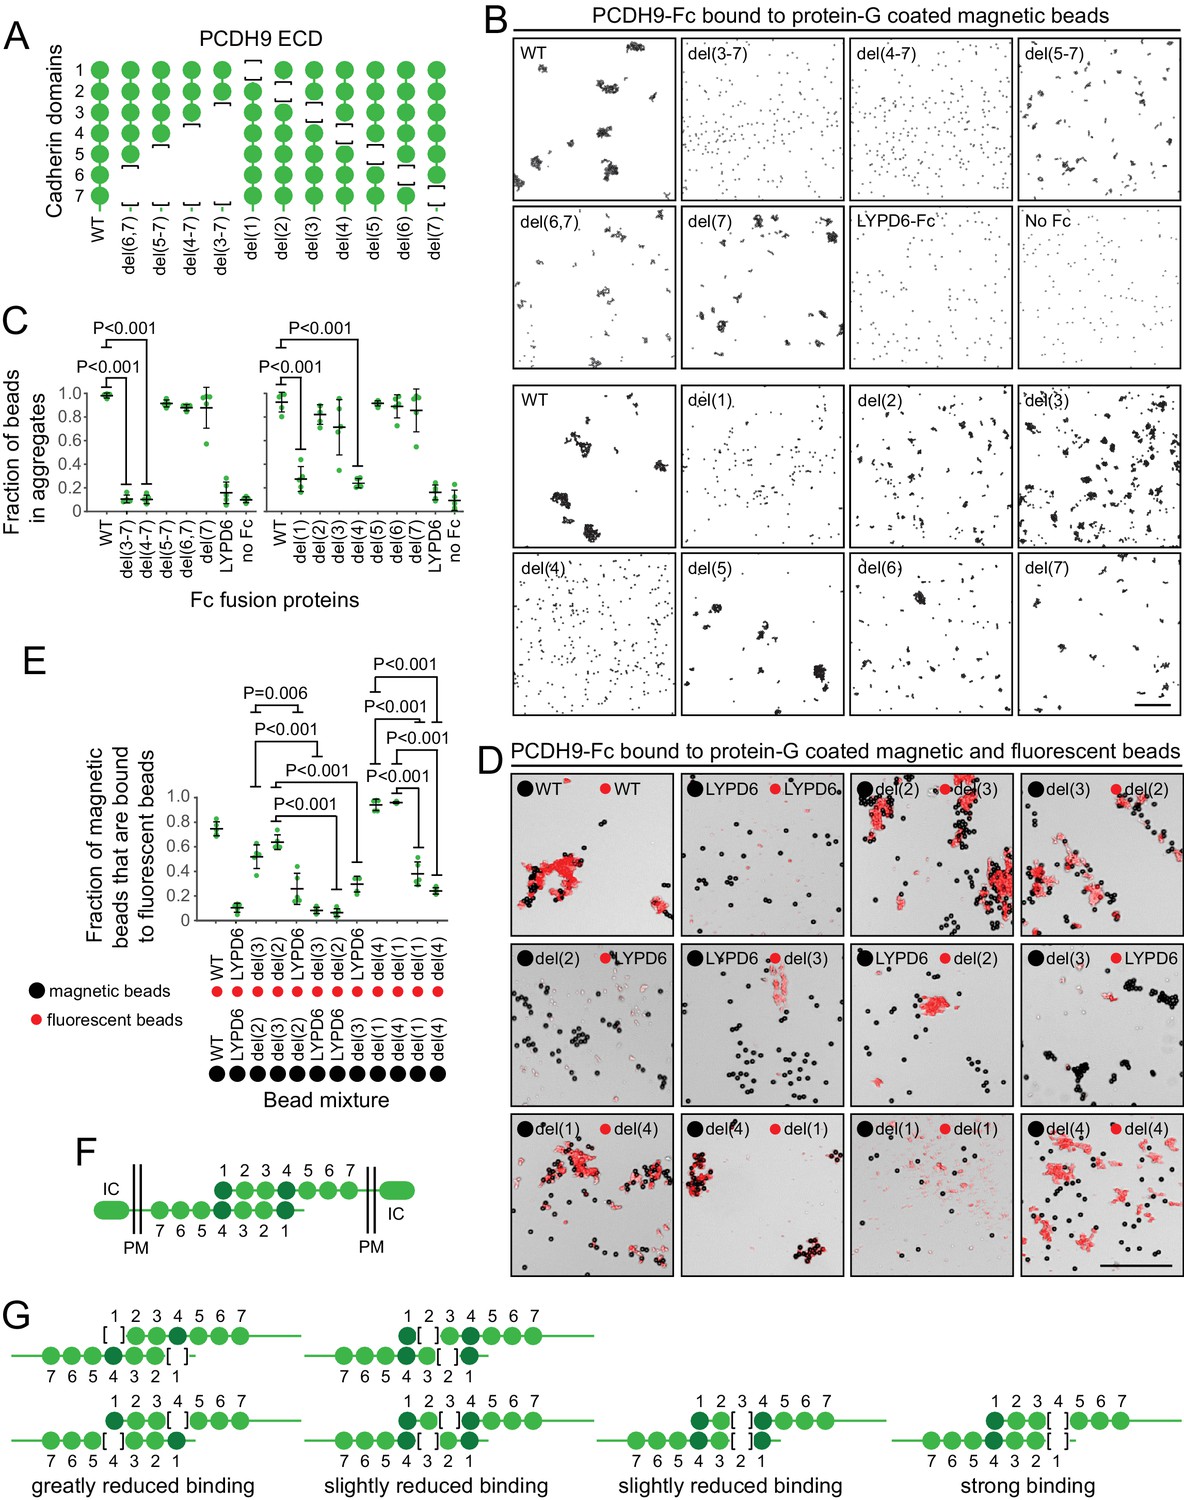
Molecular basis of PCDH9 homophilic binding.
(A) Deletion derivatives of the ECD of PCDH9-Fc. Immunoblots of WT and mutant proteins are shown in Figure 9—figure supplement 1. (B) Aggregation of Protein-G-magnetic beads coated with the indicated PCDH9-Fc fusions. Control beads were either coated with LYPD6-Fc or were uncoated. Scale bar, 50 um. (C) Quantification of the fraction of beads that were aggregated (i.e., two or more beads in direct contact) from five representative images per condition. For (C) and (E), each data point represents 200 – 300 beads from one image; bars, mean and standard deviation; and N = 5 for each group. (D) Aggregation of Protein-G-magnetic beads (large black spheres) and red fluorescent microspheres (small red spheres) coated with the indicated PCDH9-Fc fusions. Control beads were coated with LYPD6-Fc. Bead aggregates spread out when placed on a slide and cover-slipped, distorting the geometry of bead contacts. Scale bar, 50 um. (E) Quantification of the fraction of magnetic beads that were in contact with one or more red fluorescent beads from five representative images per experiment. (F) Model for the anti-parallel homophilic binding between PCDH9 domains 1 – 4. (G) Summary of bead aggregation data with single domain mutants. Bead binding experiments were performed independently three times and were highly reproducible. Images and quantification are from one set of experiments.
Figure 9—figure supplement 1
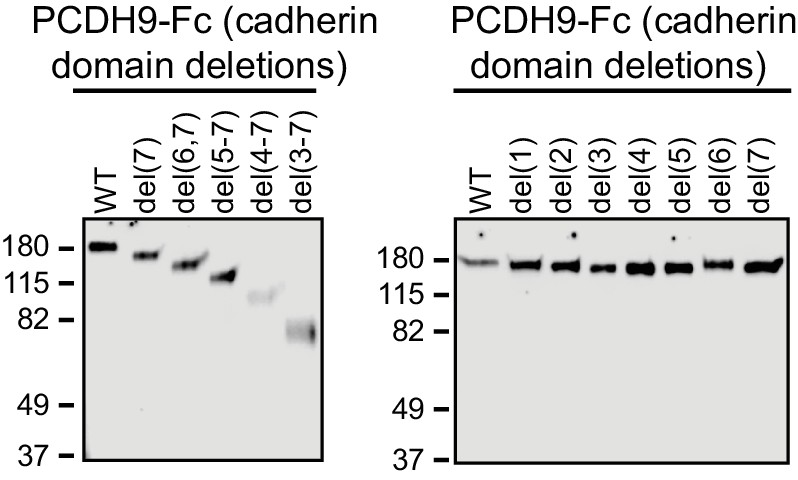
Immunoblots of secreted PCDH9-Fc ECD domain fusions used for bead binding assays in Figure 9.
Proteins were detected with anti-human IgG.
Additional files
-
Supplementary file 1
Baits and captured targets.
DC, plasmids from Davide Comoletti. WW, plasmids from Woj Wojtowicz. The threshold for target interaction is: (1)>35 captured TPMs, (2) captured TPMs > 3 x the maximal number of TPMs captured with any of the other baits used in the same experimental cohort, (3) captured TPMs > 3 x the TPMs in the unselected polyribosomes, and (4) the target is a secreted or membrane protein (as designated by https://www.proteinatlas.org/ humanproteome/secretome). The following baits used the mouse Fz8 signal peptide: ASTM1, ASTN2, EPO, FGF19, FGF21, VEGF-Fc. All other baits used the endogenous signal peptide. The last six amino acids of the bait sequence is shown for those baits that are derived from a protein with an amino-terminal extracellular domain followed by a trans-membrane domain. The following baits are human sequences: EPO, FGF19, FGF21, VEGF-Fc, Fc-VEGF. All others are mouse sequences.
- https://doi.org/10.7554/eLife.40982.019
-
Supplementary file 2
ACAPseq with six baits: abundance and fold enrichment of targets mRNAs (none)
- https://doi.org/10.7554/eLife.40982.020
-
Supplementary file 3
Binding properties of PCDH9 mutants.
The PCDH9 binding data refer to Figure 9.
- https://doi.org/10.7554/eLife.40982.021
-
Supplementary file 4
All supra-threshold targets for the 92 baits.
- https://doi.org/10.7554/eLife.40982.022
-
Transparent reporting form
- https://doi.org/10.7554/eLife.40982.023
Download links
A two-part list of links to download the article, or parts of the article, in various formats.
Downloads (link to download the article as PDF)
Open citations (links to open the citations from this article in various online reference manager services)
Cite this article (links to download the citations from this article in formats compatible with various reference manager tools)
Affinity capture of polyribosomes followed by RNAseq (ACAPseq), a discovery platform for protein-protein interactions
eLife 7:e40982.
https://doi.org/10.7554/eLife.40982


