CryoEM structures of open dimers of gyrase A in complex with DNA illuminate mechanism of strand passage
- Northwestern University, United States
- MRC National Institute for Medical Research, United Kingdom
- The Francis Crick Institute, United Kingdom
Figures
Figure 1
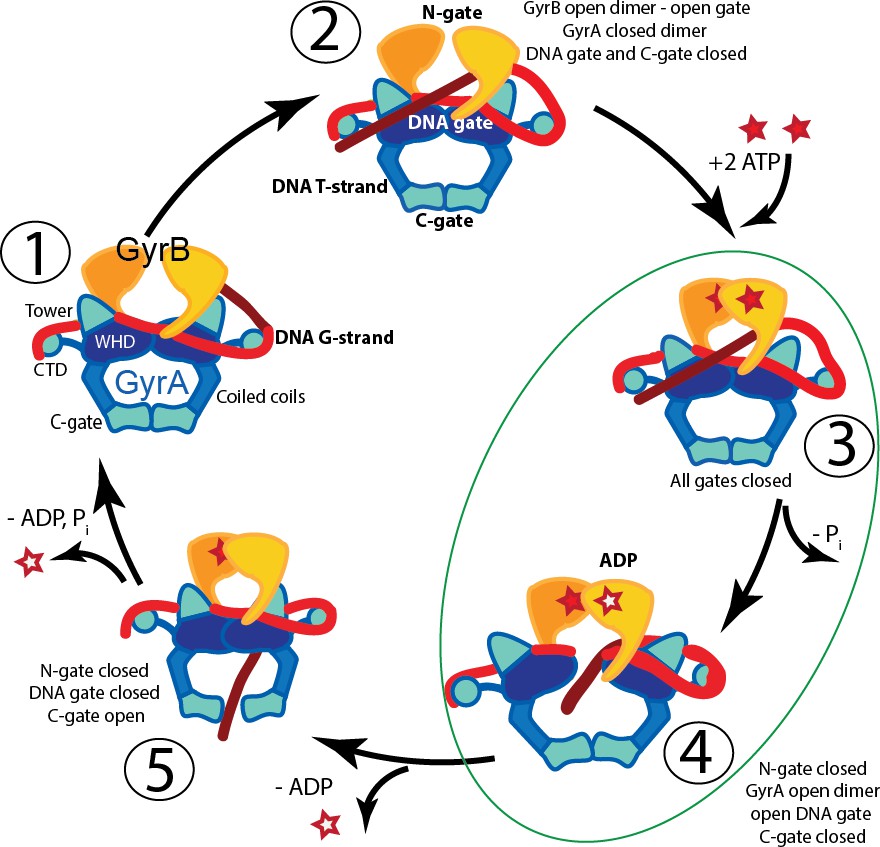
Proposed mechanism of supercoiling of DNA by gyrase.
The schematic diagram illustrates a simplified model for the proposed mechanism of negative supercoiling by gyrase. (1) Gyrase binds a DNA segment (G-segment, red) at the interface of gyrase A (GyrA, blue/cyan) and gyrase B (GyrB, orange) subunits in the region forming the DNA gate. The DNA is wrapped around the C-terminal domains (CTDs) of GyrA. The CTDs are unique to gyrase and are essential for introducing negative supercoils into DNA. (2) The CTDs guide a DNA segment (T-segment, dark red) to enter the space in between two GyrB subunits, which also form the N-gate. (3) Upon binding of 2 ATP molecules to GyrB, the N-gate closes, trapping the T-segment inside the GyrB subunits. (4) The G-segment is cleaved by the active site tyrosines located in the GyrA subunits, forming a covalent protein/DNA intermediate and leading to the opening of the DNA-gate that allows T-segment passage through this gate. One ATP is hydrolyzed at this step, leaving 1 ATP and 1 ADP molecule bound to GyrB. (5) After T-segment passage through the gate, the DNA-gate closes, ADP leaves the complex, and the third gate, the C-gate, opens to release the trapped T-segment. Finally, the second ATP is hydrolyzed, the C-gate closes, the N-gate opens, and the enzyme is ready for the next cycle. Steps 3 and 4 are highlighted as they correspond to the states where the complexes of GyrA with DNA provide novel information on T-segment binding and passage. The diagram is based on Basu et al. (2012).
Figure 2 with 8 supplements
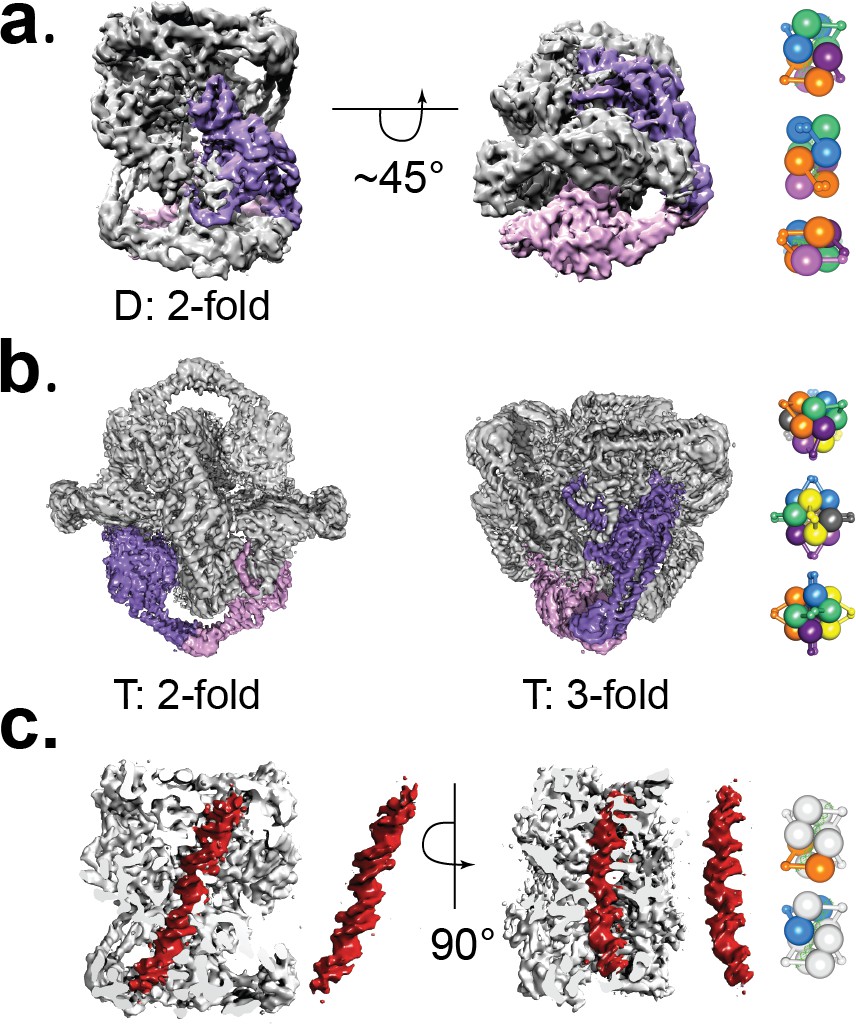
Cryo-EM volumes of the Tetrahedral and Dihedral complexes.
(a) Diagram showing the 5.2 Å resolution reconstruction of the Dihedral complex with imposed D2 symmetry. The complex is built from four open GyrA dimers. In the diagram, one of the dimers is shown in purple and pink. The dimerization interface of each dimer is formed by the C-gates, as with the Tetrahedral complex. Other interactions between the dimers are mediated by contacts between the N-terminal tails as well as between the N-terminal tails and WHD domains of different dimers and WHD-WHD and WHD-tower domain interactions. On the right, a cartoon depicting the arrangement of the four dimers is shown with views along the two-fold axes (top to bottom). (b) Diagram showing the 4 Å resolution reconstruction of the Tetrahedral complex with imposed tetrahedral symmetry. Twelve GyrA monomers form the complex, arranged as six GyrA open dimers. Two of the monomers forming one of the dimers are shown in purple and pink. The dimerization interface is formed by C-gate interactions. The other interactions between dimers are centered on the N-terminal tails of different monomers, the N-terminal tails with adjacent WHD and tower domains of different monomers as well as WHD-tower domain interactions. On the right, a cartoon depicting the arrangement of the six dimers is shown with views along the three-fold (top) and two fold axes (middle, bottom). Each dimer is shown in a different color. (c) Diagram showing a sliced Dihedral complex volume solved to 6.35 Å and with imposed C2 symmetry. The slice allows the visualization of the 44 bp DNA molecule (red) located in the Dihedral complex interior. The DNA – protein interactions result in two different conformational states of GyrA and DNA. The DNA interacts with the different dimers through positively charged residues in the tower, WHD, C-gate, and the C-gate-adjacent coiled-coil domains. Segmented density for only the DNA (red) is shown. On the right, cartoons depicting the two dimers that interact differently with DNA are shown. The top cartoon corresponds to the GyrA dimer with the DNA positioned below the DNA-gate (orange), while the bottom cartoon shows the GyrA dimer with the DNA positioned above the DNA-gate (blue).
Figure 2—figure supplement 1
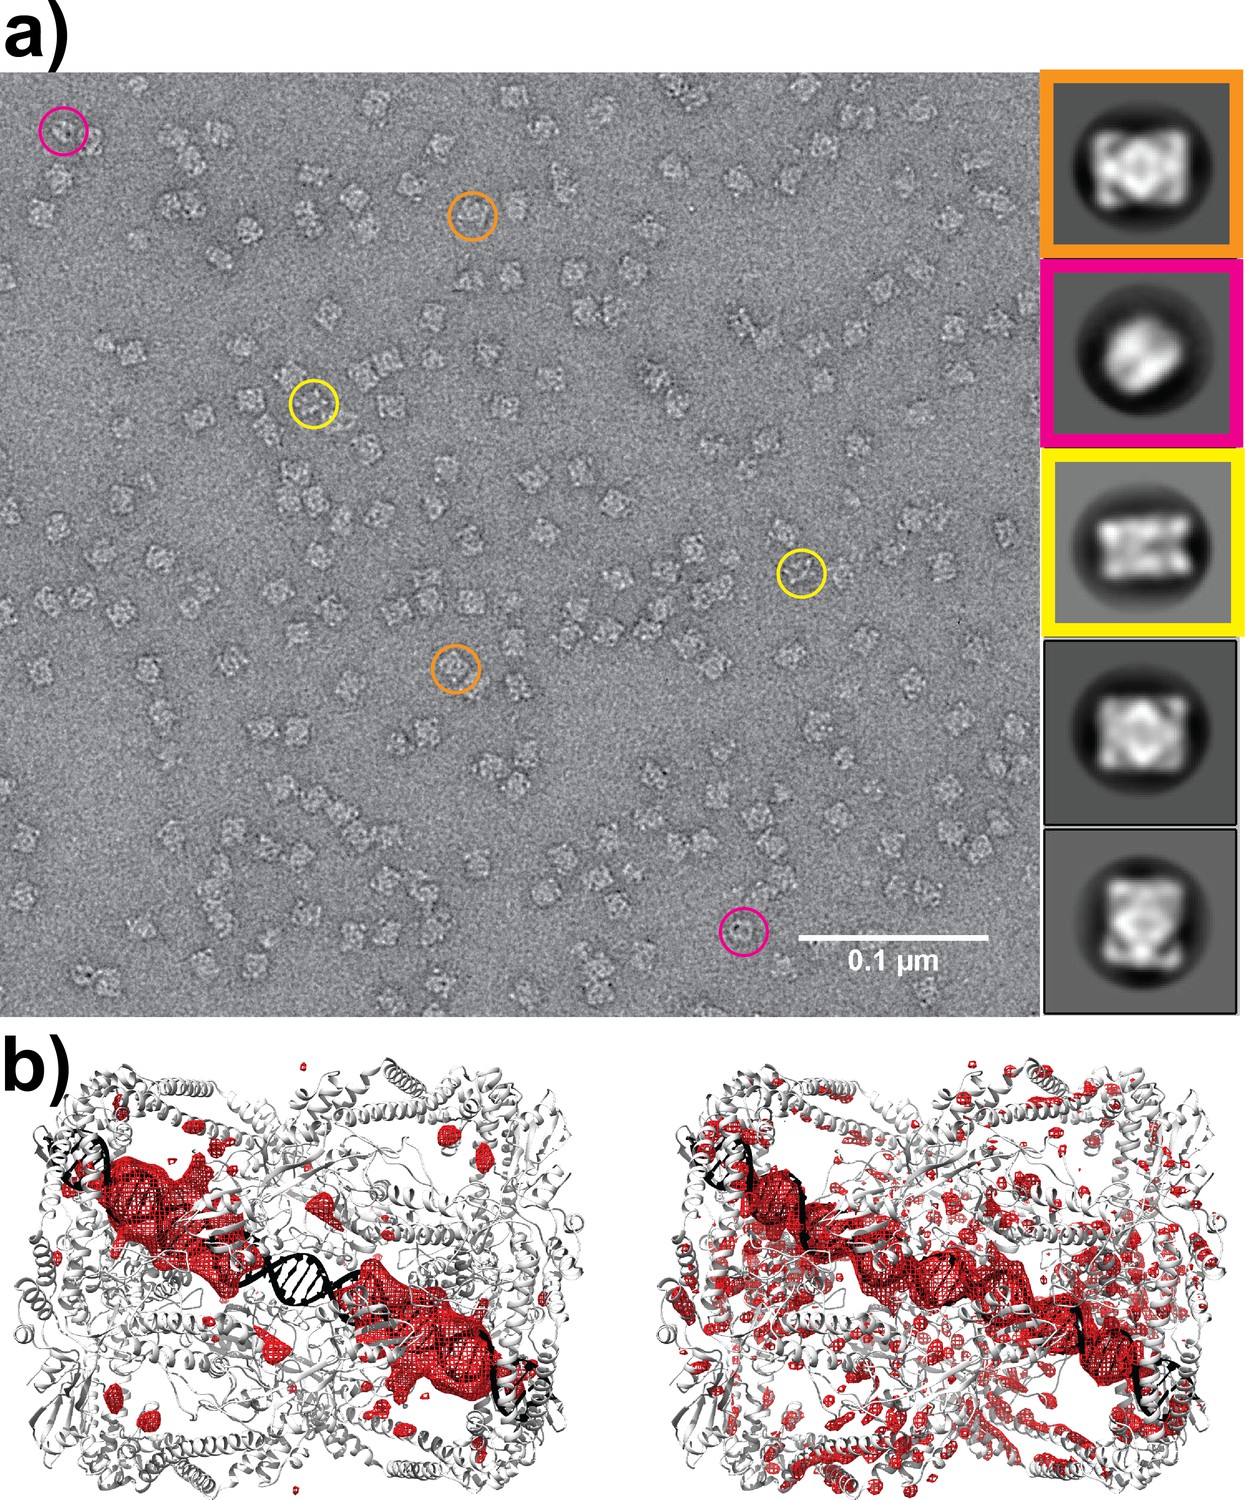
The Dihedral complexes do not require antibiotics or cross-linkers for assembly.
Dihedral complexes formed by mixing GyrA-ΔCTD and 44 bp DNA with or without ciprofloxacin were purified using the GraFix procedure (Kastner et al., 2008) with or without glutaraldehyde. The Dihedral complexes formed in all sample preparation combinations, showing that complex formation does not require the presence of antibiotics or cross-linkers. (a) Example from a sample prepared without ciprofloxacin and glutaraldehyde. The negative stain micrograph on the left shows typical particles while the diagrams on the right correspond to typical 2D class averages obtained from the same sample. Each of the major 2D classes is framed with a different color and typical particles corresponding to that class average are encircled in the same color. (b) Left. A low resolution cryoEM difference map of the glutaraldehyde-free Dihedral complex shows that the DNA forms part of the complex and follows the same path, emphasizing that crosslinking is not required for sample assembly or DNA incorporation. The difference map was obtained by subtracting the D2 from the C2 reconstruction calculated from the same data. The discontinuity in the DNA is probably due to the low resolution of the structure and the limited number of particles used, which did not allow for fine sub-classification of the particles as done for the much larger data set. Right. Difference map obtained by subtracting the D2 from the C2 reconstruction using the high resolution data set. The difference map is shown for comparison with the glutaraldehyde-free one. In both cases, a diagram of the final model of the Dihedral complex is shown. For details on the sample preparation, imaging conditions, and reconstruction procedures see the Materials and methods section.
Figure 2—figure supplement 2
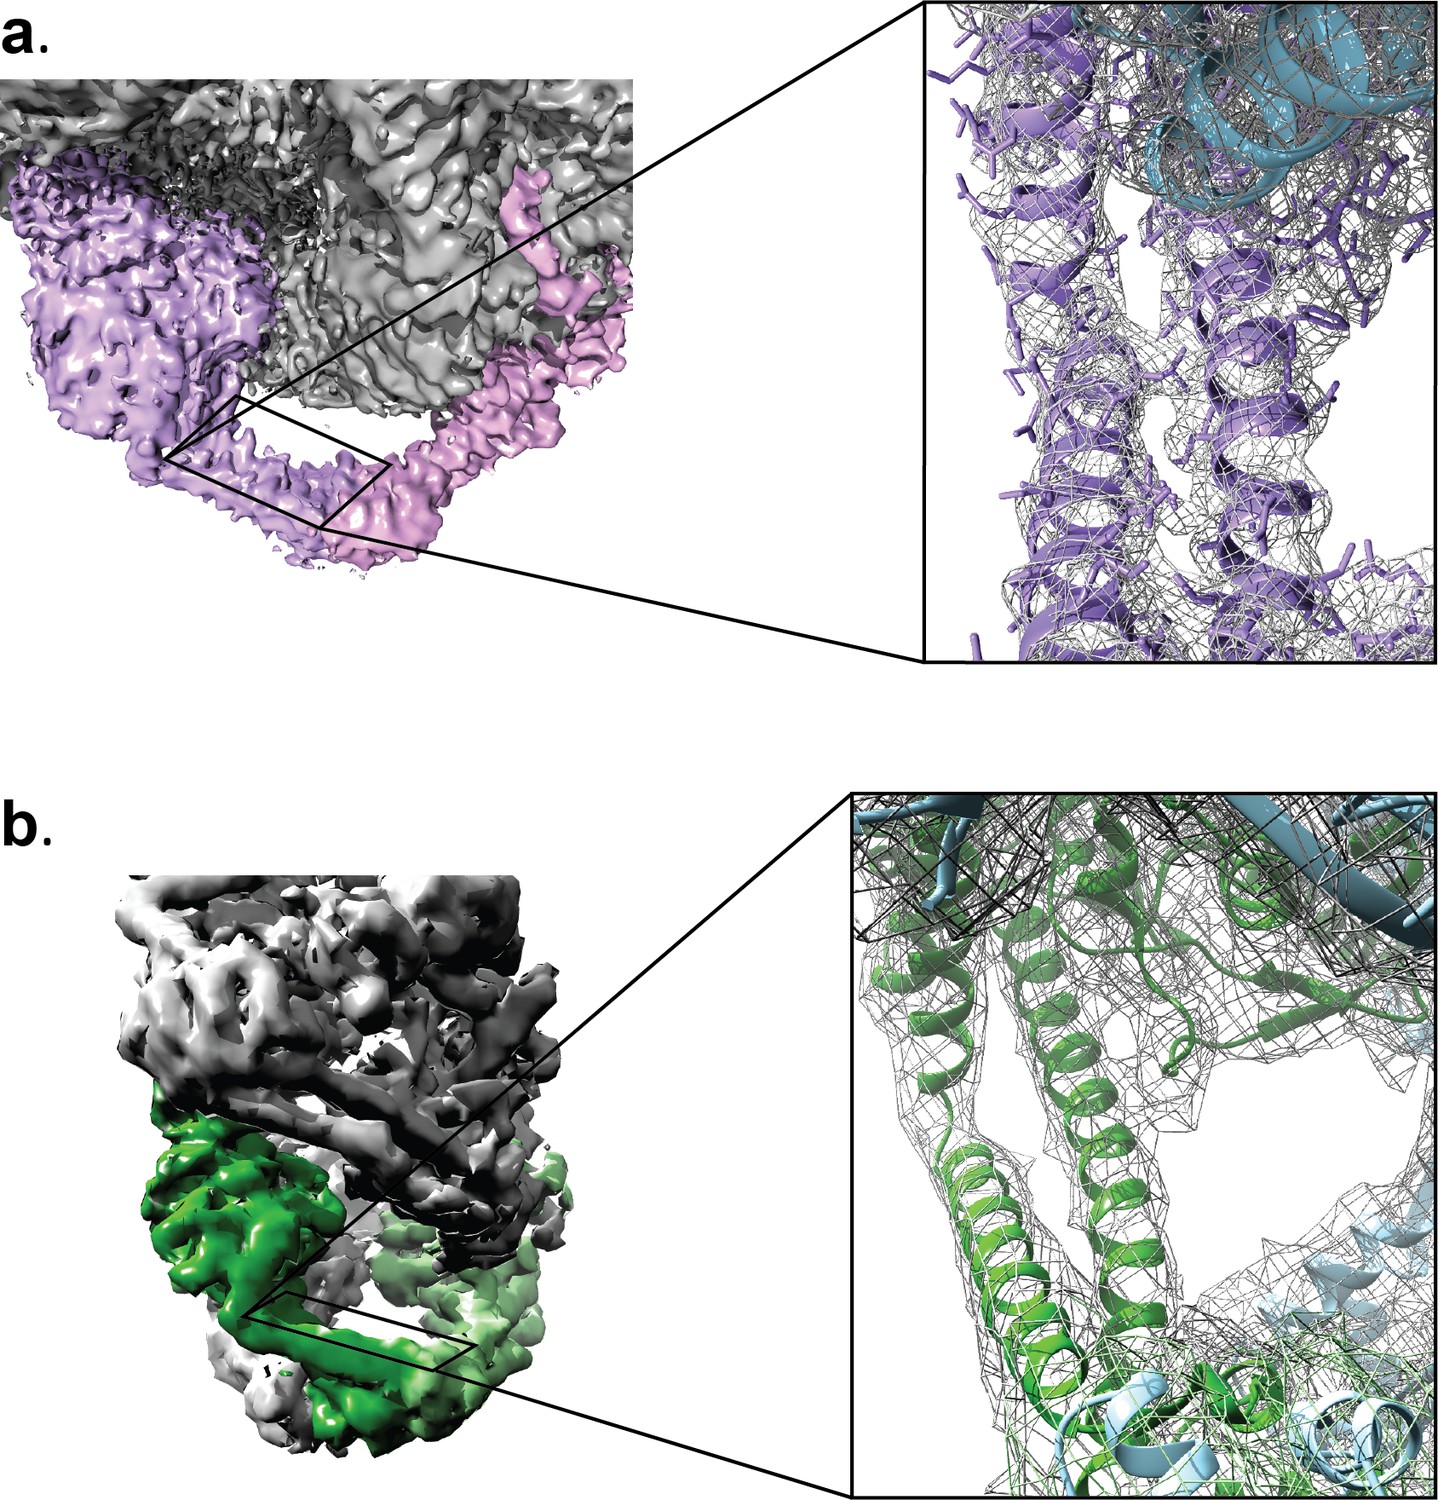
Reconstructed volumes for the Tetrahedral and Dihedral complexes.
The diagrams show a similar region in one of the GyrA monomers in the (a) Tetrahedral (4 Å) and the (b) D2 symmetric Dihedral complexes (5.16 Å). The insets show a close up view of the equivalent coiled coil domain region to illustrate the quality of the maps in both reconstructions. Both reconstructions show clearly defined secondary structure regions. In the Tetrahedral complex some side chains are visible.
Figure 2—figure supplement 3
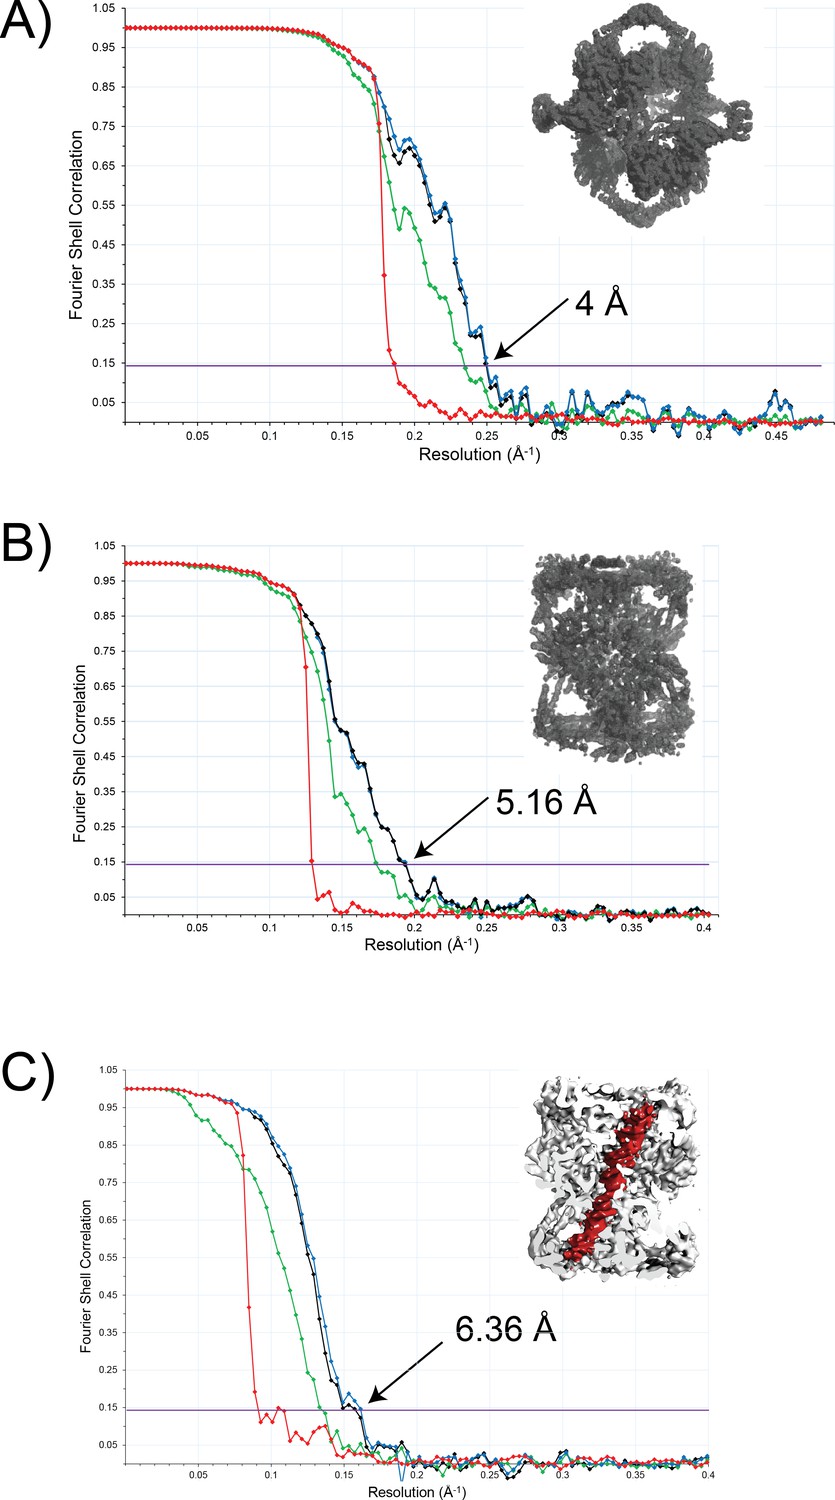
FSC curves for the final structures.
(a) Tetrahedral complex with imposed tetrahedral symmetry and using data from tilted and untilted images. (b) Dihedral complex calculated with imposed D2 symmetry. (c) Dihedral complex with imposed C2 symmetry. The figure in the inset serves to identify the complex for each case. The values shown correspond to the resolution at an FSC value of 0.143 (Rosenthal and Henderson, 2003). In each plot, the four curves correspond to the corrected FSC (black), the FSC for the unmasked map (green), the FSC for the masked map (blue), and the FSC for the phase randomized masked map (red). The corrected FSC curve was used to estimate the final resolution of the structure.
Figure 2—figure supplement 4
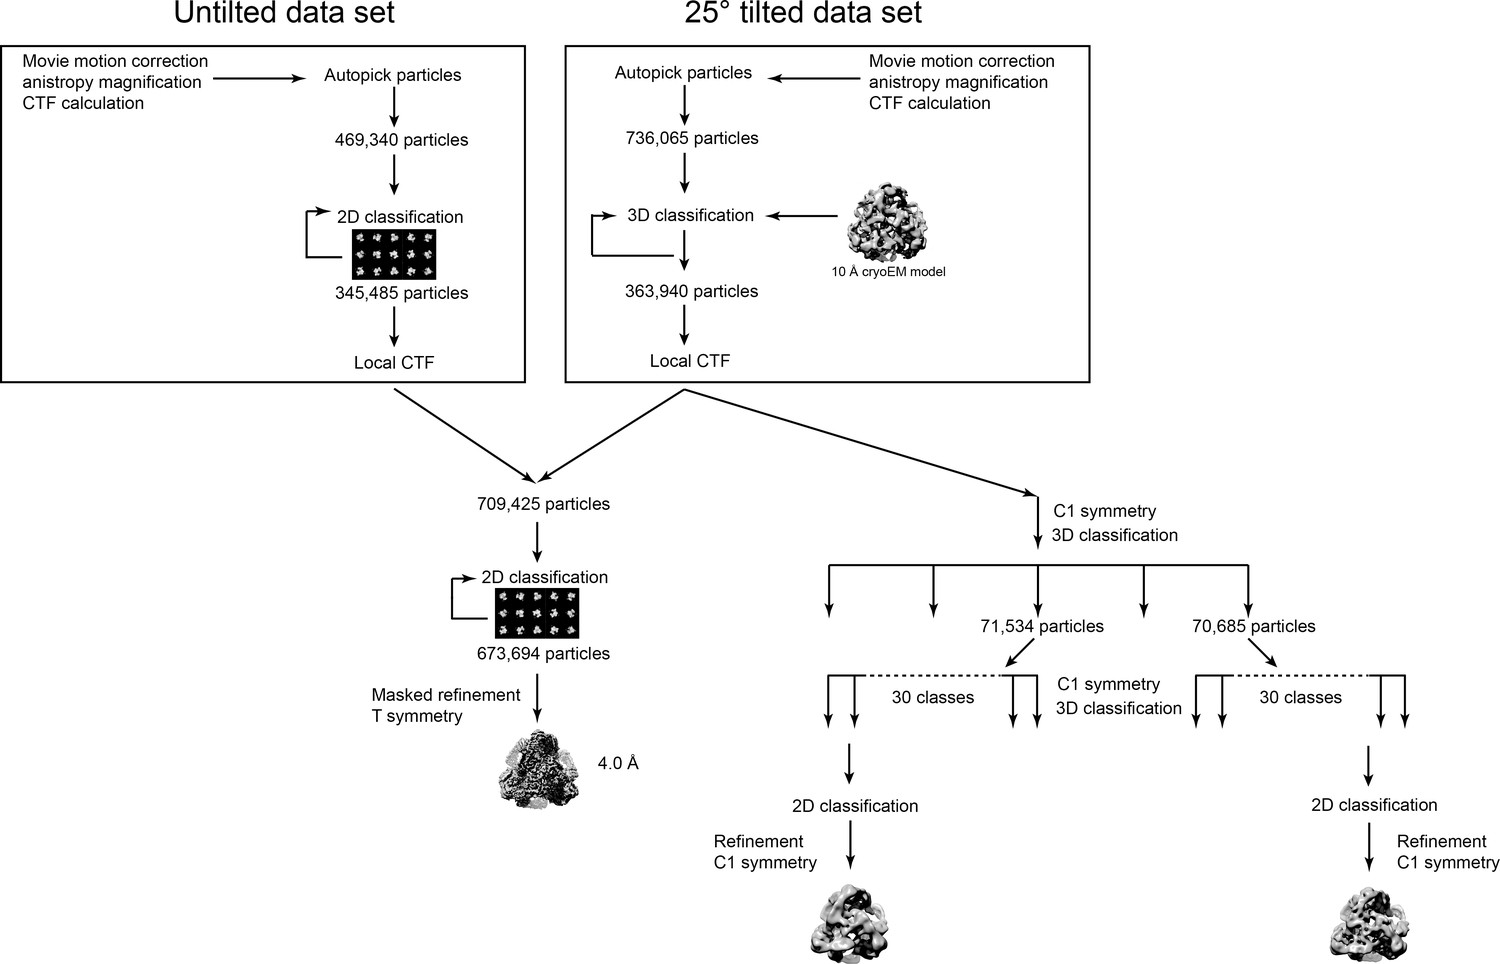
Workflow diagram for the Tetrahedral GyrA reconstruction.
The diagram summarizes the steps to reconstruct the Tetrahedral GyrA assembly as described in the Materials and methods section. All data processing was done using Relion (Scheres, 2012a; Scheres, 2012b; Scheres, 2016).
Figure 2—figure supplement 5
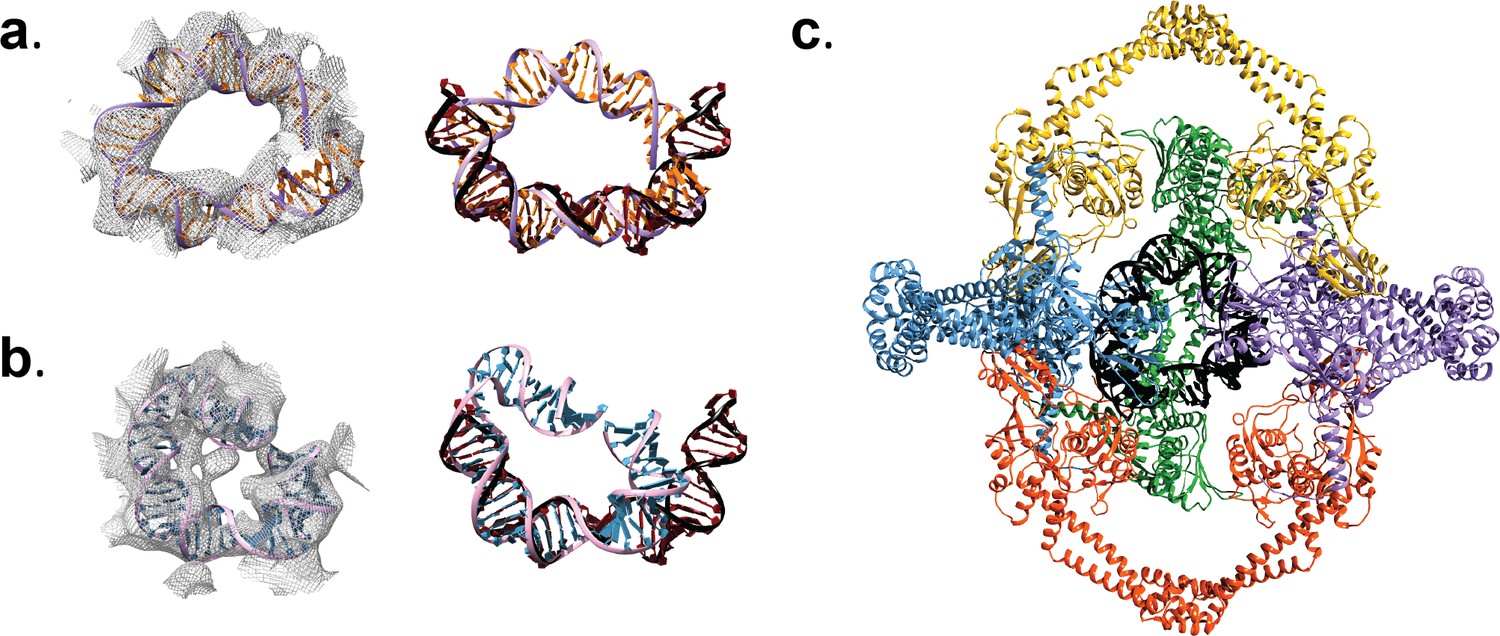
DNA in the Tetrahedral complex.
Panels (a) and (b) show density for the interior of the Tetrahedral assembly in two different volumes obtained from different sub-classes, together with the models built into the density. In the left column, each density region has a DNA model fitted into it, whereas the right column shows each of the fitted DNA models manually superposed on a bent DNA from a crystal structure of Topo IV ParC-DNA complex (black/dark red) (PDB ID 3FOF) (Laponogov et al., 2009). Alignment of the different DNA models illustrates that the DNA molecules inside the Tetrahedral complex show a degree of bending similar to that observed in other type IIA topoisomerase complexes. (c) Ribbon diagram of the Tetrahedral complex model (color) with the DNA (black) from the model in panel a). The front GyrA dimer from the complex was removed to show the DNA more clearly.
Figure 2—figure supplement 6
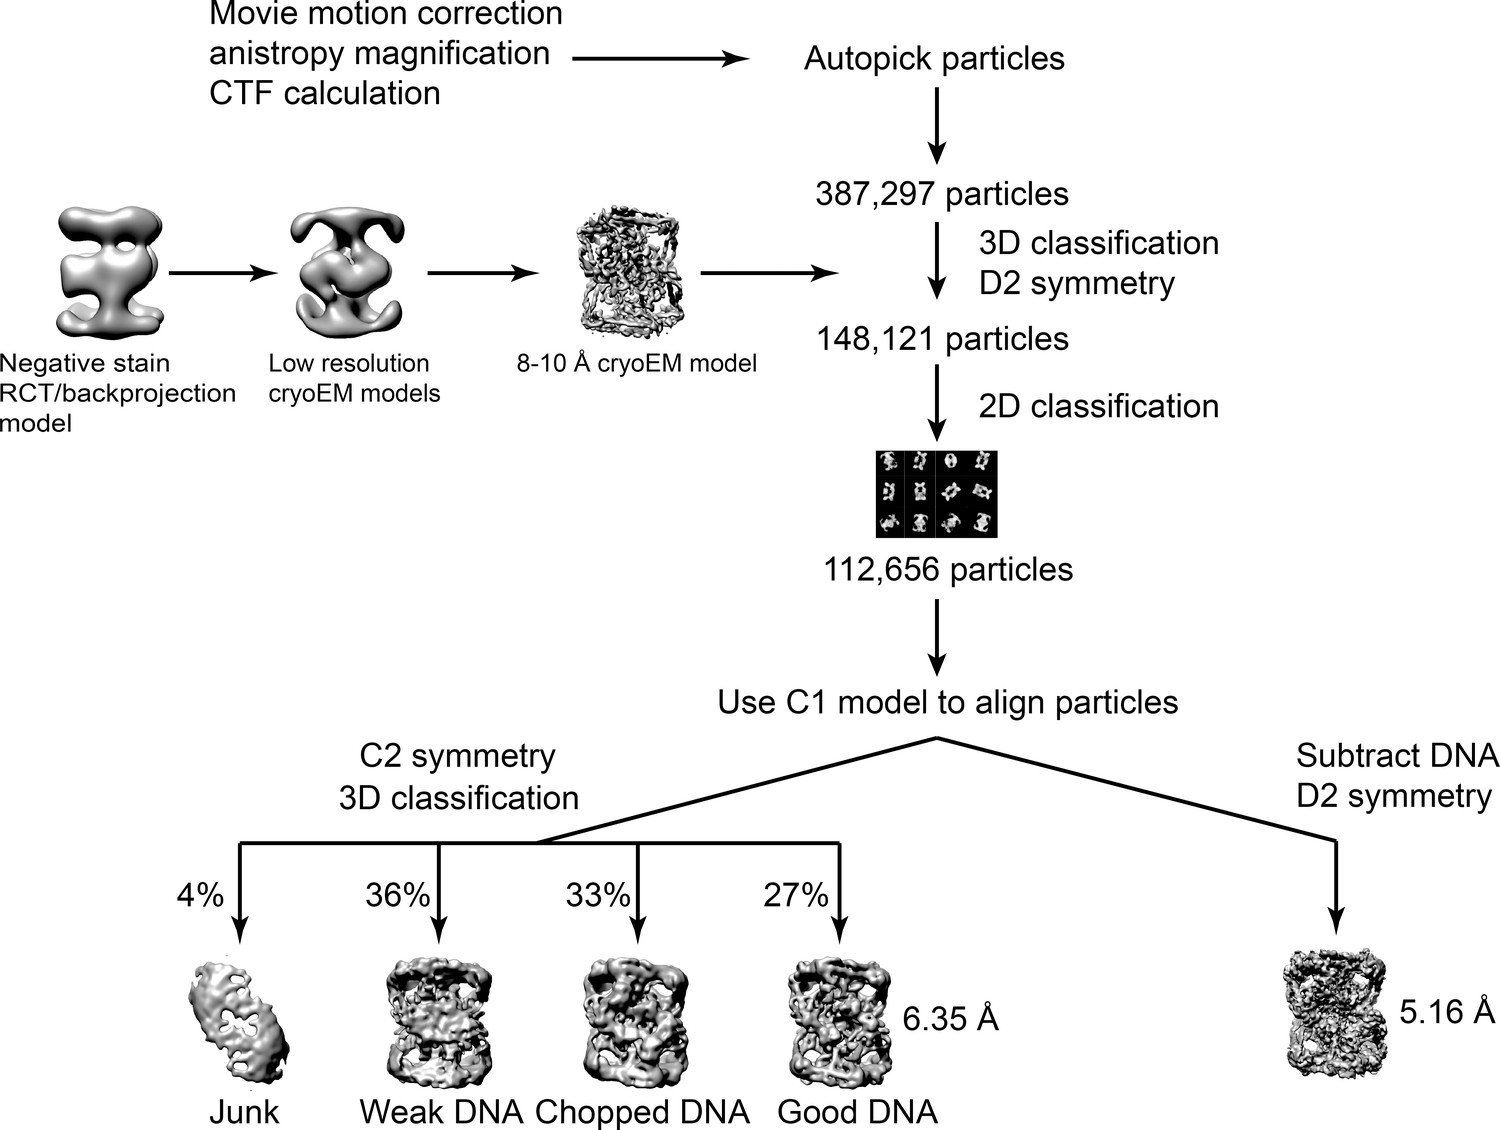
Workflow diagram for the Dihedral GyrA reconstruction.
The diagram summarizes the steps to reconstruct the Dihedral GyrA assembly as described in the Materials and methods section. All data processing was done using Relion (Scheres, 2012a; Scheres, 2012b; Scheres, 2016).
Figure 2—figure supplement 7
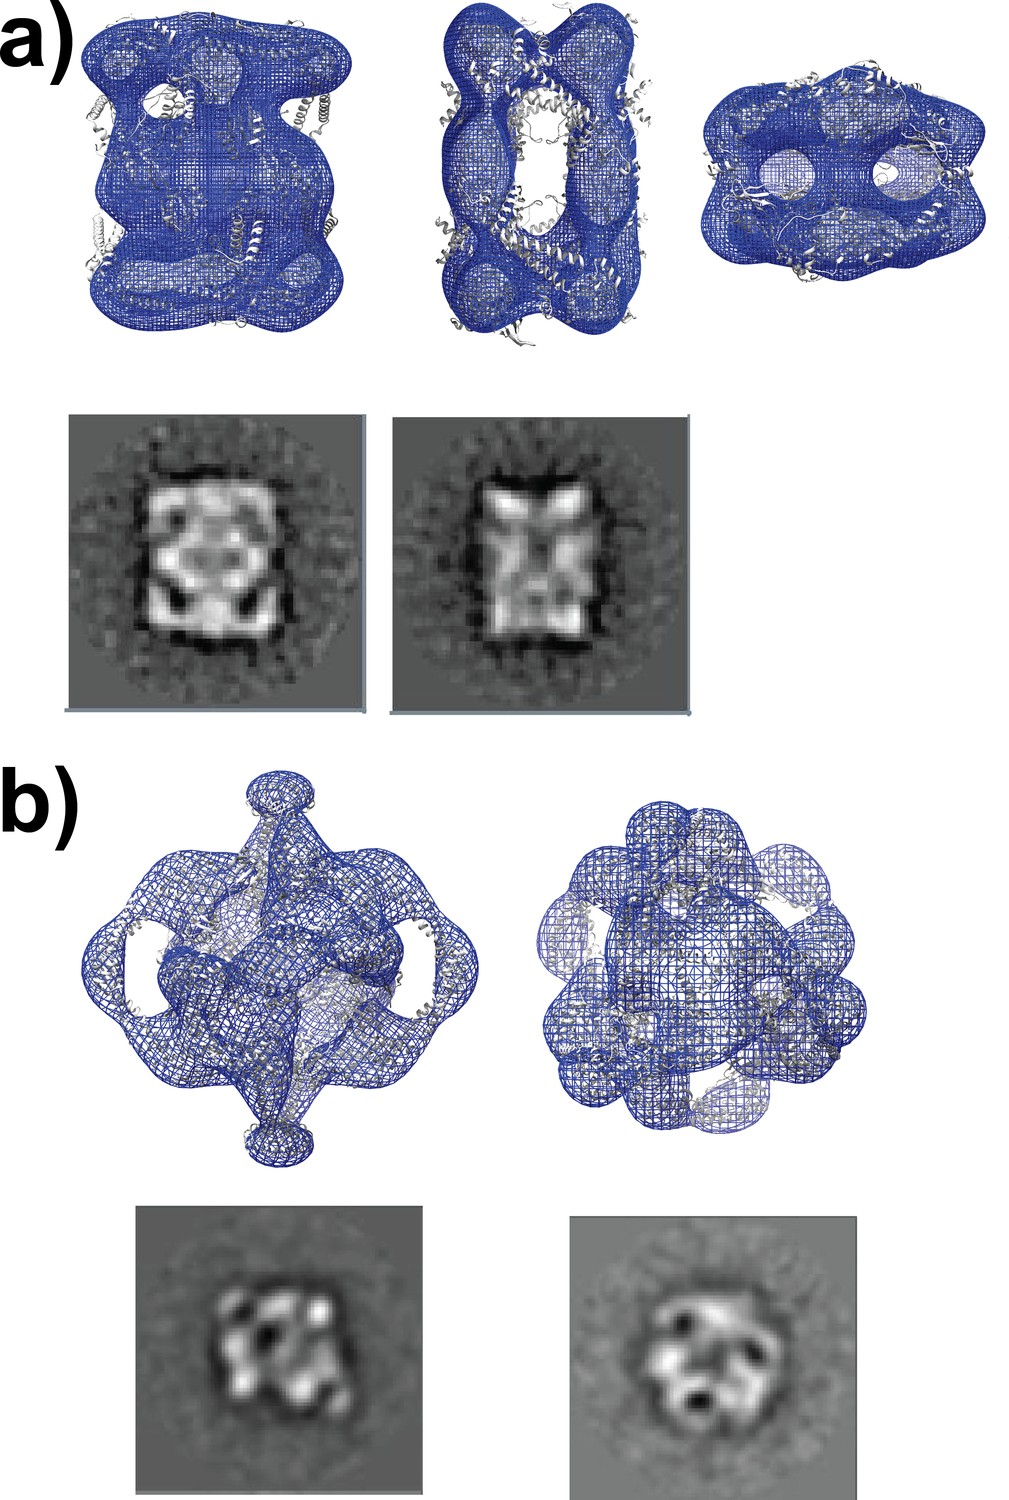
Negative stain reconstructions of the Dihedral and Tetrahedral complexes.
Reconstructed negative stain volumes for the (a) Dihedral complex and (b) Tetrahedral complex. The panels show different views of the negative stain reconstructions used as a starting point for the cryoEM studies. A diagram of the final model of each complex is shown on the maps as a guide. Two representative 2D class averages for each complex are shown below the maps. For the Dihedral complex, the three views are orthogonal to each other. For the tetrahedral complex, the views are down the 3-fold and 2-fold axis.
Figure 2—figure supplement 8
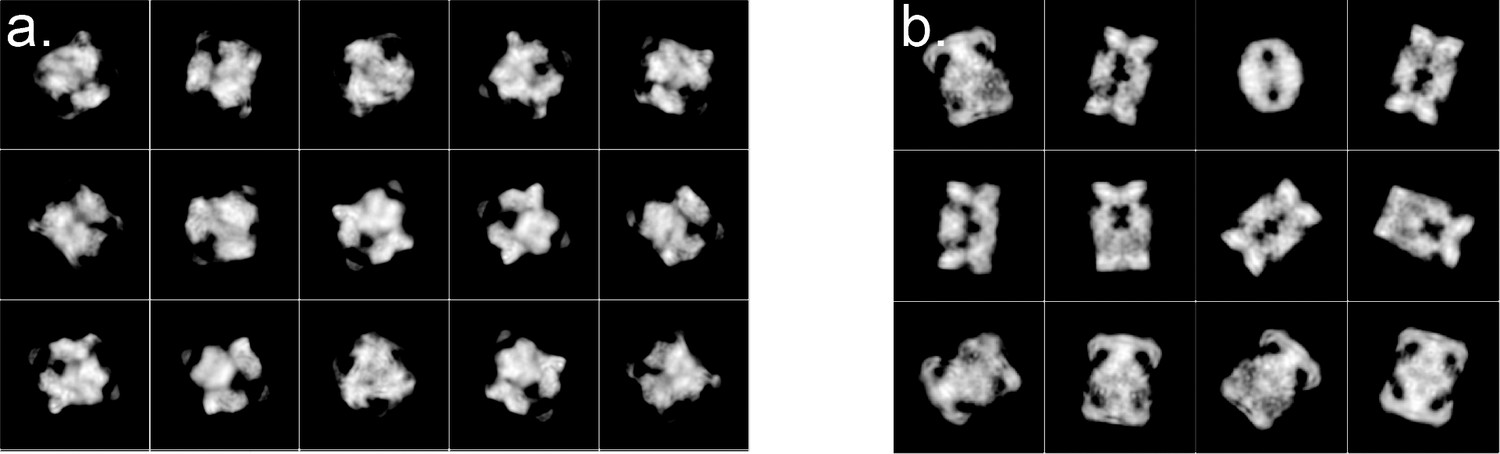
Representative 2D classes for the Tetrahedral and Dihedral Complexes.
The two montages show representative 2D classes from the (a) Tetrahedral and (b) Dihedral final Cryo-EM data sets used to calculate the reconstructions. The 2D classes were obtained with Relion 2.1 (Scheres, 2012a; Scheres, 2012b; Scheres, 2016).
Figure 3 with 1 supplement

Conformational flexibility of GyrA.
(a) Ribbon diagram of the GyrA dimer with the different domains highlighted in different colors in one of the monomers, the other monomer in solid purple. The bar underneath shows the location of the different domains in the primary sequence colored identically to the figure. (b). Ribbon diagram showing the superposition of one of the monomers of the Tetrahedral dimer (color) on a monomer of a closed dimer (PDB ID 4Z2C) (grey) from the same organism. The angle shown represents the magnitude of the rotation needed to rotate the non-superposed monomer to create the open conformation. (c). Ribbon diagram showing the superposition of one of the monomers of the Dihedral dimer (color) on a monomer of a closed dimer (PDB ID 4Z2C) (grey) from the same organism. As before, the angle corresponds to the rotation needed to open the closed conformation. (d). Ribbon diagram showing the superposition of a monomer of the Dihedral dimer (color) on a monomer of the Tetrahedral dimer (grey). The two open GyrA dimers are very similar. The angle shows the rotation needed to superpose the other pair of monomers. Note that the difference between the Tetrahedral and Dihedral dimers is not simply a rotation around the C-gate, but it involves a rotation centered roughly on the C-gate and also twisting of the WHD and tower domains.
Figure 3—figure supplement 1
Conformational plasticity of the GyrA dimers.
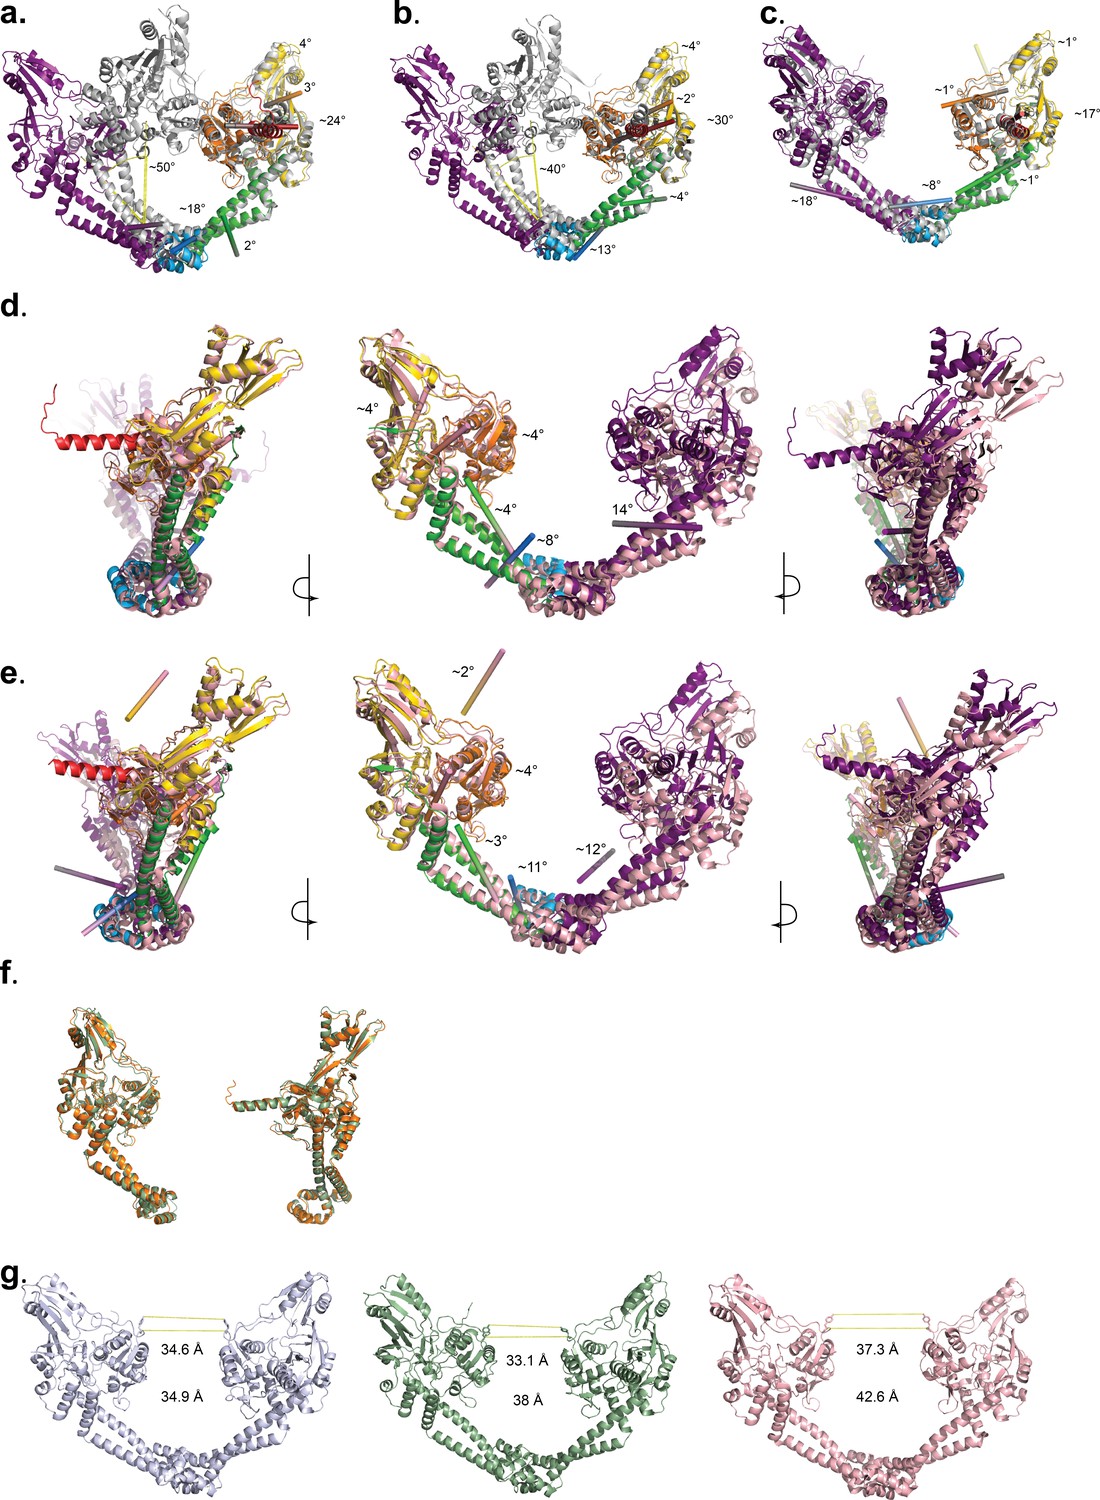
(a) and (b) Diagrams showing the superposition of the Tetrahedral (a) and Dihedral (b) complex dimers on a closed conformation of the S. pneumoniae GyrA dimer (PDB ID 4Z2C). To illustrate the internal conformational changes in the open and closed forms, one monomer in the open conformation was superposed on a monomer in the close conformation as described in Materials and methods. The diagrams show that the monomers do not superpose as rigid bodies, but that movements of every domain accompany the opening of the GyrA dimer. The angle denoted by yellow lines correspond to the rotation angle to open the GyrA dimer. (c) Schematic diagram showing the superposition of the Dihedral complex dimer (colored domains) on the Tetrahedral complex dimer (blue-grey color). As in (a) and (b), one Dihedral monomer was superposed on the corresponding Tetrahedral monomer. The superposition shows that the monomers in the two open structures also show movements of the individual domains. (d) and (e) Diagrams showing the superposition of a monomer in the Tetrahedral dimer (d) and the Dihedral dimer (e) on a monomer of the most widely open dimer of a B. subtilis GyrA crystal structure (PDB ID 4DDQ) (Rudolph and Klostermeier, 2013). In all diagrams (a–e), the colored cylinders indicate the axis around which each domain rotation occurs with the needed rotation angle. f) Diagram showing the superposition of a monomer of the Dihedral dimer complex (Chain B) (orange) on its dimerization partner (Chain A) (green). Although the two monomers are independent and not related by the point symmetry of the assembly, their structures are similar. (g) Schematic diagram showing the extent of the DNA-gate opening. The distance between hydroxyl groups of the catalytic tyrosines (top number) and between their α carbons (bottom number) are shown. The structures correspond, from left to right, to the Tetrahedral dimer, the Dihedral dimer, and the B. subtilis GyrA crystal structure (PDB ID 4DDQ) (Rudolph and Klostermeier, 2013).
Figure 4 with 1 supplement
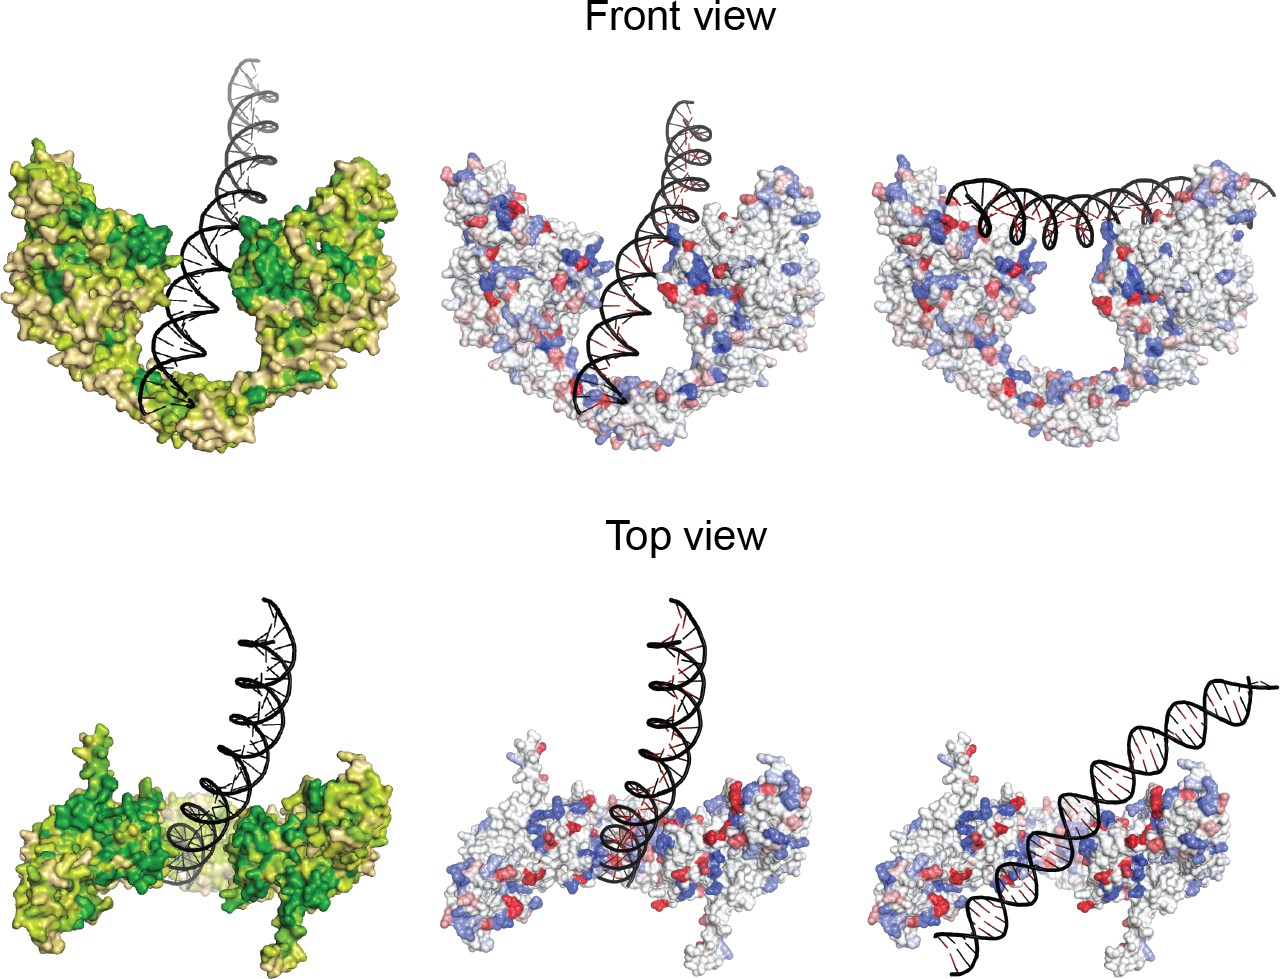
Two distinct open GyrA/DNA complexes observed in the Dihedral assembly.
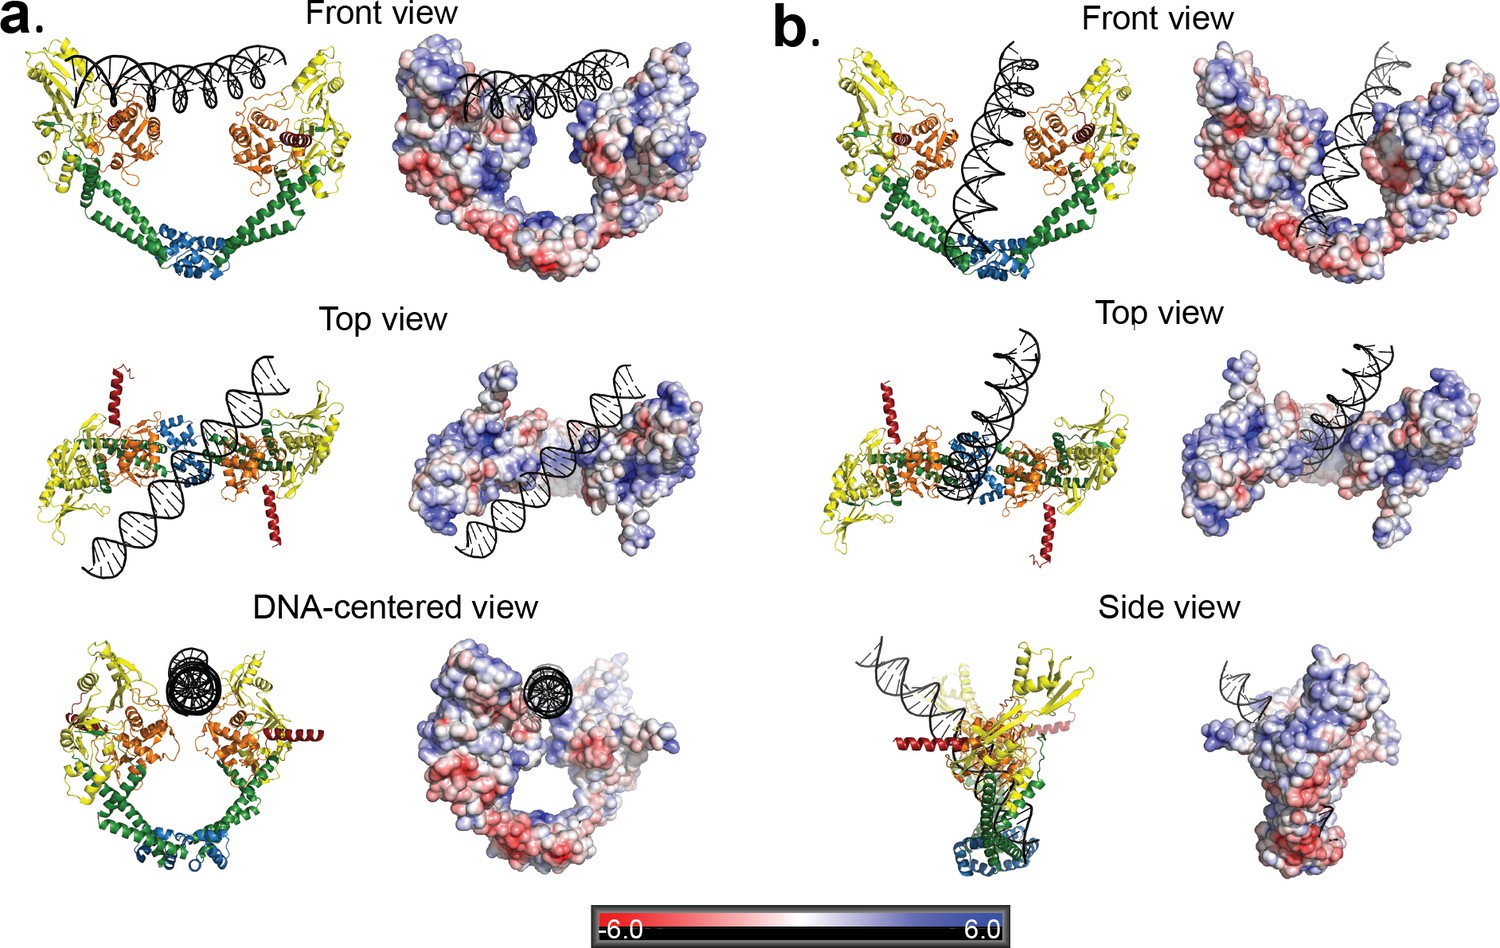
The Dihedral complex is built by four GyrA open dimers that show the same protein conformation but that interact with the single DNA molecule in two distinct ways. (a) Ribbon diagrams showing the position of the putative T-segment DNA right above the DNA-gate (State B). The position corresponds to the state prior to T-segment passage. Each of the three different views shows a ribbon representation of the complex as well as the electrostatic surface of the protein with a stick diagram of the DNA. The top view illustrates that the DNA runs diagonally above the gate and lies against the positively charged residues in the tower and WHD domains of both monomers. (b) Ribbon diagrams showing the position of the putative T-segment DNA after passage through the DNA-gate (State A) in three different views. The front and top views illustrate the DNA interactions with the positively charged residues in the WHD, C-gate, and the adjacent coiled coil domains. The DNA is found inside the protein dimer and it interacts directly with residues in the WHD and also the coiled coil near the C-gate. The electrostatic surface was calculated with APBS (Baker et al., 2001) and is rendered with a range of ±6 kT/e. The bar at the bottom corresponds to the color gradient of the electrostatic potential.
Figure 4—figure supplement 1
Sequence and charge conservation in the GyrA dimer.
Left column. Surface representation of the GyrA dimer in the Tetrahedral complex with the DNA in the central cavity colored by sequence conservation (variable: tan, neutral: light green, conserved: green). One hundred and fifty GyrA protein sequences were included in the analysis of the sequence conservation using the ConSurf server (Ashkenazy et al., 2010; Landau et al., 2005). Regions participating in DNA binding are highly conserved in the WHD, tower and C-gate-adjacent coiled coil domains. Note the conserved region in the C-gate that interacts with the DNA. Middle and right columns. The diagrams show the charge conservation for the two different complexes with DNA in the Dihedral assembly. Arginines, lysines, and histidines are colored in shades of blue from white to dark blue according to conservation whereas aspartates and glutamates are colored from white to dark red (dark conserved, light variable). Sequence conservation data were obtained from the ConSurf server (Ashkenazy et al., 2010; Landau et al., 2005). Charged residues interacting with DNA in the WHD, tower, and C-gate-adjacent coiled coil domain are highly conserved, indicating that the observed protein-DNA interactions are likely to be present in all gyrases from different organisms.
Figure 5 with 2 supplements

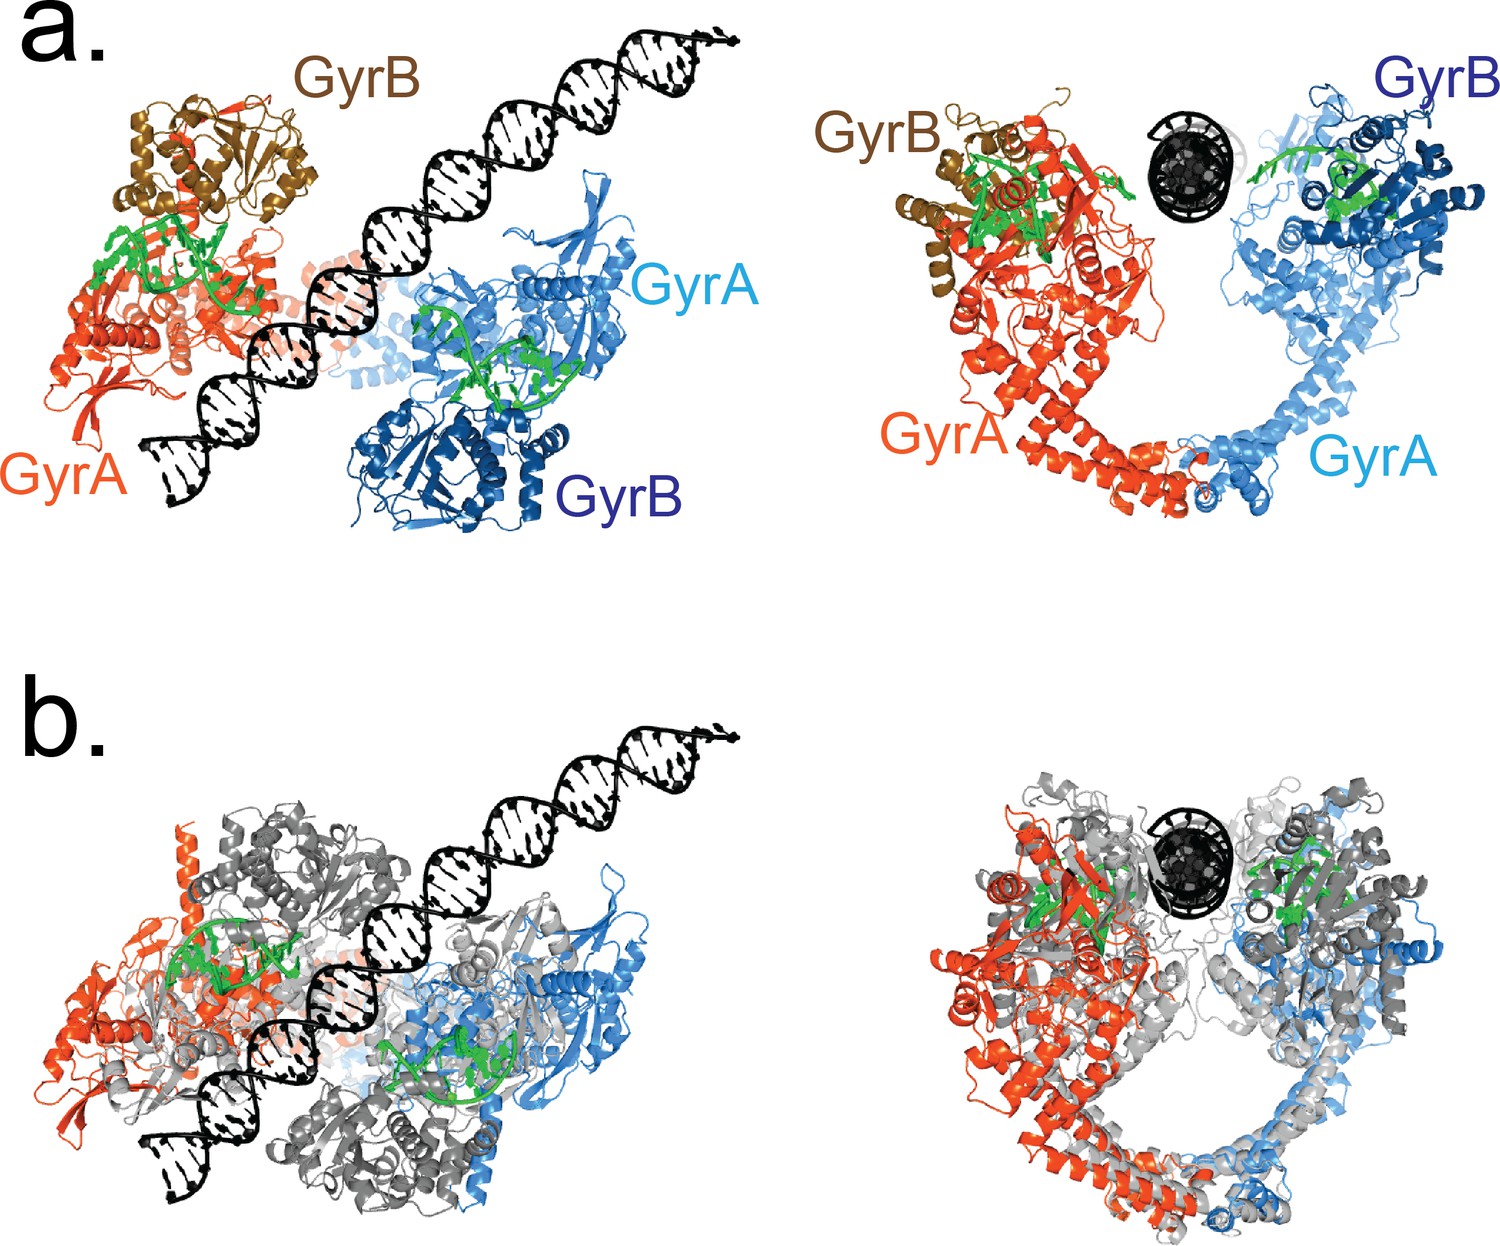
Angle between the G- and T-segments in the Dihedral complexes.
Models of the GyrA complex with both the G-segment and the T-segment present were built to measure the angle between the G- and T-segments in the models. The split G-segment DNA was built based on the structure of the S. pneumoniae GyrA/DNA complex in the closed conformation (PDB ID 4Z2C.) (a) Ribbon diagram of the dimer with the DNA aligned above the DNA-gate corresponding to a putative complex formed by the G- and T-segments prior to gate passage. It has been computationally predicted (Neuman et al., 2009; Stone et al., 2003) that in a positive supercoil the DNA strands should cross at a ~ 60° angle. In the case of the putative GyrA dimer/G-segment/T-segment complex the angle is about 64°, which is close to the predicted positive supercoil angle. (b) Ribbon diagram of a GyrA dimer with the DNA passing through the DNA-gate. In this model, the angle between the G- and T-segments is about ~82° and is close to the ~85° angle shown to be the preferred angle for Topo IV - DNA in the relaxation reaction (Neuman et al., 2009; Stone et al., 2003). The angles between G- and T- segments were measured between the helical axes calculated by DSSR in X3DNA package (Lu and Olson, 2003; Lu and Olson, 2008).
Figure 5—figure supplement 1
The Tetrahedral dimer conformation cannot accommodate DNA binding above the G-gate in the same manner as the Dihedral dimer conformation.
(a) The diagram shows the electrostatic surface of the protein and a stick diagram of the DNA in the Dihedral complex with the DNA above the gate. Note the interactions of both monomers with the DNA through the WHD and tower domains. (b) DNA modeled into the GyrA open dimer in the Tetrahedral complex. The DNA was modeled by superposing one of the monomers in the two complexes (left monomer) and then adding the DNA in the same position as in the Dihedral complex. Comparison of the two models shows that the WHD and tower domains in the Dihedral dimer turn towards the DNA to make extensive contacts involving both subunits, whereas in the Tetrahedral dimer the DNA would not interact as extensively with both subunits. In the Tetrahedral dimer, the positive charge region is located mainly inside the DNA-gate, which may promote the DNA to move to a perpendicular orientation relative to the GyrA dimer. The diagram illustrates how subtle changes in the subunit arrangements in the dimer could translate into large rearrangements of the DNA. For clarity the WHD and tower domains are labeled.
Figure 5—figure supplement 2
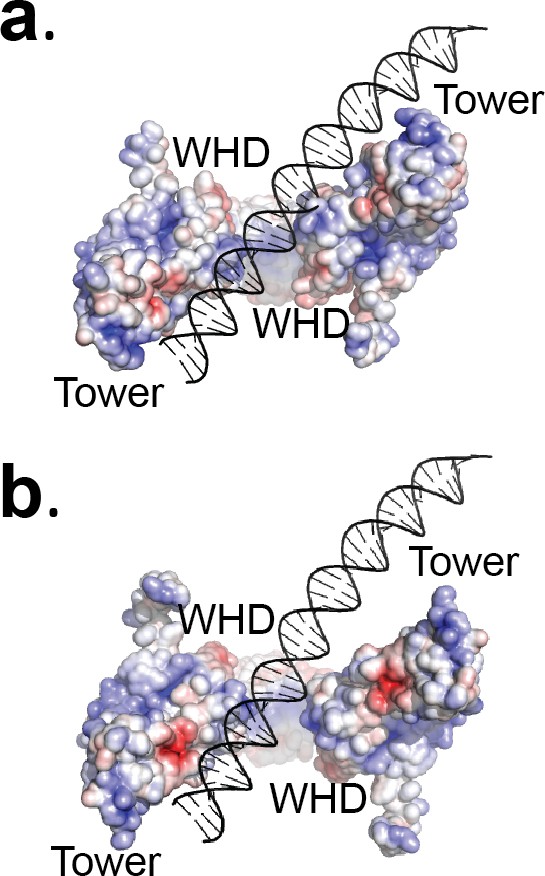
The T-segment position in State B in the Dihedral dimer conformation corresponds to the position predicted by several models and is compatible with many available structures.
(a) Ribbon diagrams of an open GyrA-ΔCTD dimer (orange and blue) from the Dihedral complex with the C–terminal part of GyrB (brown and navy blue), G-segment DNA (green), and T-segment DNA (black) in the conformation before T-segment strand passage (State B). The GyrA/GyrB subunits and G-segment DNA from the crystal structure of the closed conformation (PDB ID 4Z2C) were superposed on the corresponding GyrA chains from the Dihedral complex dimer. The superposition illustrates that the presence of the C-terminus of GyrB does not occlude the path of T-segment DNA in the Dihedral complex dimers. (b) Superposition of the Dihedral complex dimer structure in State B (orange and blue) with T-segment DNA (black) on the crystal structure of a fragment of human topoisomerase II (grey) in complex with G-segment DNA (green) (Chen et al., 2018). The human topoisomerase II structure shows a narrowly open conformation. The ribbon diagrams show that when both structures are superposed, the T-segment DNA from the cryoEM structure is positioned in the groove between the A and B subunits in the human topoisomerase II structure, as predicted (Chen et al., 2018). The superposition highlights that the T-segment DNA in the cryoEM structures corresponds to a position predicted by many models and compatible with available structures.
Figure 6 with 1 supplement
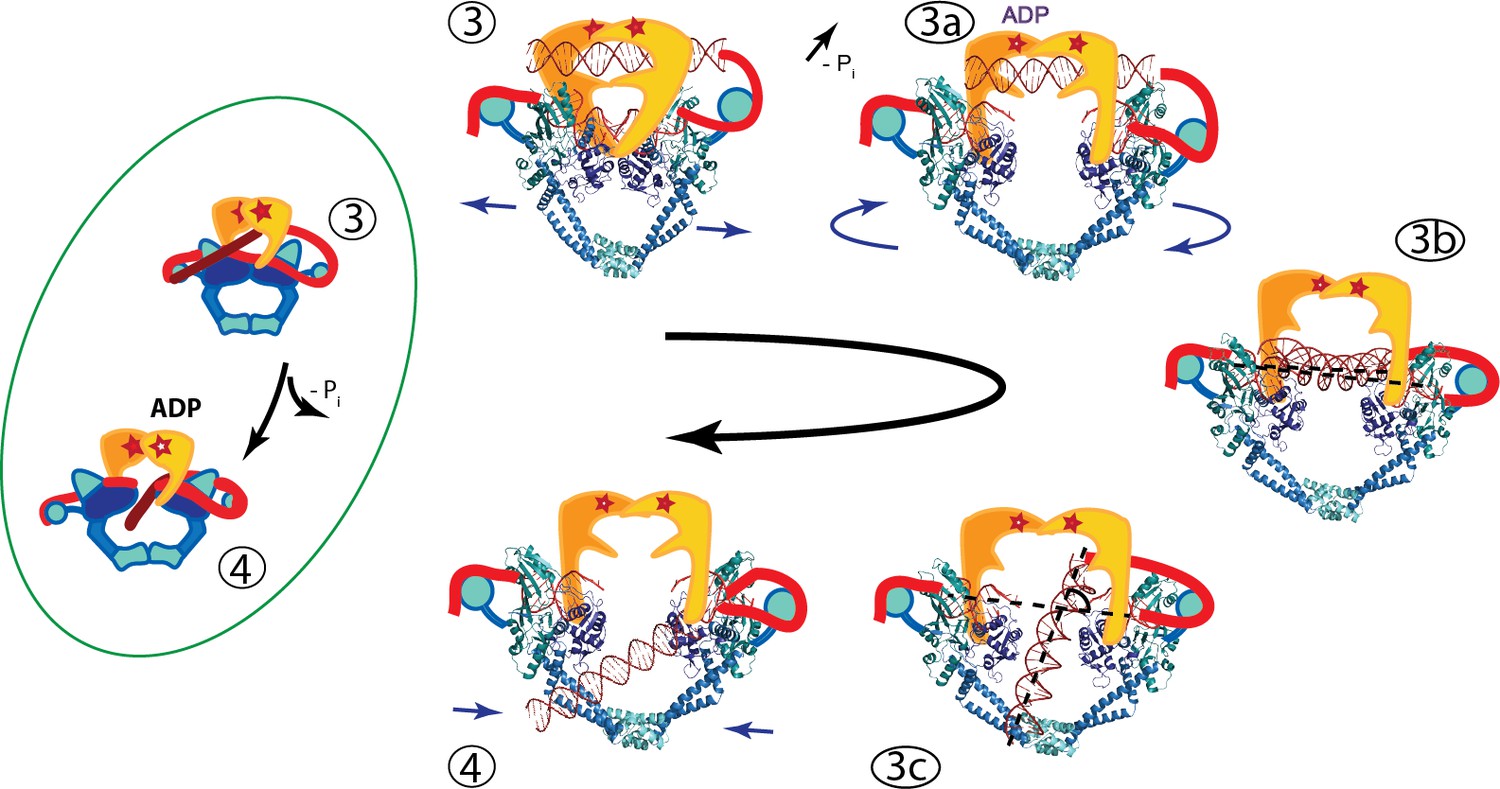
An updated mechanism of negative supercoiling by DNA gyrase.
The structures of GyrA in complex with a putative T-segment leads us to propose additions to the model for gyrase supercoiling (Figure 1). The additions are in the steps after capture of the T-segment by GyrB leading to the passage of the T-segment through the G-gate (Panels 3 and 4 from Figure 1, for reference shown on the left of the figure encircled in green). Furthermore, the structures show the angle between the G- and T-segments, which are in excellent agreement with previous predictions. (3) T-segment DNA is captured by the closing of the N-gate in GyrB. 3a) The DNA-gate opens and GyrA adopts a conformation similar to the one in the Tetrahedral dimer; the subunits adjust their relative orientation to facilitate the capture and guidance of the T-segment through the DNA-gate. GyrB and GyrA rotate in a synergistic manner. (3b) GyrA and the T-segment with DNA above the DNA-gate. Both GyrA and GyrB are opened, the DNA-gate is separated, and the T-segment is poised for passing through the gate. (3c) GyrA and the T-segment with DNA below the DNA-gate. The T-segment has passed through the DNA-gate. After T-segment passage GyrA starts to rotate back with GyrB rotating in a concerted manner. In panels 3b and 3c the helical axes of the G- and T-segments are shown with dotted lines. (4) Subsequently the GyrA subunits can move back to the closed DNA-gate conformation and GyrB moves with them. Opening of the DNA-gate as described is illustrated in Figure 6—Video 1, which shows a morph from the closed conformation (PDB ID 4Z2C) to the Tetrahedral complex dimer to the Dihedral complex dimer.
Figure 6—video 1
The movie shows a morph from the GyrA dimer in the closed conformation (PDB ID 4Z2C) to the Dihedral complex dimer to the Tetrahedral complex dimer and back to the closed conformation.
The first part of the movie shows a front view of the dimer and the second part shows a top view. The morph was prepared using Chimera (Pettersen et al., 2004). The morph serves to illustrate the extent of the movements, but does not try to imply that the movements follow the same path.
Tables
Key resources table
| Reagent type (species) or resource | Designation | Source or reference | Identifiers |
|---|---|---|---|
| Gene (Streptococcus pneumoniae) | gyrA, gyrase A subunit | ATCC | 700669DQ |
| Gene (Streptococcus pneumoniae) | gyrB, gyrase B subunit | ATCC | 700669DQ |
| Strain, strain background (E. coli) | BL21-DE3 | Novagen | Catalogue # 1 69450 |
| Recombinant DNA reagent | pMCSG7 vector | PMID:12071693 | |
| Software, algorithm | leginon | PMID:3684574 | |
| Software, algorithm | Imagic | van Heel and Keegstra, 1981 IMAGIC: A fast, flexible and friendly image analysis software system Ultramicroscopy 7: 113–130. | |
| Software, algorithm | tigris | tigris.sourceforge.net | |
| Software, algorithm | Motioncor2 | PMID: 28250466 | |
| Software, algorithm | mag_distortion_corr | PMID: 26278979 | |
| Software, algorithm | Relion 1.4 | PMID: 23000701 | |
| Software, algorithm | Relion 2.1 | PMID: 27845625 | |
| Software, algorithm | Relion 3 | PMID: 30412051 | |
| Software, algorithm | cryoSPARC | PMID: 28165473 | |
| Software, algorithm | cisTEM | PMID: 29513216 | |
| Software, algorithm | ctffind4 | PMID: 26278980 | |
| Software, algorithm | gctf | PMID: 26592709 | |
| Software, algorithm | REFMAC5 | PMID: 15299926 | |
| Software, algorithm | PHENIX | PMID: 20124702 | |
| Software, algorithm | MDFF | PMID:18462672 | |
| Software, algorithm | COOT | PMID: 20383002 | |
| Software, algorithm | Chimera | PMID: 15264254 | |
| Software, algorithm | PYMOL | The PyMOL Molecular Graphics System. Schrödinger, LLC | |
| Software, algorithm | superpose | PMID: 15572779 | |
| Software, algorithm | ConSurf server | PMID: 15980475 | |
| Software, algorithm | SPIDER | PMID: 19180078 | |
| Software, algorithm | APBS | PMID: 11517324 | |
| Software, algorithm | jigglefit | PMID: 25615868 | |
| Software, algorithm | 3DNA | PMID: 18600227 | |
| Software, algorithm | XMIPP | PMID: 15477099 |
Additional files
-
Transparent reporting form
- https://doi.org/10.7554/eLife.41215.021
Download links
A two-part list of links to download the article, or parts of the article, in various formats.
Downloads (link to download the article as PDF)
Open citations (links to open the citations from this article in various online reference manager services)
Cite this article (links to download the citations from this article in formats compatible with various reference manager tools)
CryoEM structures of open dimers of gyrase A in complex with DNA illuminate mechanism of strand passage
eLife 7:e41215.
https://doi.org/10.7554/eLife.41215


