High-endothelial cell-derived S1P regulates dendritic cell localization and vascular integrity in the lymph node
- Osaka University, Japan
- JST CREST, Japan
- National Cerebral and Cardiovascular Center Research Institute, Japan
- Dokkyo Medical University, Japan
- Tohoku University, Japan
- Kansai University of Health Sciences, Japan
- University of Turku, Finland
Figures
Figure 1 with 2 supplements

Lyve1CRE-mediated Spns2-deletion in endothelial cells causes hypotrophy in pLNs.
(A) Macroscopic view of spleen, thymus and pLNs of wildtype Spns2f/f (left) and Lyve1;Spns2Δ/Δ (right) mice. (B) Quantification of S1P and sphingosine (SPH) concentrations in lymph and blood. (C) FACS analysis of CD4+ and CD8+ SP T-cells (top) and mature rec. B-cells (bottom) of pLNs of Spns2f/f and Lyve1;Spns2Δ/Δ mice. (D) Light microscopy of pLNs of Spns2f/f (left) and Lyve1;Spns2Δ/Δ (right) mice for CD3+ T-cells (top, blue) and IgD+ mature rec. B-cells (bottom, blue) counterstained for collagen-IV+ (brown) tissue frameworks. Each circle (B, C) represents an individual mouse; bars indicate the mean. Scale bars, 0.2 cm (A) or 200 μm (D). ***p<0.0005 (two-tailed unpaired Student’s t-test (B, C)). Data are representative for six mice per group (A, B), for 2x inguinal, 2x brachial and 2x axial LNs of six mice per group (D) or are pooled from three independent experiments (C) with n = 3 or n = 4 mice per group.
Figure 1—figure supplement 1
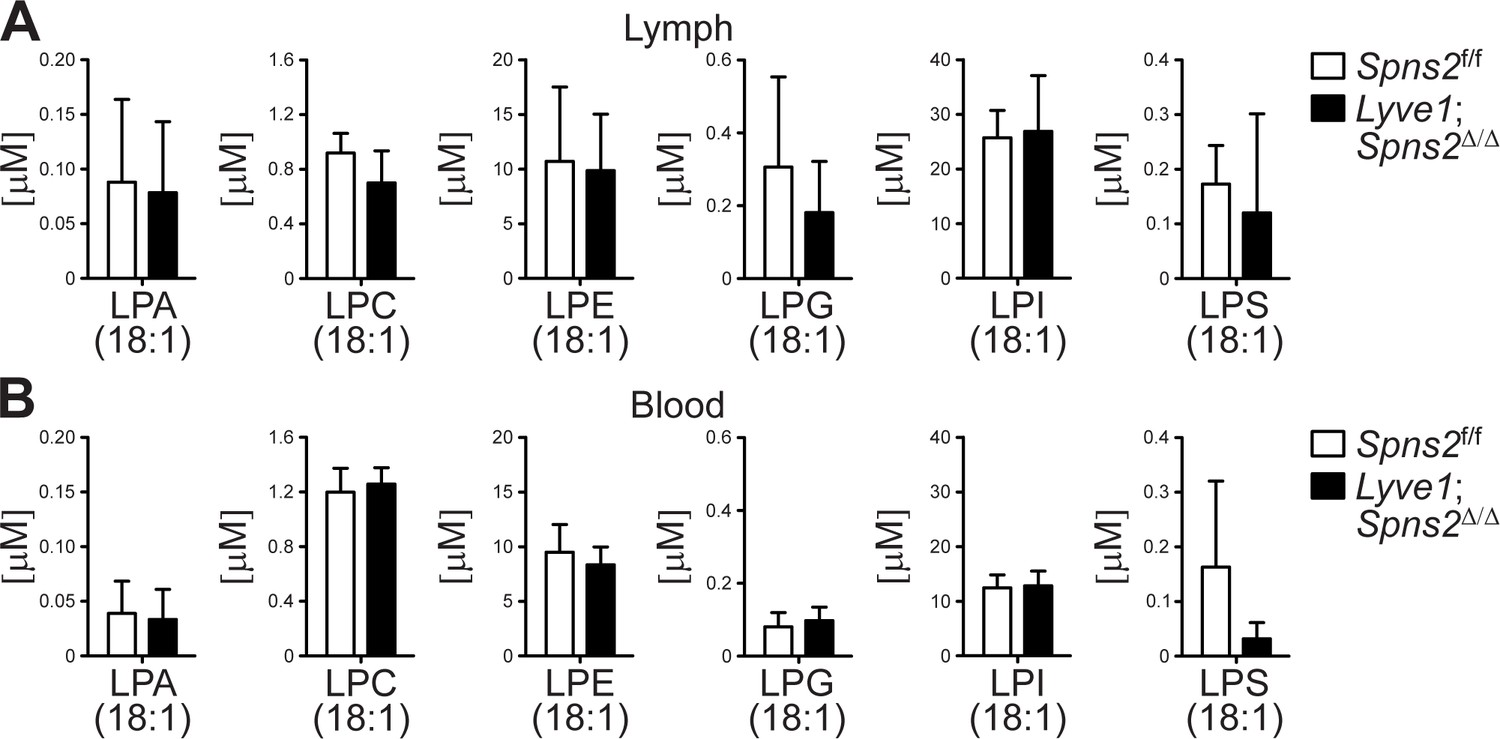
Lyve1CRE mediated Spns2-deficiency does not affect glycerol-based lysophospholipid levels, representatively shown for C18:1 species (other species (not shown) were also checked and found to be not different), in lymph and blood.
(A) Quantification of lymph concentrations of lysophosphatidic acid (LPA), lysophosphatidylcholine (LPC), lysophosphatidyethanolamine (LPE), lysophosphatidyglycerol (LPG), lysophosphatidylinositol (LPI) and lysophosphatidylserine (LPS). (B) Blood concentrations of glycerol-based lysophospholipids (as monitored in (A)). Data are representative for six mice per group (A), (B); mean + s.e.m. in A, (B).
Figure 1—figure supplement 2

Recirculating lymphocyte populations are impaired throughout various lymphatic tissues in Lyve1;Spns2Δ/Δ mice.
(A) FACS analysis of thymocytes and T-cells in the thymus of Spns2f/f and Lyve1;Spns2Δ/Δ mice. (B) FACS analysis of precursor B-cells (B220+/IgM-), immature B-cells (B220lo/IgM+) and mature rec. B-cells (B220hi/IgM+) in the BM of Spns2f/f and Lyve1;Spns2Δ/Δ mice. (C) FACS analysis of CD4+ and CD8+ SP T-cells (top) and mature rec. B-cells (bottom) in the blood of Spns2f/f and Lyve1;Spns2Δ/Δ mice. (D) FACS analysis of CD4+ and CD8+ SP T-cells (top) and B220+/CD21-/CD23- transitional (T1) and B1 B-cells (bottom), B220+/CD21+/CD23+ follicular (FO) B-cells (bottom) and B220+/CD21hi/CD23lomarginal zone (MZ) B-cells (bottom) in the spleen of Spns2f/f and Lyve1;Spns2Δ/Δ mice. (E) Light microscopy of the spleen of Spns2f/f (left) and Lyve1;Spns2Δ/Δ (right) mice for CD3+ T-cells (top, blue) and IgD+ mature rec. B-cells (bottom, blue) counterstained for collagen-IV+ (brown) tissue frameworks. (F) FACS analysis of apoptotic CD4+ and CD8+ SP T-cells (left) and mature rec. B-cells (right) by AnnexinV-staining in the thymus, BM, spleen and pLNs of Spns2f/f and Lyve1;Spns2Δ/Δ mice. Each circle (A–C, D, F) represents an individual mouse; bars indicate the mean. Scale bars, 200 μm (E). *p<0.05; **p<0.005; ***p<0.0005 (two-tailed unpaired Student’s t-test (A–C, D, F)). Data are pooled from three independent experiments (A–D, D, F) with n = 3 or n = 4 mice per group (A–C, D, F), or are representative for six mice per group (E).
Figure 2 with 1 supplement

The immigration of lymphocytes into pLNs and their egress into the lymphatic system is severely impaired in Lyve1;Spns2Δ/Δ mice.
(A) FACS analysis of CD4+ and CD8+ SP T-cells (left) and mature rec. B-cells (right) of lymph fluid isolated from the cisterna chyli of Spns2f/f and Lyve1;Spns2Δ/Δ mice. (B) Experimental flow-chart of short-terming homing assays to quantify lymphocyte immigration into pLNs. (C) FACS analysis of total congenic CD45.1+ cells in pLNs two hours upon injection of WT splenocytes into Spns2f/f and Lyve1;Spns2Δ/Δ mice. (D) Light microscopy of frozen sections of pLNs of Spns2f/f (left) and Lyve1;Spns2Δ/Δ (right) mice for PNAd+ HEVs (blue) counterstained for collagen-IV+ (brown). (E) FACS analysis of total CD45-/CD31+/PNAd+ high-endothelial cells isolated from pLNs of Spns2f/f and Lyve1;Spns2Δ/Δ mice. (F) Experimental flow-chart of homing assays to quantify lymphocyte egress from pLNs. (G) Total numbers of congenic eGFP+ cells in pLNs at 0 hr and 20 hr upon injection of anti-α4 / anti-αL antibodies into Spns2f/f and Lyve1;Spns2Δ/Δ mice. Each circle (A, C, E, G) represents an individual mouse; bars indicate the mean. Scale bars, 50 μm (D). **p<0.005; ***p<0.0005 (two-tailed unpaired Student’s t-test (A, C, E, G)). Data are representative for five mice per group pooled from two independent experiments (A) with n = 2 or n = 3 mice per group (A), for six mice per group (D) or are pooled from two (C, G) or three (E) independent experiments with n = 2, n = 3 or n = 4 mice per group.
Figure 2—figure supplement 1
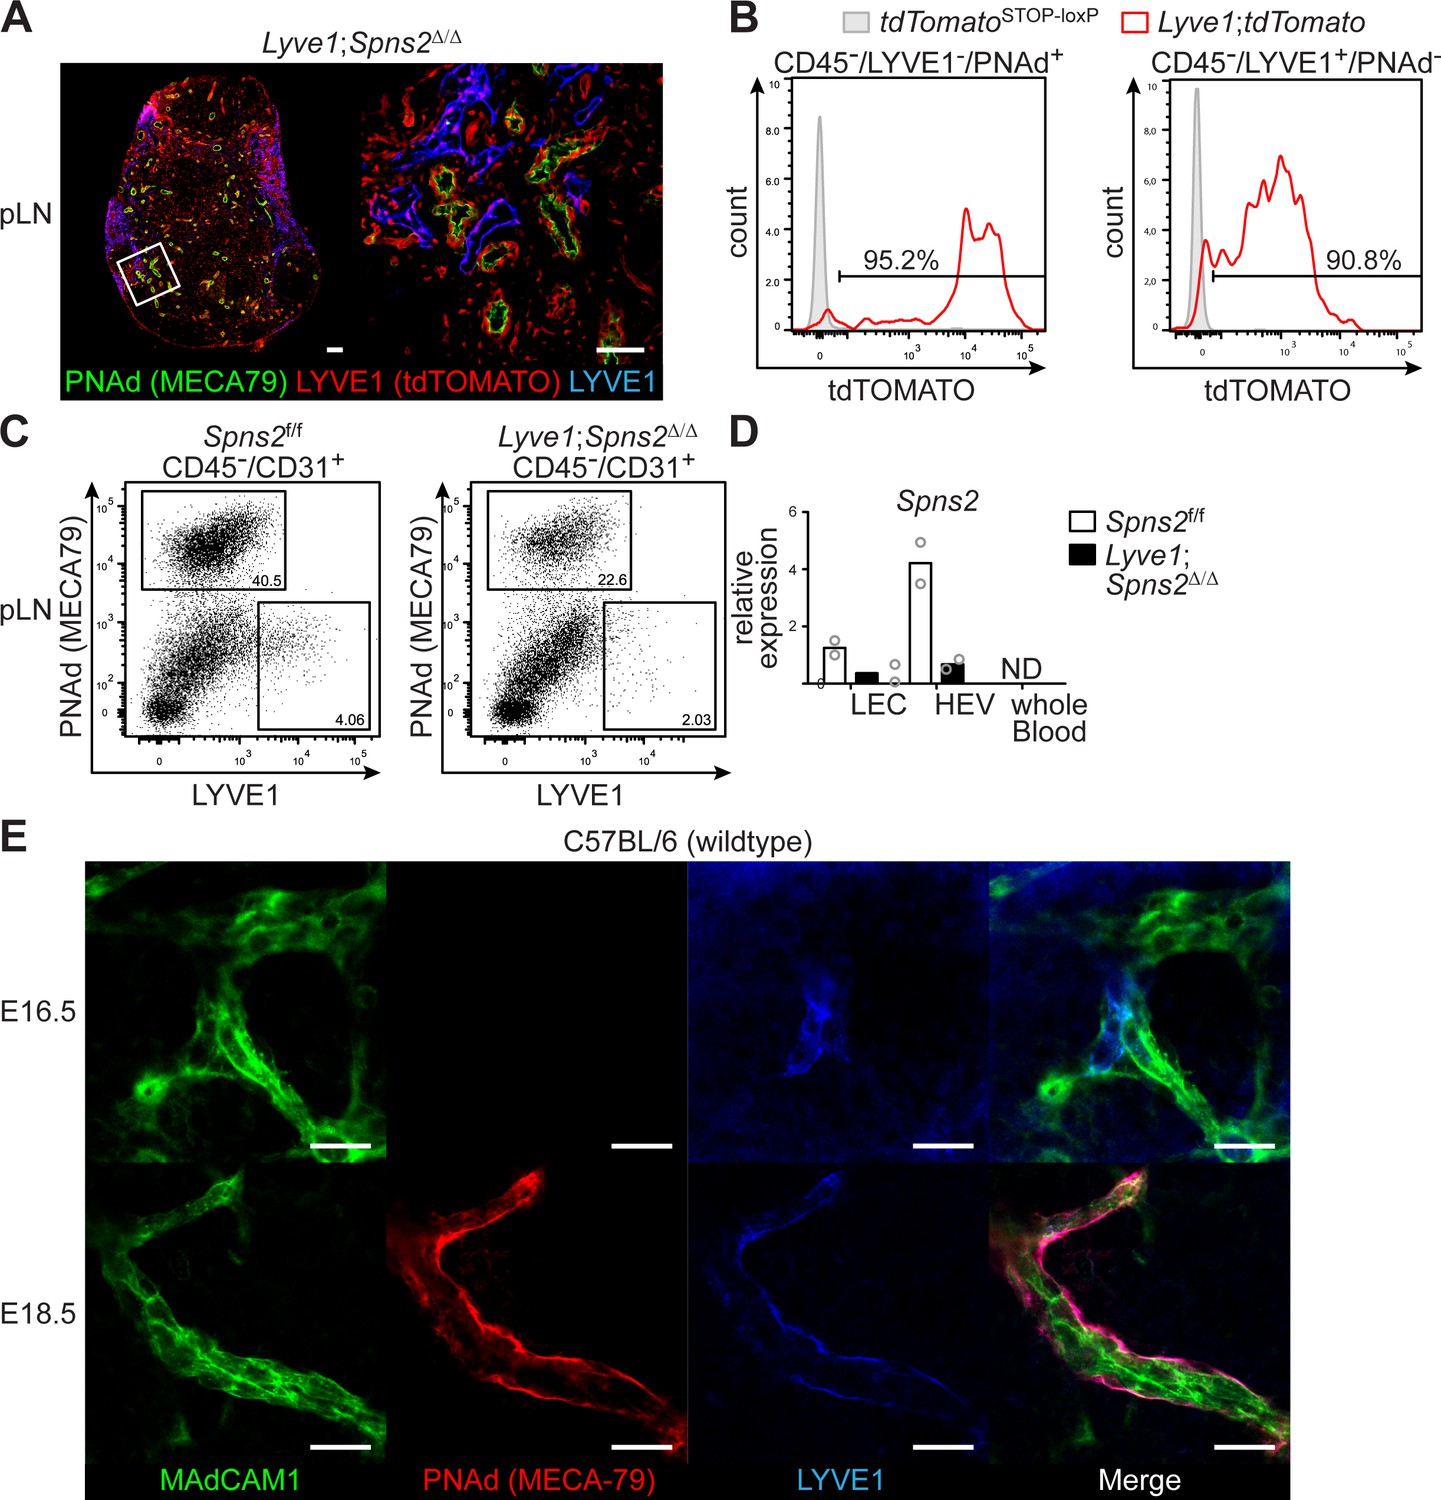
Spns2 is effectively deleted in LECs and HEVs of Lyve1;Spns2Δ/Δ mice.
(A) Confocal microscopy of pLNs of Lyve1;tdTomato reporter mice for tdTOMATO+ (LYVE1-) expressing cells (red), PNAd+ (green) HEVs and Lyve-1+ (blue) LECs. (B) FACS analysis of CD45-/CD31+/PNAd+/Lyve-1- high-endothelial cells and CD45-/CD31+/PNAd-/Lyve-1+ LECs isolated from pLNs of tdTomatoSTOP-loxP control mice or Lyve1;tdTomato mice for tdTOMATO expression. (C) FACS analysis of CD45-/CD31+/PNAd+/Lyve-1- high-endothelial cells and CD45-/CD31+/PNAd-/Lyve-1+ LECs of pLNs of Spns2f/f and Lyve1;Spns2Δ/Δ mice. (D) Quantitative RT-PCR analysis of Spns2 mRNA in sorted LECs, HEVs (as in C) and of whole blood from Spns2f/f and Lyve1;Spns2Δ/Δ mice. (E) Confocal microscopy of whole mounts of iLNs isolated from embryos of E16.5 (top) and E18.5 (bottom) of WT C57BL/6 mice for MAdCAM-1 (green), PNAd (red) and Lyve-1 (blue) on high-endothelial cell progenitors and HEVs. Scale bars, 200 μm (A, left), 50 μm (A, right) and 20 μm (D). Data are representative for three mice per group (A), or are representative for two individual experiments (B–D) of pooled non-hematopoietic cells from 2x pLNs, 2x iLNs, 2x aLNs, 2x bLNs, 6x cervical LNs collected from five mice per group (B–D), or are representative for five analyzed embryos per group (E).
Figure 3 with 1 supplement

SPNS2-derived S1P controls interactions of PNAd+ HEVs with lymph-derived dendritic cells in pLNs.
(A) FACS analysis of CCR7-expression on endogenous conventional mDCs (CD3-/CD19-/CD11cint/MHC-IIhi) and rDCs (CD3-/CD19-/CD11chi/MHC-IIint) isolated from pLNs of Spns2f/f and Lyve1;Spns2Δ/Δ mice. (B) Confocal microscopy of pLNs of Spns2f/f (left) and Lyve1;Spns2Δ/Δ (right) mice for CD11c+ (green) DCs, PNAd+ (red) HEVs and Lyve-1+ (blue) LECs. (C) TEM images of HEVs in pLNs of Spns2f/f and Lyve1;Spns2Δ/Δ mice. (D) Flow-cytometric TUNEL assay on CD45-/CD31+/PNAd+ high-endothelial cells isolated from pLNs of Spns2f/f and Lyve1;Spns2Δ/Δ mice. (E) Experimental flow-chart of BMDC-differentiation in vitro, and lymphatic homing assays of footpad injected BMDCs to quantify DC-immigration from afferent lymphatics into pLNs of Spns2f/f and Lyve1;Spns2Δ/Δ mice. (F) Confocal microscopy of pLNs of Spns2f/f (left) and Lyve1;Spns2Δ/Δ (right) mice for CMTMR+ BMDCs (red), PNAd+ (green) HEVs and ERTR7+ (blue) fibroblastic tissue networks. (G) Visualisation of the automated detection of individual CMTMR+ BMDCs (white spheres) from PNAd+ HEVs (green surface) in pLNs of Spns2f/f (left) and Lyve1;Spns2Δ/Δ (right) mice. Grey gradients visualise the distance transformation from HEVs (green surface) defined by PNAd-staining. (H) Total numbers of BMDCs (white spheres in (F)) in distances from 0 μm - 100 μm from HEVs counted in 10 μm radial areas around HEVs in pLNs of Spns2f/f and Lyve1;Spns2Δ/Δ mice. Each circle represents an individual mouse (A, D) or total numbers of BMDCs around HEVs in the visual field of a micrograph (H); bars indicate the mean. Scale bars, 5 μm (C), 50 μm (B, F, G). *p<0.05; **p<0.005; ***p<0.0005 (two-tailed unpaired Student’s t-test (A, D, H)). Data are representative for six mice per group pooled from two (A, B) or three (D) independent experiments with n = 3 (A) or n = 4 per (D) mice group, for 2x pLNs and 2x iLNs of three mice per group (C), for 36x representative individual sections of 2x analyzed popliteal LNs per mouse pooled from two independent experiments (H) with n = 6 mice per group (H).
Figure 3—figure supplement 1
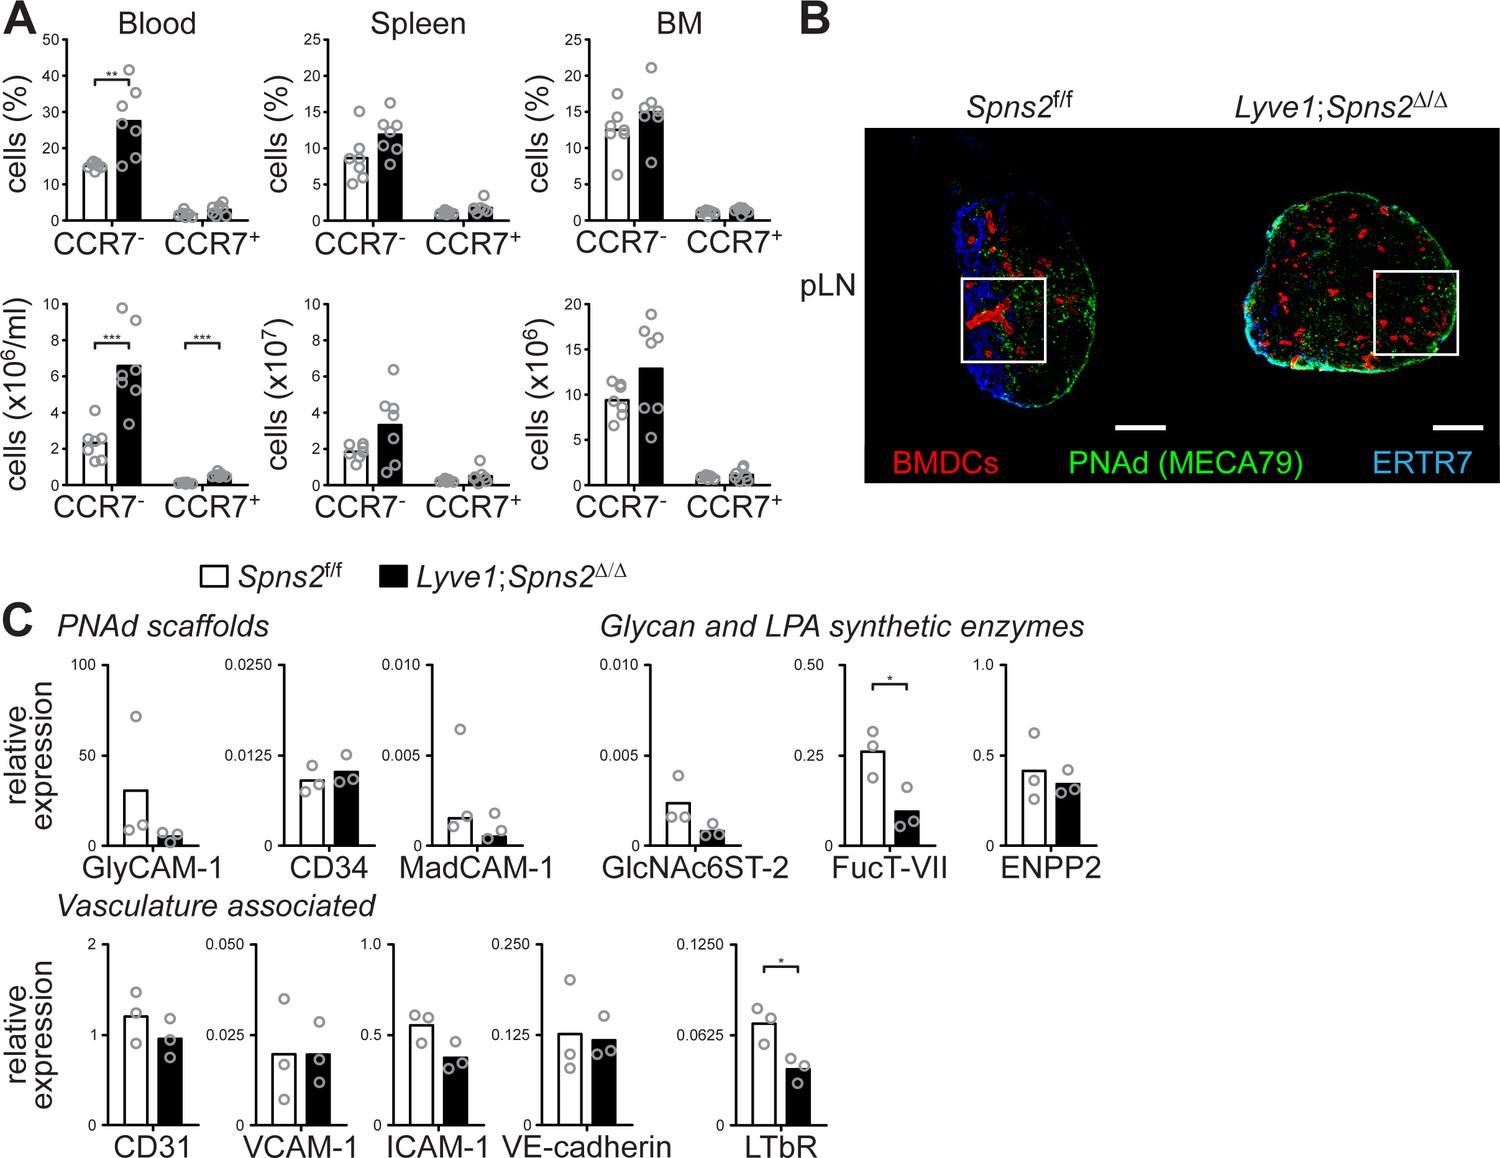
Endogenous DCs do not co-localize with HEVs in pLNs of Lyve1;Spns2Δ/Δ mice.
(A) FACS analysis of CCR7- and CCR7+ conventional mDCs (CD19-/CD3-/CD11c+/MHC-II+) in blood, spleen, and BM of Spns2f/f and Lyve1;Spns2Δ/Δ mice. (B) Confocal microscopy of pLNs of Spns2f/f (left) and Lyve1;Spns2Δ/Δ (right) mice for CD11c+ (green) DCs, PNAd+ (red) HEVs and Lyve-1+ (blue) LECs. White squares show the regions of interest magnified and shown in Figure 3 (B). (C) qRT-PCR analysis of the expression levels of PNAd scaffolds (GlyCAM-1, CD34, MadCAM-1), of Glycan and LPA synthetic enzymes (GlcNAc6ST-2, FucT-VII, ENPP2), and vascular associated genes (CD31, VCAM-1, ICAM-1, VE-cadherin, LTbR) in total mRNA isolated from CD45-/CD31+/PNAd+ high-endothelial cells sorted from pLNs of Spns2f/f and Lyve1;Spns2Δ/Δ mice. Each circle (A) represents an individual mouse (A) or the relative chemokine expression levels in mRNA extracted from the total CD45-/CD31+/PNAd+ high-endothelial cells (C); bars indicate the mean. Data are pooled from two independent experiments (A) with n = 3 or n = 4 mice per group (A), are representative for 18x individual sections of 2x analyzed pLNs, iLNs and bLNs per mouse pooled from three mice per group in two individual experiments (B), three independent mRNA preparations of 2x pLNs, iLNs and bLNs per mouse pooled from five mice per group (C), or seven (D) individual mice. Scale bars, 200 μm (B). *p<0.05; **p<0.005; ***p<0.0005 (two-tailed unpaired Student’s t-test (A, C)).
Figure 4
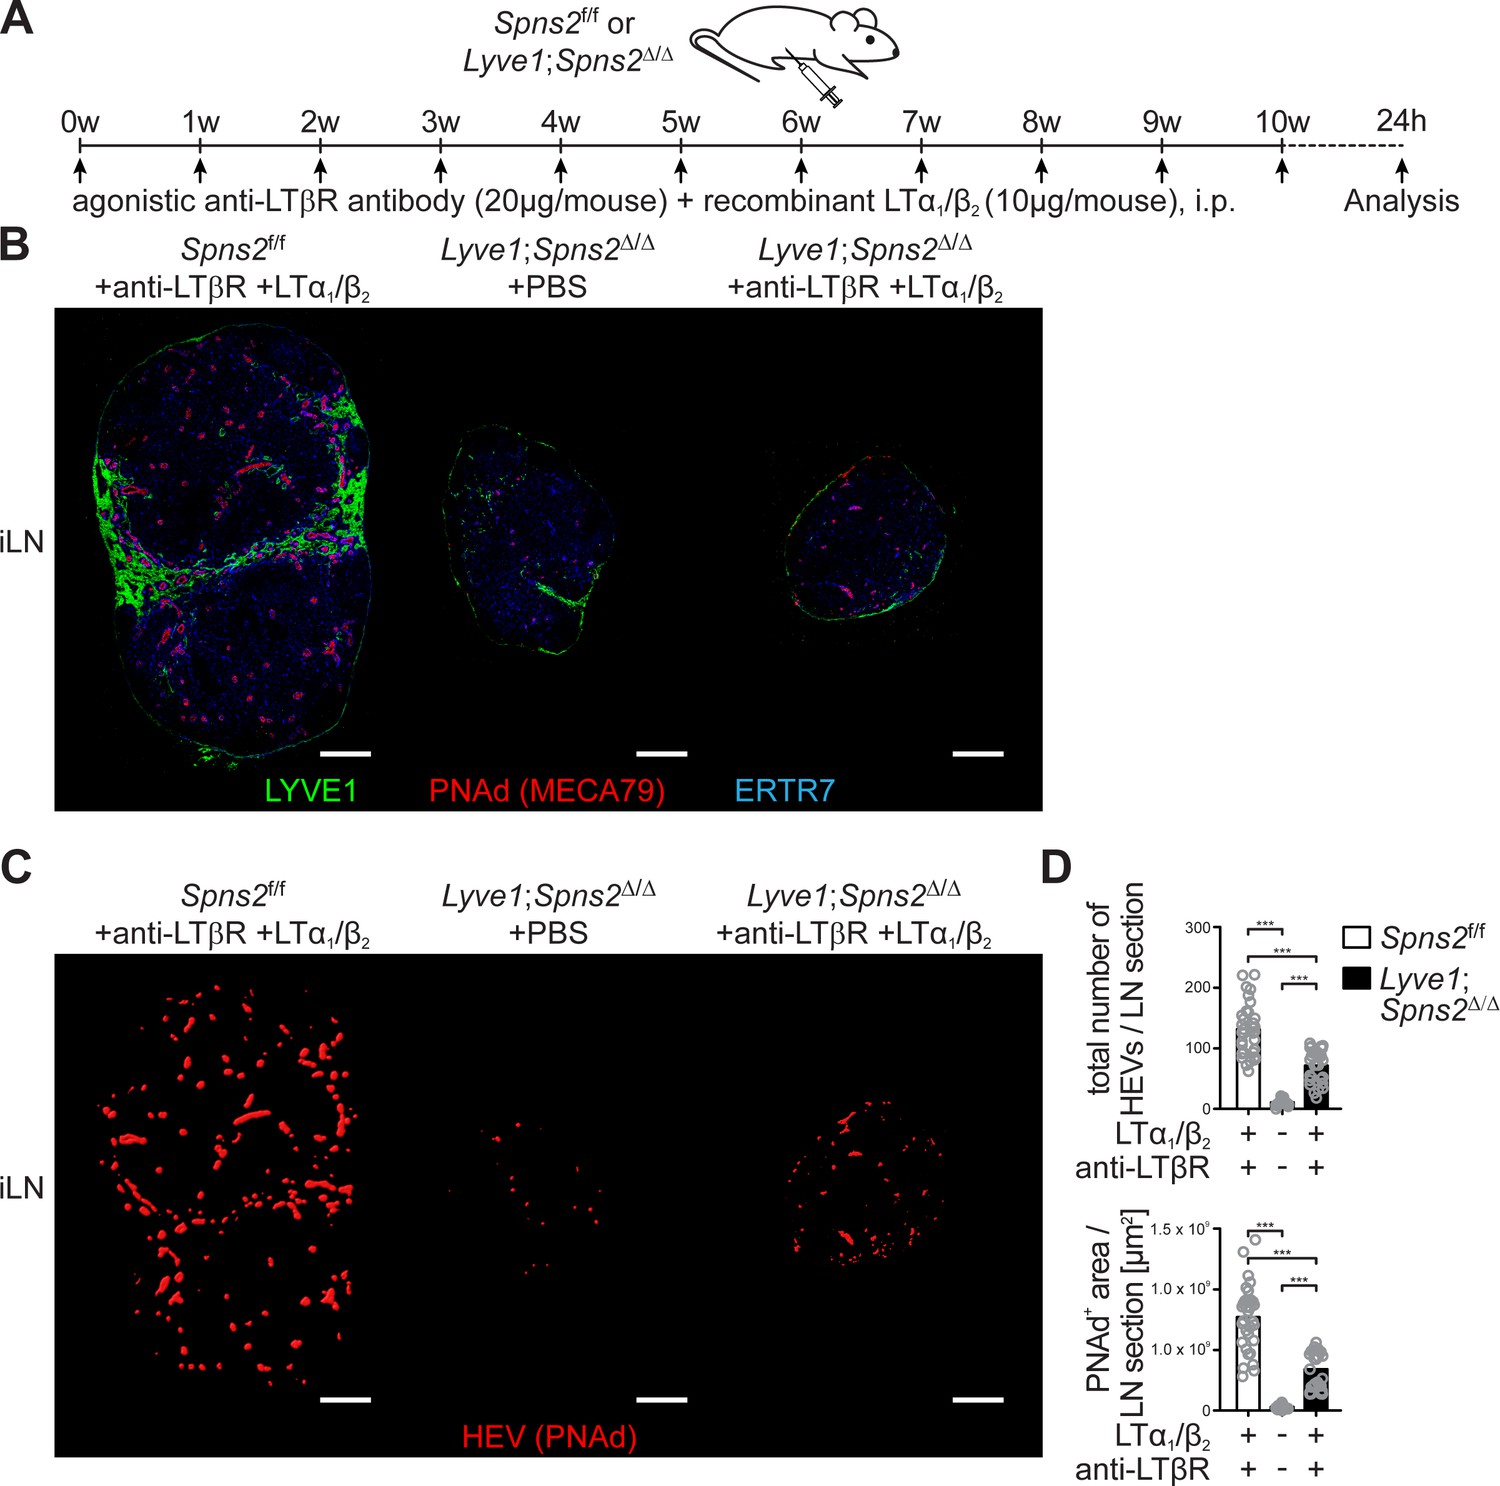
Combined anti-LTβr antibody and recombinant LTα1/β2 protein treatment partially rescues total high-endothelial cell numbers and HEV morphology.
(A) Experimental flow-chart of PBS or agonistic anti-LTβr antibody (20 μg/mouse) and recombinant LTα1/β2 protein (10 μg/mouse) i.p. injections into Spns2f/f and Lyve1;Spns2Δ/Δ mice. (B) Confocal microscopy of iLNs of Spns2f/f mice +anti-LTβr antibody +LTα1/β2 (left), Lyve1;Spns2Δ/Δ mice +PBS (mid) and Lyve1;Spns2Δ/Δ mice +anti-LTβr antibody +LTα1/β2 (right) mice for LYVE1+ (green) LECs, PNAd+ (red) HEVs and ERTR7+ (blue) fibroblastic tissue networks. (C) Visualisation of the automated detection of PNAd+ HEVs (red surfaces) used for the quantification of the total numbers of HEVs/LN section and the total PNAd+ area/LN section of iLNs of Spns2f/f mice +anti-LTβr antibody +LTα1/β2 (left), Lyve1;Spns2Δ/Δ mice +PBS (mid) and Lyve1;Spns2Δ/Δ mice +anti-LTβr antibody +LTα1/β2 (right) mice. (D) The total numbers of HEVs/LN section and the total PNAd+ area/LN section extracted from the analyses shown in (B) and (C) of iLNs of Spns2f/f and Lyve1;Spns2Δ/Δ mice treated with +PBS or +anti-LTβr antibody +LTα1/β2. Each circle represents the total numbers of HEVs/LN section or the total PNAd+ area/LN section [μm2] extracted from the micrographs (B, C), bars indicate the mean. Scale bars, 200 μm (B, C). ***p<0.0005 (two-tailed unpaired Student’s t-test (D)). Data are shown for representative sections from 2x analyzed iLNs per mouse (B, C) selected from 21x – 33x individually analyzed sections of six mice per group (D).
Figure 5 with 1 supplement
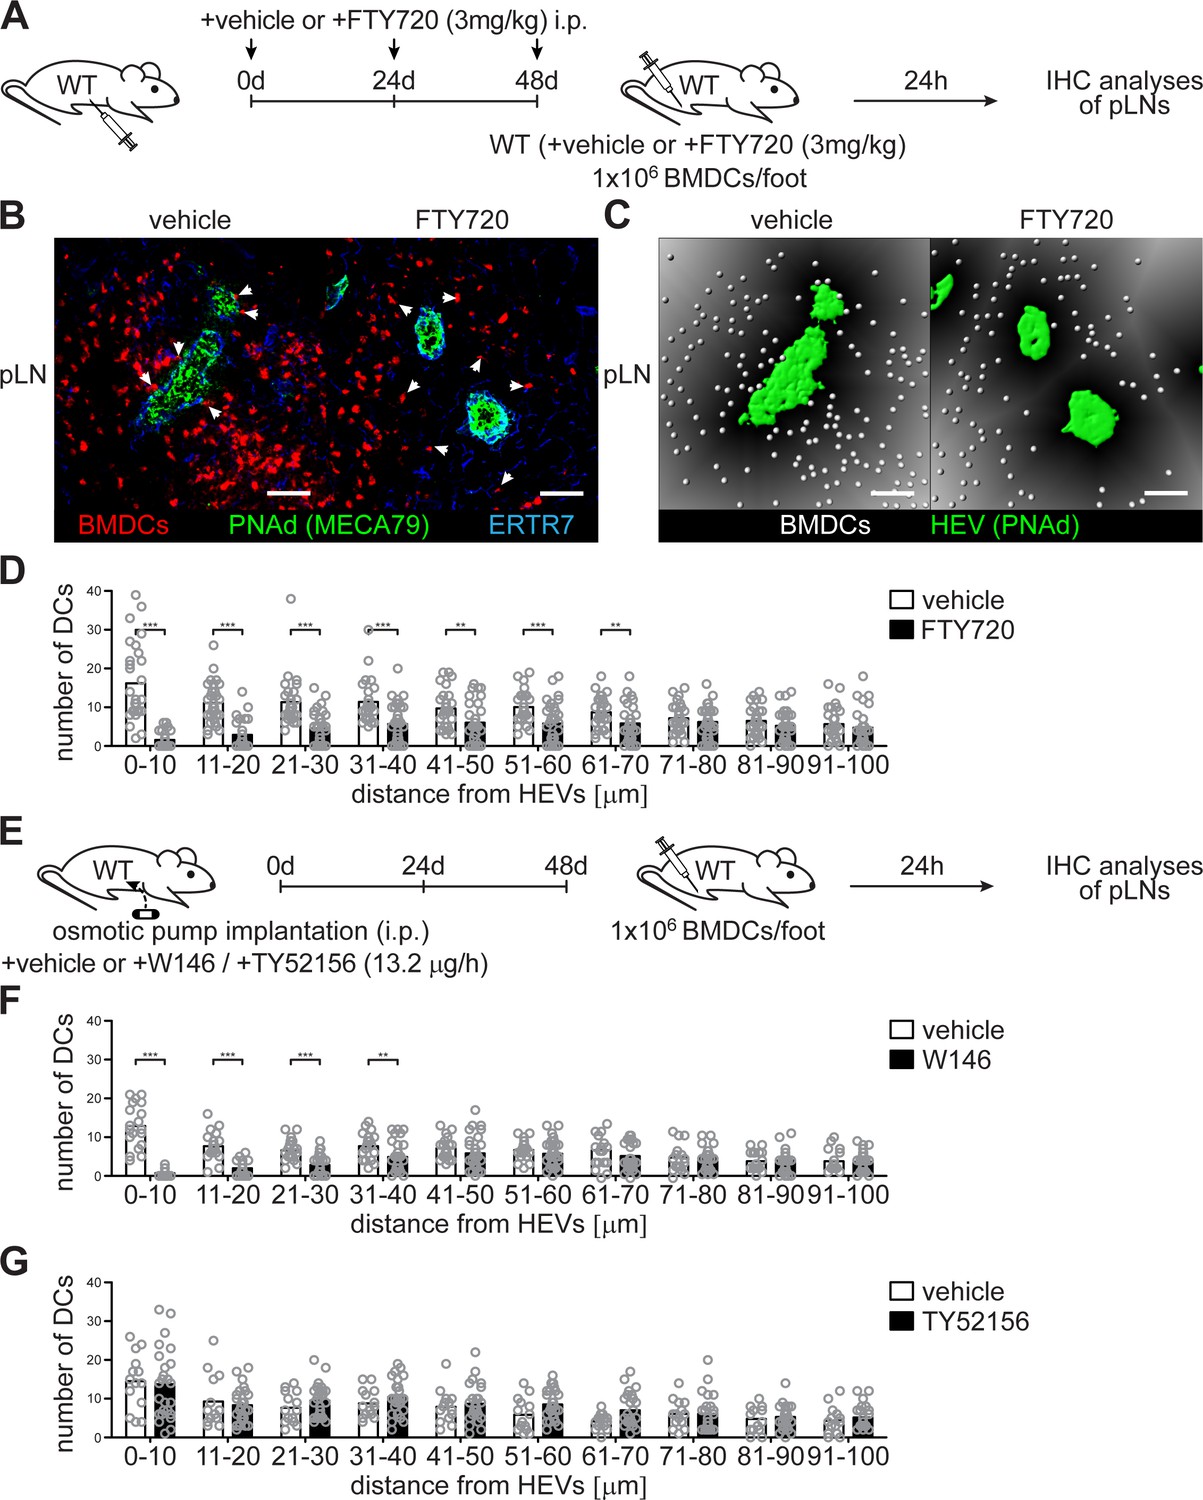
Co-localization of PNAd+ HEVs with lymph-derived BMDCs in pLNs is dependent on S1PR1- but not S1PR3-signalling.
(A) Experimental flow-chart for the administration of the non-specific S1PR-antagonist FTY720 i.p. and lymphatic homing assays of footpad injected BMDCs to quantify HEV-DC interactions in pLNs in situ. (B) Confocal microscopy of pLNs of vehicle (left) or FTY720 (right) treated mice for CMTMR+ BMDCs (red), PNAd+ (green) HEVs and ERTR7+ (blue) fibroblastic tissue networks. (C) Visualisation of the distance of individual CMTMR+ BMDCs (white spheres) from PNAd+ HEVs (green surface) in pLNs of vehicle (left) or FTY720 (right) treated mice. Grey gradients visualise the distance transformation from HEVs (green surface) defined by PNAd-staining. (D) Total numbers of BMDCs (white spheres in (B)) in distances from 0 μm - 100 μm from HEVs (green surface in (B)) counted in 10 μm radial areas around HEVs in pLNs of vehicle or FTY720 treated mice. (E) Experimental flow-chart for the administration of the specific S1PR1-antagonist W146 and the S1PR3-antagonist TY52156, and lymphatic homing assays of BMDCs to quantify HEV-DC interactions in pLNs in situ. (F, G) Total numbers of BMDCs (white spheres as shown in (C)) in distances from 0 μm - 100 μm from HEVs counted in 10 μm radial areas around HEVs in pLNs of treated mice. Each circle represents the total numbers of BMDCs around HEVs in the visual field of a micrograph (D, F, G); bars indicate the mean. Scale bars, 50 μm (B, C). **p<0.005; ***p<0.0005 (two-tailed unpaired Student’s t-test (F, G)). Data are representative for 37x representative individual sections of 2x analyzed popliteal LNs per mouse pooled from two independent experiments (B, C, D) with n = 6 mice per group (B, C, D) and for 34x (F) or 26x (G) representative individual sections of 2x analyzed popliteal LNs per mouse pooled from 5x mice per group (F, G).
Figure 5—figure supplement 1

Co-localization of lymph-derived BMDCs with PNAd+ HEVs in pLNs is dependent on S1PR1- but not S1PR3-signaling.
(A) Confocal microscopy of pLNs of vehicle (left) or W146 (right) treated mice for CMTMR+ BMDCs (red), PNAd+ (green) HEVs and ERTR7+ (blue) fibroblastic tissue networks. (B) Visualisation of the automated quantification of the distance of individual CMTMR+ BMDCs (white spheres) from PNAd+ HEVs (green surface) in pLNs of vehicle (left) or W146 (right) treated mice. Grey gradients visualise the distance transformation from HEVs (green surface) defined by PNAd-staining. (C) Confocal microscopy of pLNs of vehicle (left) or TY52156 (right) treated mice for CMTMR+ BMDCs (red), PNAd+ (green) HEVs and ERTR7+ (blue) fibroblastic tissue networks. (D) Visualisation of the distance of individual CMTMR+ BMDCs (white spheres) from PNAd+ HEVs (green surface) in pLNs of vehicle (left) or TY52156 (right) treated mice. Grey gradients visualise the distance transformation from HEVs (green surface) defined by PNAd-staining. (E) Fluorescence microscopy of pLNs of Spns2f/f (left) and Lyve1;Spns2Δ/Δ (right) mice for isotype (top, green)/pAkt (bottom, green) on PNAd+ (red) HEVs and CD45+ (white) hematopoietic cells. Scale bars, 50 μm (A–D) and 20 μm (E). Data are representative for 2x analyzed popliteal LNs per mouse pooled from 5x mice per group (A–D), or are representative for five mice per group pooled from two independent experiments (E) with n = 2 or n = 3 mice per group (E).
Figure 6 with 1 supplement
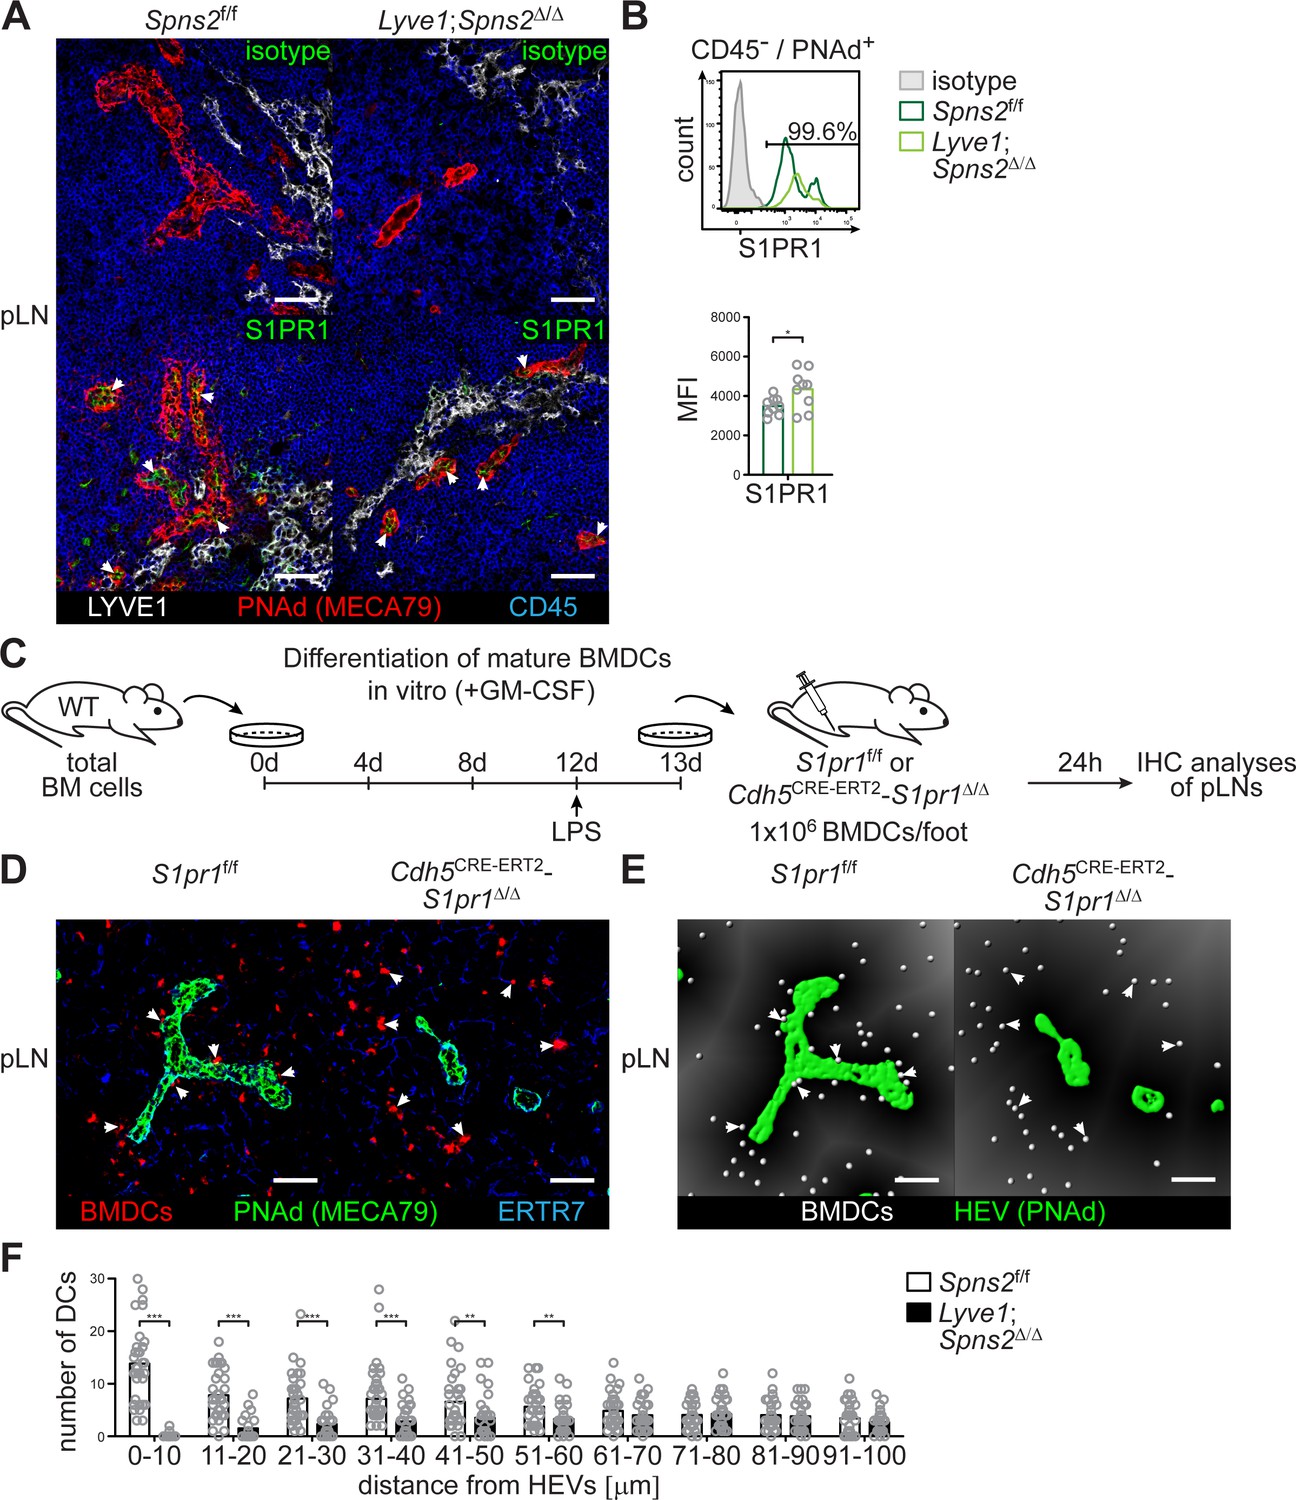
SPNS2-derived S1P controls autocrine S1PR1-Gi signalling in PNAd+ HEVs of pLNs.
(A) Fluorescence microscopy of pLNs of Spns2f/f (left) and Lyve1;Spns2Δ/Δ (right) mice for isotype (top, green)/S1PR1 (bottom, green) on PNAd+ (red) HEVs and LYVE1+ (white) LECs, and CD45+ (blue) hematopoietic cells. (B) FACS analysis of the cell surface expression of S1PR1 on CD45-/CD31+/PNAd+ high-endothelial cells in pLNs of Spns2f/f and Lyve1;Spns2Δ/Δ mice. (C) Experimental flow-chart of BMDC-differentiation in vitro, and lymphatic homing assays of footpad injected BMDCs to quantify DC-immigration from afferent lymphatics into pLNs of S1pr1f/f and Cdh5CRE-ERT2;S1pr1Δ/Δ mice. (D) Confocal microscopy of pLNs of S1pr1f/f (left) and Cdh5CRE-ERT2;S1pr1Δ/Δ (right) mice for CMTMR+ BMDCs (red), PNAd+ (green) HEVs and ERTR7+ (blue) fibroblastic tissue networks. (E) Visualisation of the automated detection of individual CMTMR+ BMDCs (white spheres) from PNAd+ HEVs (green surface) in pLNs of S1pr1f/f (left) and Cdh5CRE-ERT2;S1pr1Δ/Δ (right) mice. Grey gradients visualise the distance transformation from HEVs (green surface) defined by PNAd-staining. (F) Total numbers of BMDCs (white spheres in (E)) in distances from 0 μm - 100 μm from HEVs counted in 10 μm radial areas around HEVs in pLNs of S1pr1f/f and Cdh5CRE-ERT2;S1pr1Δ/Δ mice. Each circle represents an individual mouse (B) or total numbers of BMDCs around HEVs in the visual field of a micrograph (F); bars indicate the mean. Scale bars, 50 μm (A, D, G). *p<0.05, **p<0.005; ***p<0.0005 (two-tailed unpaired Student’s t-test (B, F)). Data are representative for five mice per group pooled from two independent experiments (A) with n = 2 or n = 3 mice per group (A), or are representative for nine mice per group pooled from three independent experiments (B) with n = 3 mice per group (B), or for 37x representative individual sections of 2x analyzed popliteal LNs per mouse pooled from two independent experiments (F) with n = 4 mice per group (H).
Figure 6—figure supplement 1
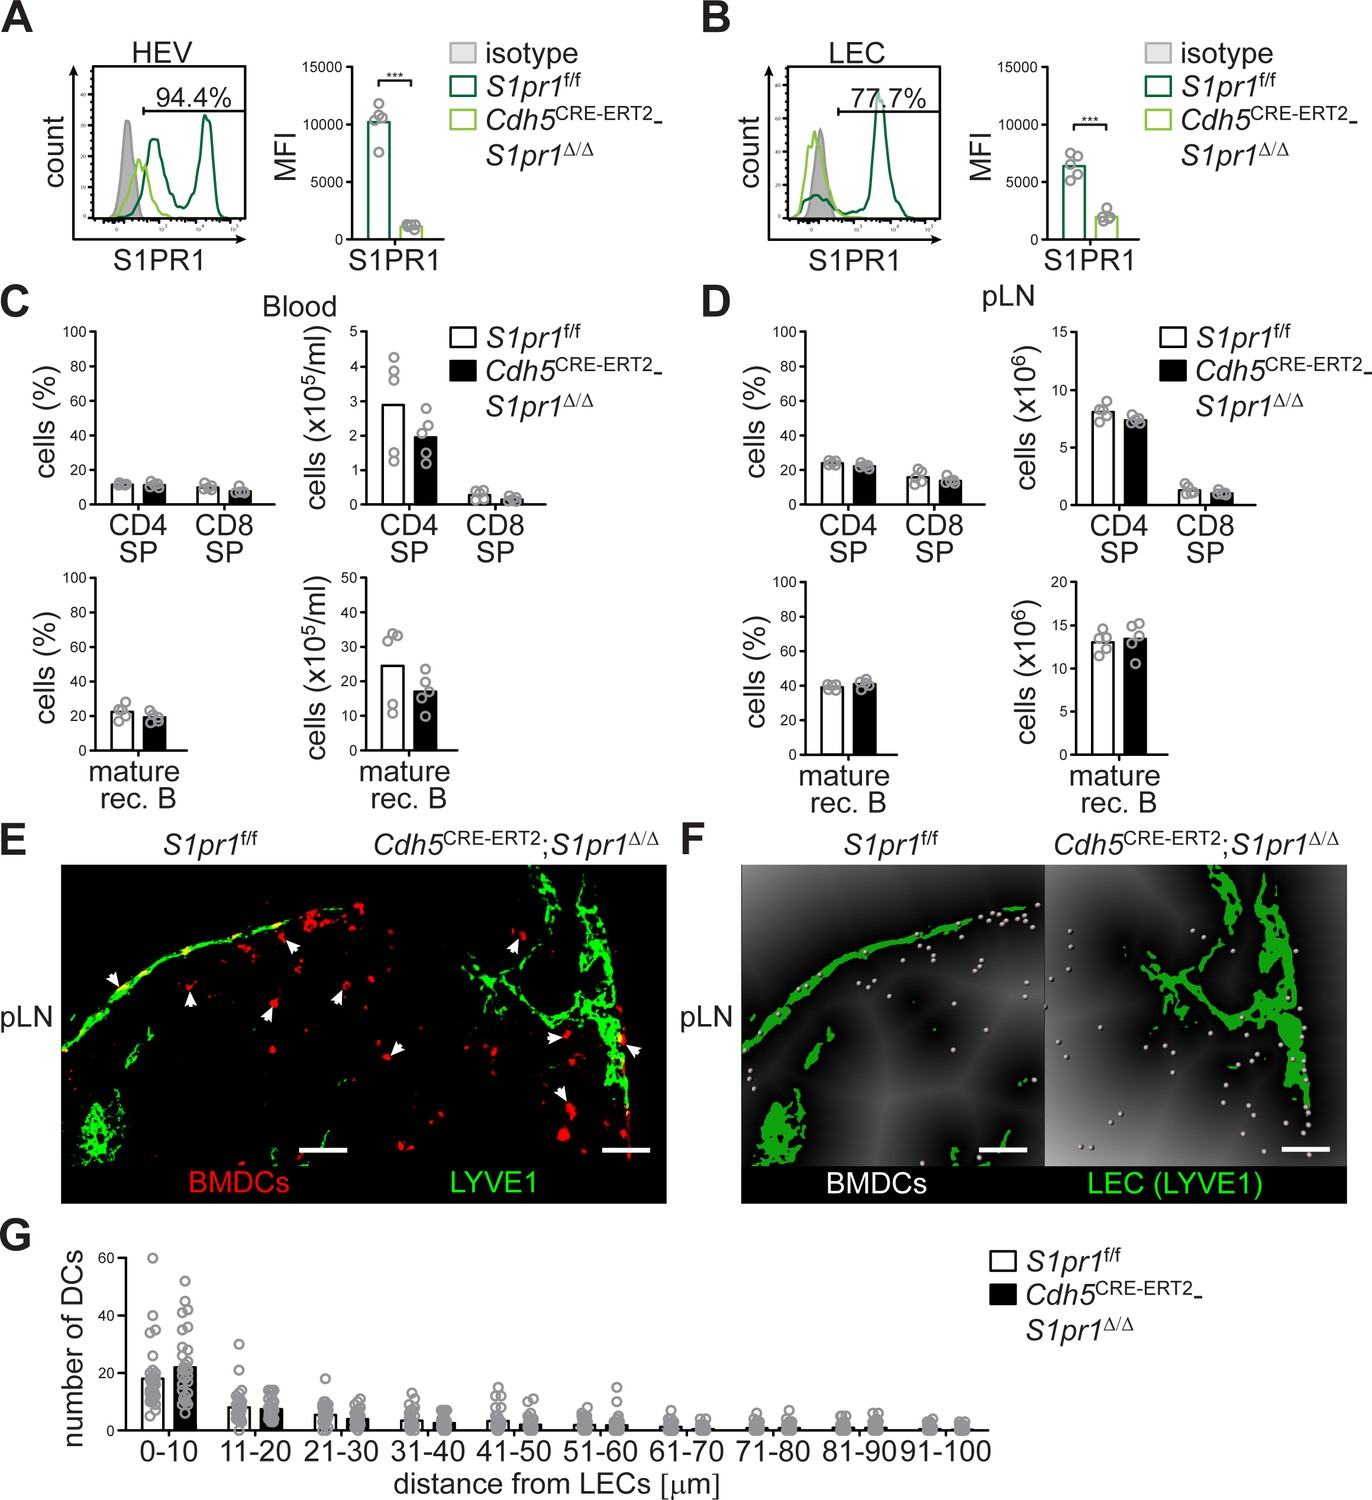
Endothelial-cell specific deletion of S1pr1 does not affect lymphocyte immigration into pLNs, and does not influence DC-positioning at cortical lymphatics.
(A) FACS analysis of the cell surface expression of S1PR1 on CD45-/CD31+/PNAd+/LYVE1- high-endothelial cells and (B) on CD45-/CD31+/PNAd-/LYVE1+ LECs in pLNs of S1pr1f/f and Cdh5CRE-ERT2;S1pr1Δ/Δ mice. (C) FACS analysis of CD4+ and CD8+ SP T-cells (top) and mature rec. B-cells (bottom) in the blood and (D) pLNs of S1pr1f/f and Cdh5CRE-ERT2;S1pr1Δ/Δ mice. (E) Confocal microscopy of pLNs of S1pr1f/f and Cdh5CRE-ERT2;S1pr1Δ/Δ mice for CMTMR+ BMDCs (red) and LYVE1+ (green) LECs. (F) Visualisation of the automated quantification of the distance of individual CMTMR+ BMDCs (white spheres) from LYVE1+ LECs (green surface) in pLNs of S1pr1f/f and Cdh5CRE-ERT2;S1pr1Δ/Δ mice. Grey gradients visualise the distance transformation from LECs (green surface) defined by anti-LYVE1-staining. (G) Total numbers of BMDCs (white spheres in (F)) in distances from 0 μm - 100 μm from HEVs counted in 10 μm radial areas around LECs in pLNs of S1pr1f/f and Cdh5CRE-ERT2;S1pr1Δ/Δ mice. Each circle represents an individual mouse (A–D) or total numbers of BMDCs around HEVs in the visual field of a micrograph (G); bars indicate the mean. Scale bars, 50 μm (E–F). *p<0.05, **p<0.005; ***p<0.0005 (two-tailed unpaired Student’s t-test (A–D, G)). Data are representative for five mice per group pooled from two independent experiments (A–D) with n = 2 or n = 3 mice per group (A–D), or for 29x representative individual sections of 2x analyzed popliteal LNs per mouse pooled from two independent experiments (E–F) with n = 4 mice per group (G).
Figure 7
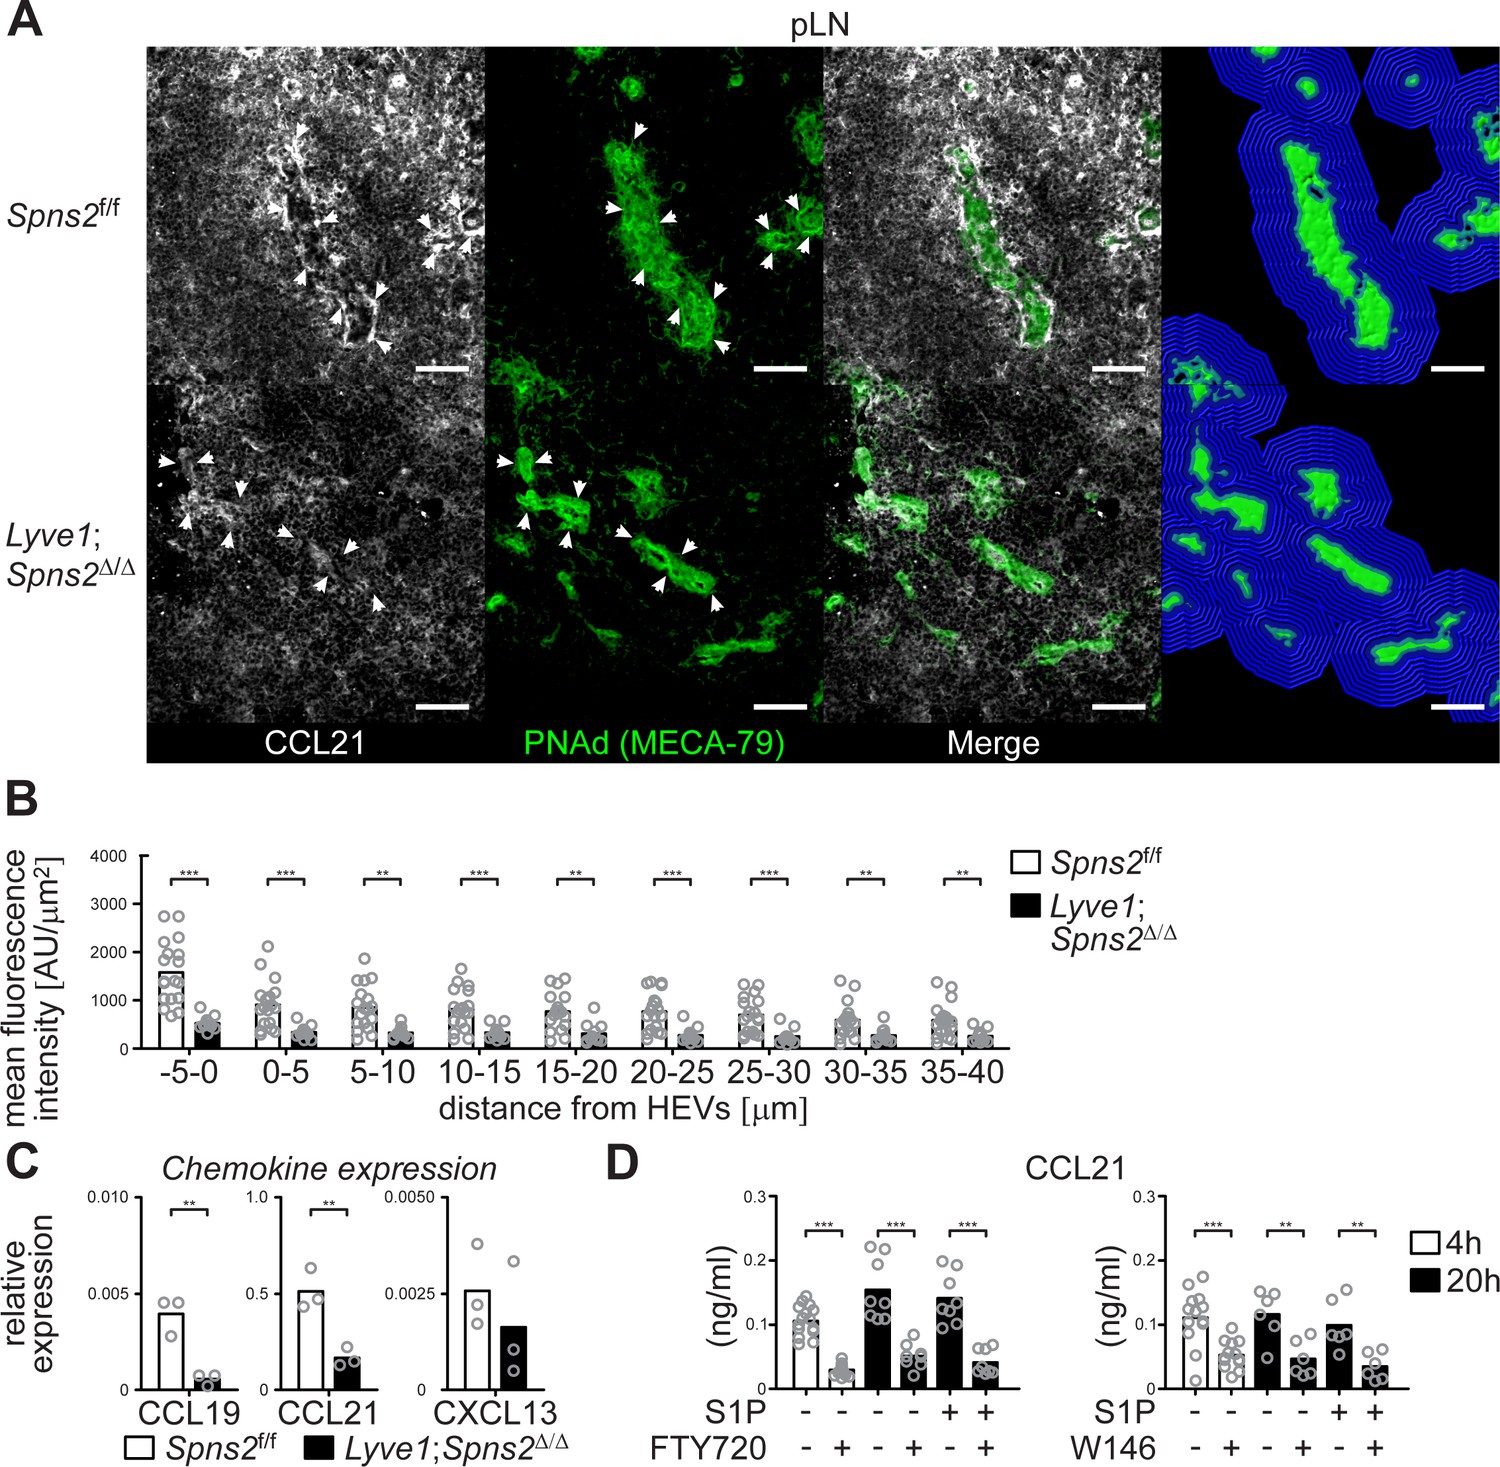
CCL21-production and -release from HEVs is severely impaired in pLNs of Lyve1;Spns2Δ/Δ mice.
(A) The IHC analysis of CCL21 (white) distribution around PNAd+ HEVs, and visualisation of the automated detection of PNAd+ HEVs (green surface) and of the radial areas (blue) around HEVs used for the quantification of the mean fluorescent intensity of the CCL21 signal in pLNs of in Spns2f/f (top) and Lyve1;Spns2Δ/Δ (bottom) mice. (B) The mean fluorescent intensity of the CCL21 signal in distances from −5 μm to 40 μm from the outer border of HEVs (green surface in (C)) determined in 5 μm radial areas around HEVs in pLNs of Spns2f/f and Lyve1;Spns2Δ/Δ mice. (C) qRT-PCR analysis of CCL19, CCL21 and CXCL13 expression levels in total mRNA isolated from CD45-/CD31+/PNAd+ high-endothelial cells sorted from pLNs of Spns2f/f and Lyve1;Spns2Δ/Δ mice. (D) ELISA of the CCL21 levels of the supernatant of high-endothelial cells cultivated with or without 10 μM FTY720 (left) or 10 μM W146 (right) in vitro. Each circle represents the mean fluorescent intensity of the CCL21 signal detected around HEVs in the visual field of a micrograph (B), the relative chemokine expression levels in mRNA extracted from the total CD45-/CD31+/PNAd+ high-endothelial cells (C), or the CCL21 protein levels detected in the supernatant of individual cell cultures (D) of CD45-/CD31+/PNAd+ high-endothelial cells; bars indicate the mean. Scale bars, 50 μm (A). **p<0.005; ***p<0.0005 (two-tailed unpaired Student’s t-test (B–D)). Data are representative for 18x individual sections of 2x analyzed pLNs, iLNs and bLNs per mouse pooled from three mice per group (A, B), three independent mRNA preparations of 2x pLNs, iLNs and bLNs per mouse pooled from five mice per group (C), or three independent stimulations with n = 2 to n = 4 of a total of 8x – 16x (FTY720) or 6x – 12x (W146) individual cell cultures (D) with total sorted high-endothelial cells from 2x pLNs, iLNs and bLNs per mouse pooled from five mice per group in vitro.
Tables
Key resources table
| Reagent type (species) or resource | Designation | Source or reference | Identifiers | Additional information |
|---|---|---|---|---|
| Strain, strain background (Mus musculus) | C57BL/6 (B6) mice | CLEA Japan, Inc, Tokyo | RRID: IMSR_JAX:000664 | |
| Strain, strain background (Mus musculus) | Lyve1CRE mice | Pham et al., 2010 | RRID: IMSR_JAX:012601 | |
| Strain, strain background (Mus musculus) | Spns2f/f mice | Fukuhara et al., 2012 | RRID: MGI:5426399 | |
| Strain, strain background (Mus musculus) | Ai9 mice | Madisen et al., 2010 | RRID: Addgene_22799 | |
| Strain, strain background (Mus musculus) | Cdh5CRE-ERT2 mice | Okabe et al., 2014 | ||
| Strain, strain background (Mus musculus) | S1pr1f/f | Allende et al., 2003 | RRID: MGI:2681963 | . |
| Antibody | rat anti-mouse/human monoclonal PNAd (MECA-79) | Streeter et al., 1988a | [2 µg/ml] | |
| Antibody | rat anti-mouse monoclonal MAdCAM1 (MECA-367) | Streeter et al., 1988b | [2 µg/ml] | |
| Antibody | rat anti-mouse monoclonal CD11a (M17/4) | BioXcell, West Lebanon, NH, USA | RRID: AB_1107582 | [2 µg/ml] |
| Antibody | rat anti-mouse/human monoclonal CD49d (PS/2) | BioXcell, West Lebanon, NH, USA | RRID: AB_1107657 | [2 µg/ml] |
| Antibody | rabbit anti-mouse polyclonal collagen IV antibody (LB-1403) | Cosmo Bio Co., Ltd, Tokyo | [2 µg/ml] | |
| Antibody | rat anti-mouse monoclonal CD4 (RM4-5) | BD Biosciences, San Jose, CA | RRID: AB_393575 | [2 µg/ml] |
| Antibody | rat anti-mouse monoclonal IgA (C10-3) | BD Biosciences, San Jose, CA | RRID: AB_396541 | [2 µg/ml] |
| Antibody | rat anti-mouse monoclonal CCR7 (4B12) | BD Biosciences, San Jose, CA | [2 µg/ml] | |
| Antibody | rat anti-mouse monoclonal CD45 (30-F11) | eBioscience, Inc, San Jose, CA | RRID: AB_10373710 | [2 µg/ml] |
| Antibody | rat anti-mouse monoclonal CD8 (53–6.7) | eBioscience, Inc, San Jose, CA | RRID: AB_11155388 | [2 µg/ml] |
| Antibody | rat anti-mouse monoclonal IgM (II/41) | eBioscience, Inc, San Jose, CA | RRID: AB_467582 | [2 µg/ml] |
| Antibody | rat anti-mouse monoclonal IgD (11-26) | eBioscience, Inc, San Jose, CA | RRID: AB_465346 | [2 µg/ml] |
| Antibody | rat anti-mouse monoclonal CD23 (B3D4) | eBioscience, Inc, San Jose, CA | RRID: AB_466392 | [2 µg/ml] |
| Antibody | rat anti-mouse monoclonal LYVE1 (ALY7) | eBioscience, Inc, San Jose, CA | RRID: AB_1633414 | [2 µg/ml] |
| Antibody | rat anti-mouse monoclonal CD45.1 (A20) | BioLegend, San Diego, CA | RRID: AB_313491 | [2 µg/ml] |
| Antibody | hamster anti-mouse monoclonal CD3 (145–2 C11) | BioLegend, San Diego, CA | RRID: AB_312666 | [2 µg/ml] |
| Antibody | rat anti-mouse/human monoclonal B220 (RA3-6B2) | BioLegend, San Diego, CA | RRID: AB_312986 | [2 µg/ml] |
| Antibody | rat anti-mouse monoclonal CD21/35 (7E9) | BioLegend, San Diego, CA | RRID: AB_940411 | [2 µg/ml] |
| Antibody | rat anti-mouse monoclonal I-A/I-E (M5/114.15.2) | BioLegend, San Diego, CA | RRID: AB_313316 | [2 µg/ml] |
| Antibody | hamster anti-mouse monoclonal cD11c (N418) | BioLegend, San Diego, CA | RRID: AB_313770 | [2 µg/ml] |
| Antibody | rat anti-mouse monoclonal ERTR7 | Santa Cruz Biotechnology, Inc, Dallas, TX | [2 µg/ml] | |
| Antibody | rabbit anti-mouse polyclonal EDG-1 (H-60) | Santa Cruz Biotechnology, Inc, Dallas, TX | RRID: AB_2184743 | [2 µg/ml] |
| Antibody | rabbit anti-mouse polyclonal pAkt (Ser473) | Cell Signaling Technology, Danvers, MA | RRID: AB_329825 | [2 µg/ml] |
| Peptide, recombinant protein | rabbit IgG isotype control | Cell Signaling Technology, Danvers, MA | RRID: AB_1550038 | [2 µg/ml] |
| Antibody | rat anti-mouse monoclonal CD16/CD32 | BioLegend, San Diego, CA | RRID: AB_312800 | [2 µg/ml] |
| Antibody | rat anti-mouse monoclonal LTβr (5G11) | BioLegend, San Diego, CA | RRID: AB_1659177 | [2 µg/ml] |
| Antibody | goat anti-mouse polyclonal CCL21 (AF457) | R and D Systems Inc, Minneapolis, MN | RRID: AB_2072083 | [2 µg/ml] |
| Peptide, recombinant protein | recombinant human LTα1/β2 protein | R and D Systems Inc, Minneapolis, MN | ||
| Chemical compound, drug | CellTracker Orange CMTMR | Life Technologies/GIBCO | ||
| Chemical compound, drug | S1PR-antagonist FTY720 | Cayman Chemical, Ann Arbor, MI | ||
| Chemical compound, drug | S1PR1-antagonist W146 | Cayman Chemical, Ann Arbor, MI | ||
| Chemical compound, drug | S1PR3-antagonist TY52156 | Tocris Bioscience, Bristol | ||
| Other | ALZET Osmotic Pumps 1003D | DURECT Corp., Cupertino, CA | ||
| Software, algorithm | IMARIS software version 8.2 | Bitplane AG, Zurich | RRID: SCR_007370 |
Additional files
-
Transparent reporting form
- https://doi.org/10.7554/eLife.41239.015
Download links
A two-part list of links to download the article, or parts of the article, in various formats.
Downloads (link to download the article as PDF)
Open citations (links to open the citations from this article in various online reference manager services)
Cite this article (links to download the citations from this article in formats compatible with various reference manager tools)
High-endothelial cell-derived S1P regulates dendritic cell localization and vascular integrity in the lymph node
eLife 8:e41239.
https://doi.org/10.7554/eLife.41239


