The spatial separation of processing and transport functions to the interior and periphery of the Golgi stack
- Nanyang Technological University, Singapore
Figures
Figure 1 with 2 supplements
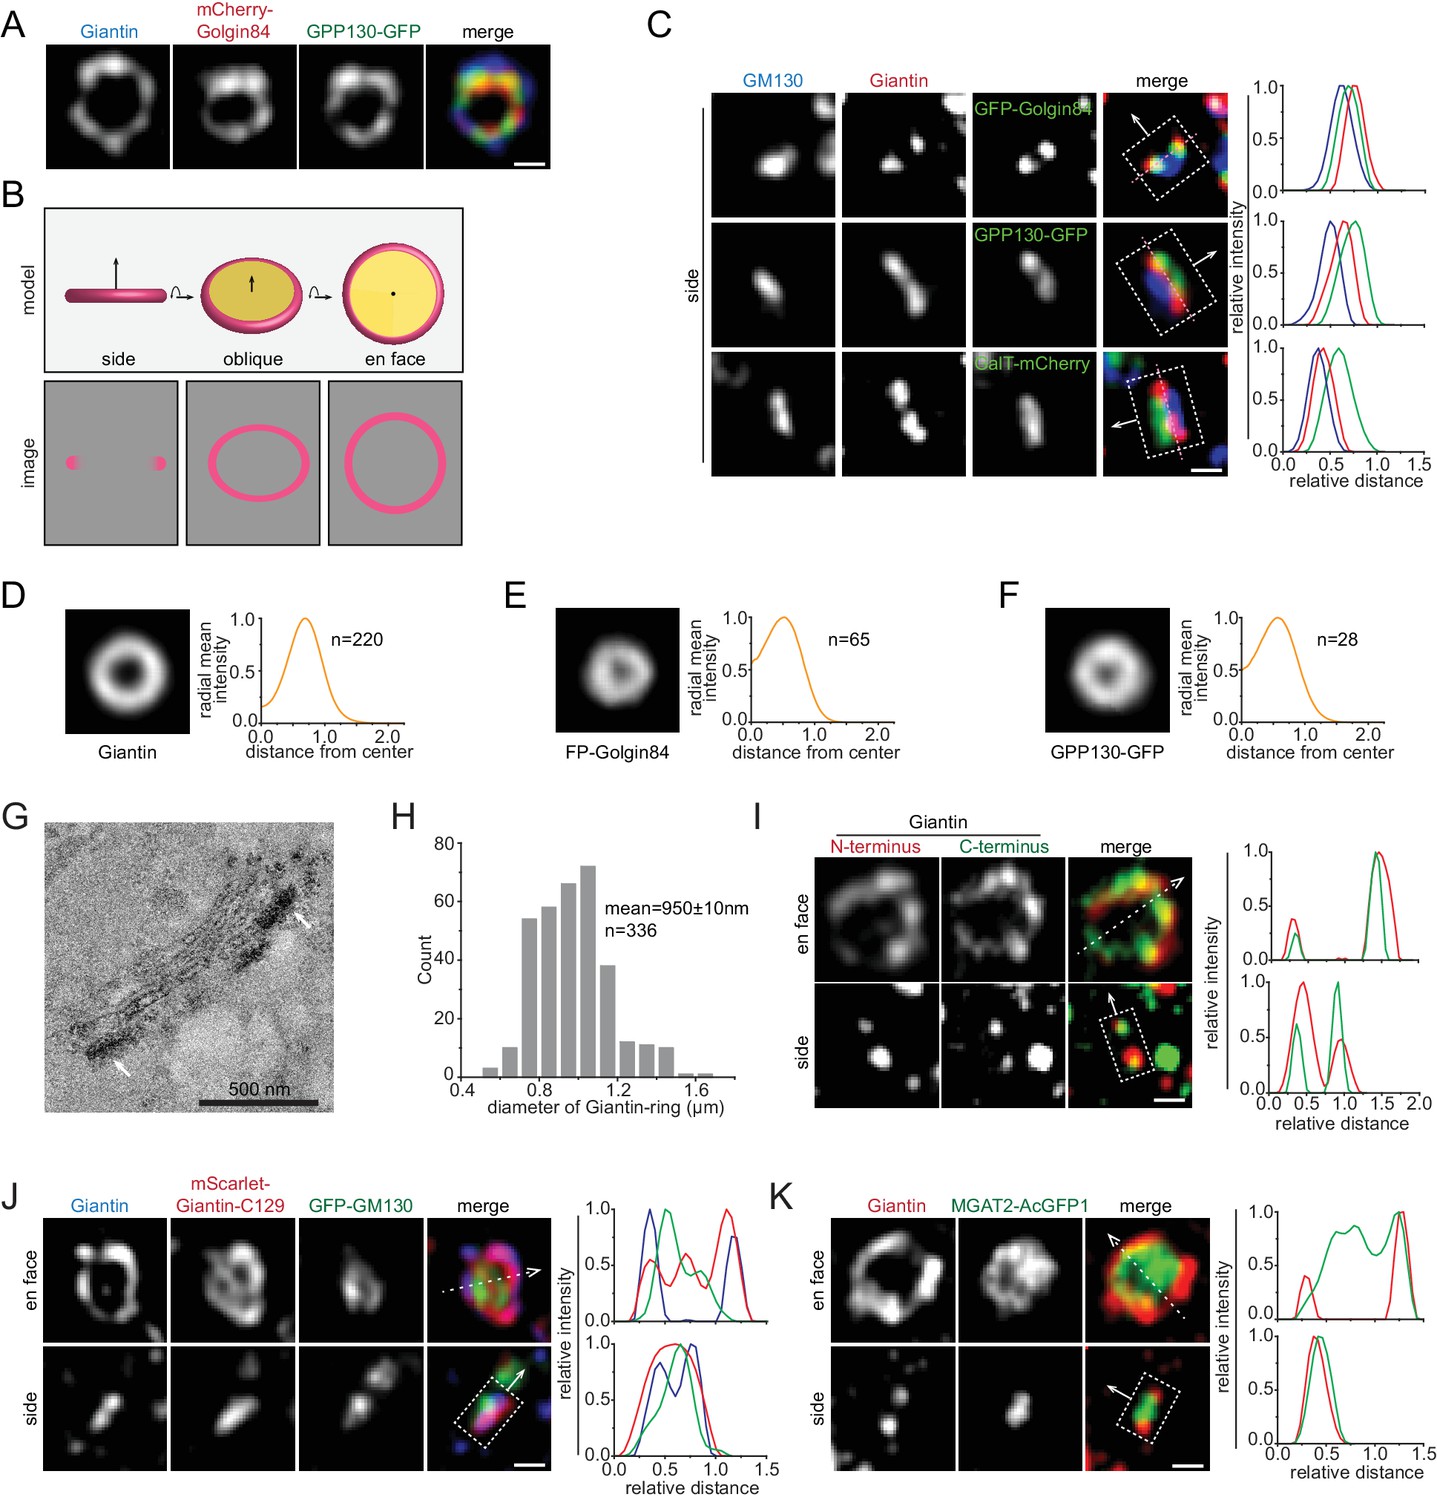
Identifying the en face and side view of the Golgi mini-stack.
All cells are nocodazole-treated HeLa cells and all images are super-resolution images unless specified otherwise. By default, tagged-proteins were transiently transfected while non-tagged proteins were native and stained by their antibodies. (A) The staining patterns of Giantin, Golgin84 and GPP130 appear as concentric rings. (B) The schematic representation of different orientation views (en face, oblique and side) of a Golgi cisterna and the corresponding expected images of a rim-localized protein (colored as pink). (C) The double-punctum appearances of Giantin, Golgin84 and GPP130 indicate side views of Golgi mini-stacks. In each merge, the intensity profile is generated along a thick line, represented by a dotted box, with the direction indicated by the arrow (the same scheme is used throughout this study). The dotted box schematically marked the start, end and width of the line. The direction arrow roughly follows the cis-to-trans Golgi axis using the cis-most (GM130 in this case) and trans-most markers in each panel. Dotted pink lines connecting double-punctum are almost orthogonal to the cis-to-trans Golgi axis. The intensity plot is normalized and color-coded as the corresponding merge image. (D–F) En face averaged images of Giantin, fluorescence protein (FP)-Golgin84 and GPP130-GFP. The corresponding radial mean intensity profile is shown at the right with distance from the center of fluorescence mass (normalized to the radius of Giantin) as the x-axis and radial mean intensity (normalized) as the y-axis. Both GFP and mCherry-tagged Golgin84 images were used for FP-Golgin84. n, the number of averaged Golgi mini-stacks. (G) GPP130 mostly localizes to the cisternal rim (arrows) of the native Golgi by EM. NRK cells transiently expressing GPP130-APEX2-GFP were subjected to APEX2-catalyzed reaction followed by EM. Note that cells were not subjected to nocodazole treatment. The EM thin section image displays the side view of a Golgi mini-stack. The electron density indicates the localization of GPP130 (arrows). (H) The histogram showing the distribution of diameters of Giantin-rings. (I, J) Giantin N and C-terminus colocalize at the cisternal rim. In (I), cells were co-stained using Giantin antibodies raised against its N and C-terminus. In (J), Giantin N-terminus was stained by an antibody and its C-terminus was revealed by exogenously expressed mScarlet-Giantin-C129. In the en face view, dotted arrow represents the line used to generate the line intensity profile (width = 1 pixel), while in the side view, the dotted box that is in the direction of the arrow and parallel to the Golgi cisterna represents the line for intensity profile. (K) The interior localization of MGAT2 within the Giantin-ring. Line intensity profiles of the en face and side views are acquired as those in (I) and (C) respectively. Scale bar, 500 nm.
Figure 1—figure supplement 1
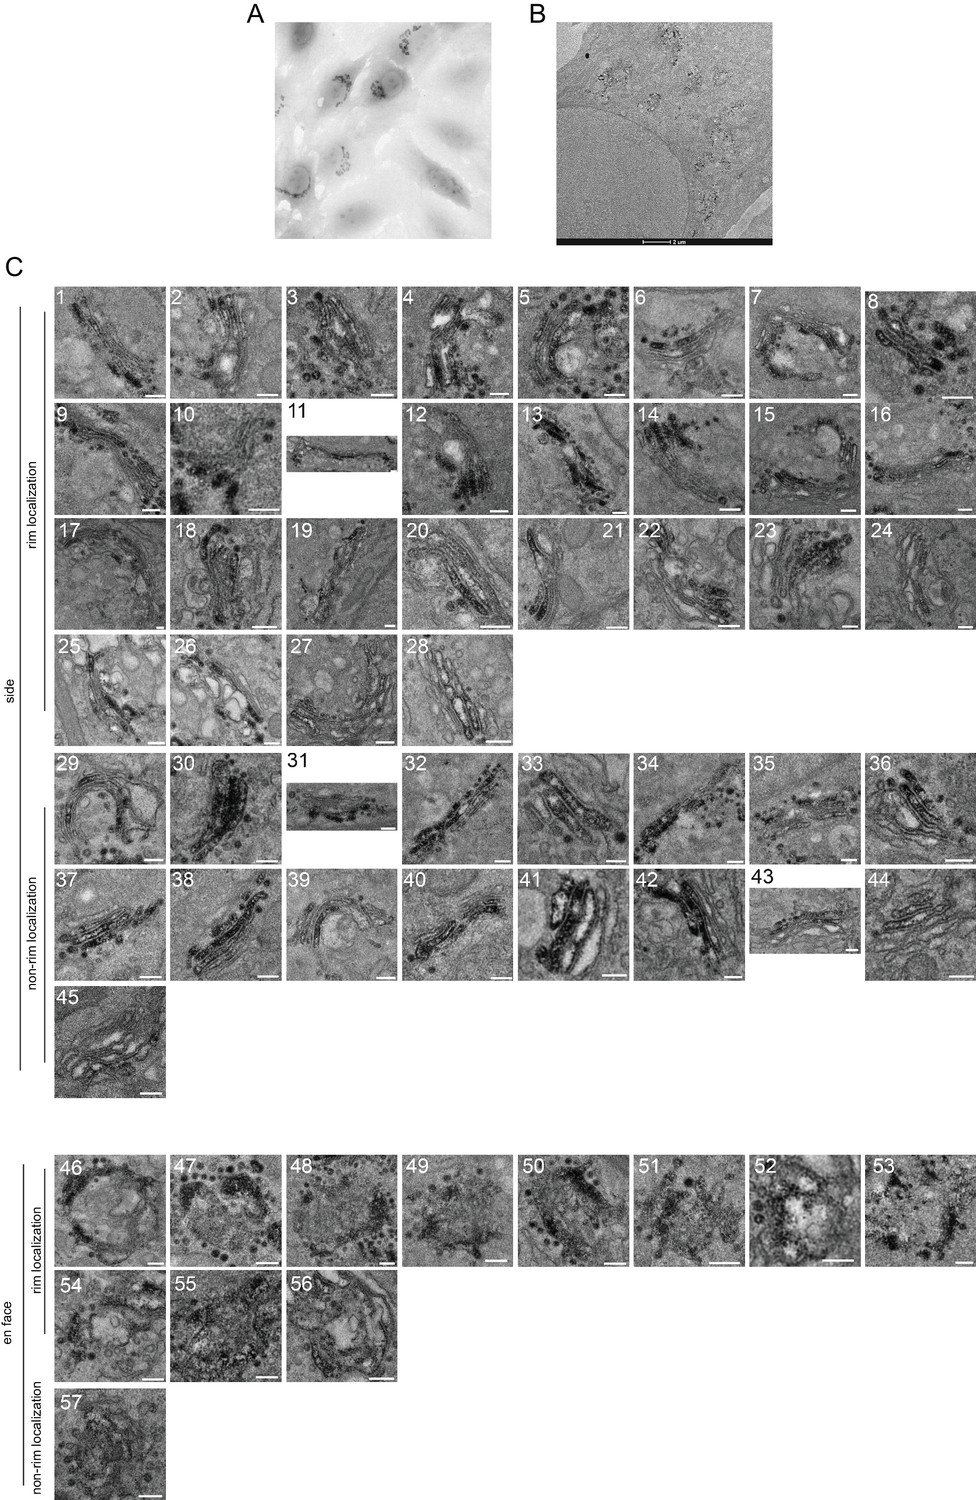
GPP130 displays rim-localization in a majority of native Golgi stacks by EM.
(A) Transmitted light image of NRK cells expressing GPP130-APEX2-GFP after APEX2-catalyzed labeling reaction and plastic embedding. (B) Representative overview EM image of a cell expressing GPP130-APEX2-GFP. Scale bar, 2 µm. (C) Categorization of GPP130-APEX2-GFP distribution patterns. The experiment is the same as in Figure 1G. 57 GPP130-APEX2 positive Golgi stacks from 25 cells were imaged. Side and en face views of Golgi stacks are further categorized as rim and non-rim-localization according to their APEX2 staining patterns. Scale bar, 200 nm.
Figure 1—figure supplement 2
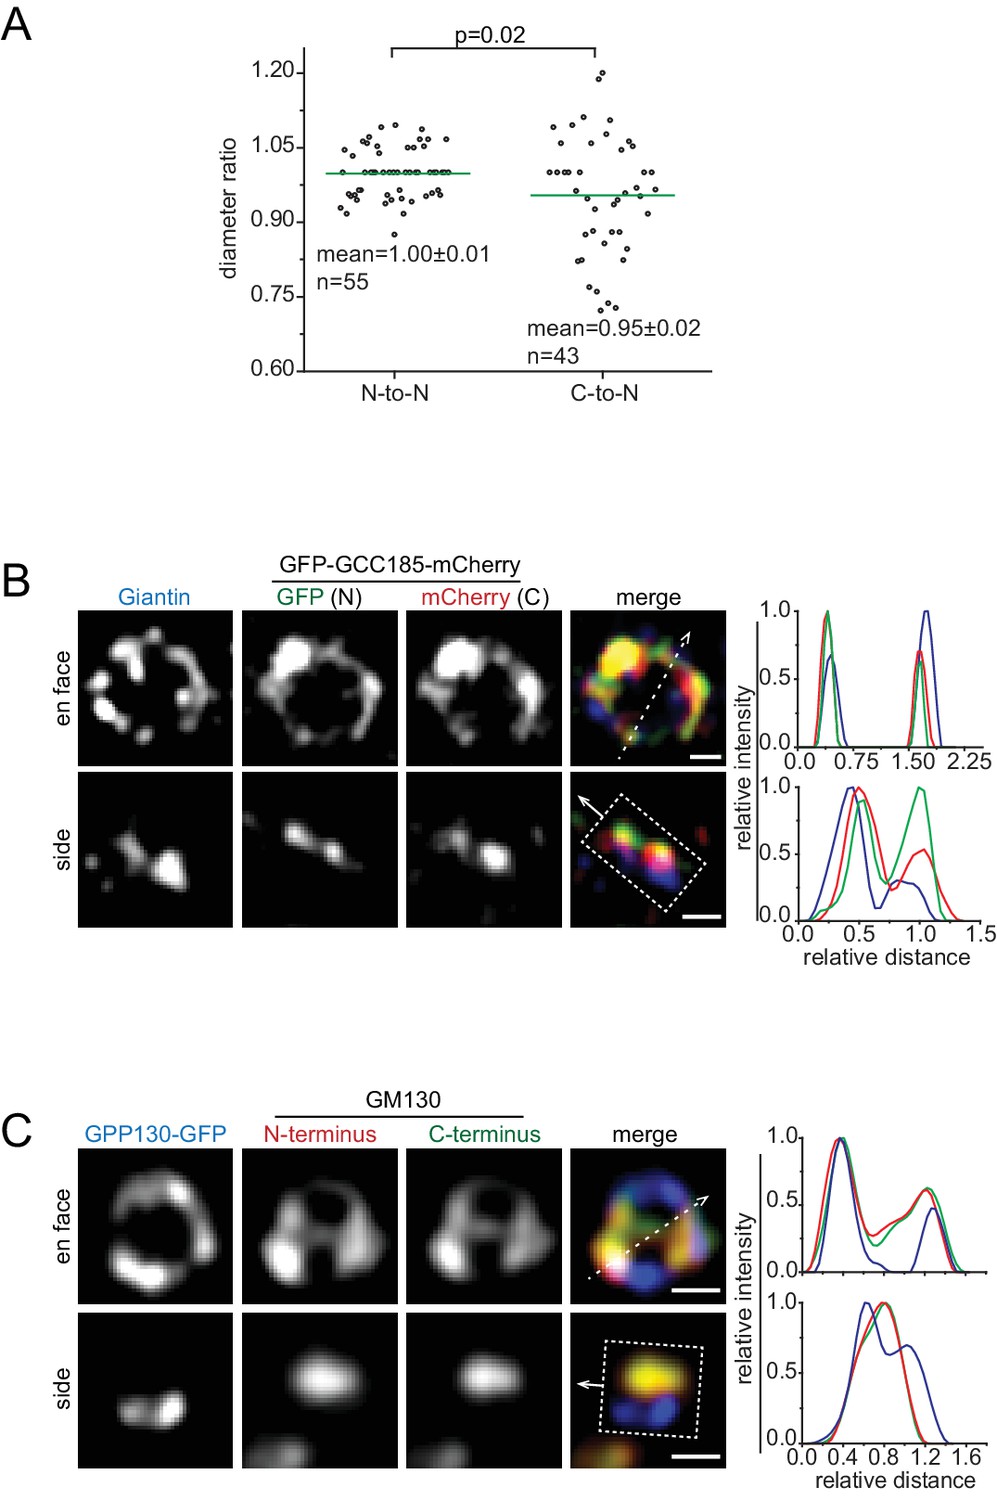
The N and C-terminus of Giantin, GCC185 and GM130 coincide on the Golgi mini-stack.
(A) The ratio of the ring diameter of Giantin N (N–to–N) and C-antibody (C–to–N) to that of N-antibody. In N-to-N, cells were stained by Giantin N-terminus antibody with both Alexa Fluor 488 and 647. In C-to-N, cells were stained by Giantin N and C-terminus antibody conjugated with Alexa Fluor 647 and 488, respectively. Two diameters were measured from Alexa Fluor 488 and 647 channels by line intensity profiles for each Golgi mini-stack and ratios were calculated and plotted. Green line represents the mean. P-value is from t-test. (B) The N and C-terminus of GCC185 are indicated by GFP and mCherry tag, respectively. (C) The N and C-terminus of GM130 are labeled by corresponding antibodies. The intensity profile is acquired as in Figure 1I. Scale bar, 500 nm.
Figure 2 with 1 supplement
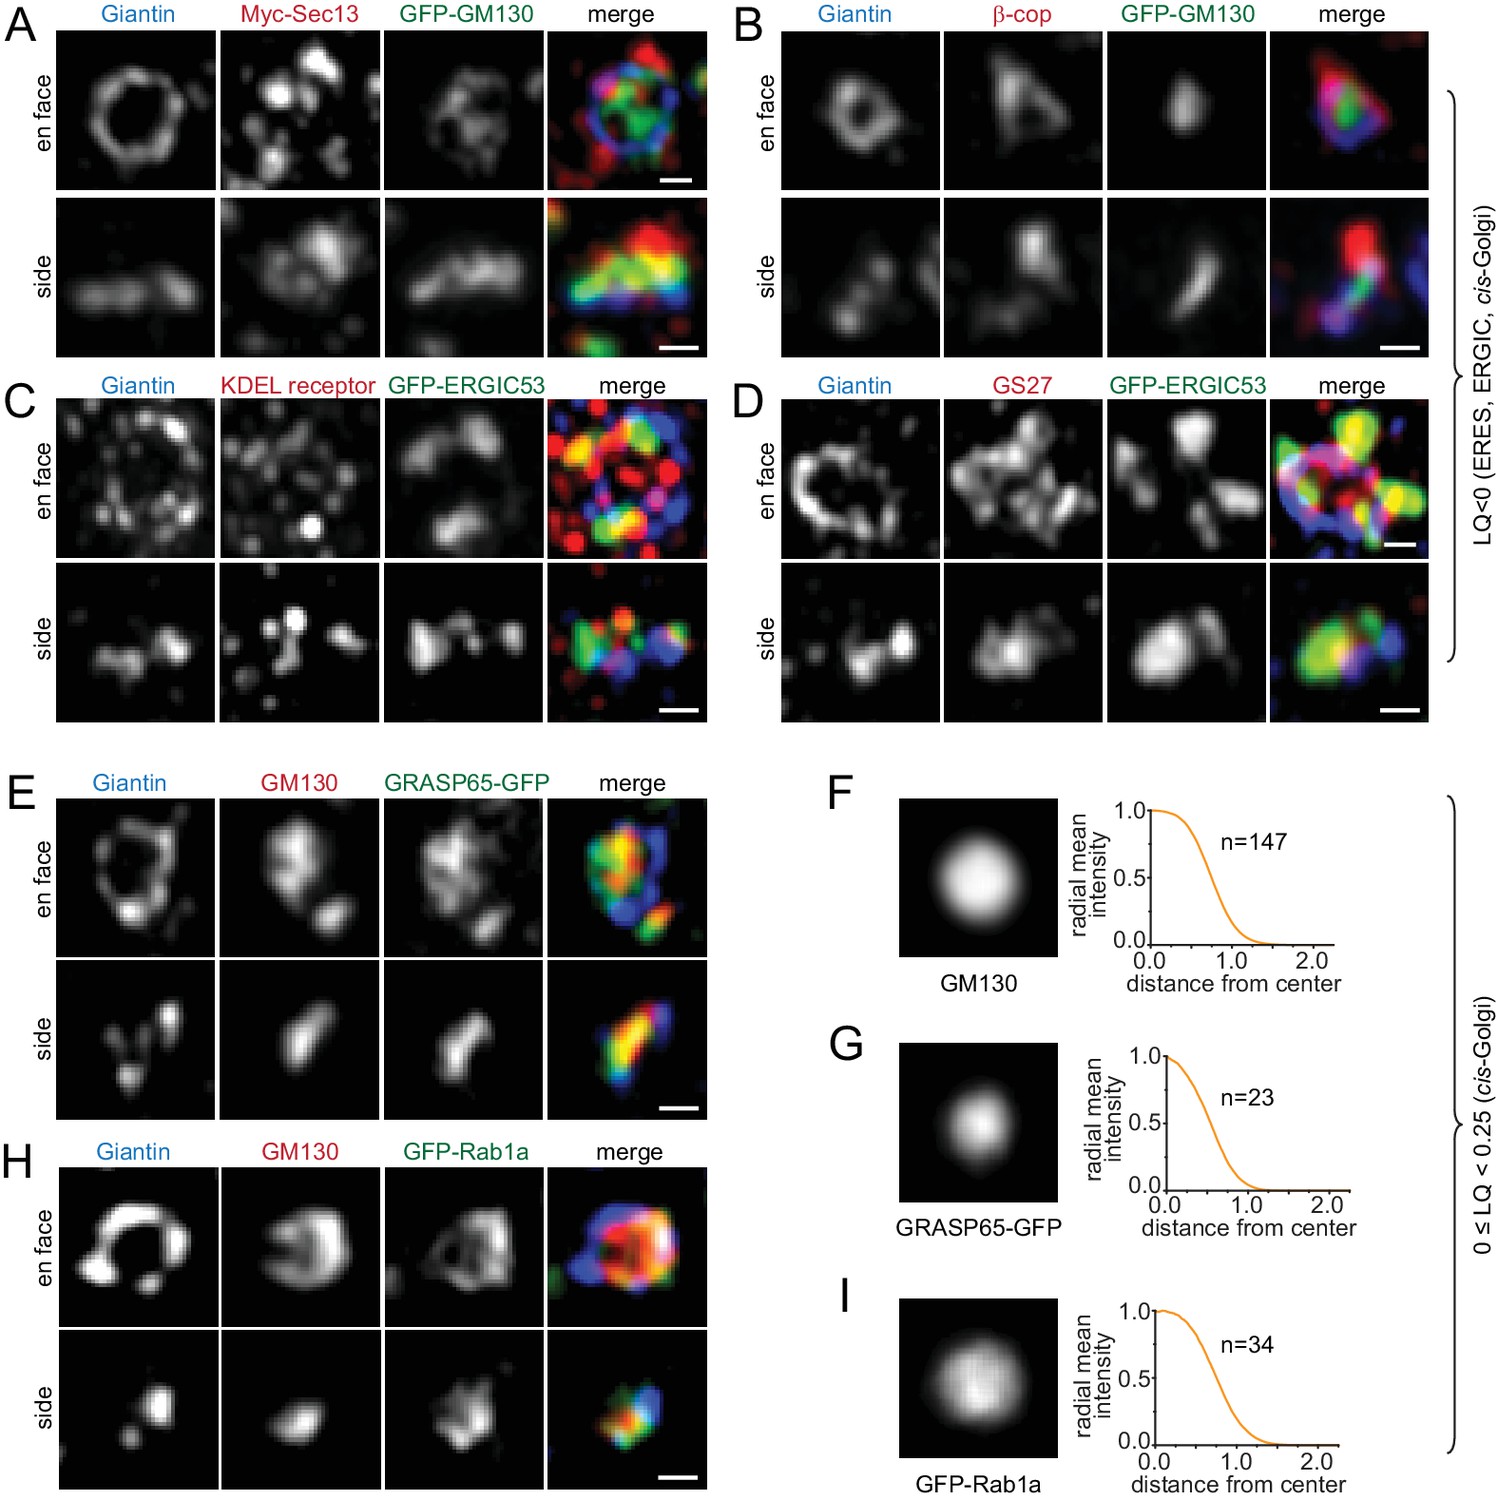
Components of the ERES, ERGIC and cis-Golgi transport machinery mainly localize to the periphery of the Golgi mini-stack.
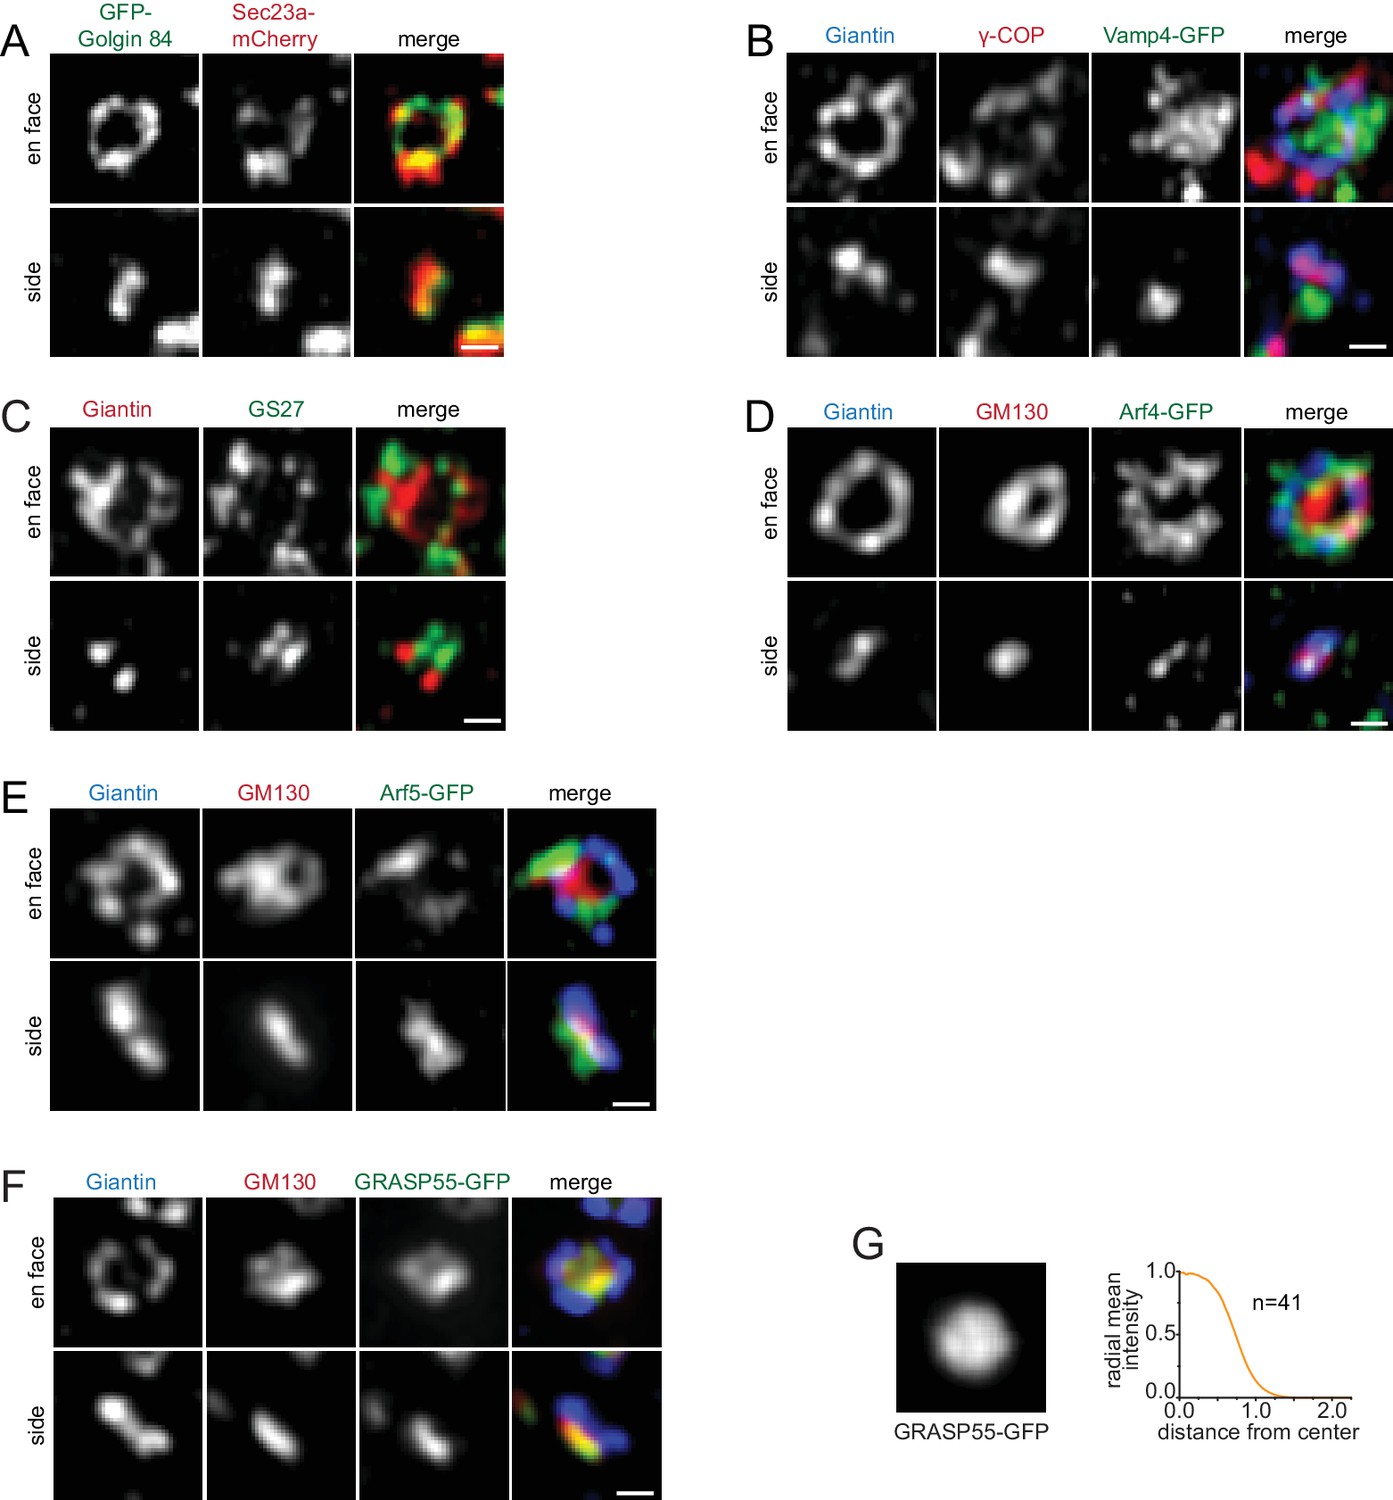
(A–D, E and H) Typical en face and side view images of Golgi transport machinery components. (A–D) ERES, ERGIC and cis-Golgi proteins (LQ <0). (E and H) cis-Golgi proteins (0 ≤ LQ < 0.25). (F–I) En face averaged images and radial mean intensity profiles corresponding to (E) and (H). n, the number of averaged Golgi mini-stack images. Scale bar, 500 nm.
Figure 2—figure supplement 1
Typical en face and side view images of Golgi transport machinery components.
(A–E) ERES, ERGIC and cis-Golgi proteins (LQ <0). (F) GRASP55-GFP, a cis-Golgi protein (0 ≤ LQ < 0.25). (G) En face averaged image of GRASP55-GFP and the corresponding radial mean intensity profile. n, the number of averaged Golgi mini-stack images. Scale bar, 500 nm.
Figure 3 with 2 supplements
Components of the medial, trans-Golgi and TGN transport machinery mainly localize to the periphery of the Golgi mini-stack.
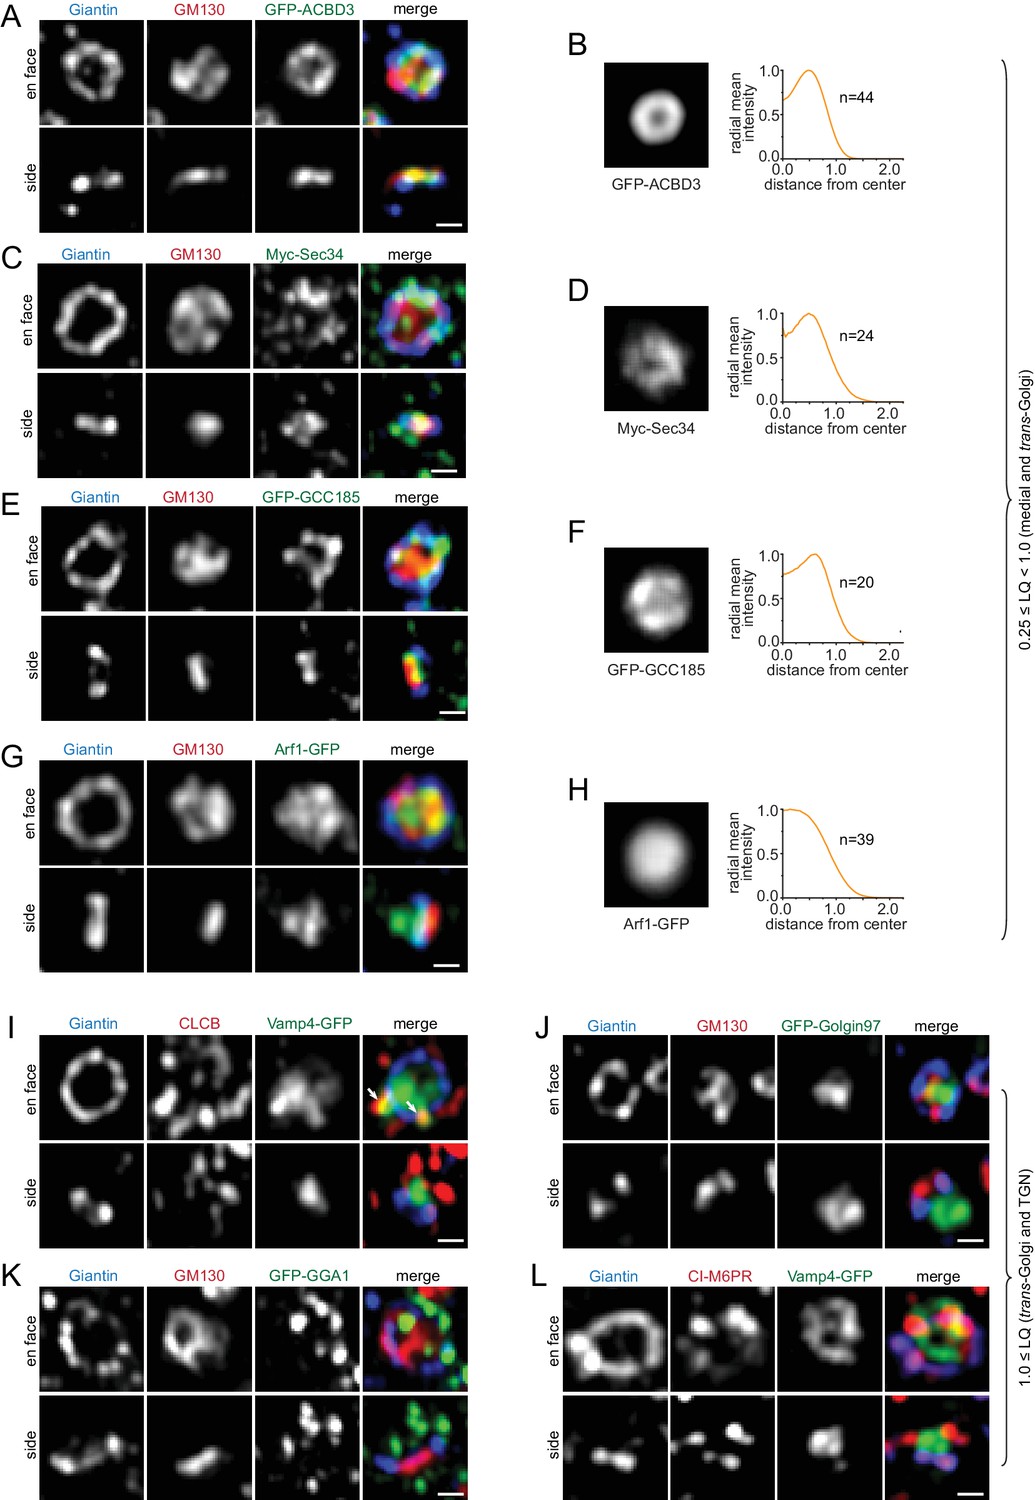
(A–H) Medial and trans-Golgi proteins (0.25 ≤ LQ < 1.0), except Arf1, localize to the cisternal rim. En face and side view images are shown. Corresponding en face averaged images and radial mean intensity profiles are shown in (B, D, F and H). n, the number of averaged Golgi mini-stack images. (I–L) trans-Golgi and TGN proteins (LQ ≥1.0) appear compact or scattered at one end of the mini-stack. Arrows in (I) indicate colocalization between CLCB and Vamp4-GFP. Scale bar, 500 nm.
Figure 3—figure supplement 1
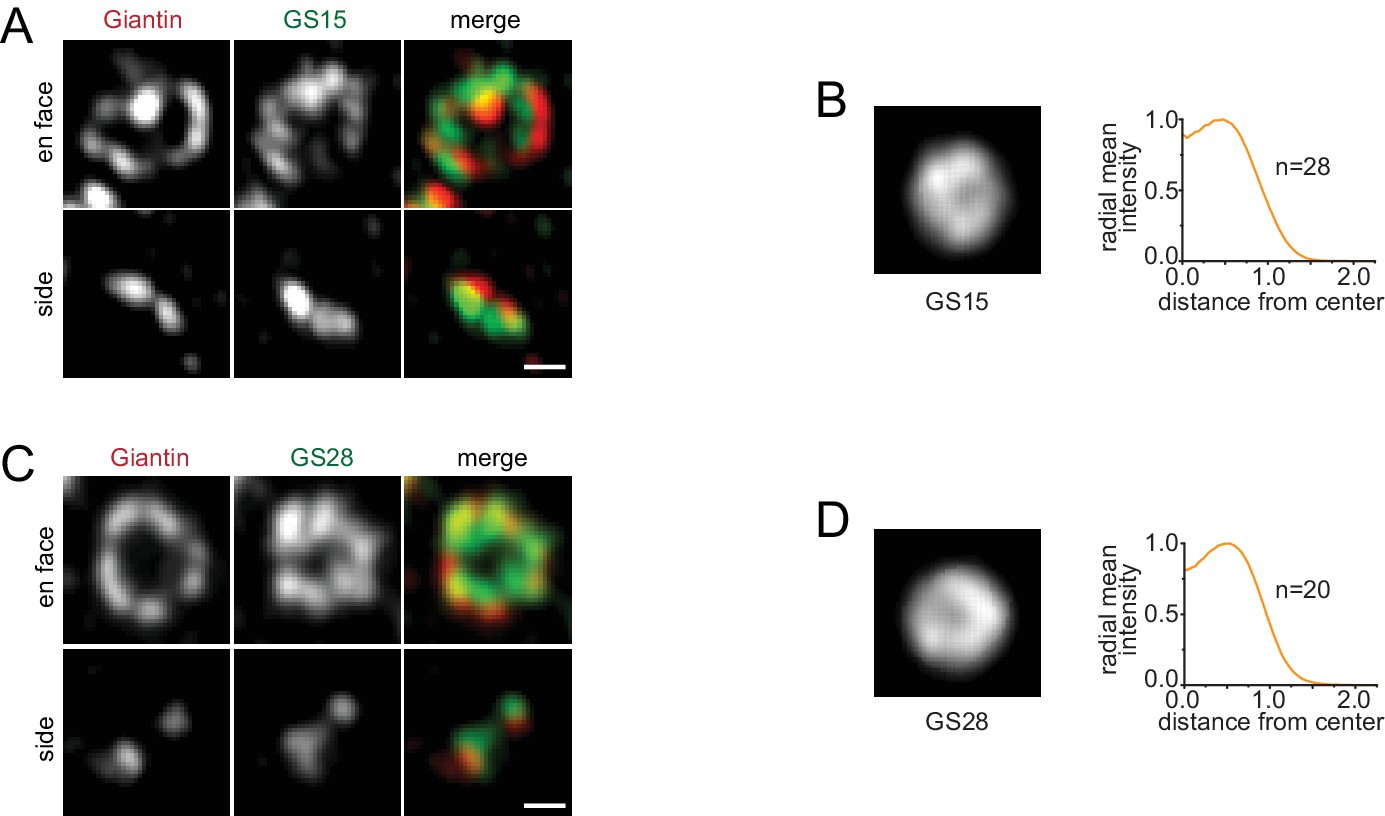
En face and side view images of the medial and trans-Golgi SNAREs, including GS15 and GS28, showed their rim localization (A and C).
(B and D) Corresponding en face averaged images and radial mean intensity profiles. n, the number of averaged mini-stack images. Scale bar, 500 nm.
Figure 3—figure supplement 2

The lateral localization of components of the trans-Golgi and TGN transport machinery in the Golgi mini-stack.
(A, C and E–M) En face and side view images of trans-Golgi and TGN transport machinery components (LQ ≥1.0). (B and D) En face averaged images and radial mean intensity profiles corresponding to (A) and (C). n, the number of averaged mini-stack images. Arrows in (H) indicate colocalization between CLCB and Furin-GFP. Scale bar, 500 nm.
Figure 4 with 3 supplements

Golgi enzymes primarily localize to the interior of medial and trans-Golgi cisternae.
(A, C and E) En face view images of Golgi enzymes. Side view images are also shown in (A) and (C). Dotted arrows and boxes and line intensity profiles are used or acquired as in Figure 1K. (B, D and F) Corresponding en face averaged images and radial mean intensity profiles. n, the number of averaged Golgi mini-stack images. (G) The merge of en face averaged images of Giantin, MGAT4B and MGAT2 and the corresponding radial mean intensity profile. n, the number of averaged Golgi mini-stack images. (H) β4GalT3 and ST6Gal1 can localize to shared (arrows) and distinct domains within the cisternal interior. (I) MGAT2 localizes to the cisternal interior of the native Golgi by EM. NRK cells transiently expressing MGAT2-APEX2-GFP were subjected to APEX2-catalyzed reaction followed by EM. Note that cells were not subjected to nocodazole treatment. The thin section EM image displays the side view of a Golgi stack. MGAT2-APEX2 positive cisternal interior and budding profiles are indicated by arrows and arrow heads, respectively. (J) A quantitative molecular map of the Golgi mini-stack. The normalized radius of a Golgi protein is plotted against its corresponding LQ (Table 1). Red open and closed circle denote ring and disk lateral localization pattern, respectively. n, the number of Golgi mini-stacks used to calculate normalized radius. (K,L) Identifying the rim and interior of native Golgi cisternae. Cells were not treated with nocodazole. In (K), the cisternal rim (arrows) and interior are labeled by Giantin and β4GalT3, respectively. In (L), Giantin and GPP130 positive curvy lines (arrows) represent cisternal rim and do not correspond to side views or cross sections of Golgi stacks. The boxed region in each image is enlarged in the upper right corner. Scale bars represent 500 nm unless specified otherwise.
Figure 4—figure supplement 1
Golgi enzymes that primarily display central disk localization at the interior of medial and trans-Golgi cisternae.
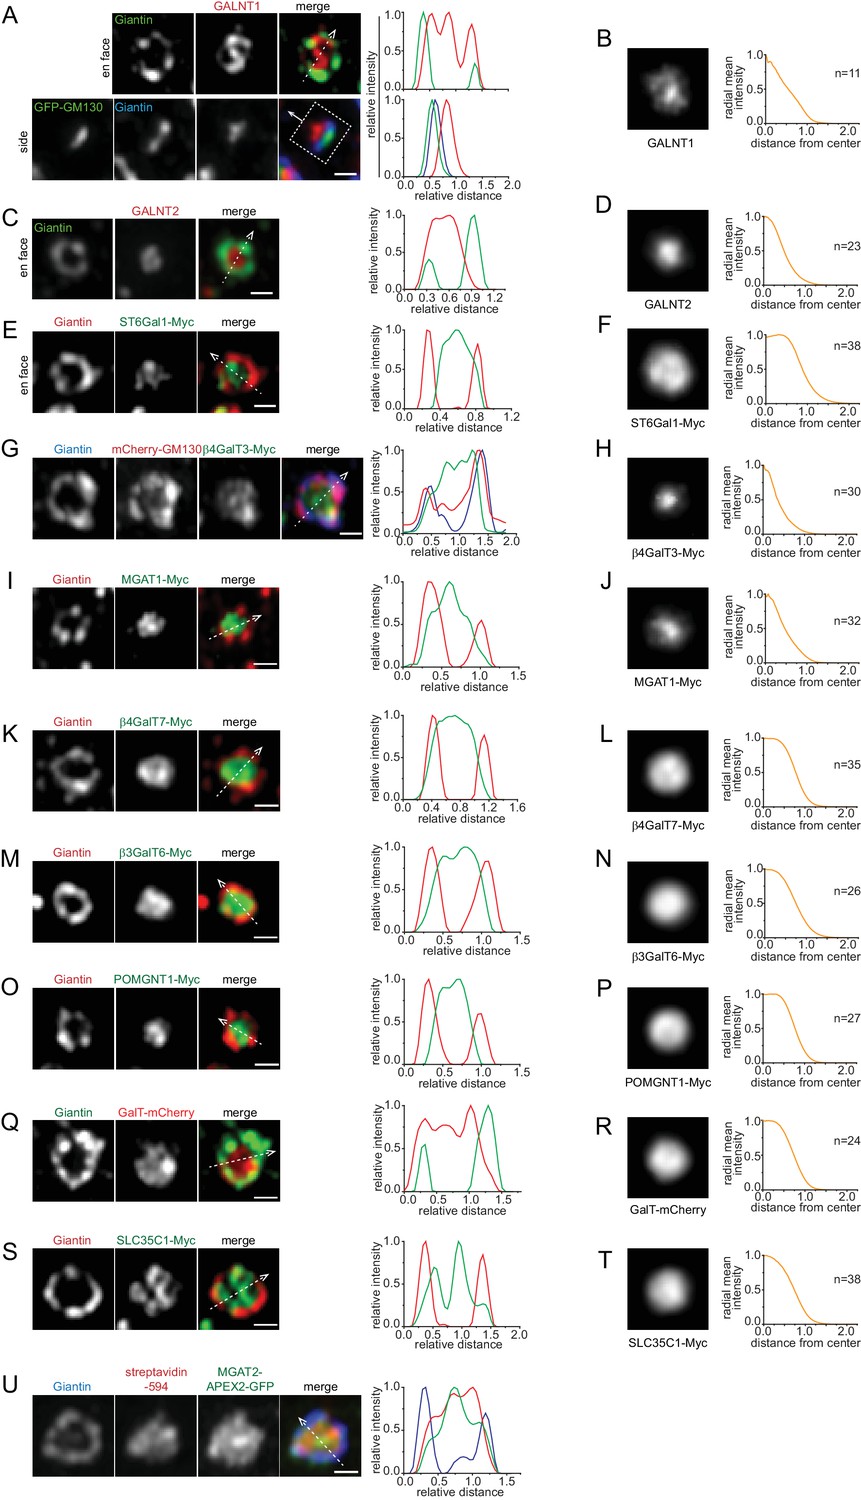
(A, C, E, G, I, K, M, O, Q and S) En face view images of Golgi enzymes and SLC35C1. Side view images are also shown in (A). Dotted arrows and boxes and line intensity profiles are used or acquired as in Figure 1K. (B, D, F, H, J, L, N, P, R and T) Corresponding en face averaged images and radial mean intensity profiles. n, the number of averaged mini-stack images. (U) MGAT2-APEX2 biotinylated proteins mainly localize to the cisternal interior. Cells expressing MGAT2-APEX2-GFP were subjected to APEX2-catalyzed reaction to biotinylate its neighboring proteins. The biotinylated proteins were detected by Alexa Fluor 594 conjugated streptavidin (streptavidin-594). The line intensity profile is generated as in Figure 1K. Scale bar, 500 nm.
Figure 4—figure supplement 2
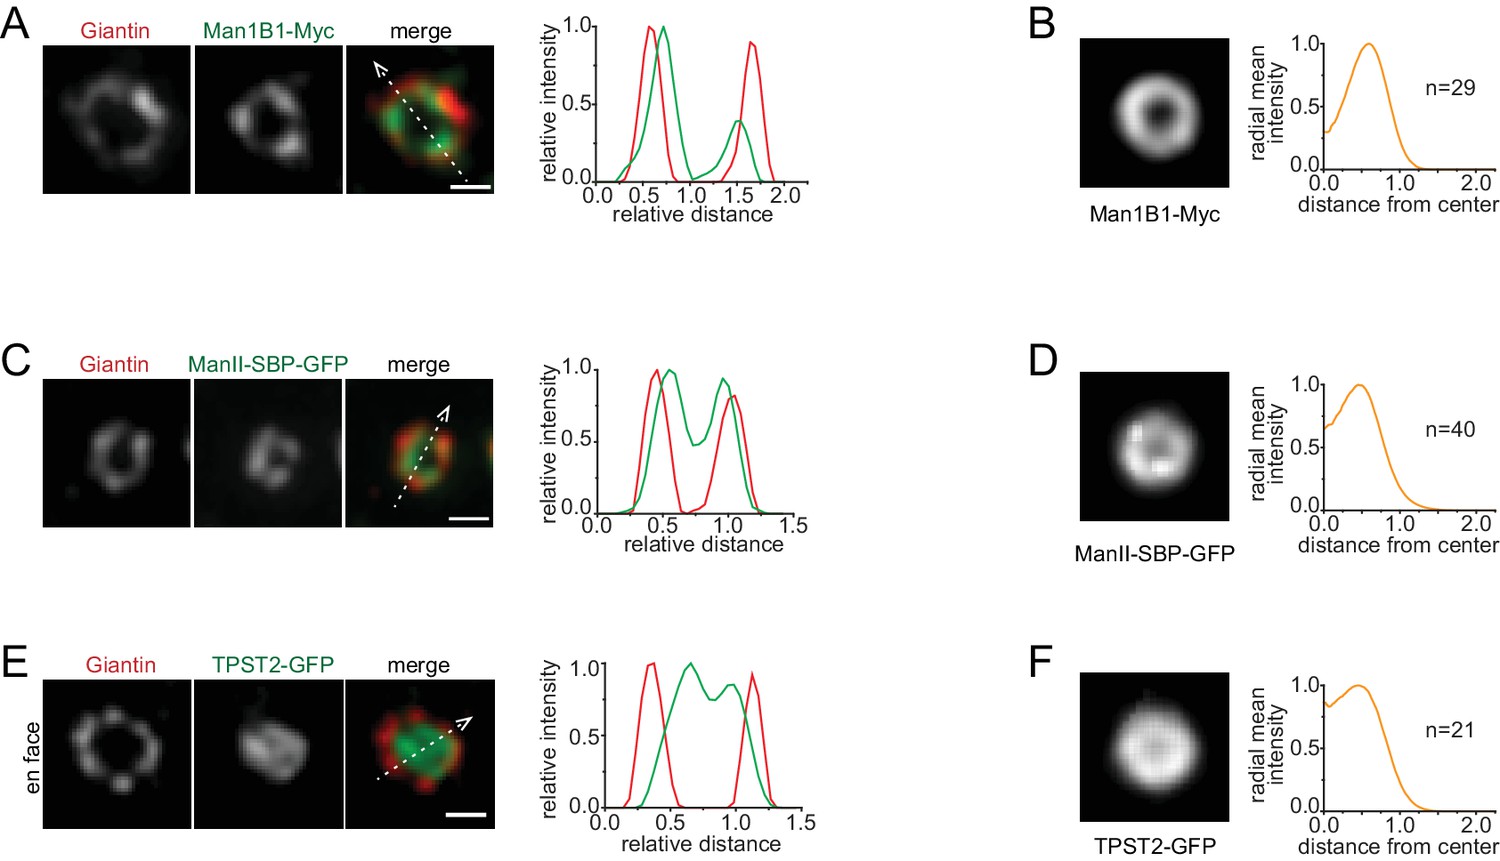
Golgi enzymes, Man1B1, ManII and TPST2, display ring-pattern localization.
(A, C and E) En face view images. (B, D and F) Corresponding en face averaged images and radial mean intensity profiles. n, the number of averaged mini-stack images. The line intensity profile is generated as in Figure 1K. Scale bar, 500 nm.
Figure 4—figure supplement 3
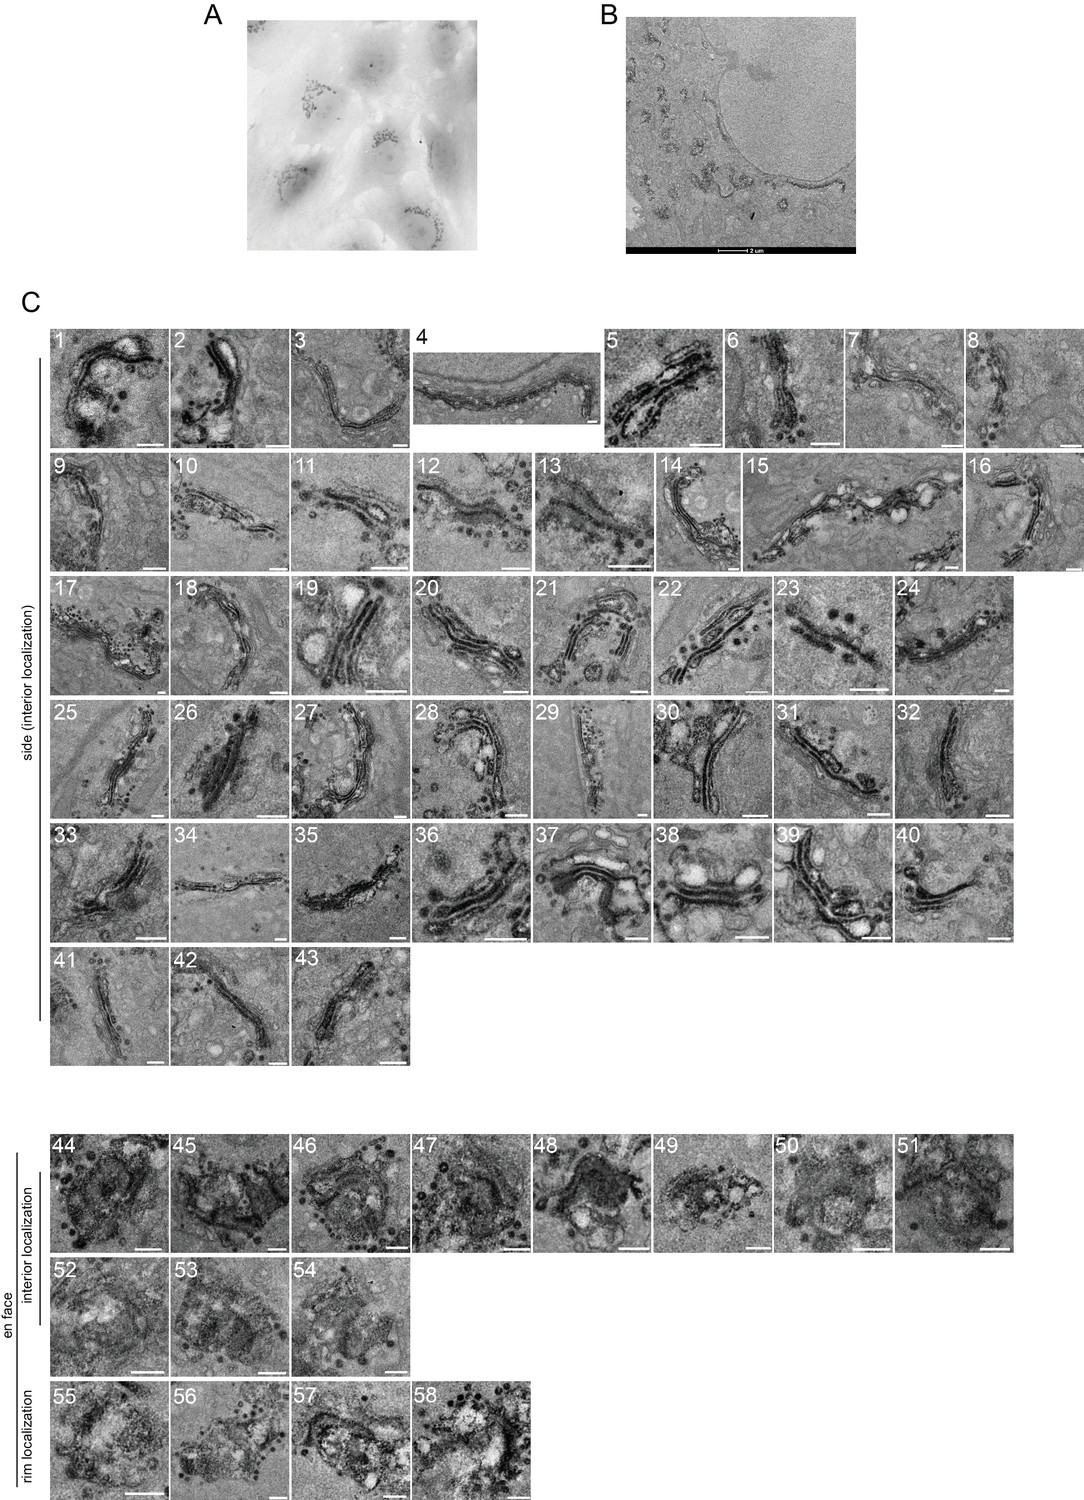
MGAT2 mainly localizes to the cisternal interior in native Golgi stacks by EM.
(A) Transmitted light image of NRK cells expressing MGAT2-APEX2-GFP after APEX2-catalyzed labeling reaction and plastic embedding. (B) Representative overview EM image of a cell expressing MGAT2-APEX2-GFP. Scale bar, 2 µm. (C) Categorization of MGAT2-APEX2-GFP distribution patterns. The experiment is the same as in Figure 4I. 58 MGAT2-APEX2 positive Golgi stacks from 14 cells were imaged. Side and en face views of Golgi stacks are further categorized as interior and rim-localization according to their APEX2 staining patterns. Scale bar, 200 nm.
Figure 5 with 4 supplements
Conventional or small size secretory cargos can localize to the cisternal interior while bulky ones are restricted to the rim during their intra-Golgi transport.
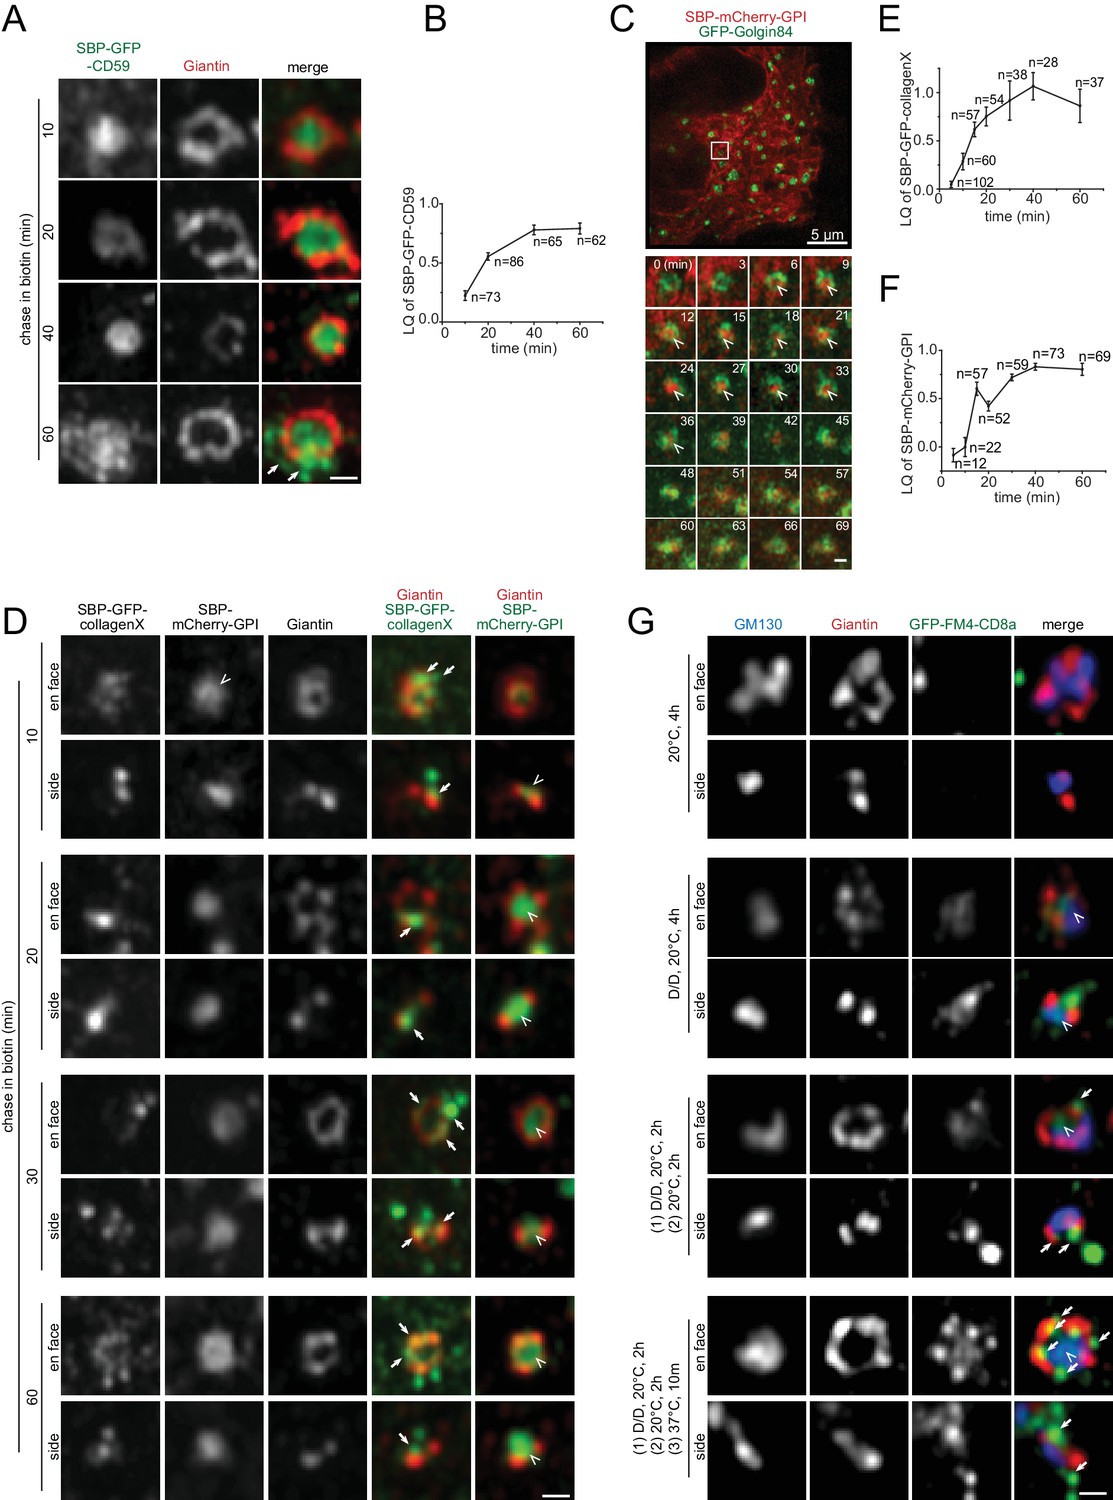
(A,B) CD59 localizes to the cisternal interior during its intra-Golgi transport. Cells transiently expressing RUSH reporter, SBP-GFP-CD59, were chased in the presence of biotin for indicated time (A). Arrows indicate budding membrane carriers. In (B), the LQ vs time plot measured from the same experiment demonstrated the intra-Golgi transport of CD59. (C) Live-cell imaging showing the interior localization of mCherry-GPI during its transition through the Golgi mini-stack. Cells transiently co-expressing RUSH reporter, SBP-mCherry-GPI, and GFP-Golgin84 were chased in biotin and imaged live under Airyscan super-resolution microscopy. The boxed region in the upper image, which was acquired before the chase, is selected to show the time series. Arrow heads indicate the interior localization. See also Figure 5—video 1. (D–F) The partition of collagenX and mCherry-GPI to the cisternal rim and interior respectively during their intra-Golgi transport. Cells transiently co-expressing RUSH cargos, SBP-GFP-collagenX and SBP-mCherry-GPI were chased as in (A). Arrows and arrow heads indicate the cisternal rim and interior localization respectively. The intra-Golgi transport of collagenX and mCherry-GPI was demonstrated by LQ vs time plots measured from the same experiments in (E) and (F). Error bar, mean ± SEM. n, the number of Golgi mini-stacks used for the calculation. (G) GFP-FM4-CD8a partitions to the cisternal rim upon aggregation. NRK cells transiently expressing GFP-FM4-CD8a were subjected to a combination of D/D solubilizer treatment and wash out at either 20°C or 37°C, as indicated. First set of images is the negative control showing that aggregated GFP-FM4-CD8a was not exported from the ER. Aggregated GFP-FM4-CD8a partitioned to the rim (arrows), while non-aggregated form was still interior-localized (arrow heads). Scale bars represent 500 nm unless specified otherwise.
Figure 5—figure supplement 1
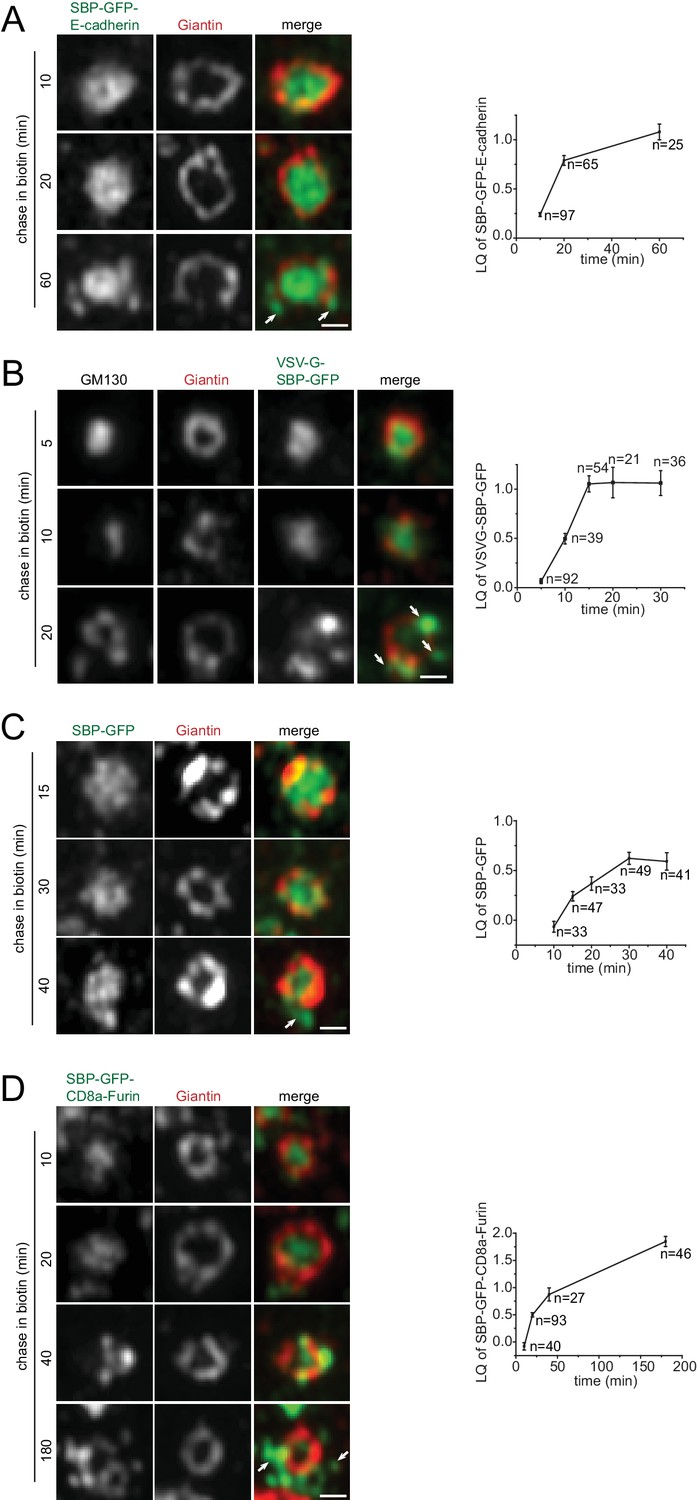
Conventional or small size secretory cargos can localize to the cisternal interior during their intra-Golgi transport.
(A–D) En face view images of E-cadherin, VSVG, secretory GFP and CD8a-Furin during the chase after ER synchronization. Experiments were similar to Figure 5A. Similar to Figure 5B, the right of each panel displays corresponding LQ vs time plot measured from the same experiment. Arrows indicate budding membrane carriers. Scale bar, 500 nm. Error bar, mean ± SEM. n, the number of Golgi mini-stacks used for the calculation.
Figure 5—figure supplement 2
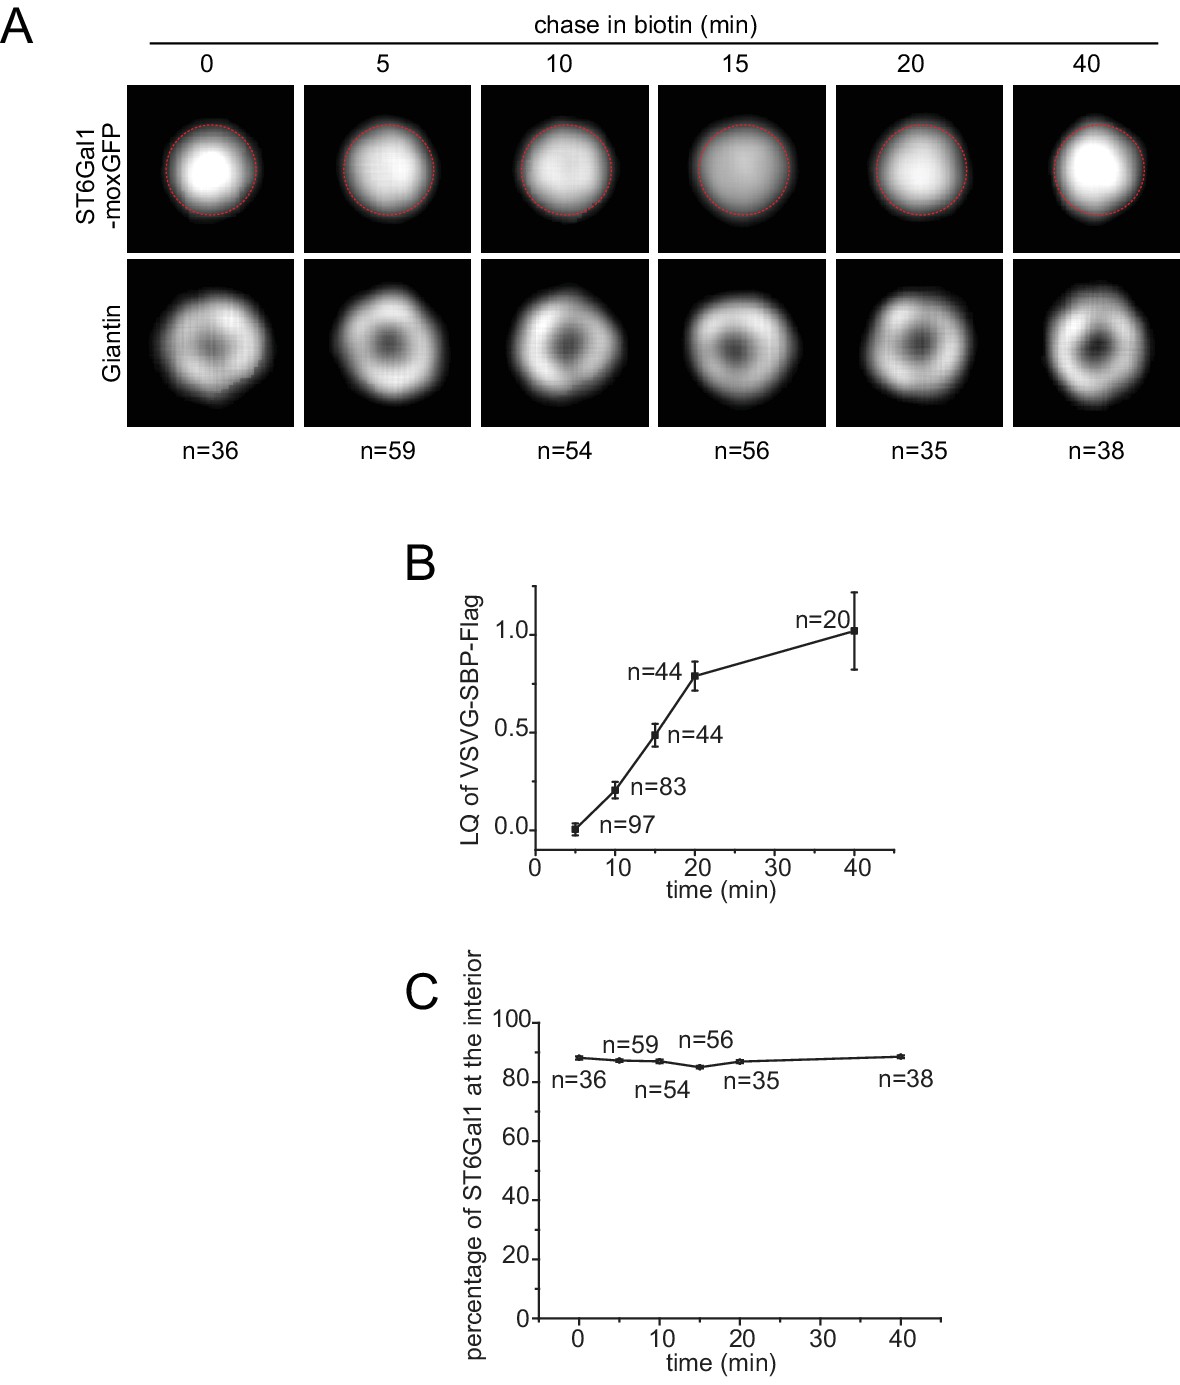
ST6Gal1 mainly localizes to the cisternal interior under VSVG traffic wave.
HeLa cells co-expressing VSVG-SBP-Flag (a RUSH reporter), ST6Gal1-moxGFP and GalT-mCherry were subjected to biotin to chase VSVG along the secretory pathway. At various chase time, cells were fixed, immuno-stained and imaged. (A) En face averaged images of ST6Gal1 and endogenous Giantin during the chase. The dotted red circle indicates the interior region of interest (ROI), which has the radius of ST6Gal1 at steady-state transport (Figure 4J). (B) The plot of VSVG’s LQ vs chase time. VSVG-SBP-Flag and endogenous GM130 were immuno-stained and, in combination with GalT-mCherry, LQs of VSVG were calculated by GLIM to demonstrate the intra-Golgi trafficking status of VSVG. (C) The percentage of interior ST6Gal1 within the interior ROI during the chase of VSVG. Error bar, mean ± SEM. n, the number of Golgi mini-stacks used for the calculation.
Figure 5—figure supplement 3
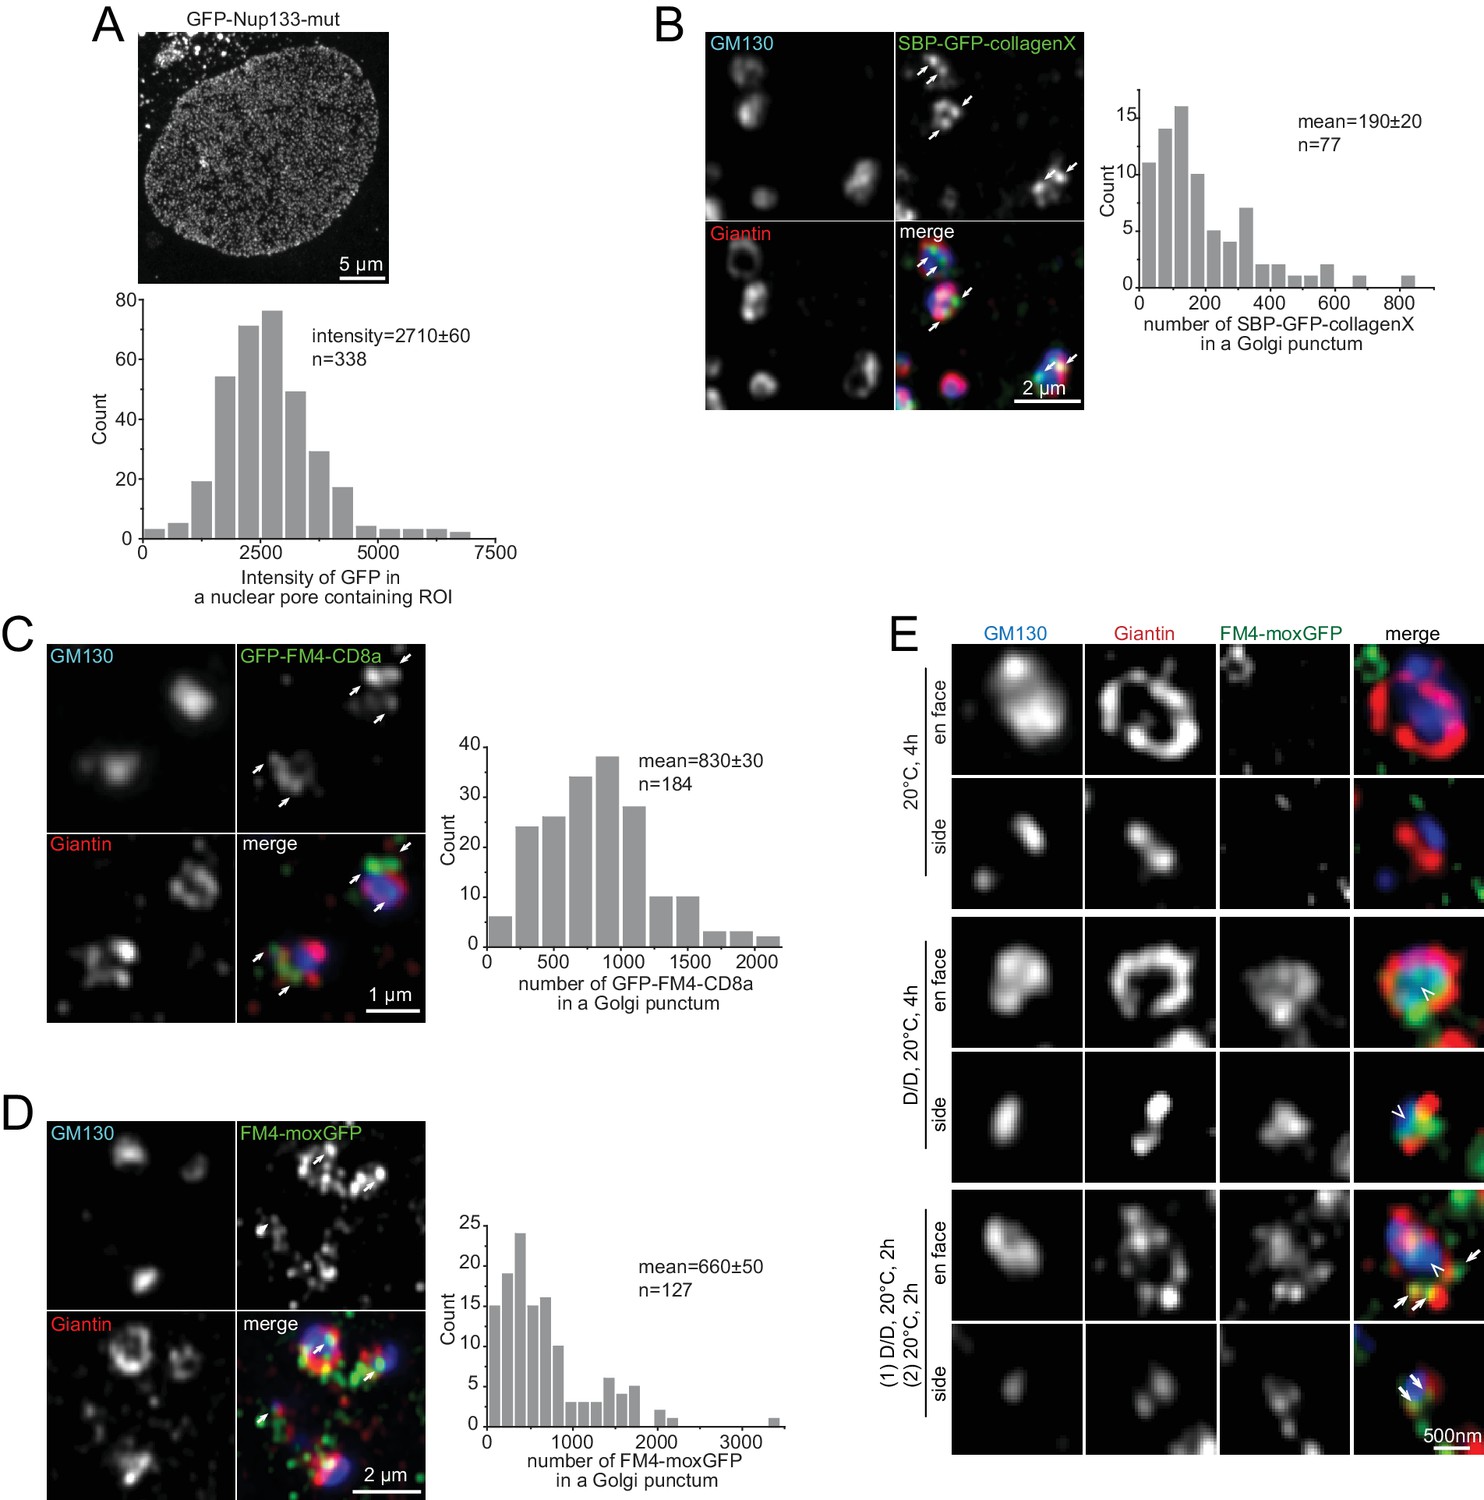
Bulky secretory cargos are restricted to the cisternal rim during their intra-Golgi transport.
(A) The image of GFP-Nup133-mut-substituted nuclear pores and the histogram of the total intensity of a nuclear pore. Cells were depleted of endogenous Nup133 by shRNA and allowed to simultaneously express shRNA-resistant GFP-Nup133-mut. A typical image was shown above and the total intensity of a nuclear pore was plotted in the histogram below. (B–D) Estimating copy numbers of GFP-collagenX, GFP-FM4-CD8a and FM4-moxGFP in a Golgi punctum. Left, the image of typical Golgi puncta; right, the histogram of the copy number in a Golgi punctum. (E) FM4-moxGFP partitions to the cisternal-rim upon aggregation. The organization of these panels is similar to Figure 5G. Scale bars represent 500 nm unless specified otherwise.
Figure 5—video 1
Live-cell imaging showing the interior localization of mCherry-GPI during its transition through the Golgi mini-stack.
This movie corresponds to the boxed region of Figure 5C. The time lapse was acquired every 3 min after the addition of biotin. mCherry-GPI and GFP-Golgin84 are shown in red and green respectively.
Figure 6
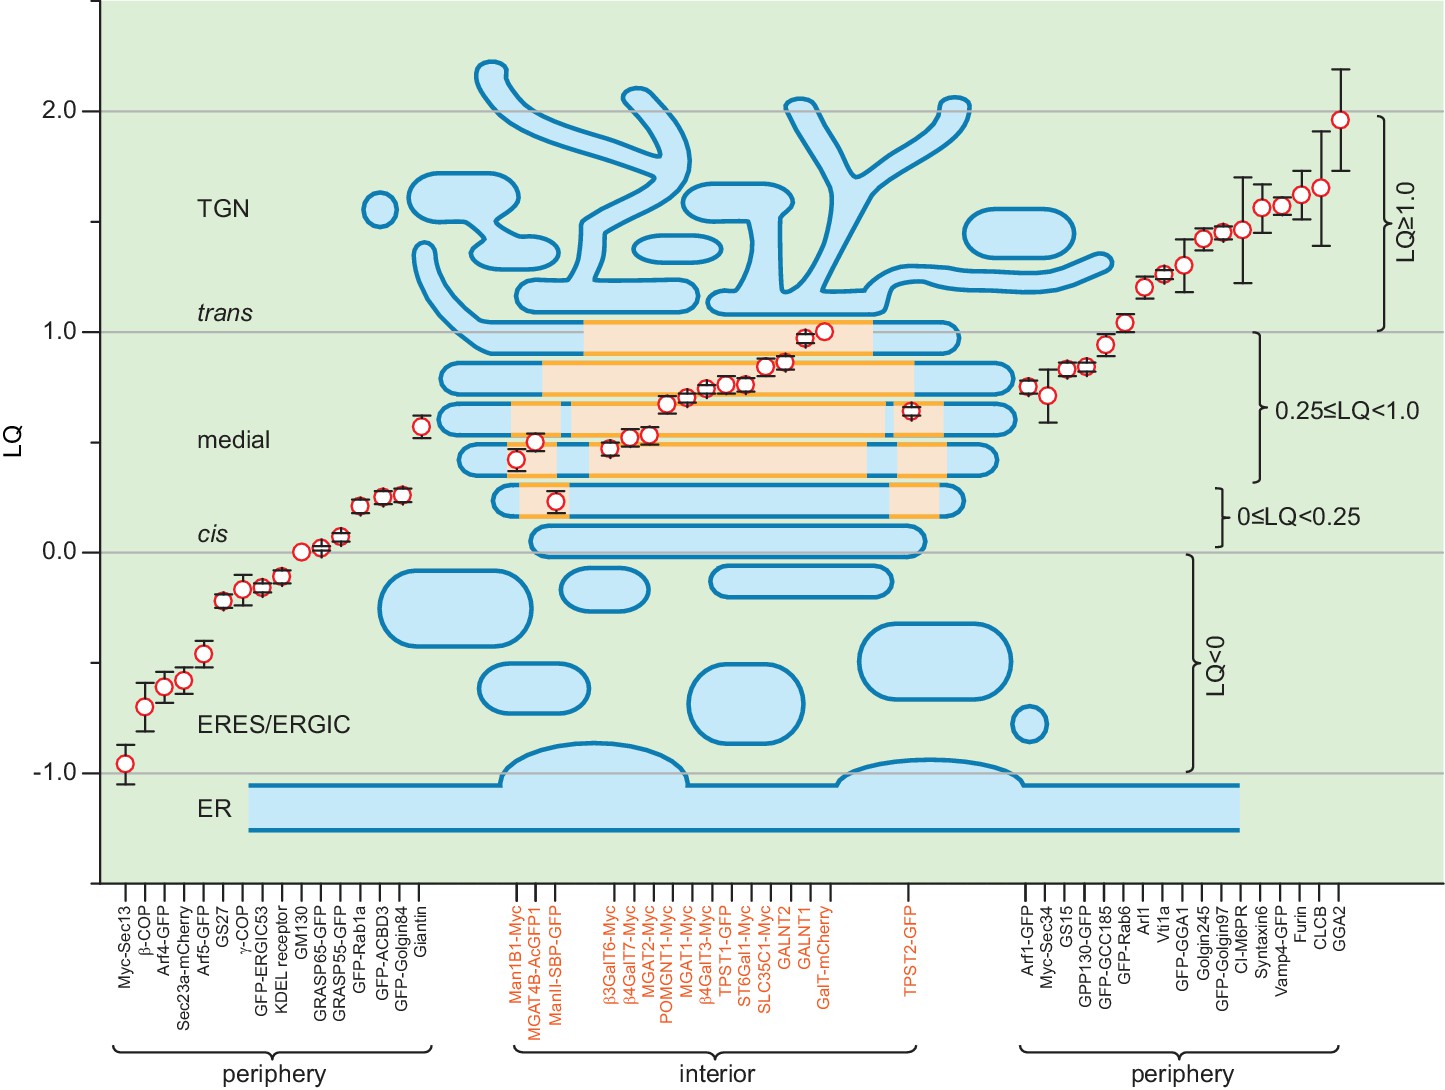
A schematic model summarizing the organization of a Golgi mini-stack.
LQs of various Golgi residents (see Table 1) are overlaid onto a simplified diagram of a Golgi mini-stack together with the ERES and ERGIC. The red circle represents the mean of the LQ with flanking black bars representing the SEM. The cisternal interior, including central disks and inner-rings, is shaded yellow while the periphery of the Golgi mini-stack, including the cisternal rim, is shaded blue. Within the plot, red circles representing Golgi enzymes (labeled orange at the x-axis) are overlaid onto the yellow-shaded interior region, while those of components of the transport machinery (labeled black at the x-axis) are outside the mini-stack to indicate their periphery localization.
Tables
Table 1
List of LQs used in this study.
Please see Table 1-table supplement 1 for official full names of glycosylation enzymes.
| Name | LQ | N | SEM |
|---|---|---|---|
| Myc-Sec13 | −0.96 | 39 | 0.09 |
| β-COP$ | −0.70 | 74 | 0.11 |
| Arf4-GFP | −0.61 | 51 | 0.07 |
| Sec23a-mCherry | −0.58 | 121 | 0.06 |
| Arf5-GFP | −0.46 | 42 | 0.06 |
| GS27*,$ | −0.22 | 101 | 0.03 |
| γ-COP$ | −0.17 | 106 | 0.07 |
| GFP-ERGIC53* | −0.16 | 198 | 0.02 |
| KDEL receptor*, $ | −0.11 | 130 | 0.03 |
| GFP-GM130* | −0.05 | 93 | 0.04 |
| GM130*, $, # | 0.00 | - | - |
| GRASP65-GFP | 0.02 | 198 | 0.01 |
| GRASP55-GFP | 0.07 | 140 | 0.02 |
| GFP-Rab1a | 0.21 | 154 | 0.03 |
| ManII-SBP-GFP | 0.23 | 53 | 0.05 |
| GFP-ACBD3 | 0.25 | 132 | 0.03 |
| GFP-Golgin84* | 0.26 | 108 | 0.03 |
| Man1B1-Myc | 0.42 | 88 | 0.05 |
| β3GalT6-Myc | 0.47 | 97 | 0.03 |
| MGAT4B-AcGFP1 | 0.50 | 23 | 0.04 |
| β4GalT7-Myc | 0.52 | 110 | 0.04 |
| MGAT2-Myc | 0.53 | 136 | 0.04 |
| GS28* | 0.53 | 125 | 0.08 |
| MGAT2-AcGFP1 | 0.56 | 110 | 0.04 |
| Giantin$ | 0.57 | 103 | 0.05 |
| TPST2-GFP* | 0.64 | 154 | 0.02 |
| POMGNT1-Myc | 0.67 | 87 | 0.04 |
| MGAT1-Myc | 0.70 | 141 | 0.02 |
| GPP130-APEX2-GFP | 0.71 | 100 | 0.03 |
| Myc-Sec34 | 0.71 | 27 | 0.12 |
| β4GalT3-Myc | 0.74 | 149 | 0.02 |
| Arf1-GFP | 0.75 | 87 | 0.03 |
| TPST1-GFP* | 0.76 | 111 | 0.04 |
| ST6Gal1-Myc | 0.76 | 154 | 0.03 |
| mScarlet-Giantin-C129 | 0.80 | 161 | 0.01 |
| GS15$ | 0.83 | 150 | 0.03 |
| GPP130-GFP* | 0.84 | 168 | 0.02 |
| SLC35C1-Myc | 0.84 | 85 | 0.04 |
| ST6Gal1-AcGFP1 | 0.85 | 138 | 0.02 |
| GALNT2$ | 0.86 | 107 | 0.03 |
| GFP-GCC185 | 0.94 | 122 | 0.05 |
| GALNT1$ | 0.97 | 90 | 0.02 |
| GalT-mCherry*,# | 1.00 | - | - |
| GFP-Rab6* | 1.04 | 262 | 0.04 |
| Arl1*, $ | 1.20 | 26 | 0.05 |
| Vti1a*, $ | 1.26 | 162 | 0.02 |
| GFP-GGA1 | 1.30 | 33 | 0.12 |
| Golgin245*, $ | 1.42 | 126 | 0.05 |
| GFP-Golgin97* | 1.45 | 161 | 0.03 |
| CI-M6PR*, $ | 1.46 | 42 | 0.24 |
| Syntaxin6*, $ | 1.56 | 84 | 0.11 |
| Vamp4-GFP* | 1.57 | 157 | 0.04 |
| Furin*, $ | 1.62 | 43 | 0.11 |
| CLCB$ | 1.65 | 37 | 0.26 |
| GGA2*, $ | 1.96 | 33 | 0.23 |
-
*,previously published data (Tie et al., 2016b);
$, endogenous protein.
-
#, LQs of GM130 and GalT-mCherry are defined as 0.00 and 1.00 (Tie et al., 2016b).
Key resources table
| Reagent type (species) or resource | Designation | Source or reference | Identifiers | Additional information |
|---|---|---|---|---|
| Cell line (Homo sapiens) | HeLa cell | ATCC | ATCC: CCL-2; RRID:CVCL_0030 | |
| Cell line (Rattus norvegicus) | Normal rat kidney (NRK) fibroblast cell | ATCC | ATCC: CRL-1570; RRID:CVCL_2144 | |
| Antibody | GM130 C-terminus (mouse monoclonal) | BD Biosciences | BD Biosciences: 610822; RRID:AB_398141 | (1:500) |
| Antibody | Golgin 245 (mouse monoclonal) | BD Biosciences | BD Biosciences: 611280; RRID:AB_398808 | (1:100) |
| Antibody | GGA2 (mouse monoclonal) | BD Biosciences | BD Biosciences: 612612; RRID:AB_399892 | (1:200) |
| Antibody | GS15 (mouse monoclonal) | BD Biosciences | BD Biosciences: 610960; RRID:AB_398273 | (1:250) |
| Antibody | GS27 (mouse monoclonal) | BD Biosciences | BD Biosciences: 611034; RRID:AB_398347 | (1:250) |
| Antibody | GS28 (mouse monoclonal) | BD Biosciences | BD Biosciences: 611184; RRID:AB_398718 | (1:250) |
| Antibody | Syntaxin6 (mouse monoclonal) | BD Biosciences | BD Biosciences: 610635; RRID:AB_397965 | (1:250) |
| Antibody | Vti1a (mouse monoclonal) | BD Biosciences | BD Biosciences: 611220; RRID:AB_398752 | (1:500) |
| Antibody | Myc (mouse monoclonal) | Santa cruz biotechnology | Santa cruz: sc-40; RID:AB_627268 | (1:200) |
| Antibody | CLCB (mouse monoclonal) | Santa cruz biotechnology | Santa cruz: sc-376414; RRID:AB_11149726 | (1:200) |
| Antibody | γCOP (mouse monoclonal) | Santa cruz biotechnology | Santa cruz:sc-393977; RRID:AB_2753138 | (1:200) |
| Antibody | Furin (rabbit polyclonal) | Thermo Fisher Scientific | Thermo Fisher Scientific: PA1062; RRID:AB_2105077 | (1:100) |
| Antibody | CI-M6PR (mouse monoclonal) | Thermo Fisher Scientific | Thermo Fisher Scientific: MA1066; RRID:AB_2264554 | (1:200) |
| Antibody | Alexa Fluor 594 conjugated streptavidin | Thermo Fisher Scientific | Thermo Fisher Scientific: S11227; RRID:AB_2313574 | (1:500) |
| Antibody | βCOP (mouse monoclonal) | Sigma-Aldrich | Sigma-Aldrich: G6160; RRID:AB_477023 | (1:200) |
| Antibody | Flag (mouse monoclonal) | Sigma-Aldrich | Sigma-Aldrich: F3165; RRID:AB_259529 | (1:200) |
| Antibody | GM130 N-terminus (rabbit monoclonal) | Abcam | Abcam: ab52649; RRID:AB_880266 | (1:500) |
| Antibody | Giantin N-terminus (rabbit polyclonal) | BioLegend | Biolegend: 924302; RRID:AB_2565451 | (1:1000) |
| Antibody | Giantin C-terminus (rabbit polyclonal) | this paper | (1:500); rabbit polyclonal; against aa3131–3201 | |
| Antibody | KDEL receptor (mouse monoclonal) | Enzo Life Sciences | Enzo Life Sciences: VAA-PT048D; RRID:AB_1083549 | (1:250) |
| Antibody | GALNT1 | Other | (1:10); H Clausen lab (University of Copenhagen) | |
| Antibody | GALNT2 | Other | (1:10); H Clausen lab (University of Copenhagen) | |
| Antibody | Arl1 (rabbit polyclonal) | PMID: 11792819 | (1:100) | |
| Antibody | Golgin97 (rabbit polyclonal) | PMID: 12972563 | (1:1000) | |
| Recombinant DNA reagent | pDMyc-neo-N1 | this paper | See Supplementary file 3 | |
| Recombinant DNA reagent | pDMyc-Neo | PMID: 12972563 | ||
| Recombinant DNA reagent | pGEB | PMID: 11792819 | ||
| Recombinant DNA reagent | pA2E-N1 | PMID: 27369768 | ||
| Recombinant DNA reagent | pmCherry-C2 | this paper | SeeSupplementary file 3 | |
| Recombinant DNA reagent | Streptavidin-His | PMID: 16554831 | RRID:Addgene_20860 | Addgene plasmid #20860 |
| Recombinant DNA reagent | Strep-Ii_VSVG-SBP-EGFP | PMID: 22406856 | RRID:Addgene_65300 | Addgene plasmid #65300 |
| Recombinant DNA reagent | ss-Strep-KDEL_ManII-SBP-GFP | PMID: 22406856 | RRID:Addgene_65252 | Addgene plasmid #65252 |
| Recombinant DNA reagent | ss-Strep-KDEL_ss-SBP-mCherry-GPI | PMID: 22406856 | RRID:Addgene_65295 | Addgene plasmid #65295 |
| Recombinant DNA reagent | TPST1-GFP | PMID: 18522538 | RRID:Addgene_66617 | Addgene plasmid #66617 |
| Recombinant DNA reagent | TPST2-GFP | PMID: 18522538 | RRID:Addgene_66618 | Addgene plasmid #66618 |
| Recombinant DNA reagent | pmScarlet-Giantin-C129 | PMID: 27869816 | RRID:Addgene_85048 | Addgene plasmid #85048 |
| Recombinant DNA reagent | li-Strep_ss-SBP-GFP | this paper | RUSH reporter of soluble SBP-GFP | |
| Recombinant DNA reagent | Strep-Ii_VSVG-SBP-Flag | this paper | RUSH reporter of VSVG-SBP-Flag | |
| Recombinant DNA reagent | ss-Strep-KDEL_ss-SBP-GFP-E-cadherin | PMID: 22406856 | RUSH reporter of SBP-GFP-E-cadherin; a gift from F. Perez lab (Institut Curie) | |
| Recombinant DNA reagent | ss-Strep-KDEL_ss-SBP-GFP-CD8a-Furin | PMID: 26764092 | RUSH reporter of SBP-GFP-CD8a-Furin | |
| Recombinant DNA reagent | ss-Strep-KDEL_ss-SBP-GFP-CD59 | PMID: 26764092 | RUSH reporter of SBP-GFP-CD59 | |
| Recombinant DNA reagent | ss-Strep-KDEL_ss-SBP-GFP-collagenX | Other | RUSH reporter of SBP-GFP-collagenX; a gift from F Perez lab (Institut Curie) | |
| Recombinant DNA reagent | Rab1a-GFP | this paper | SeeSupplementary file 3 | |
| Recombinant DNA reagent | Furin-GFP | this paper | See Supplementary file 3 | |
| Recombinant DNA reagent | Fuin-Myc | this paper | See Supplementary file 3 | |
| Recombinant DNA reagent | GFP-GCC185 | this paper | SeeSupplementary file 3 | |
| Recombinant DNA reagent | GFP-GCC185-mCherry | this paper | SeeSupplementary file 3 | |
| Recombinant DNA reagent | GFP-ACBD3 | this paper | SeeSupplementary file 3 | |
| Recombinant DNA reagent | GFP-Rab6 | this paper | SeeSupplementary file 3 | |
| Recombinant DNA reagent | mCherry-Golgin84 | this paper | SeeSupplementary file 3 | |
| Recombinant DNA reagent | GFP-GGA1 | this paper | SeeSupplementary file 3 | |
| Recombinant DNA reagent | mCherry-GM130 | this paper | SeeSupplementary file 3 | |
| Recombinant DNA reagent | Arf1-GFP | PMID: 16890159 | A gift from FJM van Kuppeveld lab (Utrecht University) | |
| Recombinant DNA reagent | Arf4-GFP | Other | A gift from FJM van Kuppeveld lab (Utrecht University) | |
| Recombinant DNA reagent | Arf5-GFP | Other | A gift from FJM van Kuppeveld lab (Utrecht University) | |
| Recombinant DNA reagent | GFP-ERGIC53 | PMID: 15632110 | A gift from H Hauri lab (University of Basel) | |
| Recombinant DNA reagent | GFP-GM130 | PMID: 11781572 | A gift from M De Matties lab (Telethon Institute of Genetics and Medicine, Italy) | |
| Recombinant DNA reagent | GFP-Golgin84 | PMID: 12538640 | A gift from M Lowe lab (University of Manchester) | |
| Recombinant DNA reagent | GFP-Golgin97 | PMID: 11792819 | A gift from W Hong lab (Institute of Molecular and Cell Biolgoy, Singapore) | |
| Recombinant DNA reagent | GPP130-GFP | PMID: 9201717 | A gift from A Linstedt lab (Carnegie Mellon University) | |
| Recombinant DNA reagent | GRASP55-GFP | Other | A gift from Y Zhuang lab (University of Michigan) | |
| Recombinant DNA reagent | GRASP65-GFP | Other | A gift from Y Zhuang lab (University of Michigan) | |
| Recombinant DNA reagent | DMyc-GCC185 | Other | A gift from W Hong lab (Institute of Molecular and Cell Biolgoy, Singapore) | |
| Recombinant DNA reagent | Sec23a-mCherry | Other | A gift from W Hong lab (Institute of Molecular and Cell Biolgoy, Singapore) | |
| Recombinant DNA reagent | Sec31a-GFP | PMID: 10788476 | A gift from W Hong lab (Institute of Molecular and Cell Biolgoy, Singapore) | |
| Recombinant DNA reagent | Vamp4-GFP | PMID: 17327277 | A gift from W Hong lab (Institute of Molecular and Cell Biolgoy, Singapore) | |
| Recombinant DNA reagent | Myc-Sec34 | PMID: 11929878 | A gift from W Hong lab (Institute of Molecular and Cell Biolgoy, Singapore) | |
| Recombinant DNA reagent | Myc-Sec13 | PMID: 22609279 | A gift from W Hong lab (Institute of Molecular and Cell Biolgoy, Singapore) | |
| Recombinant DNA reagent | MGAT1-AcGFP1 | this paper | See Supplementary file 3 | |
| Recombinant DNA reagent | MGAT2-AcGFP1 | this paper | See Supplementary file 3 | |
| Recombinant DNA reagent | MGAT4B-AcGFP1 | this paper | See Supplementary file 3 | |
| Recombinant DNA reagent | ST6Gal1-AcGFP1 | this paper | See Supplementary file 3 | |
| Recombinant DNA reagent | Man1B1-Myc | this paper | See Supplementary file 3 | |
| Recombinant DNA reagent | MGAT1-Myc | this paper | See Supplementary file 3 | |
| Recombinant DNA reagent | MGAT2-Myc | this paper | See Supplementary file 3 | |
| Recombinant DNA reagent | ST6Gal1-Myc | this paper | See Supplementary file 3 | |
| Recombinant DNA reagent | β4GalT3-Myc | this paper | See Supplementary file 3 | |
| Recombinant DNA reagent | GalT-mCherry | PMID: 26764092 | ||
| Recombinant DNA reagent | SLC35C1-Myc | OriGene Technologies Inc. | Cat. No.: RC200101 | |
| Recombinant DNA reagent | β3GalT6-Myc | OriGene Technologies Inc. | Cat. No.: MR204731 | |
| Recombinant DNA reagent | β4GalT7-Myc | OriGene Technologies Inc. | Cat. No.: RC200258 | |
| Recombinant DNA reagent | POMGNT1-Myc | OriGene Technologies Inc. | Cat. No.: RC200176 | |
| Recombinant DNA reagent | FM4-moxGFP | this paper | See Supplementary file 3 | |
| Recombinant DNA reagent | GFP-FM4-CD8a | PMID: 23755362 | A gift from James Rothman lab (Yale University) | |
| Recombinant DNA reagent | GPP130-APEX2-GFP | this paper | See Supplementary file 3 | |
| Recombinant DNA reagent | MGAT2-APEX2-GFP | this paper | See Supplementary file 3 | |
| Recombinant DNA reagent | His-Giantin(3131–3201) | this paper | See Supplementary file 3 | |
| Recombinant DNA reagent | GST-Giantin(3131–3235) | this paper | See Supplementary file 3 | |
| Recombinant DNA reagent | GFP-Nup133-mut | PMID: 27613095 | See Supplementary file 3 | |
| Recombinant DNA reagent | shNup133-1 | PMID: 27613095 | See Supplementary file 3 | |
| Commercial assay or kit | APEX Alexa Fluor 488 Antibody Labeling Kit | Thermo Fisher Scientific | Invitrogen: A10475 | |
| Commercial assay or kit | APEX Alexa Fluor 488 Antibody Labeling Kit | Thermo Fisher Scientific | Invitrogen A10468 | |
| Chemical compound, drug | biotin | IBA | IBA: 21016002 | 40 μM |
| Chemical compound, drug | biotin phenol | Iris Biotech GmbH | Iris Biotech GmbH: LS3500 | 500 μM |
| Chemical compound, drug | nocodazole | Merck | Merck: 487928 | 33 μM |
| Chemical compound, drug | D/D solubilizer | Clontech | Clontech: 635054 | 1 mM |
| Software, algorithm | Fiji | PMID: 22743772 | https://fiji.sc/ | |
| Software, algorithm | Calculation of the LQ | PMID: 26764092; PMID: 28829416 | ||
| Software, algorithm | Gyradius and intensity normalization.ijm | this paper | To normalize diameters and intensities of en face Golgi mini-stacks | |
| Software, algorithm | Golgi mini-stack alignment.ijm | this paper | To align normalized en face Golgi mini-stacks | |
| Software, algorithm | Radial mean intensity profile.ijm | this paper | To measure radial mean intensity of en face averaged Golgi mini-stacks |
Additional files
-
Source code 1
Fiji macro ‘Gyradius and intensity normalization.ijm’.
- https://doi.org/10.7554/eLife.41301.021
-
Source code 2
Fiji macro ‘Golgi mini-stack alignment.ijm’.
- https://doi.org/10.7554/eLife.41301.022
-
Source code 3
Fiji macro ‘Radial mean intensity profile.ijm’.
- https://doi.org/10.7554/eLife.41301.023
-
Supplementary file 1
Mouse Genome Informatics (MGI) and Human Genome Organization Gene Nomenclature Committee (HGNC) official full names of glycosylation enzymes used in this study.
The official full name of ManII is from MGI while the rest are from HGNC. Except GalT and ManII, all names are official symbols.
- https://doi.org/10.7554/eLife.41301.024
-
Supplementary file 2
Review of previous EM literature that directly addressed lateral localizations of Golgi residents and secretory cargos in comparison with this study.
- https://doi.org/10.7554/eLife.41301.025
-
Supplementary file 3
The source and cloning method of DNA plasmids used in this study.
- https://doi.org/10.7554/eLife.41301.026
-
Supplementary file 4
Protocol for en face averaging and radial mean intensity profile.
- https://doi.org/10.7554/eLife.41301.027
-
Transparent reporting form
- https://doi.org/10.7554/eLife.41301.028
Download links
A two-part list of links to download the article, or parts of the article, in various formats.
Downloads (link to download the article as PDF)
Open citations (links to open the citations from this article in various online reference manager services)
Cite this article (links to download the citations from this article in formats compatible with various reference manager tools)
The spatial separation of processing and transport functions to the interior and periphery of the Golgi stack
eLife 7:e41301.
https://doi.org/10.7554/eLife.41301


